MIRA
INFORM REPORT
|
Report Date : |
24.09.2014 |
IDENTIFICATION DETAILS
|
Name : |
M. MARCUS LIMITED |
|
|
|
|
Registered Office : |
KLSA KLACO House, |
|
|
|
|
Country : |
|
|
|
|
|
Financials (as on) : |
31.03.2013 |
|
|
|
|
Date of Incorporation : |
01.04.1940 |
|
|
|
|
Com. Reg. No.: |
00360234 |
|
|
|
|
Legal Form : |
Private Limited With Share Capital |
|
|
|
|
Line of Business : |
· Retail sale of hardware, Paints and glass in specialised store ·
Dealers in hardware and electrical components |
|
|
|
|
No. of Employees : |
Not Available |
RATING & COMMENTS
|
MIRA’s Rating : |
B |
|
RATING |
STATUS |
PROPOSED CREDIT LINE |
|
|
26-40 |
B |
Capability to overcome financial difficulties seems comparatively
below average. |
Small |
|
Status : |
Moderate |
|
Payment Behaviour : |
Slow but correct |
|
Litigation : |
Clear |
NOTES :
Any query related to this report can be made
on e-mail : infodept@mirainform.com
while quoting report number, name and date.
ECGC Country Risk Classification List – June 1, 2014
|
Country Name |
Previous Rating (31.03.2014) |
Current Rating (01.06.2014) |
|
|
A1 |
A1 |
|
Risk Category |
ECGC
Classification |
|
Insignificant |
A1 |
|
Low |
A2 |
|
Moderate |
B1 |
|
High |
B2 |
|
Very High |
C1 |
|
Restricted |
C2 |
|
Off-credit |
D |
The
|
Source
: CIA |
REGISTERED NAME & COMPANY
SUMMARY
·
Company Name:
·
M. MARCUS LIMITED
·
Company No:
·
00360234
·
Company Status:
·
Active - Accounts Filed
·
Registered
Address:
·
KLSA KLACO HOUSE 28-30
|
Company Name |
M. MARCUS LIMITED |
Company Number |
00360234 |
|
Registered Address |
KLSA KLACO House EC1 M 4DN |
Trading Address |
KLSA KLACO House EC1 M 4DN |
|
|
|
|
|
|
|
|
|
|
|
|
|
|
|
|
|
|
|
|
|
Website Address |
www.m-marcus.com |
|
|
|
Telephone Number |
- |
|
|
|
TPS |
- |
|
|
|
Incorporation Date |
01.04.1940 |
Company Status |
Active - Accounts Filed |
|
Previous Name |
|
Type |
Private limited with Share Capital |
|
Date of Change |
- |
Filing Date of Accounts |
23.12.2013 |
|
|
|
Share Capital |
£ 100,000 |
|
SIC03 |
|
Currency |
GBP |
|
SIC03 Description |
Retail sale of hardware, Paints and glass in specialised store |
||
|
SIC07 |
47520 |
||
|
SIC07 Description |
Dealers in hardware and electrical components |
||
|
Principal Activity |
|
||
DIRECTORS/MANAGEMENT
|
Total Current Directors |
3 |
|
Total Current Secretaries |
1 |
|
Total Previous Directors /
Company Secretaries |
4 |
Current
Directors
|
Name |
Pankaj Karnani |
Date of Birth |
15/02/1960 |
|
Officers Title |
Mr |
Nationality |
British |
|
Present Appointments |
7 |
Function |
Director |
|
Appointment Date |
15/01/1992 |
|
|
|
Address |
|
||
|
Name |
Kanta Karnani |
Date of Birth |
27/12/1933 |
|
Officers Title |
Mrs |
Nationality |
Indian |
|
Present Appointments |
2 |
Function |
Director |
|
Appointment Date |
15/01/1992 |
|
|
|
Address |
|
||
|
Name |
Narendra Karnani |
Date of Birth |
05/09/1955 |
|
Officers Title |
Mr |
Nationality |
British |
|
Present Appointments |
3 |
Function |
Director |
|
Appointment Date |
15/01/1992 |
|
|
|
Address |
|
||
Current Company Secretary
|
Name |
Pankaj
Karnani |
Date
of Birth |
15/02/1960 |
|
Officers
Title |
Mr |
Nationality |
British |
|
Present
Appointments |
7 |
Function |
Company
Secretary |
|
Appointment
Date |
28/01/1995 |
|
|
|
Address |
|
||
Previous Director/Company
Secretaries
|
Name |
Current
Directorships |
Previous
Directorships |
|
Viswanath
Karnani |
6 |
1 |
|
Robert
Montag |
0 |
2 |
|
William
Leslie Garrett |
0 |
2 |
|
William
Leslie Garrett |
0 |
2 |
NEGATIVE INFORMATION
Mortgage Summary
· Total Mortgage
· 3
· Outstanding
· 3
· Satisfied
· 0
CCJ
|
Total Number of Exact CCJs - |
0 |
Total Value of Exact CCJs - |
|
|
Total Number of Possible CCJs - |
0 |
Total Value of Possible CCJs - |
|
|
Total Number of Satisfied CCJs - |
0 |
Total Value of Satisfied CCJs - |
|
|
Total Number of Writs - |
- |
|
|
Exact
CCJ Details
|
No CCJs found |
Possible
CCJs Details
|
There are no possible CCJ
details |
Writ
Details
|
No writs found |
Mortgage
Details
|
Mortgage Type: |
DEED OF CHARGE OVER CREDIT
BALANCES |
||
|
Date Charge Created: |
14/04/11 |
|
|
|
Date Charge Registered: |
19/04/11 |
|
|
|
Date Charge Satisfied: |
- |
|
|
|
Status: |
OUTSTANDING |
|
|
|
Person(s) Entitled: |
BARCLAYS BANK PLC |
||
|
Amount Secured: |
ALL MONIES DUE OR TO BECOME DUE
FROM THE COMPANY TO THE CHARGEE ON ANY ACCOUNT WHATSOEVER |
||
|
Details: |
THE CHARGE CREATES A FIXED
CHARGE OVER ALL THE DEPOSIT(S) REFERRED TO IN THE SCHEDULE TO THE FORM MG01
(INCLUDING ALL OR ANY PART OF THE MONEY PAYABLE PURSUANTTO SUCH DEPOSIT(S)
& THE DEBTS REPRESENTED THEREBY) TOGETHER WITH ALL INTEREST FROM TIME TO
TIME ACCRUING THEREON. IT ALSO CREATES AN ASSIGNMENT BY THE CHARGORFOR THE
PURPOSES OF & TO GIVE EFFECT TOTHE SECURITY OVER THE RIGHT OF THE CHARGORTO
REQUIRE REPAYMENT OF SUCH DEPOSIT(S) & INTEREST THEREON BARCLAYS BANK
PLCRE M. MARCUS LIMITED BUSINESS PREMIUM ACCOUNT, ACCOUNT NUMBER 83284301 |
||
|
Mortgage Type: |
GUARANTEE & DEBENTURE |
||
|
Date Charge Created: |
26/10/79 |
|
|
|
Date Charge Registered: |
05/11/79 |
|
|
|
Date Charge Satisfied: |
- |
|
|
|
Status: |
OUTSTANDING |
|
|
|
Person(s) Entitled: |
BARCLAYS BANK PLC |
||
|
Amount Secured: |
ALL MONIES DUE OR TO BECOME DUE FROM
THE COMPANY AND/OR ALL OR ANY OF THE OTHERCOMPANIES NAMED THEREIN TO THE
CHARGEE ON ANY ACCOUNT WHATSOEVER |
||
|
Details: |
FIXED AND FLOATING CHARGES
UNDERTAKING AND ALL PROPERTY AND ASSETS PRESENT AND FUTURE INCLUDING GOODWILL
BOOKDEBTS UNCALLED CAPITAL WITH ALL BUILDINGS, FIXTURES (INC TRADE FIXTURES)
FIXED PLANT & MACHINERY |
||
|
Mortgage Type: |
LEGAL CHARGE |
||
|
Date Charge Created: |
12/03/75 |
|
|
|
Date Charge Registered: |
19/03/75 |
|
|
|
Date Charge Satisfied: |
- |
|
|
|
Status: |
OUTSTANDING |
|
|
|
Person(s) Entitled: |
BARCLAYS BANK PLC |
||
|
Amount Secured: |
ALL MONIES DUE OR TO BECOME DUE
FROM THE COMPANY TO THE CHARGEE ON ANY ACCOUNT WHATSOEVER |
||
|
Details: |
63 AND 65 HACKNEY ROAD, |
||
SHARE & SHARE CAPITAL
INFORMATION
Top 20 Shareholders
|
Name |
Currency |
Share
Count |
Share
Type |
Nominal
Value |
%
of Total Share Count |
|
MR
NARENDRA KARNANI |
GBP |
38,381 |
ORDINARY
|
1 |
38.38 |
|
MR
PANKAJ KARNANI |
GBP |
38,381 |
ORDINARY
|
1 |
38.38 |
|
MRS
KANTA KARNANI |
GBP |
13,000 |
ORDINARY
|
1 |
13 |
|
MRS
RICHA KARNANI |
GBP |
5,119 |
ORDINARY
|
1 |
5.12 |
|
MRS
HEMLATA KARNANI |
GBP |
5,119 |
ORDINARY
|
1 |
5.12 |
PAYMENT INFORMATION
Trade Debtors / Bad Debt Summary
· Total Number of Documented Trade
· 2
· Total Value of Documented Trade
· £5,362
Trade Payment
Information
|
Average Invoice Value |
475.30 |
|
Invoices available |
178 |
|
Paid |
173 |
|
Outstanding |
5 |
Trade Payment Data is information that we collect from
selected third party partners who send us information about their whole sales
ledger.
Creditor
Details
|
|
Total Number |
Total Value |
|
Trade Creditors |
0 |
- |
|
No Creditor Data |
Trade
Debtors / Bad Debt Detail
|
|
Total Number
of Documented Trade |
Total Value
of Documented Trade |
|
Trade Debtors |
2 |
£5,362 |
|
Company Name |
Amount |
Statement Date |
|
Electrical Contracting Supplies
Limited |
£4,759 |
28/03/2013 |
|
Exeter Joinery Limited |
£603 |
20/02/2013 |
|
Average Invoice Value |
£475.30 |
|
Invoices available |
178 |
|
Paid |
173 |
|
Outstanding |
5 |
|
Trade Payment Data is
information that we collect from selected third party partners who send us information
about their whole sales ledger. |
|
|
Within Terms |
0-30 Days |
31-60 Days |
61-90 Days |
91+ Days |
|
Paid |
75 |
65 |
24 |
8 |
1 |
|
Outstanding |
1 |
1 |
0 |
0 |
3 |
GROUP STRUCTURE & AFFILIATED
COMPANIES
Statistics
|
Group
|
- |
|
Linkages
|
0
companies |
|
Countries
|
In
0 countries |
Summary
|
Holding
Company |
- |
|
Ownership
Status |
|
|
Ultimate
Holding Company |
- |
Group structure
|
FINANCIAL INFORMATION
Profit & Loss
|
|
Date
Of Accounts |
31/03/13 |
(%) |
31/03/12 |
(%) |
31/03/11 |
(%) |
31/03/10 |
(%) |
31/03/09 |
|
|
Weeks |
52 |
(%) |
52 |
(%) |
52 |
(%) |
52 |
(%) |
52 |
|
|
Currency |
GBP |
(%) |
GBP |
(%) |
GBP |
(%) |
GBP |
(%) |
GBP |
|
|
Consolidated
A/cs |
N |
(%) |
N |
(%) |
N |
(%) |
N |
(%) |
N |
|
|
Turnover |
£9,201,432 |
0.1% |
£9,191,834 |
2.5% |
£8,963,428 |
-19.6% |
£11,147,978 |
643.1% |
£1,500,239 |
|
|
Export |
- |
- |
- |
- |
- |
- |
- |
- |
- |
|
|
Cost
of Sales |
- |
- |
- |
- |
- |
- |
- |
- |
- |
|
|
Gross
Profit |
- |
- |
- |
- |
- |
- |
- |
- |
- |
|
|
Wages
& Salaries |
£2,760,269 |
62.5% |
£1,699,064 |
-6.6% |
£1,819,188 |
-9.8% |
£2,016,731 |
-67.4% |
£6,184,282 |
|
|
Directors
Emoluments |
£988,364 |
264.1% |
£271,464 |
68.2% |
£161,359 |
-43.9% |
£287,811 |
-92.1% |
£3,625,000 |
|
|
Operating
Profit |
-£158,257 |
-114.3% |
£1,104,050 |
28.9% |
£856,381 |
-43.1% |
£1,504,521 |
178.7% |
-£1,912,088 |
|
|
Depreciation |
£97,833 |
2.9% |
£95,113 |
-2.1% |
£97,116 |
1.7% |
£95,502 |
4.1% |
£91,737 |
|
|
Audit
Fees |
- |
- |
- |
- |
- |
- |
£27,500 |
- |
- |
|
|
Interest
Payments |
£5,106 |
229.2% |
£1,551 |
-89.6% |
£14,886 |
-89.5% |
£141,544 |
999.9% |
£4,397 |
|
|
Pre
Tax Profit |
£48,520 |
-96.2% |
£1,291,064 |
27.3% |
£1,014,280 |
-30.9% |
£1,468,487 |
193% |
-£1,579,407 |
|
|
Taxation |
-£31,081 |
91.1% |
-£348,050 |
-13.1% |
-£307,862 |
36.7% |
-£486,420 |
-200.3% |
£484,771 |
|
|
Profit
After Tax |
£17,439 |
-98.2% |
£943,014 |
33.5% |
£706,418 |
-28.1% |
£982,067 |
189.7% |
-£1,094,636 |
|
|
Dividends
Payable |
- |
- |
- |
- |
- |
-100% |
£1,000,000 |
- |
- |
|
|
Retained
Profit |
£17,439 |
-98.2% |
£943,014 |
33.5% |
£706,418 |
999.9% |
-£17,933 |
98.4% |
-£1,094,636 |
Balance Sheet
|
|
Date
Of Accounts |
31/03/13 |
(%) |
31/03/12 |
(%) |
31/03/11 |
(%) |
31/03/10 |
(%) |
31/03/09 |
|
|
Tangible
Assets |
£1,553,636 |
-6.5% |
£1,661,228 |
-10.5% |
£1,856,467 |
41.8% |
£1,309,043 |
-16.3% |
£1,564,428 |
|
|
Intangible
Assets |
0 |
- |
0 |
- |
0 |
- |
0 |
- |
0 |
|
|
Total
Fixed Assets |
£1,553,636 |
-6.5% |
£1,661,228 |
-10.5% |
£1,856,467 |
41.8% |
£1,309,043 |
-16.3% |
£1,564,428 |
|
|
Stock |
£2,278,760 |
4.4% |
£2,182,235 |
-0.3% |
£2,187,756 |
87.1% |
£1,169,584 |
-29% |
£1,646,478 |
|
|
Trade
Debtors |
£1,797,919 |
-27.2% |
£2,468,848 |
-5% |
£2,600,016 |
-24.2% |
£3,429,070 |
39.6% |
£2,455,986 |
|
|
Cash |
£7,560,916 |
20.5% |
£6,273,274 |
17.6% |
£5,332,486 |
-15.5% |
£6,307,586 |
-37.8% |
£10,138,351 |
|
|
Other
Debtors |
£448,031 |
121.1% |
£202,620 |
-67.2% |
£617,713 |
12.3% |
£550,173 |
-31.3% |
£801,389 |
|
|
Miscellaneous
Current Assets |
0 |
- |
0 |
- |
0 |
- |
0 |
- |
0 |
|
|
Total
Current Assets |
£12,085,626 |
8.6% |
£11,126,977 |
3.6% |
£10,737,971 |
-6.3% |
£11,456,413 |
-23.8% |
£15,042,204 |
|
|
Trade
Creditors |
£425,208 |
-7.7% |
£460,518 |
-19.4% |
£571,081 |
17.9% |
£484,306 |
-6.7% |
£519,180 |
|
|
Bank
Loans & Overdrafts |
£519,947 |
167.5% |
£194,397 |
-38.5% |
£315,879 |
-31.1% |
£458,236 |
-74.5% |
£1,799,775 |
|
|
Other
Short Term Finance |
0 |
- |
0 |
-100% |
£130,000 |
-79.8% |
£643,975 |
- |
0 |
|
|
Miscellaneous
Current Liabilities |
£1,301,778 |
71.6% |
£758,400 |
-33.8% |
£1,145,602 |
-21.2% |
£1,453,481 |
-68% |
£4,544,286 |
|
|
Total
Current Liabilities |
£2,246,933 |
59% |
£1,413,315 |
-34.6% |
£2,162,562 |
-28.9% |
£3,039,998 |
-55.7% |
£6,863,241 |
|
|
Bank
Loans & Overdrafts and LTL |
£519,947 |
167.5% |
£194,397 |
-38.5% |
£315,879 |
-31.1% |
£458,236 |
-74.5% |
£1,799,775 |
|
|
Other
Long Term Finance |
0 |
- |
0 |
- |
0 |
- |
0 |
- |
0 |
|
|
Total
Long Term Liabilities |
0 |
- |
0 |
- |
0 |
- |
0 |
- |
0 |
Capital & Reserves
|
|
Date
Of Accounts |
31/03/13 |
(%) |
31/03/12 |
(%) |
31/03/11 |
(%) |
31/03/10 |
(%) |
31/03/09 |
|
|
Called
Up Share Capital |
£100,000 |
- |
£100,000 |
- |
£100,000 |
- |
£100,000 |
- |
£100,000 |
|
|
P
& L Account Reserve |
£11,292,329 |
0.2% |
£11,274,890 |
9.1% |
£10,331,876 |
7.3% |
£9,625,458 |
-0.2% |
£9,643,391 |
|
|
Revaluation
Reserve |
- |
- |
- |
- |
- |
- |
- |
- |
- |
|
|
Sundry
Reserves |
- |
- |
- |
- |
- |
- |
- |
- |
- |
|
|
Shareholder
Funds |
£11,392,329 |
0.2% |
£11,374,890 |
9% |
£10,431,876 |
7.3% |
£9,725,458 |
-0.2% |
£9,743,391 |
Other Financial Items
|
|
Date
Of Accounts |
31/03/13 |
(%) |
31/03/12 |
(%) |
31/03/11 |
(%) |
31/03/10 |
(%) |
31/03/09 |
|
|
Net
Worth |
£11,392,329 |
0.2% |
£11,374,890 |
9% |
£10,431,876 |
7.3% |
£9,725,458 |
-0.2% |
£9,743,391 |
|
|
Working
Capital |
£9,838,693 |
1.3% |
£9,713,662 |
13.3% |
£8,575,409 |
1.9% |
£8,416,415 |
2.9% |
£8,178,963 |
|
|
Total
Assets |
£13,639,262 |
6.7% |
£12,788,205 |
1.5% |
£12,594,438 |
-1.3% |
£12,765,456 |
-23.1% |
£16,606,632 |
|
|
Total
Liabilities |
£2,246,933 |
59% |
£1,413,315 |
-34.6% |
£2,162,562 |
-28.9% |
£3,039,998 |
-55.7% |
£6,863,241 |
|
|
Net
Assets |
£11,392,329 |
0.2% |
£11,374,890 |
9% |
£10,431,876 |
7.3% |
£9,725,458 |
-0.2% |
£9,743,391 |
Cash Flow
|
|
Date
Of Accounts |
31/03/13 |
(%) |
31/03/12 |
(%) |
31/03/11 |
(%) |
31/03/10 |
(%) |
31/03/09 |
|
|
Net
Cashflow from Operations |
£1,293,318 |
48% |
£874,000 |
294.2% |
-£450,069 |
74.8% |
-£1,784,311 |
-197.2% |
£1,836,540 |
|
|
Net
Cashflow before Financing |
£962,092 |
-9.4% |
£1,062,270 |
227.6% |
-£832,743 |
66.5% |
-£2,489,226 |
-237.8% |
£1,806,454 |
|
|
Net
Cashflow from Financing |
- |
- |
- |
- |
- |
- |
- |
- |
- |
|
|
Increase
in Cash |
£962,092 |
-9.4% |
£1,062,270 |
227.6% |
-£832,743 |
66.5% |
-£2,489,226 |
-237.8% |
£1,806,454 |
Miscellaneous
|
|
Date
Of Accounts |
31/03/13 |
(%) |
31/03/12 |
(%) |
31/03/11 |
(%) |
31/03/10 |
(%) |
31/03/09 |
|
|
Contingent
Liability |
NO |
- |
NO |
- |
NO |
- |
NO |
- |
NO |
|
|
Capital
Employed |
£11,392,329 |
0.2% |
£11,374,890 |
9% |
£10,431,876 |
7.3% |
£9,725,458 |
-0.2% |
£9,743,391 |
|
|
Number
of Employees |
78 |
1.3% |
77 |
-3.8% |
80 |
2.6% |
78 |
-25% |
104 |
|
|
Auditors |
KLSA
LLP |
||||||||
|
|
Auditor
Comments |
The
audit report contains no adverse comments |
||||||||
|
|
Bankers |
ABBEY
NATIONAL PLC |
||||||||
|
|
Bank
Branch Code |
09-06-70 |
||||||||
Ratios
|
|
Date
Of Accounts |
31/03/13 |
31/03/12 |
31/03/11 |
31/03/10 |
31/03/09 |
|
|
Pre-tax
profit margin % |
0.53 |
14.05 |
11.32 |
13.17 |
-105.28 |
|
|
Current
ratio |
5.38 |
7.87 |
4.97 |
3.77 |
2.19 |
|
|
Sales/Net
Working Capital |
0.94 |
0.95 |
1.05 |
1.32 |
0.18 |
|
|
Gearing
% |
4.60 |
1.70 |
3 |
4.70 |
18.50 |
|
|
Equity
in % |
83.50 |
88.90 |
82.80 |
76.20 |
58.70 |
|
|
Creditor
Days |
16.82 |
18.23 |
23.19 |
15.81 |
125.96 |
|
|
Debtor
Days |
71.12 |
97.76 |
105.58 |
111.96 |
595.89 |
|
|
Liquidity/Acid
Test |
4.36 |
6.32 |
3.95 |
3.38 |
1.95 |
|
|
Return
On Capital Employed % |
0.42 |
11.35 |
9.72 |
15.09 |
-16.21 |
|
|
Return
On Total Assets Employed % |
0.35 |
10.09 |
8.05 |
11.50 |
-9.51 |
|
|
Current
Debt Ratio |
0.19 |
0.12 |
0.20 |
0.31 |
0.70 |
|
|
Total
Debt Ratio |
0.19 |
0.12 |
0.20 |
0.31 |
0.70 |
|
|
Stock
Turnover Ratio % |
24.76 |
23.74 |
24.40 |
10.49 |
109.74 |
|
|
Return
on Net Assets Employed % |
0.42 |
11.35 |
9.72 |
15.09 |
-16.21 |
FOREIGN EXCHANGE RATES
Na
ADDITIONAL INFORMATION
Enquiries Trend
|
There have been 55 enquiries in
the last 12 months. |
|
There are an average of 5
reports taken each month. |
Status
History
|
No Status History found |
Event
History
|
Date |
Description |
|
25/01/2014 |
Annual Returns |
|
09/01/2014 |
New Accounts Filed |
|
09/01/2014 |
New Accounts Filed |
|
18/02/2013 |
Annual Returns |
|
10/01/2013 |
New Accounts Filed |
|
10/01/2013 |
New Accounts Filed |
|
21/02/2012 |
Annual Returns |
|
23/12/2011 |
New Accounts Filed |
|
23/12/2011 |
New Accounts Filed |
|
25/01/2011 |
Annual Returns |
|
05/01/2011 |
New Accounts Filed |
|
05/01/2011 |
New Accounts Filed |
|
20/09/2010 |
Change in Reg.Office |
|
20/09/2010 |
Change of Company Postcode |
|
19/06/2010 |
New Accounts Filed |
Previous
Company Names
|
No Previous Names found |
NOTES & COMMENTS
Commentary
|
No exact match CCJs are recorded
against the company. |
|
|
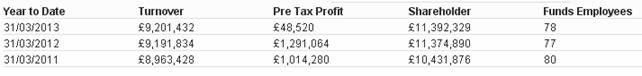
Sales in the latest trading
period increased 0.1% on the previous trading period. |
|
|
Net Worth increased by 0.2%
during the latest trading period. |
|
|
A 6.7% growth in Total Assets
occurred during the latest trading period. |
|
|
Pre-tax profits decreased by
96.2% compared to the previous trading period. |
|
|
The company saw an increase in
their Cash Balance of 20.5% during the latest trading period. |
|
|
The audit report contains no
adverse comments. |
|
|
No recent changes in
directorship are recorded. |
|
|
The company is not part of a
group. |
|
|
The company was established over
74 years ago. |
|
FOREIGN EXCHANGE RATES
|
Currency |
Unit
|
Indian Rupees |
|
US Dollar |
1 |
Rs.60.87 |
|
|
1 |
Rs.99.63 |
|
Euro |
1 |
Rs.78.22 |
INFORMATION DETAILS
|
Analysis Done by
: |
SUM |
|
|
|
|
Report Prepared
by : |
PDT |
RATING EXPLANATIONS
|
RATING |
STATUS |
PROPOSED CREDIT LINE |
|
|
|
>86 |
Aaa |
Possesses an extremely sound financial base with the strongest
capability for timely payment of interest and principal sums |
Unlimited |
|
|
71-85 |
Aa |
Possesses adequate working capital. No caution needed for credit
transaction. It has above average (strong) capability for payment of interest
and principal sums |
Large |
|
|
56-70 |
A |
Financial & operational base are regarded healthy. General
unfavourable factors will not cause fatal effect. Satisfactory capability for
payment of interest and principal sums |
Fairly Large |
|
|
41-55 |
Ba |
Overall operation is considered normal. Capable to meet normal
commitments. |
Satisfactory |
|
|
26-40 |
B |
Capability to overcome financial difficulties seems comparatively
below average. |
Small |
|
|
11-25 |
Ca |
Adverse factors are apparent. Repayment of interest and principal sums
in default or expected to be in default upon maturity |
Limited with
full security |
|
|
<10 |
C |
Absolute credit risk exists. Caution needed to be exercised |
Credit not
recommended |
|
|
-- |
NB |
New Business |
-- |
|
This score serves as a reference to assess SC’s credit risk
and to set the amount of credit to be extended. It is calculated from a composite
of weighted scores obtained from each of the major sections of this report. The
assessed factors and their relative weights (as indicated through %) are as
follows:
Financial
condition (40%) Ownership
background (20%) Payment
record (10%)
Credit history
(10%) Market trend
(10%) Operational
size (10%)
This report is issued at your request without any
risk and responsibility on the part of MIRA INFORM PRIVATE LIMITED (MIPL)
or its officials.