MIRA
INFORM REPORT
|
Report Date : |
24.09.2014 |
IDENTIFICATION DETAILS
|
Correct Name : |
VESPO CORPORATE TEXTILES B.V. |
|
|
|
|
Registered Office : |
Adriaan Mulderweg 4-10, 5657EM |
|
|
|
|
Country : |
|
|
|
|
|
Financials (as on) : |
31.12.2012 |
|
|
|
|
Date of Incorporation : |
13.02.1989 |
|
|
|
|
Com. Reg. No.: |
KvK-nummer: 17064355 |
|
|
|
|
Legal Form : |
Besloten Vennootschap |
|
|
|
|
Line of Business : |
Wholesale of textile products |
|
|
|
|
No. of Employees : |
23 |
RATING & COMMENTS
|
MIRA’s Rating : |
Ba |
|
RATING |
STATUS |
PROPOSED CREDIT LINE |
|
|
41-55 |
Ba |
Overall operation is considered normal. Capable to meet normal
commitments. |
Satisfactory |
|
Status : |
Satisfactory |
|
Payment Behaviour : |
No complaints |
|
Litigation : |
Clear |
NOTES :
Any query related to this report can be made
on e-mail : infodept@mirainform.com
while quoting report number, name and date.
ECGC Country Risk Classification List – June 1, 2014
|
Country Name |
Previous Rating (31.03.2014) |
Current Rating (01.06.2014) |
|
|
A1 |
A1 |
|
Risk Category |
ECGC
Classification |
|
Insignificant |
A1 |
|
Low |
A2 |
|
Moderate |
B1 |
|
High |
B2 |
|
Very High |
C1 |
|
Restricted |
C2 |
|
Off-credit |
D |
|
Source
: CIA |
Summary
Company name Vespo Corporate Textiles B.V.
Operative address Adriaan Mulderweg 4-10
5657EM
Legal form Besloten Vennootschap
Registration number KvK-nummer: 17064355
VAT-number 009090691
|
Year |
2012 |
|
Mutation |
2011 |
|
Mutation |
2010 |
|
Fixed assets |
|||||||
|
Total receivables |
2.176.458 |
|
0,97 |
2.155.540 |
|
-20,70 |
2.718.200 |
|
|
|||||||
|
Total equity |
3.175.618 |
|
10,15 |
2.882.930 |
|
15,15 |
2.503.612 |
|
Short term liabilities |
2.522.643 |
% |
-16,55 |
3.023.054 |
|
-0,55 |
3.039.689 |
|
|
|||||||
|
Net result |
292.688 |
|
-48,22 |
565.276 |
|
34,50 |
420.267 |
|
|
|||||||
|
Working capital |
3.175.618 |
|
10,15 |
2.882.930 |
|
15,15 |
2.503.612 |
|
Quick ratio |
0,86 |
|
21,13 |
0,71 |
|
-26,04 |
0,96 |

Contact information
Company name Vespo
Corporate Textiles B.V.
Trade names Vespo
Corporate Textiles B.V.
Vespo
Corporate Textiles B.V.
Operative address Adriaan
Mulderweg 4-10
5657EM
Correspondence address Postbus 8585
5605KN
Telephone number 0402380300
Fax number 0402380388
Email address verkoop@vespo.nl
Website www.vespoct.nl
Registration
Registration number KvK-nummer:
17064355
Branch number 000015834670
VAT-number 009090691
Status Active
First registration company
register 1989-02-17
Memorandum 1989-02-13
Establishment date 1989-02-13
Legal form Besloten Vennootschap
Last proposed admendment 2009-03-01
Activities
SBI Wholesale of textile products (46429)
Exporter Yes
Importer Yes
Goal De handel in textiel(goederen), aanverwante
artikelen en promotie-artikelen
Relations
Shareholders Vespo Groep B.V.
Adriaan
Mulderweg 4-10
5657EM
Registration
number: 171724740000
Percentage:
100%
Liability statements Vespo Groep B.V.
Adriaan Mulderweg 4-10
5657EM
Registration
number: 171724740000
date
of issue: 2006-12-01
Starting
date: 2005-01-03
End
date: 2010-04-08
Management
Vespo Holding B.V.
Ekenrooisestraat 59
5583TE WAALRE
Registration number: 171724690000
Competence: Fully authorized
Function: Manager
Starting date: 2005-01-03
K.F.H. Meerding (Klaas Franciscus Henricus)
Competence: Limited authorization
Function: Proxy
Starting date: 2010-10-01
Date of birth: 1965-11-17,
Active management
K.F.H. Meerding (Klaas Franciscus Henricus)
Competence: Limited authorization
Function: Proxy
Starting date: 2010-10-01
Date of birth: 1965-11-17,
Employees
Year 2014 2012 2011 2010
2009
Total 23 23 23 20
23

Payments
Description Payments made under
regular condition
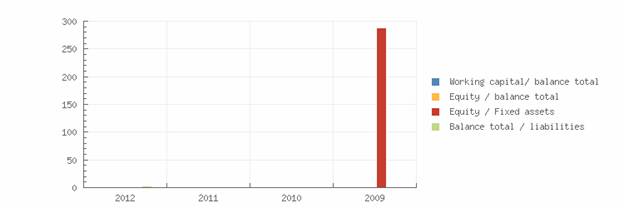
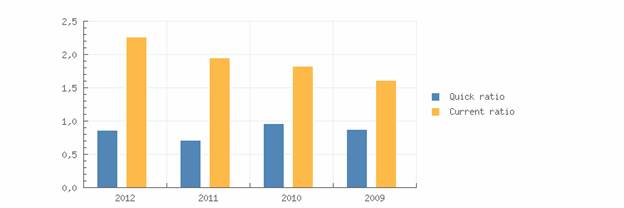
Key figures
|
Year |
2012 |
2011 |
2010 |
2009 |
|
|
Quick ratio |
0,86 |
0,71 |
0,96 |
0,87 |
|
|
Current
ratio |
2,26 |
1,95 |
1,82 |
1,61 |
|
|
|
|||||
|
Working
capital/ balance total |
0,56 |
0,49 |
0,45 |
0,38 |
|
|
Equity /
balance total |
0,56 |
0,49 |
0,45 |
0,38 |
|
|
Equity /
Fixed assets |
|
|
|
287,40 |
|
|
Equity /
liabilities |
1,26 |
0,95 |
0,82 |
0,61 |
|
|
Balance
total / liabilities |
2,26 |
1,95 |
1,82 |
1,61 |
|
|
Working capital
|
3.175.618 |
2.882.930 |
2.503.612 |
2.083.345 |
|
|
Equity |
3.175.618 |
2.882.930 |
2.503.612 |
2.083.345 |
|
Mutation
equity |
10,15 |
15,15 |
20,17 |
|
|
Mutation
short term liabilities |
-16,55 |
-0,55 |
-10,35 |
|
|
|
||||
|
Return on
total assets (ROA) |
6,42 |
12,76 |
9,97 |
5,63 |
|
Return on
equity (ROE) |
11,52 |
26,14 |
22,08 |
14,80 |
|
Gross
margin |
3.864.973 |
5.005.114 |
3.766.777 |
3.043.946 |
|
Operating
result |
436.578 |
819.898 |
597.097 |
401.340 |
|
Net result after
taxes |
292.688 |
565.276 |
420.267 |
233.610 |
|
Cashflow |
|
|
420.267 |
233.610 |
|
EBIT |
436.578 |
819.898 |
597.097 |
401.340 |
|
EBITDA |
|
|
604.346 |
537.504 |
Summary
The 2012 financial result structure
is a postive working captial of 3.175.618 euro, which is in
agreement with 56 % of the total
assets of the company.
The working capital has increased
with 10.15 % compared to previous year. The ratio, with
respect to the total assets of the
company has however, increased.
The improvement between 2011 and
2012 has mainly been caused by an increase of the
current assets.
The current ratio of the company
in 2012 was 2.26. A company with a current ratio between
1.5 and 3.0 generally indicates
good short-term financial strength.
The quick ratio in 2012 of the
company was 0.86. A company with a Quick Ratio of less than
1 cannot currently pay back its
current liabilities.
The 2011 financial result
structure is a postive working captial of 2.882.930 euro, which is in
agreement with 49 % of the total
assets of the company.
The working capital has increased
with 15.15 % compared to previous year. The ratio, with
respect to the total assets of the
company has however, increased.
The improvement between 2010 and
2011 has mainly been caused by an increase of the
current assets.
The current ratio of the company
in 2011 was 1.95. A company with a current ratio between
1.5 and 3.0 generally indicates
good short-term financial strength.
The quick ratio in 2011 of the
company was 0.71. A company with a Quick Ratio of less than
1 cannot currently pay back its
current liabilities
Financial statement
Remark annual account The company is obliged to file its
financial statements.
Type of annual account Corporate
Annual account Vespo
Corporate Textiles B.V.
Adriaan
Mulderweg 4-10
5657EM
Registration
number: 170643550000
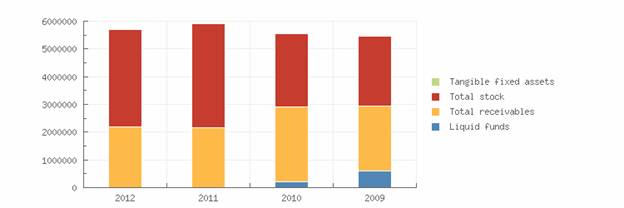
Balance
|
Year |
2012 |
2011 |
2010 |
2009 |
|
|
End date |
2012-12-31 |
2011-12-31 |
2010-12-31 |
2009-12-31 |
|
|
Tangible fixed assets |
|
7.249 |
|
||
|
Fixed assets |
|
7.249 |
|
||
|
|
|||||
|
Total stock |
3.519.498 |
3.748.546 |
2.620.195 |
2.516.570 |
|
|
Total receivables |
2.176.458 |
2.155.540 |
2.718.200 |
2.346.175 |
|
|
Liquid
funds |
2.305 |
1.898 |
204.906 |
603.926 |
|
|
Current assets |
5.698.261 |
5.905.984 |
5.543.301 |
5.466.671 |
|
|
Total assets |
5.698.261 |
5.905.984 |
5.543.301 |
5.473.920 |
|
|
|
|||||
|
Issued capital |
18.200 |
18.200 |
18.200 |
18.200 |
|
|
Year |
2012 |
2011 |
2010 |
2009 |
|
|
End date |
2012-12-31 |
2011-12-31 |
2010-12-31 |
2009-12-31 |
|
|
Other
reserves |
3.157.418 |
2.864.730 |
2.065.145 |
1.831.535 |
|
|
Non-distributable
profit |
|
|
420.267 |
233.610 |
|
|
Total reserves |
3.157.418 |
2.864.730 |
2.485.412 |
2.065.145 |
|
|
Total equity |
3.175.618 |
2.882.930 |
2.503.612 |
2.083.345 |
|
|
|
|||||
|
Short term liabilities |
2.522.643 |
3.023.054 |
3.039.689 |
3.390.575 |
|
|
Total short and long term liabilities |
2.522.643 |
3.023.054 |
3.039.689 |
3.390.575 |
|
|
Total liabilities |
5.698.261 |
5.905.984 |
5.543.301 |
5.473.920 |
|
Summary
The total assets of the company
decreased with -3.52 % between 2011 and 2012.
The asset reduction is in contrast
with the equity growth of 10.15 %. Due to this the total debt decreased with
-16.55 %. The total assets of the company increased with 6.54 % between 2010
and 2011.

Profit and loss
|
Year |
2012 |
2011 |
2010 |
2009 |
|
|
Gross margin |
3.864.973 |
5.005.114 |
3.766.777 |
3.043.946 |
|
|
Wages and salaries |
938.467 |
870.350 |
1.376.164 |
1.019.800 |
|
|
Amortization and depreciation |
|
|
7.249 |
136.164 |
|
|
Other operating costa |
2.489.928 |
3.314.866 |
1.786.267 |
1.486.642 |
|
|
Year |
2012 |
2011 |
2010 |
2009 |
|
|
Operating
expenses |
3.428.395 |
4.185.216 |
3.169.680 |
2.642.606 |
|
|
Operating result |
436.578 |
819.898 |
597.097 |
401.340 |
|
|
|
|||||
|
Financial
income |
|
|
3.795 |
|
|
|
Financial
expenses |
70.718 |
66.241 |
48.120 |
93.095 |
|
|
Financial
result |
-70.718 |
-66.241 |
-44.325 |
-93.095 |
|
|
Result on ordinary operations before taxes |
365.860 |
753.657 |
552.772 |
308.245 |
|
|
|
|||||
|
Taxation on
the result of ordinary activities |
73.172 |
188.381 |
132.505 |
74.635 |
|
|
Result of ordinary activities after taxes |
292.688 |
565.276 |
420.267 |
233.610 |
|
|
|
|||||
|
Net result |
292.688 |
565.276 |
420.267 |
233.610 |
|
Summary
The gross profit of the company decreased by -22.78
% between 2011 and 2012.
The operating result of the
company declined with -46.75 % between 2011 and 2012. This
evolution implies an decrease of
the company's economic profitability.
The result of these changes is a
reduction of the company's Economic Profitability of -49.69
% of the analysed period, being
equal to 2011 % in the year 2012.
The Net Result of the company
increased by -48.22 % between 2011 and 2012.
The company's Financial
Profitability has been positively affected by the financial activities in
comparison to the EBITs behaviour.
The result of these variations is a profitability increase of
-55.93 % of the analysed period,
being 11.52 % in the year 2012.
The company's financial
profitability has been positively affected by its financial structure.
The gross profit of the company
grew with 32.88 % between 2010 and 2011.
The operating result of the
company grew with 37.31 % between 2010 and 2011. This
evolution implies an increase of
the company's economic profitability.
The result of these changes is an
increase of the company's Economic Profitability of 27.98
% of the analysed period, being
equal to 2010 % in the year 2011.
The Net Result of the company
decreased by 34.5 % between 2010 and 2011.
The company's Financial
Profitability has been positively affected by the financial activities in
comparison to the EBITs behaviour.
The result of these variations is a profitability increase of
18.39 % of the analysed period,
being 26.14 % in the year 2011.
The company's financial structure
has slowed down its financial profitability

Analysis
Branch (SBI) Wholesale trade (no motor vehicles and
motorcycles) (46)
Region Zuid-Oost-Brabant
In the
In the
region Zuid-Oost-Brabant 5034 of the companies are registered with the SBI code
46
In the
In the
region Zuid-Oost-Brabant 97 of the bankruptcies are published within this
sector
The
risk of this specific sector in the
The
risk of this specific sector in the region Zuid-Oost-Brabant is normal
Publications
Filings 15-07-2013: De jaarrekening over 2012 is gepubliceerd.
21-06-2012:
De jaarrekening over 2011 is gepubliceerd.
20-10-2011:
De jaarrekening over 2010 is gepubliceerd.
27-09-2010:
De jaarrekening over 2009 is gepubliceerd.
Functions 07-02-2014: Per 27-06-2013 is gevolmachtigde Theodorus
Johannes Cornelis Willems uit
functie getreden.
14-03-2013:
Per 11-03-2013 is gevolmachtigde Cornelis Nicolaas Petrus Molenschot uit
functie
getreden.
19-11-2012:
Per 01-11-2012 is gevolmachtigde Cornelis Nicolaas Petrus Molenschot in
functie
getreden.
12-10-2010:
Per 01-10-2010 is gevolmachtigde Klaas Franciscus Henricus Meerding in
functie
getreden.
12-10-2010:
Per 01-01-2010 is gevolmachtigde Theodorus Johannes Cornelis Willems in
functie
getreden.
FOREIGN EXCHANGE RATES
|
Currency |
Unit
|
Indian Rupees |
|
US Dollar |
1 |
Rs.60.87 |
|
|
1 |
Rs.99.63 |
|
Euro |
1 |
Rs.78.22 |
INFORMATION DETAILS
|
Analysis Done by
: |
SUB |
|
|
|
|
Report Prepared
by : |
PDT |
RATING EXPLANATIONS
|
RATING |
STATUS |
PROPOSED CREDIT LINE |
|
|
|
>86 |
Aaa |
Possesses an extremely sound financial base with the strongest
capability for timely payment of interest and principal sums |
Unlimited |
|
|
71-85 |
Aa |
Possesses adequate working capital. No caution needed for credit transaction.
It has above average (strong) capability for payment of interest and
principal sums |
Large |
|
|
56-70 |
A |
Financial & operational base are regarded healthy. General unfavourable
factors will not cause fatal effect. Satisfactory capability for payment of
interest and principal sums |
Fairly Large |
|
|
41-55 |
Ba |
Overall operation is considered normal. Capable to meet normal
commitments. |
Satisfactory |
|
|
26-40 |
B |
Capability to overcome financial difficulties seems comparatively
below average. |
Small |
|
|
11-25 |
Ca |
Adverse factors are apparent. Repayment of interest and principal sums
in default or expected to be in default upon maturity |
Limited with
full security |
|
|
<10 |
C |
Absolute credit risk exists. Caution needed to be exercised |
Credit not
recommended |
|
|
-- |
NB |
New Business |
-- |
|
This score serves as a reference to assess SC’s credit risk and
to set the amount of credit to be extended. It is calculated from a composite
of weighted scores obtained from each of the major sections of this report. The
assessed factors and their relative weights (as indicated through %) are as
follows:
Financial
condition (40%) Ownership
background (20%) Payment
record (10%)
Credit history
(10%) Market trend
(10%) Operational
size (10%)
This report is issued at your request without any
risk and responsibility on the part of MIRA INFORM PRIVATE LIMITED (MIPL)
or its officials.