MIRA
INFORM REPORT
|
Report Date : |
25.09.2014 |
IDENTIFICATION DETAILS
|
Name : |
BASF INDIA LIMITED |
|
|
|
|
Registered
Office : |
1st Floor, Vibgyor Towers, Plot No. 62, ‘G’ Block, Bandra Kurla
Complex, Bandra (East), Mumbai – 400 051, Maharashtra |
|
|
|
|
Country : |
|
|
|
|
|
Financials (as
on) : |
31.03.2014 |
|
|
|
|
Date of
Incorporation : |
13.05.1943 |
|
|
|
|
Com. Reg. No.: |
11-003972 |
|
|
|
|
Capital Investment
/ Paid-up Capital : |
Rs.432.900 Millions |
|
|
|
|
CIN No.: [Company Identification
No.] |
L33112MH1943FLC003972 |
|
|
|
|
TAN No.: [Tax Deduction &
Collection Account No.] |
MUMB00133A |
|
|
|
|
PAN No.: [Permanent Account No.] |
AAACB4599E |
|
|
|
|
Legal Form : |
A Public Limited Liability Company. The Company’s Shares are Listed on
the Stock Exchanges. |
|
|
|
|
Line of Business
: |
Manufacturer and Seller agricultural solutions, performance products, chemicals, and functional materials. |
|
|
|
|
No. of Employees
: |
2130 (Approximately) |
RATING & COMMENTS
|
MIRA’s Rating : |
Aa (78) |
|
RATING |
STATUS |
PROPOSED CREDIT LINE |
|
|
71-85 |
Aa |
Possesses adequate working capital. No caution needed for credit transaction.
It has above average (strong) capability for payment of interest and
principal sums |
Large |
|
Maximum Credit Limit : |
USD 50000000 |
|
|
|
|
Status : |
Good |
|
|
|
|
Payment Behaviour : |
Regular |
|
|
|
|
Litigation : |
Exist |
|
|
|
|
Comments : |
Subject is a subsidiary of BASF Societas Europaea (‘SE’). It is a
well-established company having fine track record. The rating reflects healthy business risk profile, supported by its
diversified revenue profile adequate liquidity position. Further it also
reflects managerial an financial support that company receives from parent
company. Trade relations are reported as fair. Business is active. Payments are
reported to be regular and as per commitments. In view of strong holding support, the company can be considered good
for business dealings at usual trade terms and conditions. |
NOTES :
Any query related to this report can be made
on e-mail : infodept@mirainform.com
while quoting report number, name and date.
ECGC Country Risk Classification List – June 1, 2014
|
Country Name |
Previous Rating (31.03.2014) |
Current Rating (01.06.2014) |
|
India |
A1 |
A1 |
|
Risk Category |
ECGC
Classification |
|
Insignificant |
A1 |
|
Low |
A2 |
|
Moderate |
B1 |
|
High |
B2 |
|
Very High |
C1 |
|
Restricted |
C2 |
|
Off-credit |
D |
INDIAN ECONOMIC OVERVIEW
N E W S
Verdict Implications
: Apex court order may alter coal import dynamics. Traders go slow on talks over
coal supply contracts, uncertainty over cancellation of blocks weigh on stocks.
Recent arrest of the
Chennai head of the Registrar of Companies, the ministry of corporate affairs
arm that ensures that companies file all the information required by the
Companies Act is the latest manifestation of a messy fight between a father and
his adopted son for the control of Rs 40000 mn business empire. The Central
Bureau of Investigation arrested Manumeethi Cholan after he accepted Rs 10
lakhs as bribe from M A M Ramaswamy, a CBI official said.
Central Bureau of
Investigation books Electrotherm for cheating Central Bank of Rs 4360 mn.
Infosys maintains
revenue guidance. COO Rao says attrition still an area of concern and it would take
a few more quarters to bring down levels to 13-15 %.
DHL to invest
Euro 100 mn in India over next 2 years. The firm has chosen India to pilot its
e-commerce business model for the Asia-Pacific region.
Blackstone may buy
stake in BlueRidge SEZ in line with the fund’s real estate strategy in India.
Kingfisher Airlines
Ltd grounded in October 2012 under the weight of heavy debt and accumulated
losses, recently approached the Delhi high court for relief in two separate
cases. The airline challenged a notice by Punjab & National Bank alleging
that It had wilfully defaulted on Rs 7700 mn of loans and sought more time to
comply with the requirements under the listing agreements with the Stock
Exchanges.
OnMobile likely to
sack another 300 employees. The lay-offs follow a spate of senior-level exits
over the past two years, starting with of its founder. The overall lay-offs
could number around 600 and are driven by the need to cut costs, says a former
employee.
EXTERNAL AGENCY RATING
|
Rating Agency Name |
CRISIL |
|
Rating |
Non-Convertible Debenture : AAA |
|
Rating Explanation |
Highest degree of safety and carry lowest credit risk. |
|
Date |
10.06.2014 |
|
Rating Agency Name |
CRISIL |
|
Rating |
Commercial Paper : A1+ |
|
Rating Explanation |
Very Strong degree of safety and lowest credit risk. |
|
Date |
10.06.2014 |
RBI DEFAULTERS’ LIST STATUS
Subject’s name is not enlisted as a defaulter
in the publicly available RBI Defaulters’ list.
EPF (Employee Provident Fund) DEFAULTERS’ LIST STATUS
Subject’s name is not enlisted as a defaulter
in the publicly available EPF (Employee Provident Fund) Defaulters’ list as of
31-03-2014.
INFORMATION DECLINED
MANAGEMENT NON-COOPERATIVE (91-22-66618000)
LOCATIONS
|
Registered Office : |
1st Floor, Vibgyor Towers, Plot No. C-62, ‘G’ Block, Bandra
Kurla Complex, Bandra (East), Mumbai – 400051, Maharashtra, India |
|
Tel. No.: |
91-22-66618000 |
|
Fax No.: |
91-22-24930653/ 67582751 |
|
E-Mail : |
|
|
Website : |
|
|
|
|
|
Corporate Office : |
RBC, Mahindra Towers, 1st Floor, A Wing, Dr. G M Bhosale
Marg, Worli, Mumbai – 400018, Maharashtra, India |
|
Tel. No.: |
91-22-66618000/ 66917400 |
|
Fax No.: |
91-22-24930653 |
|
|
|
|
Factory 1 : |
Maharashtra (Navi Mumbai) Plot No.12 &
13, TTC Industrial Area, Thane-Belapur Road, Turbhe, Navi Mumbai – 400705,
Maharashtra, India |
|
|
|
|
Factory 2 : |
Maharashtra (Navi Mumbai) Plot No.C-68 and
C-68 Pt., TTC Industrial Area, MIDC, Thane Belapur Road, Turbhe, Navi Mumbai
– 400613, Maharashtra, India |
|
|
|
|
Factory 3 : |
Mangalore Bala/Thokur Village,
Surathkal-Bajpe Road, Mangalore Taluka, Dakshina Kannada District – 575030,
Karnataka, India |
|
|
|
|
Factory 4 : |
Bangalore Bommasundra
Industrial Area, Anekal Taluka, Bangalore, Karnataka, India |
|
|
|
|
Factory 5 : |
Ankleshwar Plot No.6214/6216,
GIDC Phase IV, Ankleshwar – 393002, Gujarat, India |
|
|
|
|
Factory 6 : |
Ankleshwar Plot No.8001,
GIDC Phase VI, Ankleshwar – 393 002, Gujarat, India |
|
|
|
|
Factory 7 : |
Dahej 4B, Dahej Industrial
Estate, Village Dahej, District Bharuch - 392130, Taluka Vagra, Gujarat,
India |
|
|
|
|
Factory 8 : |
Himachal Pradesh Khasra No.87/1,
Village: Beer Plassis, Nalagarh, District: Solan, Himachal Pradesh, India |
|
|
|
|
Factory 9 : |
West Bengal (Kolkata) Gate No.3, Jalan
Industrial Complex, 46/48/49/53, Jangalpur, Howrah, West Bengal, India |
|
|
|
|
Branches : |
Located at: ·
Ahmedabad Bangalore Chennai Delhi Kolkata Pune |
DIRECTORS
As on 31.03.2014
|
Name : |
Dr. Raman Ramachandran |
|
Designation : |
Chairman and Managing Director |
|
|
|
|
Name : |
Mr. Gops Pillay |
|
Designation : |
Director (w.e.f. 30th April, 2013) |
|
Date of Appointment : |
30.04.2013 |
|
|
|
|
Name : |
Mr. Thilo Bischoff |
|
Designation : |
Alternate Director Mr. Gops Pillay (upto 30th April, 2014) |
|
|
|
|
Name : |
Dr. Rainer Diercks |
|
Designation : |
Director |
|
|
|
|
Name : |
Dr. G. Ramaseshan |
|
Designation : |
Alternate Director to Dr. Rainer Diercks
(upto 31st July, 2014) |
|
Date of Appointment : |
01.09.2011 |
|
|
|
|
Name : |
Mr. Rajesh Naik |
|
Designation : |
Alternate Director to Dr. Rainer Diercks |
|
Date of Appointment : |
01.08.2014 |
|
|
|
|
Name : |
Mr. Andrew Postlethwaite |
|
Designation : |
Director |
|
|
|
|
Name : |
Mr. S. Regunathan |
|
Designation : |
Alternate Director to Mr. Andrew Postlethwaite |
|
|
|
|
Name : |
Mr. R. A. Shah |
|
Designation : |
Director |
|
|
|
|
Name : |
Mr. R. R. Nair |
|
Designation : |
Director |
|
|
|
|
Name : |
Mr. Pradip P. Shah |
|
Designation : |
Director |
|
|
|
|
Name : |
Mr. Arun Bewoor |
|
Designation : |
Director |
KEY EXECUTIVES
|
Name : |
Mr. Pradeep Chandan |
|
Designation : |
Chief Executive - Legal, Compliance and Company Secretary |
|
|
|
|
Management
Committee : |
· Dr. Raman Ramachandran · Mr. Thilo Bischoff · Mr. S. Regunathan · Dr. Rajan Venkatesh · Mr. Yatindra Borkar · Mr. Pradeep Chandan · Mr. Prabir Das · Mr. Sandeep Gadre · Mr. Ajai Gupta · Mr. Susheel Mittal · Mr. Rajesh Naik · Dr. G. Ramaseshan (upto 31st July, 2014) · Mr. P. P. Srees · Mr. V. Srinivasan · Mr. K. Thyagarajan |
MAJOR SHAREHOLDERS / SHAREHOLDING PATTERN
As on 30.06.2014
|
Names of Shareholders |
No. of Shares |
Percentage of
Holding |
|
(A) Shareholding of Promoter and Promoter
Group |
|
|
|
|
|
|
|
|
|
|
|
|
31743220 |
73.33 |
|
|
31743220 |
73.33 |
|
Total shareholding of Promoter and Promoter
Group (A) |
31743220 |
73.33 |
|
(B) Public Shareholding |
|
|
|
|
|
|
|
|
670450 |
1.55 |
|
|
592745 |
1.37 |
|
|
30 |
0.00 |
|
|
1181277 |
2.73 |
|
|
379941 |
0.88 |
|
|
2824443 |
6.53 |
|
|
|
|
|
|
2493520 |
5.76 |
|
|
|
|
|
|
5352515 |
12.37 |
|
|
643288 |
1.49 |
|
|
228654 |
0.53 |
|
|
224094 |
0.52 |
|
|
2222 |
0.01 |
|
|
2338 |
0.01 |
|
|
8717977 |
20.14 |
|
Total Public shareholding (B) |
11542420 |
26.67 |
|
Total (A)+(B) |
43285640 |
100.00 |
|
(C) Shares held by Custodians and against
which Depository Receipts have been issued |
|
|
|
|
0 |
0.00 |
|
|
0 |
0.00 |
|
|
0 |
0.00 |
|
Total (A)+(B)+(C) |
43285640 |
100.00 |
BUSINESS DETAILS
|
Line of Business : |
Manufacturer and Seller agricultural solutions,
performance products, chemicals, and functional materials. |
GENERAL INFORMATION
|
No. of Employees : |
2130 (Approximately) |
|
|
|
|
Bankers : |
· Citibank N.A · Deutsche Bank AG · The Honkong and Shanghai Banking Corporation Limited · HDFC Bank Limited · BNP Paribas · The Bank of Tokyo and Mitsubishi UFJ Limited |
|
|
|
|
Banking
Relations : |
-- |
|
|
|
|
Auditors : |
|
|
Name : |
BSR and Company LLP Chartered Accountants |
|
Address : |
1st Floor, Lodha Excelus Apollo Mills Compound N. M. Joshi Marg, Mahalakshmi, Mumbai - 400011, Maharashtra, India |
|
|
|
|
Internal Auditors : |
|
|
Name : |
Mahajan and Aibara Chartered Accountants |
|
Address : |
1, Chawla House, 62, Wodehouse Road, Colaba, Mumbai – 400005, Maharashtra, India |
|
|
|
|
Solicitors : |
|
|
Name : |
Crawford Bayley and Company Advocates and Solicitors |
|
Address : |
State Bank Building, 4th Floor, N. G. N. Vaidya Marg, Fort, Mumbai – 400023, Maharashtra, India |
|
|
|
|
Name : |
Udwadia Udeshi and Argus Partners Solicitors and Advocates |
|
Address : |
Elphinstone House, 1st Floor, 17, Murzban Road, Mumbai – 400001, Maharashtra, India |
|
|
|
|
Cost Auditors : |
|
|
Name : |
R. Nanabhoy and Company Cost Accountants |
|
Address : |
Jer Mansion, 70 August Kranti Marg, Mumbai – 400036, Maharashtra, India |
|
|
|
|
|
|
|
Ultimate Holding
Company : |
BASF Societas Europaea (‘SE’) |
|
|
|
|
Fellow Subsidiaries : |
· BASF A/S · BASF (MALAYSIA) SDN. BHD. · BASF Agro B.V. · BASF Nederland B.V. · BASF Agro B.V. Arnhem (NL) · BASF Oy · BASF Agrochemical Products B.V. · BASF Pakistan (Private) Limited · BASF Agricultural Specialties Pty Limited · BASF Paper Chemicals (Jiangsu) Co., Limited · BASF Antwerpen N.V. · BASF Paper Chemicals (Huizhou) · BASF Asia-Pacific Service Centre Sdn. Bhd. · BASF Performance Products plc · BASF Australia Limited · BASF Performance Products Limited · BASF Auxiliary Chemicals Company Limited · BASF Personal Care and Nutrition GmbH · BASF Bangladesh Limited · BASF Peruana S.A. · BASF Beauty Care Solutions France S.A.S. · BASF Petronas Chemicals Sdn. Bhd. · BASF Belgium Coordination Center Comm. V. · BASF Pharma (Evionnaz) SA · BASF Business Services Holding GmbH · BASF Philippines Inc · BASF Canada Inc. · BASF Plant Science Company GmbH · BASF Care Chemicals (Shanghai) Company Limited · BASF PLC · BASF Catalysts India Private Limited · BASF Poliuretani Italia SpA · BASF Chemicals and Polymers Pakistan (Private) Limited · BASF Polyurethane Licensing GmbH · BASF Chemicals Company Limited · BASF Polyurethane Specialties (China) Co., Limited · BASF Chemicals India Private Limited (Earlier known as Cognis Specialty Chemicals Private Limited · BASF Polyurethanes (China) Co. Limited · BASF Polyurethanes (Malaysia) Sdn. Bhd. · BASF Chemcat (Thailand) Limited · BASF Polyurethanes (Thailand) Limited · BASF (China) Company Limited · BASF Polyurethanes GmbH · BASF Coatings GmbH · BASF Qingdao Pigments Co. Limited · BASF Coatings Intl Trade (Shanghai) Co. Limited · BASF S.A. · BASF Coatings Intl Trade Co. Limited · BASF Schwarzheide GmbH · BASF Coatings Limited · BASF Schweiz AG · BASF Coatings S.A. · BASF Shanghai Coatings Co. Limited · BASF Coatings S.A.S. · BASF Singapore Pte. Limited · BASF Coatings Spa · BASF South Africa (PTY) Limited · BASF Color Solutions Germany GmbH · BASF South East Asia Pte Limited · BASF Company Limited · BASF Taiwan Limited · BASF Construction Chemical (China) Co. Limited · BASF (Thai) Limited · BASF Construction Chemicals (UK) Limited · BASF UK Limited · BASF Construction Chemicals Espana S.L. · BASF Vietnam Co. Limited · BASF Construction Chemicals Europe AG · BASF Vitamins Company Limited · BASF Construction Chemicals France S.A.S. · BASF Yapi Kimyasallari SAN. A.S. · BASF Construction Chemicals Italia Spa · BASF - YPC Company Limited · BASF Mexicana S.A. DE C.V. · BASF Construction Chemicals UAE LLC · BTC Europe GmbH · BASF Construction Polymers GmbH · Cognis Australia Pty. Limited · BASF Construction Systems (China). Co. Limited · Cognis Taiwan Limited · BASF Corporation Construction Research and Technology GmbH · BASF Construction Solutions GmbH (Formerly known as BASF Construction Chemicals GmbH) · Elastogran Kanoo Polyurethane Systems LLC · Inge Gmbh · BASF East Asia Regional Headquarters Limited · K+S Aktiengesellschaft · BASF Espanola S.L. · K+S Kali GmbH · BASF FZE P.T. · BASF Care Chemicals Indonesia · BASF Gao-Qiao Performance Chemicals · (Shanghai) Co. Limited · P.T. BASF Indonesia · PCI Augsburg GmbH · BASF Grenzach GmbH · PolyAd Services GmbH · BASF Health and Care Products France S.A.S. · Shanghai MBT and SCG High-tech Construction · Chemicals Co. Limited · BASF Hong Kong Limited · BASF INOAC Polyurethanes Limited Shanghai · BASF Polyurethane Co., Limited · BASF Intertrade (Shanghai) Co. Limited · Shanghai Gaoqiao-BASF · BASF Iran (PJS) Company · Styrolution GmbH · BASF Italia Spa · Styrolution India Private Limited · BASF Japan Limited · Styrolution South East Asia Pte. Limited · BASF Kanoo Gulf FZE · Styrolution ABS (India) Limited · BASF Kanoo Polyurethanes LLC · Watson Bowman ACME Corp · BASF Lanka (Private) Limited · BASF LLC |
CAPITAL STRUCTURE
As on 31.03.2014
Authorised Capital :
|
No. of Shares |
Type |
Value |
Amount |
|
|
|
|
|
|
54,359,715 |
Equity Shares |
Rs.10/- each |
Rs. 543.600 Millions |
|
|
|
|
|
Issued Capital :
|
No. of Shares |
Type |
Value |
Amount |
|
|
|
|
|
|
43,285,640 |
Equity Shares |
Rs.10/- each |
Rs. 432.900 Millions |
|
|
|
|
|
Subscribed and Paid-up Capital :
|
No. of Shares |
Type |
Value |
Amount |
|
|
|
|
|
|
43,284,958 |
Equity Shares |
Rs.10/- each |
Rs. 432.900 Millions |
|
|
|
|
|
NOTE
a. Equity shares held
by Ultimate Holding Company/Holding Company and/or their associates or
subsidiaries
|
Name of Shareholder |
Relationship |
March 31, 2014 |
|
BASF Societas Europaea |
Ultimate Holding Company |
20,939,259 |
|
BASF Schweiz AG |
Subsidiary of Ultimate Holding Company |
8,907,900 |
|
BASF Construction Solutions GmbH (Formerly known as BASF Construction Chemicals GmbH) |
Subsidiary of Ultimate Holding Company |
1,896,061 |
b. Rights,
preferences and restrictions attached to the shares
The Company has one class of equity shares having a par value of Rs. 10/- per share. Each shareholder is eligible for one vote per share held. The dividend proposed by the Board of Directors is subject to the approval of the shareholders in the ensuing Annual General Meeting, except in case of interim dividend. In the event of liquidation, the equity shareholders are eligible to receive remaining assets of the Company after distribution of all preferential amounts, in proportion to their shareholding.
c. Equity shares in
the Company held by each shareholder holding more than 5% shares
|
Name of Shareholder |
Relationship |
March 31, 2014 |
|
|
|
|
Number |
Percentage |
|
BASF Societas Europaea |
Ultimate Holding Company |
20,939,259 |
48.37% |
|
BASF Schweiz AG |
Subsidiary of Ultimate Holding Company |
8,907,900 |
20.58% |
d. Reconciliation of number
of equity shares outstanding as at the beginning and at the end of reporting
period
|
Particulars |
March 31, 2014 |
|
|
Number |
Rs. in million |
|
|
Shares outstanding
at the beginning of the year |
43,284,958 |
432.900 |
|
Shares Issued during the year |
-- |
-- |
|
Shares outstanding at the end of the year |
43,284,958 |
432.900 |
e. Information on
equity shares allotted without receipt of cash or allotted as bonus shares or
shares bought back
— 12,579,839 equity shares were allotted to the erstwhile shareholders of Ciba India Limited and Ciba Research (India) Private Limited consequent to the amalgamation w.e.f. February 1, 2010.
— 2,515,653 equity shares were allotted to the erstwhile shareholders of BASF Coatings India Private Limited and BASF Construction Chemicals India Private Limited consequent to the amalgamation w.e.f. April 1, 2010.
FINANCIAL DATA
[all figures are
in Rupees Millions]
ABRIDGED BALANCE
SHEET
|
SOURCES OF FUNDS |
31.03.2014 |
31.03.2013 |
31.03.2012 |
|
I.
EQUITY
AND LIABILITIES |
|
|
|
|
(1)Shareholders'
Funds |
|
|
|
|
(a) Share Capital |
432.900 |
432.900 |
432.900 |
|
(b) Reserves & Surplus |
12068.800 |
10992.600 |
10054.300 |
|
(c) Money
received against share warrants |
0.000 |
0.000 |
0.000 |
|
|
|
|
|
|
(2)
Share Application money pending allotment |
0.000 |
0.000 |
0.000 |
|
Total
Shareholders’ Funds (1) + (2) |
12501.700 |
11425.500 |
10487.200 |
|
|
|
|
|
|
(3) Non-Current Liabilities |
|
|
|
|
(a) long-term borrowings |
7417.600 |
2582.700 |
203.800 |
|
(b) Deferred tax liabilities (Net) |
0.000 |
9.300 |
1.800 |
|
(c) Other long term liabilities |
2271.200 |
509.700 |
489.900 |
|
(d) long-term provisions |
326.800 |
286.000 |
201.800 |
|
Total Non-current Liabilities (3) |
10015.600 |
3387.700 |
897.300 |
|
|
|
|
|
|
(4) Current Liabilities |
|
|
|
|
(a) Short term borrowings |
3133.300 |
1011.800 |
1545.100 |
|
(b) Trade payables |
11627.200 |
9426.800 |
6647.700 |
|
(c) Other current
liabilities |
2692.500 |
2460.700 |
2060.700 |
|
(d) Short-term provisions |
374.100 |
344.100 |
297.400 |
|
Total Current Liabilities (4) |
17827.100 |
13243.400 |
10550.900 |
|
|
|
|
|
|
TOTAL |
40344.400 |
28056.600 |
21935.400 |
|
|
|
|
|
|
II.
ASSETS |
|
|
|
|
(1) Non-current assets |
|
|
|
|
(a) Fixed Assets |
|
|
|
|
(i) Tangible assets |
5089.800 |
4118.200 |
3873.500 |
|
(ii) Intangible Assets |
171.000 |
235.800 |
58.500 |
|
(iii) Capital
work-in-progress |
7921.400 |
3193.200 |
838.700 |
|
(iv)
Intangible assets under development |
0.000 |
0.000 |
114.700 |
|
(b) Non-current Investments |
0.000 |
0.000 |
0.000 |
|
(c) Deferred tax assets (net) |
10.400 |
0.000 |
0.000 |
|
(d) Long-term Loan and Advances |
1790.500 |
1772.600 |
1071.800 |
|
(e) Other Non-current assets |
1387.400 |
675.100 |
39.700 |
|
Total Non-Current Assets |
16370.500 |
9994.900 |
5996.900 |
|
|
|
|
|
|
(2) Current assets |
|
|
|
|
(a) Current investments |
0.000 |
0.000 |
0.000 |
|
(b) Inventories |
11460.100 |
8952.500 |
7455.200 |
|
(c) Trade receivables |
8597.600 |
6815.300 |
6248.500 |
|
(d) Cash and cash
equivalents |
150.600 |
155.500 |
339.100 |
|
(e) Short-term loans and advances |
3257.500 |
2080.000 |
1845.500 |
|
(f) Other current assets |
508.100 |
58.400 |
50.200 |
|
Total Current Assets |
23973.900 |
18061.700 |
15938.500 |
|
|
|
|
|
|
TOTAL |
40344.400 |
28056.600 |
21935.400 |
PROFIT & LOSS
ACCOUNT
|
|
PARTICULARS |
31.03.2014 |
31.03.2013 |
31.03.2012 |
|
|
|
SALES |
|
|
|
|
|
|
|
Income |
44298.900 |
39406.300 |
35159.400 |
|
|
|
Other Income |
78.300 |
39.200 |
51.100 |
|
|
|
TOTAL (A) |
44377.200 |
39445.500 |
35210.500 |
|
|
|
|
|
|
|
|
Less |
EXPENSES |
|
|
|
|
|
|
|
Cost of materials consumed |
22315.800 |
18460.100 |
17626.100 |
|
|
|
Purchase of traded goods |
10606.400 |
10483.300 |
7916.600 |
|
|
|
Changes in inventories |
(1578.300) |
(922.700) |
(197.500) |
|
|
|
Employee benefits expenses |
3298.800 |
2929.900 |
2500.600 |
|
|
|
Other expenses |
6814.300 |
5936.200 |
5214.100 |
|
|
|
Exceptional item |
104.300 |
95.400 |
0.000 |
|
|
|
TOTAL (B) |
41561.300 |
36982.200 |
33059.900 |
|
|
|
|
|
|
|
|
|
PROFIT/
(LOSS) BEFORE INTEREST, TAX,
DEPRECIATION AND AMORTISATION (A-B) (C) |
2815.900 |
2463.300 |
2150.600 |
|
|
|
|
|
|
|
|
|
Less |
FINANCIAL
EXPENSES (D) |
161.300 |
171.200 |
136.100 |
|
|
|
|
|
|
|
|
|
|
PROFIT
/ (LOSS) BEFORE TAX, DEPRECIATION AND AMORTISATION (C-D) (E) |
2654.600 |
2292.100 |
2014.500 |
|
|
|
|
|
|
|
|
|
Less/ Add |
DEPRECIATION/
AMORTISATION (F) |
711.000 |
601.800 |
517.300 |
|
|
|
|
|
|
|
|
|
|
PROFIT/ (LOSS) BEFORE TAX (E-F) (G) |
1943.600 |
1690.300 |
1497.200 |
|
|
|
|
|
|
|
|
|
Less |
TAX (H) |
664.900 |
549.500 |
488.600 |
|
|
|
|
|
|
|
|
|
|
PROFIT/
(LOSS) AFTER TAX (G-H) (I) |
1278.700 |
1140.800 |
1008.600 |
|
|
|
|
|
|
|
|
|
Add |
PREVIOUS
YEARS’ BALANCE BROUGHT FORWARD |
810.000 |
808.000 |
808.000 |
|
|
|
|
|
|
|
|
|
Less |
APPROPRIATIONS |
|
|
|
|
|
|
|
Proposed Dividend |
173.100 |
173.100 |
173.100 |
|
|
|
Tax on Proposed Dividend |
29.400 |
29.400 |
28.100 |
|
|
|
Transfer to General Reserve |
886.200 |
936.300 |
807.400 |
|
|
BALANCE CARRIED
TO THE B/S |
1000.000 |
810.000 |
808.000 |
|
|
|
|
|
|
|
|
|
|
EARNINGS IN
FOREIGN CURRENCY |
|
|
|
|
|
|
|
Exports of goods calculated on FOB basis (Excludes Rupee Exports to Nepal and Bhutan – Rs. 99.800 millions – Previous Year Rs. 72.400 millions.) |
3926.300 |
2604.400 |
2129.600 |
|
|
|
Indent
Commission/ Technical/ Service charges |
1739.200 |
1702.500 |
1225.300 |
|
|
|
Others
(Freight/Insurance/Claims) |
89.500 |
70.600 |
53.800 |
|
|
TOTAL EARNINGS |
5755.000 |
4377.500 |
3408.700 |
|
|
|
|
|
|
|
|
|
|
IMPORTS |
|
|
|
|
|
|
|
Raw Materials |
15367.000 |
12076.100 |
11889.600 |
|
|
|
Capital Goods |
445.700 |
211.200 |
444.200 |
|
|
|
Components and Spare Parts |
14.500 |
5.600 |
6.400 |
|
|
|
Traded Goods |
6833.000 |
5695.300 |
4373.200 |
|
|
TOTAL IMPORTS |
22660.200 |
17988.200 |
16713.400 |
|
|
|
|
|
|
|
|
|
|
Earnings /
(Loss) Per Share (Rs.) |
29.54 |
26.35 |
23.30 |
|
QUARTERLY RESULTS
|
PARTICULARS |
|
|
30.06.2014 |
|
|
|
|
1st
Quarter |
|
Net Sales |
|
|
14476.000 |
|
Total Expenditure |
|
|
13562.000 |
|
PBIDT (Excl OI) |
|
|
914.000 |
|
Other Income |
|
|
17.200 |
|
Operating Profit |
|
|
931.200 |
|
Interest |
|
|
148.500 |
|
Exceptional Items |
|
|
0.000 |
|
PBDT |
|
|
782.700 |
|
Depreciation |
|
|
243.300 |
|
Profit Before Tax |
|
|
539.400 |
|
Tax |
|
|
19.600 |
|
Provisions and
contingencies |
|
|
0.000 |
|
Profit After Tax |
|
|
519.800 |
|
Extraordinary
Items |
|
|
0.000 |
|
Prior Period
Expenses |
|
|
0.000 |
|
Other Adjustments |
|
|
0.000 |
|
Net Profit |
|
|
519.800 |
KEY RATIOS
|
PARTICULARS |
|
31.03.2014 |
31.03.2013 |
31.03.2012 |
|
PAT / Total Income |
(%) |
2.88 |
2.89 |
2.86 |
|
|
|
|
|
|
|
Net Profit Margin (PBT/Sales) |
(%) |
4.39 |
4.29 |
4.26 |
|
|
|
|
|
|
|
Return on Total Assets (PBT/Total Assets} |
(%) |
6.00 |
6.80 |
7.14 |
|
|
|
|
|
|
|
Return on Investment (ROI) (PBT/Networth) |
|
0.16 |
0.15 |
0.14 |
|
|
|
|
|
|
|
Debt Equity Ratio (Total Debt/Networth) |
|
0.84 |
0.31 |
0.17 |
|
|
|
|
|
|
|
Current Ratio (Current Asset/Current Liability) |
|
1.34 |
1.36 |
1.51 |
FINANCIAL ANALYSIS
[all figures are
in Rupees Millions]
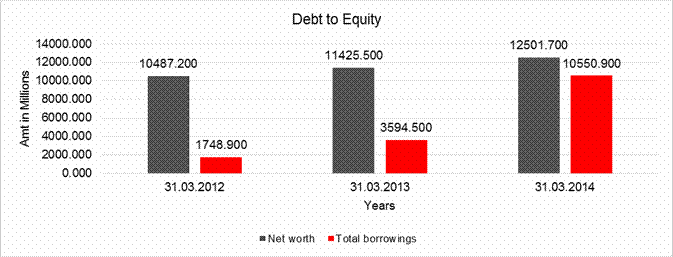
DEBT EQUITY RATIO
|
Particular |
31.03.2012 |
31.03.2013 |
31.03.2014 |
|
|
(Rs.
In Millions) |
(Rs.
In Millions) |
(Rs.
In Millions) |
|
Share Capital |
432.900 |
432.900 |
432.900 |
|
Reserves & Surplus |
10054.300 |
10992.600 |
12068.800 |
|
Net worth |
10487.200 |
11425.500 |
12501.700 |
|
|
|
|
|
|
long-term borrowings |
203.800 |
2582.700 |
7417.600 |
|
Short term borrowings |
1545.100 |
1011.800 |
3133.300 |
|
Total
borrowings |
1748.900 |
3594.500 |
10550.900 |
|
Debt/Equity
ratio |
0.167 |
0.315 |
0.844 |
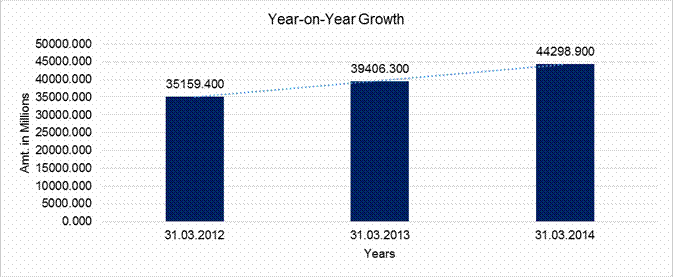
YEAR-ON-YEAR GROWTH
|
Year
on Year Growth |
31.03.2012 |
31.03.2013 |
31.03.2014 |
|
|
(Rs.
In Millions) |
(Rs.
In Millions) |
(Rs.
In Millions) |
|
Sales |
35159.400 |
39406.300 |
44298.900 |
|
|
|
12.079 |
12.416 |
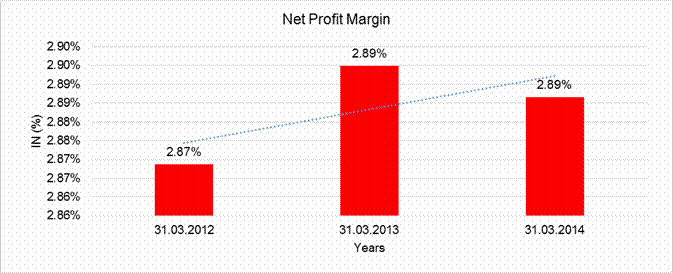
NET PROFIT MARGIN
|
Net
Profit Margin |
31.03.2012 |
31.03.2013 |
31.03.2014 |
|
|
(Rs.
In Millions) |
(Rs.
In Millions) |
(Rs.
In Millions) |
|
Sales |
35159.400 |
39406.300 |
44298.900 |
|
Profit |
1008.600 |
1140.800 |
1278.700 |
|
|
2.87% |
2.89% |
2.89% |
LOCAL AGENCY FURTHER INFORMATION
|
Sr. No. |
Check List by Info Agents |
Available in
Report (Yes / No) |
|
1] |
Year of Establishment |
Yes |
|
2] |
Locality of the firm |
Yes |
|
3] |
Constitutions of the firm |
Yes |
|
4] |
Premises details |
No |
|
5] |
Type of Business |
Yes |
|
6] |
Line of Business |
Yes |
|
7] |
Promoter's background |
Yes |
|
8] |
No. of employees |
Yes |
|
9] |
Name of person contacted |
No |
|
10] |
Designation of contact
person |
No |
|
11] |
Turnover of firm for last
three years |
Yes |
|
12] |
Profitability for last
three years |
Yes |
|
13] |
Reasons for variation
<> 20% |
----- |
|
14] |
Estimation for coming
financial year |
No |
|
15] |
Capital in the business |
Yes |
|
16] |
Details of sister
concerns |
Yes |
|
17] |
Major suppliers |
No |
|
18] |
Major customers |
No |
|
19] |
Payments terms |
No |
|
20] |
Export / Import details
(if applicable) |
No |
|
21] |
Market information |
----- |
|
22] |
Litigations that the firm
/ promoter involved in |
Yes |
|
23] |
Banking Details |
Yes |
|
24] |
Banking facility details |
Yes |
|
25] |
Conduct of the banking
account |
----- |
|
26] |
Buyer visit details |
----- |
|
27] |
Financials, if provided |
Yes |
|
28] |
Incorporation details, if
applicable |
Yes |
|
29] |
Last accounts filed at
ROC |
Yes |
|
30] |
Major Shareholders, if
available |
Yes |
|
31] |
Date of Birth of
Proprietor/Partner/Director, if available |
Yes |
|
32] |
PAN of
Proprietor/Partner/Director, if available |
No |
|
33] |
Voter ID No of Proprietor/Partner/Director,
if available |
No |
|
34] |
External Agency Rating,
if available |
Yes |
LITIGATION DETAILS
|
HIGH COURT OF BOMBAY |
|||||||
|
BENCH:- BOMBAY |
|||||||
|
LODGING NO:- |
AAPL/226/2012 |
FAILING DATE:- |
31/03/2012 |
REG. NO.:- |
APP/432/2012 |
REG. DATE:- |
06/08/2012 |
|
|
|||||||
|
MAIN MATTER LODGING NO.: ARBPL/282/2008 REG. NO.: ARBP/339/2008 |
|||||||
|
|
|||||||
|
PETITIONER:- |
LANDCOM PROPERTY PRIVATE LIMITED |
RESPONDENT:- |
BASF INDIA LTD. |
||||
|
PETN.ADV:- |
THAKORDAS MADGAVKAR (0) |
RESP.ADV.:- |
UDWADIA UDESHI AND ARGUS PARTNERS |
||||
|
DISTRICT:- |
MUMBAI |
||||||
|
|
|||||||
|
BENCH:- |
DIVISION |
CATEGORY:- |
APPEALS |
||||
|
STATUS:- |
ADMITTED (UNREADY) |
STAGE:- |
FOR CIRCULATION (ORIGINAL SIDE MATTERS) |
||||
|
LAST DATE:- |
02/04/2013 |
||||||
|
LAST CORAM:- |
HON’BLE SHRI JUSTICE DR. D.Y. CHANDRACHUD HON’BLE SHRI JUSTICE A.A. SAYED |
||||||
|
|
|
||||||
|
ACT:- |
C.P.C. (NON-INTERLOCUTORY ORDER) |
||||||
INDEX OF CHARGES
|
S.NO. |
CHARGE ID |
DATE OF CHARGE
CREATION/MODIFICATION |
CHARGE AMOUNT
SECURED |
CHARGE HOLDER |
ADDRESS |
SERVICE REQUEST
NUMBER (SRN) |
|
1 |
80056920 |
15/07/2000 |
10,000,000.00 |
ICICI BANK LIMITED |
215,FREE PRESS HOUSE, NARIMAN POINT, MUMBAI, MAHARASHTRA - 400021, INDIA |
- |
UNSECURED LOANS
|
PARTICULAR |
31.03.2014 (Rs.
In Millions) |
31.03.2013 (Rs.
In Millions) |
|
LONG TERM
BORROWINGS |
|
|
|
Term Loans from
Related parties |
|
|
|
— External commercial borrowings from BASF SE* |
0.000 |
109.900 |
|
— External commercial borrowings from BASF Belgium Coordination Center Comm. V.** |
7417.600 |
2472.800 |
|
|
|
|
|
SHORT TERM
BORROWINGS |
|
|
|
Overdraft facilities from bank |
1133.300 |
1011.800 |
|
Short term loan from bank |
2000.000 |
0.000 |
|
Total |
10550.900 |
3594.500 |
|
NOTE TERMS OF REPAYMENT * Repayment of USD 2 million due on 14th December 2014. Interest is payable half yearly on 31st March and 30th September at LIBOR plus 0.325%. ** USD 30 million repayable on 10th August 2017, USD 15 million on 15th January 2018, USD 15 million on 2nd April 2018, USD 20 million on 31st May 2018, USD 4 million on 2nd July 2018, USD 5 million on 13th September 2018, USD 15 million on 4th October 2018, USD 8 million on 5th November 2018, USD 4 million on 3rd December 2018, USD 3 million on 12th February 2019 and USD 2.5 million on 20th March 2019. Interest is payable half yearly on 15th June and 15th December at 4.93%. |
||
ACTIVITIES
Despite the challenging economic scenario, the sales of the Company during the year under report registered good growth over the previous year. Sales, net of excise at Rs. 44,298.900 million, represent an increase of 12.4%, over the previous year. Profit before tax for the year ended 31st March, 2014 stood at Rs. 1,943.600 million as compared to Rs. 1,690.300 million for the previous year which represents an increase of 15.0%.
Profit after tax at Rs. 1,278.700 million during the year ended 31st March, 2014 was higher by 12.1% compared to the previous year.
The Agricultural Solutions Segment has shown good growth in sales and significant increase in profits during the year ended 31st March, 2014 mainly on account of introduction of new products and adoption of innovative marketing initiatives.
The Performance Products Segment which includes textile chemicals, leather chemicals, paper chemicals and nutrition and health businesses registered an increase in sales and profits during the year under review. However, margins were under pressure for care chemicals, performance chemicals and dispersion and pigments businesses.
The Chemicals Segment of the Company comprises of intermediates, petrochemicals and monomers businesses. The sales and profits of the Chemicals Segment were lower as compared to the previous year. This was mainly on account of marginal growth in sales of intermediates and petrochemicals businesses.
The Functional Materials and Solutions Segment of the Company comprises of coatings, construction chemicals, performance materials and process catalyst technologies businesses. The sales of the Functional Materials and Solutions Segment registered growth during the year under review. However, margins were impacted mainly on account of slowdown in the automotive and construction industries and infrastructure investment, rising interest rates, liquidity crunch and weakening of the dollar against the rupee.
Exports sales stood at Rs. 4,026.100 million during the year under report and represented an increase of 50% over the previous year. This was mainly on account of higher exports of fluorescent whitening agents and paper dyes.
RE-ALIGNMENT OF THE
BUSINESS SEGMENTS
The Company has adopted the new segment structure with effect from 1st April, 2013. Accordingly, the Company has reduced the number of Business Segments from five to four in order to serve its customers more effectively and to enhance its operational and technological excellence. With effect from 1st April, 2013, the new Business Segment structure consists of Agricultural Solutions, Performance Products, Chemicals and Functional Materials and Solutions.
FINANCE AND ACCOUNTS
The Company continued to optimise bank borrowings during the year by focusing on cash flows and working capital management. By availing of alternate funding options like issuance of Commercial Papers, it ensured efficiency in its borrowing costs.
The Company follows a prudent financing policy and aims to maintain optimum financial gearing at all times. The Company’s total debt to equity ratio was 0.84 as at 31st March, 2014.
The Company secured External Commercial Borrowings (ECB)
loan for the Dahej Project on competitive terms.
MANAGEMENT DISCUSSION
AND ANALYSIS REPORT
The Indian economy recorded growth of 4.5% (revised) in 2012-2013 and is estimated to continue its subdued growth of less than 5% in 2013-2014. Good monsoon is estimated to lead to a healthy growth rate of 3.6% in agriculture, up from 1.5% a year earlier. However, high interest rate, rising inflation, sharp depreciation of rupee against the dollar and weak global market lead to low industrial and services growth. Manufacturing sector is estimated to remain flat in 2013-2014 compared to growth of 1.1% in the previous year.
During 2013-2014, the domestic automotive industry was hit adversely by high inflation and rising interest rates. Two-wheeler segment grew at 7%, while the passenger and commercial vehicles declined by 3.9% and 18.7%, respectively.
The domestic pharmaceutical market is estimated to have increased at 8% due to increased opportunities in the exports of generic medicines and greater penetration in rural markets.
Indian construction industry is expected to grow by 2.6% in 2013-2014.
The products manufactured by the Company serve several sectors including agriculture, automobiles, construction, pharmaceuticals, consumer durables, consumer care, paint, paper, leather and textiles. In a challenging year which saw many market segments remain flat or decline, the Company continued to strengthen its position in the market.
AGRICULTURAL
SOLUTIONS
The Agricultural Solutions business includes agrochemicals like insecticides, herbicides, fungicides and specialties. The Crop Protection industry in which this business of the Company operates is dependent on the monsoon. The Agricultural Solutions business registered a good growth in sales and profits during the year mainly on account of introduction of new products and adoption of innovative marketing initiatives.
The SAMRUDDHITM (prosperity) programme, where the Company operates as a total solution provider to the farmers contributed significantly to this growth. This program was recognized as a good example of corporate engagement in rural India by the German Society of International Cooperation and the Indian Institute of Corporate Affairs.
With appropriate pricing policies for agricultural commodities and higher investment and production, the agricultural sector is expected to perform better.
PERFORMANCE PRODUCTS
The Performance Products business includes performance chemicals, dispersions and pigments, care chemicals, nutrition and health products and paper chemicals. The business caters to the requirements of a wide spectrum of industries, including textiles, leather, plastics and coatings, detergent formulators, pharmaceuticals, automobile and oil.
During the year, the Leather Chemicals business witnessed a growth in sales, both in volume and value terms. New opportunities in the area of automotive upholstery systems were identified. The business continued its efforts
to work closely with its customers. New concepts viz., low emission, process innovation and premium leather were also introduced during the year.
Closure of tanneries on account of stringent pollution norms, currency fluctuations, import regulations on hides and skins, fluctuation in raw material prices and acute water shortage in tanneries are major concerns for this business.
Despite the difficult market conditions, outlook for the Leather Chemicals business looks optimistic as the Company focuses on serving high value markets with innovative products and services.
The Indian textile industry is one of the major contributors to the Indian industry contributing 4% to GDP, 14% to industrial production and 11% to export earnings. During the year, the Company’s Textile Chemicals business achieved good growth in sales and profits.
Demand for home textiles and denims are expected to grow during the year. Technical textiles would also witness
significant investments. Innovation in process optimization and resource savings would lead to further growth opportunities in this segment.
Lack of innovation in textiles, credit crunch, high transportation and utilities costs and stringent pollution control norms are the major concerns for this business.
The outlook for the Textile Chemicals business looks challenging due to rising raw material cost, higher local capacities, weakening of rupee and stiff competition in the domestic market.
The Care Chemicals business of the Company mainly caters to personal care, home care and formulation technology sectors. During the year, the Care Chemicals business of the Company registered healthy sales growth but margins were under pressure mainly due to exchange rate impact. Higher demand for increased functionalities in personal care products during the year was well-supported by launch of new concepts and solutions in the personal care segment. Investments made by leading personal care players in the industry will provide good opportunity for personal care ingredients supplied by the Company. Similarly, demand for better performing and higher efficiency products in the Home Care industry will drive the demand for polymers, fluorescent whitening agents, stain remover and surfactants of the Company. Growth opportunities for the formulation technologies were also seen in the emulsion polymerization, construction and paper industries. Increased demand is also seen in eco-friendly surfactants and chelating agents. The Care Chemicals business also achieved good growth in export sales on account of higher demand for export of fluorescent whitening agents.
The Plastic Additives business is categorised into anti-oxidants, light stabilizers and pigments for the plastic industry with customers broadly classified into upstream and downstream industries such as packaging and automotive industries. Expansion plans of major polymer producers and shift from natural fibres to plastic in the packaging sector will increase the demand for light stabilizers in the plastic additives business.
The Fuel and Lubricants business caters to the automotive, fuel, lubricants, refinery and refrigeration industries. Inspiteof challenging economic conditions, this business registered good growth in sales as compared to the previous year. This business continued to supply anti-freeze coolants to major manufacturers in India. With new product launches, this business is expected to grow.
The Water Solutions business of the Company provides offerings to raw water, industrial and municipal effluents. Significant growth in the municipal effluent sector is expected to offer good opportunity for their products; flocculants and coagulants. Global integration of INGE water technologies with advanced ultra-filtration membranes will further enhance the offerings of the Company in the water sector.
Oilfield solutions cater to the service companies that carry out work for the oil sector. Growth areas have been identified in the enhanced oil recovery areas in future.
Mining solutions is mainly focused on the coal and alumina mining sectors. With expected reforms in the mining sector, this business is expected to grow.
The Nutrition and Health business of the Company offers a comprehensive range of products and solutions for the Human Nutrition, Animal Nutrition, Pharma Ingredients, Application Services and Flavours and Fragrances. The Nutrition and Health business performed well over the previous year. This business offered solutions to the base of the pyramid market segment in the area of healthcare and also continued promotion of innovative solutions through joint development projects with key pharma Companies.
The Dispersions and Pigments business of the Company comprises of pigments, resins, dispersions and additives which cater to the needs of the adhesives, paints and coatings, printing and packaging and construction industries. This business registered moderate growth in sales during the year on account of slowdown in the automotive, paints and coatings industries. Discontinuance of some of the products in the printing range due to low profitability impacted the sales of this business to the printing and packaging industries. However, strong growth was witnessed in the products of this business supplied to the construction industry. The Dispersions and Pigments business is also proposing to increase its volume growth once the new plant at Dahej commences production in mid 2014.
The Paper Chemicals business of the Company caters to the paper industry comprising of writing and printing paper, coated paper, packaging paper and boards and newsprint. The Paper Chemicals business has a comprehensive product portfolio as well as the requisite technical expertise and grew in sales and profits during the year.
A new product “XELOREXTM”, which helps reduce raw material usage in paper and improves productivity, was launched. However, financial liquidity in the paper industry is a concern for this business.
The dyes plant of the Company at Ankleshwar is running at full capacity and exports of PERGAFAST® continued to be good. The new production plant at Dahej will further help in catering to the customers in Northern and Western India. Despite the challenging environment, the Paper Chemicals business is expected to grow in the coming years on account of likely increase in export of paper dyes.
CHEMICALS
The Company’s Chemicals business includes intermediates, petrochemicals and monomers. The chemicals supplied by the BASF Group cater to the requirement of a wide range of user industries including coatings, life sciences, construction additives, food and feed, pharmaceuticals, agrochemicals, plastics and fibers, process chemicals and intermediates.
Sales of the chemicals business were lower as compared to the previous year.
During the year, the intermediates business of the Company witnessed marginal growth both in volume and value. Products supplied to the agrochemicals and pharmaceutical industries grew while rupee depreciation impacted imports of products to customers. The inorganics chemicals business was integrated with this business during the year, further strengthened the offerings to the life science industry.
The product portfolio of the petrochemicals business comprises of Oxo-alcohols, Solvents, Acrylics monomers and Plasticizers. The sales of this business grew marginally during the year despite an unplanned shutdown of the petrochemicals production plant in Malaysia and higher supply from new capacities being built-up for Oxo-alcohols and Acrylics in China and Middle East. Inspite of this challenging environment, the petrochemicals business was able to maintain its position with key customers in the paints, coatings and plasticizers segments.
A new business division known as Monomers was created with effect from 1st April, 2013 under the Chemicals segment, which includes majority of the product group from the inorganics chemicals business, basic raw materials for polyurethane and polyamides and intermediates from Performance Polymers.
Major demand drivers for this business are in the areas of flexible packaging and spinning industries. However, increasing material inflow from countries, especially from Thailand with duty benefits and volatile raw material prices coupled with currency fluctuations are impacting this business.
The outlook for this business looks positive, especially in the area of mattress and footwear.
The Company is also setting up an MDI splitter at Dahej which will help Indian customers to switch from imported MDI to local MDI.
CONTINGENT
LIABILITIES:
|
PARTICULARS |
31.03.2014 (Rs.
In Millions) |
31.03.2013 (Rs.
In Millions) |
|
Contingent Liabilities not Provided for |
|
|
|
(a) Claim against the Company not acknowledged as debt |
38.800 |
24.100 |
|
In respect of which the Company has counterclaim |
68.700 |
68.700 |
|
(b) Demand for taxes and duties in respect of which the company has preferred appeals with appropriate authority |
|
|
|
a. Income Tax |
406.700 |
262.800 |
|
b. Customs, Excise, Service Tax and Sales Tax* |
240.000 |
174.800 |
|
NOTE * Commercial taxes department has issued demand notices
amounting to Rs. 36.0 million and Rs. 55.9 million (excludes interest and
penalty) for the period Apr 06-June 06 and Apr 07-June 07 respectively by
treating 100% of the stock transfers as interstate sales to unregistered
dealer. The amounts in respect of subsequent periods, if any, are currently
not determinable. The Company is in the process of filing an appeal against
the aforesaid demand notices. The Company, on the basis of a legal opinion,
does not consider these stock transfer as interstate sales. |
||
UNAUDITED
FINANCIAL RESULTS FOR QUARTER ENDED 30TH JUNE, 2014
(Rs. in Millions)
|
Particulars |
3 Months ended
30.06.2014 |
|
|
(Unaudited) |
|
1.(a)
Net sales/ Income from operations (net of excise) |
14458.400 |
|
(b)
Other operating income |
17.600 |
|
Total
income from operations (net) |
14476.000 |
|
|
|
|
2
Expenses |
|
|
(a)
Cost of materials consumed |
6706.900 |
|
(b)
Purchase of stock-in-trade |
3787.600 |
|
(c)
Changes in inventories of finished goods, work-in-progress and stock-in-trade |
390.200 |
|
(d)
Employee benefits expense |
858.600 |
|
(e)
Depreciation and amortisation expense |
243.300 |
|
(f)
Other expenses |
1818.700 |
|
Total
expenses |
13805.300 |
|
3
Profit from operations before other income, finance costs items (1-2) |
670.700 |
|
4
Other Income |
17.200 |
|
5
Profit from ordinary activities before finance costs (3+4) |
687.900 |
|
6
Finance cost |
148.500 |
|
7
Profit from ordinary activities after finance costs but before exceptional
Items (5-6) |
539.400 |
|
8
Exceptional Items |
-- |
|
9
Profit from ordinary activities before tax (7+8) |
539.400 |
|
10
Tax expense |
19.600 |
|
11
Net profit/ (loss) from ordinary activities after tax (9-10) |
519.800 |
|
12
Extraordinary Items |
-- |
|
13
Net profit/ (loss) for the period |
519.800 |
|
14
Paid - up equity share capital (Face Value of Rs 10/- per share) |
432.900 |
|
15
Reserves excluding Revaluation Reserve as per balance sheet of previous
accounting year |
|
|
16
Earnings Per Share (EPS) |
|
|
a)
Basic and diluted EPS before Extraordinary items for the period, for the year
to date and for the previous year (not annualised) |
12.01 |
|
b) Basic and diluted EPS after Extraordinary
items for the period, for the year to date and for the previous year (not
annulised) |
12.01 |
|
|
|
|
Particulars |
3 Months ended
30.06.2014 |
|
|
(Unaudited) |
|
A PARTICULARS OF
SHAREHOLDING |
|
|
1 Public
shareholding |
|
|
- Number of Shares |
11542420 |
|
- Percentage of shareholding |
26.7 % |
|
|
|
|
2 Promoter and
Promoter Group Shareholding |
|
|
a) Pledged/ Encumbered |
|
|
- Number of shares |
-- |
|
- Percentage of Share (as a % of the total
shareholding of promoter and promoter group) |
-- |
|
- Percentage of share (as a % of the total
share capital of the company) |
-- |
|
|
|
|
b) Non-encumbered |
|
|
- Number of shares |
31743220 |
|
- Percentage of Share (as a % of the total
shareholding of promoter and promoter group) |
100 % |
|
- Percentage of share (as a % of the total
share capital of the company) |
73.3 % |
|
|
|
|
B PARTICULARS OF INVESTOR COMPLAINTS (Nos.) |
|
|
Pending at the beginning of the quarter |
Nil |
|
Received during the quarter |
1 |
|
disposed of during the quarter |
1 |
|
Remaining unresolved at the end of the
quarter |
Nil |
NOTE
1. The above results for the quarter ended June 30, 2014
have been reviewed by the Audit Committee at its meeting held on July 31,2014
and thereafter approved by the Board of Directors at its meeting held on July
31, 2014.
2. The Agricultural Solution business, which constitutes significant part of
sales for this quarter is seasonal in nature and hence the quarterly figures
are not representative of the full year.
3. During the previous year in September 2013 the Company had declared
voluntary retirement scheme for the Thane site and accordingly compensation
aggregating Rs. 104.300 Millions had been paid and disclosed as an exceptional
item.
4. Pursuant to the notification dated December 29, 2011 issued by the Ministry
of Corporate Affairs amending the Accounting Standard 11, the Company has
exercised the option in terms of Para 46A inserted in the Standard for long
term foreign currency monetary assets and liabilities. Consequently an amount
of Rs. 133.800 Millions ( June 30, 2013 :Rs. 63.400 Millions, quarter and year
ended March 31, 2014 Rs. 109.500 Millions and Rs. 354.400 Millions
respectively) is taken to capital work in progress/fixed assets during the
quarter ended June 30, 2014.
5. Tax expense includes provision for current income tax (based on estimated
average effective annual income tax rate, considering tax allowances), MAT
Credit and deferred tax
6. The figures for the preceding 3 month ended March 31, 2014 are the balancing
figures between audited figures in respect of the full previous financial year
and the published year to date figures up to the end of the quarter of the
relevant financial year. Also the figures upto the end of the third quarter
were only reviewed and not subjected to audit.
7. The financial results for the quarter ended June 30, 2014 have been
subjected to a limited review by the statutory auditors of the Company and the
limited review report does not contain any qualifications. The limited review
report will be filed with the Stock Exchanges and will also be available on the
Company's website.
SEGMENT – WISE
REVENUE, RESULTS AND CAPITAL EMPLOYED
(Rs. in Millions)
|
Particulars |
3 Months ended
30.06.2014 |
|
|
(Unaudited) |
|
1. Segment Revenue |
|
|
a. Agricultural Solutions |
4546.700 |
|
b. Performance Products |
4585.800 |
|
c. Chemicals |
165.700 |
|
d. Functional Materilas and Solutions |
4987.600 |
|
e. Others |
190.200 |
|
Total |
14476.000 |
|
Less: Inter –
Segment Revenue |
-- |
|
|
|
|
Total Income from
operations (net) |
14476.000 |
|
|
|
|
2. Segment Results |
|
|
Profit/ (Loss) before tax and interest |
|
|
a. Agricultural Solutions |
468.600 |
|
b. Performance Products |
259.400 |
|
c. Chemicals |
43.300 |
|
d. Functional Materilas and Solutions |
(8.000) |
|
e. Others |
23.800 |
|
Total |
787.100 |
|
Less: (i) Finance Costs |
148.500 |
|
(ii) Other Un-allocable expenditure net off un-allocable other operating income |
99.200 |
|
Total profit before
tax and exceptional items |
539.400 |
|
Exceptional items |
-- |
|
Total profit before
tax |
539.400 |
|
|
|
|
3. Capital Employed |
|
|
(Segment Assets – Segment Liabilities) |
|
|
a. Agricultural Solutions |
2847.300 |
|
b. Performance Products |
8142.000 |
|
c. Chemicals |
1147.200 |
|
d. Functional Materials and Solutions |
6054.400 |
|
e. Others |
697.500 |
|
f. Unallocated |
(5867.200) |
|
Total |
1321.200 |
· Agricultural Solution includes Agrochemicals which is seasonal in nature
· Performance Products includes tanning agents, leather chemicals, textile chemicals, dispersion chemicals, specialty chemicals and fine chemicals for the food, pharmaceuticals, animal feed and cosmetic industries. Speciality chemicals include additives, water treatment and paper treatment, home and fabric care chemicals.
· Chemicals includes monomers, intermediates and petrochemicals.
· Functional Materials and Solutions includes catalysts, coatings, construction chemicals, polyurethanes system and engineering plastics.
· Others includes technical and service charges.
FIXED ASSETS
Tangible Assets
· Freehold Land
· Leasehold Land
· Buildings
· Plant and Machinery and Computers
· Furniture and Fixtures
· Vehicles
· Office Equipment
Intangible
Assets
· Software
· Goodwill
CMT REPORT (Corruption, Money Laundering & Terrorism]
The Public Notice information has been collected from various sources
including but not limited to: The Courts,
1] INFORMATION ON
DESIGNATED PARTY
No exist designating subject or any of its beneficial owners,
controlling shareholders or senior officers as terrorist or terrorist
organization or whom notice had been received that all financial transactions
involving their assets have been blocked or convicted, found guilty or against
whom a judgement or order had been entered in a proceedings for violating
money-laundering, anti-corruption or bribery or international economic or
anti-terrorism sanction laws or whose assets were seized, blocked, frozen or
ordered forfeited for violation of money laundering or international
anti-terrorism laws.
2] Court Declaration :
No exist to suggest that subject is or was
the subject of any formal or informal allegations, prosecutions or other
official proceeding for making any prohibited payments or other improper
payments to government officials for engaging in prohibited transactions or
with designated parties.
3] Asset Declaration :
No records exist to suggest that the property or assets of the subject
are derived from criminal conduct or a prohibited transaction.
4] Record on Financial
Crime :
Charges or conviction
registered against subject: None
5] Records on Violation of
Anti-Corruption Laws :
Charges or
investigation registered against subject: None
6] Records on Int’l
Anti-Money Laundering Laws/Standards :
Charges or
investigation registered against subject: None
7] Criminal Records
No
available information exist that suggest that subject or any of its principals have
been formally charged or convicted by a competent governmental authority for
any financial crime or under any formal investigation by a competent government
authority for any violation of anti-corruption laws or international anti-money
laundering laws or standard.
8] Affiliation with
Government :
No record
exists to suggest that any director or indirect owners, controlling
shareholders, director, officer or employee of the company is a government
official or a family member or close business associate of a Government
official.
9] Compensation Package :
Our market
survey revealed that the amount of compensation sought by the subject is fair
and reasonable and comparable to compensation paid to others for similar
services.
10] Press Report :
No press reports / filings exists on
the subject.
CORPORATE GOVERNANCE
MIRA INFORM as part of its Due Diligence do provide comments on
Corporate Governance to identify management and governance. These factors often
have been predictive and in some cases have created vulnerabilities to credit
deterioration.
Our Governance Assessment focuses principally on the interactions
between a company’s management, its Board of Directors, Shareholders and other
financial stakeholders.
CONTRAVENTION
Subject is not known to have contravened any existing local laws,
regulations or policies that prohibit, restrict or otherwise affect the terms
and conditions that could be included in the agreement with the subject.
FOREIGN EXCHANGE RATES
|
Currency |
Unit
|
Indian Rupees |
|
US Dollar |
1 |
Rs.61.03 |
|
|
1 |
Rs.99.99 |
|
Euro |
1 |
Rs.78.37 |
INFORMATION DETAILS
|
Information
Gathered by : |
GYT |
|
|
|
|
Analysis Done by
: |
KAR |
|
|
|
|
Report Prepared
by : |
MRI |
SCORE & RATING EXPLANATIONS
|
SCORE FACTORS |
RANGE |
POINTS |
|
HISTORY |
1~10 |
8 |
|
PAID-UP CAPITAL |
1~10 |
9 |
|
OPERATING SCALE |
1~10 |
9 |
|
FINANCIAL CONDITION |
|
|
|
--BUSINESS SCALE |
1~10 |
9 |
|
--PROFITABILIRY |
1~10 |
9 |
|
--LIQUIDITY |
1~10 |
9 |
|
--LEVERAGE |
1~10 |
8 |
|
--RESERVES |
1~10 |
9 |
|
--CREDIT LINES |
1~10 |
8 |
|
--MARGINS |
-5~5 |
- |
|
DEMERIT POINTS |
|
|
|
--BANK CHARGES |
YES/NO |
YES |
|
--LITIGATION |
YES/NO |
YES |
|
--OTHER ADVERSE INFORMATION |
YES/NO |
NO |
|
MERIT POINTS |
|
|
|
--SOLE DISTRIBUTORSHIP |
YES/NO |
NO |
|
--EXPORT ACTIVITIES |
YES/NO |
NO |
|
--AFFILIATION |
YES/NO |
YES |
|
--LISTED |
YES/NO |
YES |
|
--OTHER MERIT FACTORS |
YES/NO |
YES |
|
DEFAULTER |
|
|
|
--RBI |
YES/NO |
NO |
|
--EPF |
YES/NO |
NO |
|
TOTAL |
|
78 |
This score serves as a reference to assess SC’s credit risk
and to set the amount of credit to be extended. It is calculated from a
composite of weighted scores obtained from each of the major sections of this report.
The assessed factors and their relative weights (as indicated through %) are as
follows:
Financial
condition (40%) Ownership
background (20%) Payment
record (10%)
Credit history
(10%) Market trend
(10%) Operational
size (10%)
RATING EXPLANATIONS
|
RATING |
STATUS |
PROPOSED CREDIT LINE |
|
|
>86 |
Aaa |
Possesses an extremely sound financial base with the strongest
capability for timely payment of interest and principal sums |
Unlimited |
|
71-85 |
Aa |
Possesses adequate working capital. No caution needed for credit
transaction. It has above average (strong) capability for payment of interest
and principal sums |
Large |
|
56-70 |
A |
Financial & operational base are regarded healthy. General unfavourable
factors will not cause fatal effect. Satisfactory capability for payment of
interest and principal sums |
Fairly Large |
|
41-55 |
Ba |
Overall operation is considered normal. Capable to meet normal
commitments. |
Satisfactory |
|
26-40 |
B |
Capability to overcome financial difficulties seems comparatively
below average. |
Small |
|
11-25 |
Ca |
Adverse factors are apparent. Repayment of interest and principal sums
in default or expected to be in default upon maturity |
Limited with full
security |
|
<10 |
C |
Absolute credit risk exists. Caution needed to be exercised |
Credit not
recommended |
|
-- |
NB |
New Business |
-- |
This report is issued at your request without any
risk and responsibility on the part of MIRA INFORM PRIVATE LIMITED (MIPL)
or its officials.