MIRA
INFORM REPORT
|
Report Date : |
25.09.2014 |
IDENTIFICATION DETAILS
|
Name : |
C. MEIJER B.V. |
|
|
|
|
Registered Office : |
Bathseweg 45, 4411 RK Rilland |
|
|
|
|
Country : |
|
|
|
|
|
Financials (as on) : |
15.07.2013 |
|
|
|
|
Date of Incorporation : |
10.10.1950 |
|
|
|
|
Com. Reg. No.: |
22024805 |
|
|
|
|
Legal Form : |
Private Company |
|
|
|
|
Line of Business : |
Subject is engaged in Cultivation, wholesale, import and export
of potatoes and seed potatoes. Exploitation of cold stores. Divide and
multiply, as well as wholesale, import and export of raw material for
agriculture and horticulture. |
|
|
|
|
No of Employees : |
28 [2014] |
RATING & COMMENTS
|
MIRA’s Rating : |
Ba |
|
RATING |
STATUS |
PROPOSED CREDIT LINE |
|
|
41-55 |
Ba |
Overall operation is considered normal. Capable to meet normal
commitments. |
Satisfactory |
|
Status : |
Satisfactory |
|
Payment Behaviour : |
No Complaints |
|
Litigation : |
Clear |
NOTES :
Any query related to this report can be made
on e-mail : infodept@mirainform.com
while quoting report number, name and date.
ECGC Country Risk Classification List – June 1, 2014
|
Country Name |
Previous Rating (31.03.2014) |
Current Rating (01.06.2014) |
|
|
A1 |
A1 |
|
Risk Category |
ECGC
Classification |
|
Insignificant |
A1 |
|
Low |
A2 |
|
Moderate |
B1 |
|
High |
B2 |
|
Very High |
C1 |
|
Restricted |
C2 |
|
Off-credit |
D |
|
Source
: CIA |
Summary
Company name C.
Meijer B.V.
Operative address Bathseweg 45
4411RK Rilland
Legal form Private Company
Registration number KvK-nummer:
22024805
VAT-number 001388150
|
Year |
2013 |
Mutation |
2012 |
Mutation |
2011 |
|
|
Fixed assets |
95.772.000 |
10,29 |
86.839.000 |
16,49 |
74.545.000 |
|
|
Total receivables |
7.137.000 |
0.38 |
7.110.000 |
18,46 |
8.720.000 |
|
|
Total equity |
112.354.000 |
14,80 |
97.868.000 |
15,42 |
84.790.000 |
|
|
Short term liabilities |
6.306.000 |
-2,61 |
6.475.000 |
19,18 |
5.433.000 |
|
|
Net result |
17.879.000 |
-26,87 |
24.447.000 |
193,02 |
8.343.000 |
|
|
Working capital |
19.516.000 |
28,97 |
15.132.000 |
10,74 |
13.664.000 |
|
|
Quick ratio |
4,06 |
22,66 |
3,31 |
-5,16 |
3,49 |
|

Contact information
Company name C. Meijer B.V.
Trade names C. Meijer B.V.
Operative address Bathseweg 45
4411RK Rilland
Correspondence address Postbus 33
4416ZG Kruiningen
Telephone number 0113760100
Fax number 0113760119
Email address
info@meijer-potato.com
Website www.meijer-potato.com
Registration
Registration number KvK-nummer: 22024805
Branch number 000016361032
VAT-number 001388150
Status Active
Memorandum 1950-10-10
Establishment date 1950-10-10
Legal form Private Company
Last proposed admendment 2012-01-31
Activities
SBI Growing of cereals,
leguminous crops and oil seeds (0111)
Wholesale of seeds (46212)
Wholesale of edible potatoes (46312)
Exporter No
Importer No
Goal Cultivation, wholesale, import and export of potatoes and seed potatoes. Exploitation of cold stores. Divide and multiply, as well as wholesale, import and export of raw material for agriculture and horticulture.
Relations
Shareholders Meijer
Beheer B.V.
Stationsweg 18/A
4416PJ KRUININGEN
Registration number: 220263440000
Percentage: 100%
BRANCHES:
C. Meijer B.V.
Verlengde Gildenweg 10B
8304BK EMMELOORD
Registration number: 220248050006
C. Meijer B.V.
Maatje Harings Jobsweg 9
4307NL OOSTERLAND
Registration number: 220248050012
C. Meijer B.V.
Bathseweg 47
4411RK RILLAND
Registration number: 220248050014
COMPANIES ON SAME ADDRESS
Meijer International B.V.
Registration number: 390166210000
LIABILITY STATEMENTS
Meijer Beheer B.V.
Stationsweg 18/A
4416PJ KRUININGEN
Registration number: 220263440000
date of issue: 2007-02-27
Starting date: 2007-02-27
BANK DETAILS
Accounts
ABN Amro Bank NV
Account Number: 48.08.18.800
MANAGEMENT
Meijer Beheer B.V.
Stationsweg 18/A
4416PJ KRUININGEN
Registration number: 220263440000
Competence: Fully authorized
Function: Manager
Starting date: 2007-03-01
J.P.M. Muijsers (Johannes Petrus Maria)
Competence: Fully authorized
Function: Manager
Starting date: 1998-07-13
Date of birth: 1955-12-02,
J.W.M. van der Stee (Johannes Wilhelmus Marinus)
Competence: Fully authorized
Function: Manager
Starting date: 2014-01-01
Date of birth: 1972-08-29, Zevenbergen, NL
M.L. van der Vliet (Marinus Levinus)
Competence: Limited authorization
Function: Proxy
Starting date: 2007-01-01
Date of birth: 1978-09-16, Kapelle, NL
W.A. in 't Anker (Willem Adriaan)
Competence: Limited authorization
Function: Proxy
Starting date: 2008-11-01
Date of birth: 1973-10-18, Kapelle, NL
J.J. Driessen - Janse (Jacomina Jantina)
Competence: Limited authorization
Function: Proxy
Starting date: 2009-01-01
Date of birth: 1966-02-12, Kloetinge, NL
M.G.S. Van Ommen (Michael Gerardus Stephanus)
Competence: Limited authorization
Function: Proxy
Starting date: 2009-01-01
Date of birth: 1961-08-20, Rose Park, AU
A. Tange (Adriaan)
Competence: Fully authorized
Function: Proxy
Starting date: 2011-07-01
Date of birth: 1966-12-10, Goes, NL
|
Employees |
|
|
Total according to the Chamber of
Commerce |
28 |
Year 2014 2012
Total 28 11

|
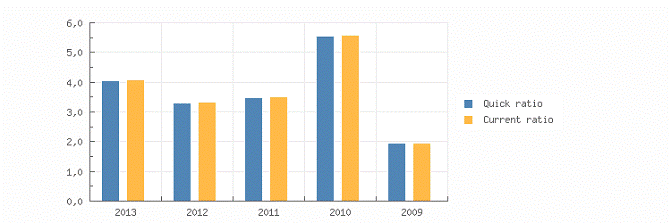
KEY FIGURES |
|||||
|
|
|||||
|
Year |
2013 |
2012 |
2011 |
2010 |
2009 |
|
Quick ratio |
4,06 |
3,31 |
3,49 |
5,55 |
1,94 |
|
Year |
2013 |
2012 |
2011 |
2010 |
2009 |
|
Current ratio |
4,09 |
3,34 |
3,52 |
5,59 |
1,96 |
|
|
|||||
|
Working capital/ balance total |
0,16 |
0,14 |
0,15 |
0,14 |
0,08 |
|
Equity / balance total |
0,92 |
0,90 |
0,91 |
0,93 |
0,88 |
|
Equity / Fixed assets |
1,17 |
1,13 |
1,14 |
1,13 |
1,06 |
|
Equity / liabilities |
12,16 |
9,25 |
9,58 |
13,92 |
9,89 |
|
Balance total / liabilities |
13,16 |
10,25 |
10,58 |
14,92 |
11,27 |
|
|
|||||
|
Working capital |
19.516.000 |
15.132.000 |
13.664.000 |
12.016.000 |
6.880.000 |
|
Equity |
112.354.000 |
97.868.000 |
84.790.000 |
79.041.000 |
71.815.000 |
|
Mutation equity |
14,80 |
15,42 |
7,27 |
10,06 |
-25,69 |
|
Mutation short term liabilities |
-2,61 |
19,18 |
107,45 |
-63,56 |
-12,81 |
|
|
|||||
|
Return on total assets (ROA) |
5,21 |
4,98 |
7,22 |
4,99 |
11,77 |
|
Return on equity (ROE) |
5,64 |
5,51 |
7,97 |
5,35 |
13,41 |
|
Gross profit margin |
10,49 |
9,25 |
11,37 |
8,30 |
9,73 |
|
Net profit margin |
31,04 |
46,86 |
14,63 |
16,56 |
12,89 |
|
|
|||||
|
Average collection ratio |
9,13 |
8,06 |
10,49 |
18,42 |
7,14 |
|
Average payment ratio |
8,07 |
7,34 |
6,54 |
5,17 |
5,86 |
|
Equity turnover ratio |
0,51 |
0,53 |
0,67 |
0,61 |
0,71 |
|
Total assets turnover ratio |
0,47 |
0,48 |
0,61 |
0,57 |
0,63 |
|
Fixed assets turnover ratio |
0,60 |
0,60 |
0,76 |
0,69 |
0,76 |
|
Inventory conversion ratio |
278,23 |
347,82 |
435,21 |
473,05 |
442,10 |
|
|
|||||
|
Turnover |
57.593.000 |
52.173.000 |
57.012.000 |
48.251.000 |
51.284.000 |
|
Gross margin |
|
|
12.480.000 |
11.407.000 |
|
|
Operating result |
6.040.000 |
4.828.000 |
6.484.000 |
4.004.000 |
4.990.000 |
|
Net result after taxes |
17.879.000 |
24.447.000 |
8.343.000 |
7.990.000 |
6.612.000 |
|
|
|||||
|
Cashflow |
|
|
9.035.000 |
8.684.000 |
7.268.000 |
|
Gross profit |
57.593.000 |
52.173.000 |
57.012.000 |
|
51.284.000 |
|
EBIT |
6.040.000 |
4.828.000 |
6.484.000 |
4.004.000 |
4.990.000 |
|
EBITDA |
|
|
7.176.000 |
4.698.000 |
5.646.000 |
Summary
The 2013 financial result structure
is a postive working captial of 19.516.000 euro, which is in agreement with 16
% of the total assets of the company.
The working capital has
increased with 28.97 % compared to previous year. The ratio, with respect to
the total assets of the company has however, increased. The improvement between
2012 and 2013 has mainly been caused by an increase of the current assets.
The current ratio of the
company in 2013 was 4.09. If the current ratio exeeds 3.0, the company may not
be using its current assets or its short-term financing facilities efficiently
. The quick ratio in 2013 of the company was 4.06. A company with a Quick Ratio
of more than 1 can currently pay back its current liabilities.
The 2012 financial result
structure is a postive working captial of 15.132.000 euro, which is in
agreement with 14 % of the total assets of the company.
The working capital has
increase with 10.74 % compared to previous year. The ratio with respect to the
total assets of the company has however, declined.
The improvement between 2011
and 2012 has mainly been caused by a current liabilities reduction.
The current ratio of the
company in 2012 was 3.34. If the current ratio exeeds 3.0, the company may not
be using its current assets or its short-term financing facilities efficiently.
The quick ratio in 2012 of the company was 3.31. A company with a Quick Ratio
of more than 1 can currently pay back its current liabilities.

Financial statement
REMARK ANNUAL ACCOUNT
The financial statements shown in the report relate to the consolidated
financial statements of the group.
TYPE OF ANNUAL ACCOUNT
Consolidated
ANNUAL ACCOUNT
Meijer Beheer B.V.
Stationsweg 18/A
4416PJ KRUININGEN
Netherlands
Registration number: 220263440000
BALANCE SHEET
|
Year |
2013 |
2012 |
2011 |
2010 |
2009 |
|
End date |
2013-07-15 |
2012-07-15 |
2011-07-15 |
2010-07-15 |
2009-07-15 |
|
Intangible fixed assets |
823.000 |
1.235.000 |
1.647.000 |
2.059.000 |
2.471.000 |
|
Other tangible fixed assets |
|
|
|
|
3.417.000 |
|
Tangible fixed assets |
6.435.000 |
6.224.000 |
5.979.000 |
4.660.000 |
3.417.000 |
|
Other financial fixed assets |
|
|
|
|
61.886.000 |
|
Financial fixed assets |
88.514.000 |
79.380.000 |
66.919.000 |
63.365.000 |
61.886.000 |
|
Fixed assets |
95.772.000 |
86.839.000 |
74.545.000 |
70.084.000 |
67.774.000 |
|
|
|||||
|
Other stock |
|
|
|
|
116.000 |
|
Total stock |
207.000 |
150.000 |
131.000 |
102.000 |
116.000 |
|
Year |
2013 |
2012 |
2011 |
2010 |
2009 |
|
End date |
2013-07-15 |
2012-07-15 |
2011-07-15 |
2010-07-15 |
2009-07-15 |
|
Accounts receivable |
4.171.000 |
4.143.000 |
3.628.000 |
4.056.000 |
3.292.000 |
|
Other receivables |
2.966.000 |
2.967.000 |
5.092.000 |
5.273.000 |
5.467.000 |
|
Total receivables |
7.137.000 |
7.110.000 |
8.720.000 |
9.329.000 |
8.759.000 |
|
Liquid funds |
18.478.000 |
14.347.000 |
10.246.000 |
5.204.000 |
5.192.000 |
|
accruals |
|
|
|
|
5.467.000 |
|
Current assets |
25.822.000 |
21.607.000 |
19.097.000 |
14.635.000 |
14.067.000 |
|
Total assets |
121.594.000 |
108.446.000 |
93.642.000 |
84.719.000 |
81.841.000 |
|
|
|||||
|
Other reserves |
|
|
|
|
71.815.000 |
|
Total reserves |
|
|
|
|
71.815.000 |
|
Total equity |
112.354.000 |
97.868.000 |
84.790.000 |
79.041.000 |
71.815.000 |
|
Provisions |
2.934.000 |
4.103.000 |
3.419.000 |
3.059.000 |
2.765.000 |
|
Other long term liabilities |
|
|
|
|
74.000 |
|
Long term liabilities |
|
74.000 |
|||
|
Accounts payable |
661.000 |
569.000 |
875.000 |
322.000 |
755.000 |
|
Other short term liabilities |
5.645.000 |
5.906.000 |
4.558.000 |
2.297.000 |
6.432.000 |
|
Short term liabilities |
6.306.000 |
6.475.000 |
5.433.000 |
2.619.000 |
7.187.000 |
|
Total short and long term
liabilities |
9.240.000 |
10.578.000 |
8.852.000 |
5.678.000 |
7.261.000 |
|
Total liabilities |
121.594.000 |
108.446.000 |
93.642.000 |
84.719.000 |
81.841.000 |
SUMMARY
The total assets of the company increased with 12.12 % between 2012 and 2013.
The fixed asset growth of 10.29 % is lower than the total asset growth.
The assets growth has been financed by a Net Worth increase of 14.8 %. The company's net
increase has also covered a reduction of -12.65 % of the company's indebtedness.
In 2013 the assets of the company were 78.76 % composed of fixed assets and 21.24 % by
current assets. The assets are being financed by an equity of 92.4 %, and total debt of 7.6 %.
The total assets of the company increased with 15.81 % between 2011 and 2012.
The total asset increase is retrievable in the fixed asset growth of 16.49 %.
The asset growth has mainly been financed by a debt increase of 19.5 %. The Net Worth,
however, grew with 15.42 %.
In 2012 the assets of the company were 80.08 % composed of fixed assets and 19.92 % by
current assets. The assets are being financed by an equity of 90.25 %, and total debt of 9.75%.


PROFIT & LOSS
|
Year |
2013 |
|
2012 |
2011 |
2010 |
2009 |
|
Revenues |
58.515.000 |
|
53.052.000 |
57.956.000 |
48.251.000 |
51.284.000 |
|
Other operating income |
922.000 |
|
879.000 |
944.000 |
|
|
|
Net turnover |
57.593.000 |
52.173.000 |
57.012.000 |
48.251.000 |
51.284.000 |
|
|
|
||||||
|
Gross margin |
|
12.480.000 |
11.407.000 |
|
||
|
|
||||||
|
Wages and salaries |
|
|
|
4.409.000 |
4.462.000 |
4.116.000 |
|
Amorization and depreciation |
|
|
|
692.000 |
694.000 |
656.000 |
|
Sales |
|
|
|
44.532.000 |
36.844.000 |
|
|
other operating costs |
|
|
|
1.839.000 |
2.247.000 |
2.188.000 |
|
Raw materials and consumables |
|
|
|
|
|
39.334.000 |
|
Operating expenses |
52.475.000 |
|
48.224.000 |
51.472.000 |
44.247.000 |
46.294.000 |
|
Result in subsidiaries |
|
|
|
|
|
8.093.000 |
|
Operating result |
6.040.000 |
4.828.000 |
6.484.000 |
4.004.000 |
4.990.000 |
|
|
|
||||||
|
Financial income |
300.000 |
|
581.000 |
275.000 |
232.000 |
505.000 |
|
Financial expenses |
|
|
13.000 |
|
5.000 |
3.955.000 |
|
Financial result |
300.000 |
|
568.000 |
275.000 |
227.000 |
-3.450.000 |
|
Result on ordinary operations
before taxes |
6.340.000 |
5.396.000 |
6.759.000 |
4.231.000 |
9.633.000 |
|
|
|
||||||
|
Taxation on the result of ordinary
activities |
4.763.000 |
|
6.084.000 |
2.502.000 |
618.000 |
3.029.000 |
|
Result of ordinary activities after
taxes |
1.577.000 |
-688.000 |
4.257.000 |
3.613.000 |
6.604.000 |
|
|
|
||||||
|
Extraordinary income |
129.000 |
|
|
|
|
8.000 |
|
Extraordinary result after taxation |
129.000 |
|
|
|
|
8.000 |
|
Result subsidiaries after taxes |
16.306.000 |
|
25.258.000 |
4.086.000 |
4.377.000 |
|
|
Net result |
17.879.000 |
24.447.000 |
8.343.000 |
7.990.000 |
6.612.000 |
|
|
|
||||||
|
Attributable to third parties |
133.000 |
|
123.000 |
|
|
|
SUMMARY
The turnover of the company grew with 10.39 % between 2012 and 2013.
The operating result of the company grew with 25.1 % between 2012 and
2013. This
evolution implies an increase of the company's economic profitability.
The result of these changes is an increase of the company's Economic
Profitability of 4.62 % of the analyzed period, being equal to 2012 % in the
year 2013.
Despite the growth the assets turnover decreased, whose index evolved
with -2.08 % to a level of 0.47.
The Net Result of the company increased by -26.87 % between 2012 and
2013.
The company's Financial Profitability has been positively affected by
the financial activities in comparison to the EBITs behaviour. The result of
these variations is a profitability increase of
2.36 % of the analysed period, being 5.64 % in the year 2013.
The company's financial structure has slowed down its financial
profitability.
The turnover of the company decreased by -8.49 % between 2011 and 2012.
The operating result of the company declined with -25.54 % between 2011
and 2012. This
evolution implies an decrease of the company's economic profitability.
The result of these changes is a reduction of the company's Economic
Profitability of -31.02
% of the analysed period, being equal to 2011 % in the year 2012.
This fall has contributed to a asset turnover decrease, whose index
evolved from -21.31 to a
level of 0.48.
The Net Result of the company decreased by 193.02 % between 2011 and
2012.
The company's Financial Profitability has been negatively affected by
the financial activities in
comparison to the EBITs behaviour. The result of these variations is a
profitability reduction
of -30.87 % of the analysed period, being 5.51 % in the year 2012.
The company's financial profitability has been positively affected by
its financial structure.


ANALYSIS
Branch (SBI)
Wholesale trade (no motor vehicles and motorcycles) (46)
Region
Zeeland
In the Netherlands 109662 of the companies are registered with the SBI
code 46
In the region Zeeland 1978 of the companies are registered with the SBI
code 46
In the Netherlands 2387 of the bankrupcties are published within this
sector
In the region Zeeland 36 of the bankruptcies are published within this
sector
The risk of this specific sector in the Netherlands is normal
The risk of this specific sector in the region Zeeland is normal
PUBLICATIONS
Consent statements
18-11-2013: Voor boekjaar 2013 is een instemmingsverklaring gedeponeerd.
04-12-2012: Voor boekjaar 2012 is een instemmingsverklaring gedeponeerd.
18-01-2011: Voor boekjaar 2010 is een instemmingsverklaring gedeponeerd.
Functions
09-07-2014: Per 01-01-2014 is gevolmachtigde Johannes Wilhelmus Marinus
van der Stee in
functie getreden.
04-10-2011: Per 01-07-2011 is gevolmachtigde Adriaan Tange in functie
getreden.
Amendments 17-02-2012: Per 31-1-2012 statuten gewijzigd.
COMPANY STRUCTURE
Relations
8
Stichting Administratiekantoor van Aandelen Meijer Concern
Stationsweg 18a
4416PJ KRUININGEN
Netherlands
Registration number: 220484230000
• Meijer Beheer B.V.
Stationsweg 18/A
4416PJ KRUININGEN
Netherlands
Registration number: 220263440000
• C. Meijer B.V.
Bathseweg 45
4411RK Rilland
Netherlands
Registration number: 220248050000
• Meijer International B.V.
Bathseweg 45
4411RK RILLAND
Netherlands
Registration number: 390166210000
FOREIGN EXCHANGE RATES
|
Currency |
Unit
|
Indian Rupees |
|
US Dollar |
1 |
Rs.61.03 |
|
|
1 |
Rs.99.99 |
|
Euro |
1 |
Rs.78.37 |
INFORMATION DETAILS
|
Analysis Done by
: |
SUB |
|
|
|
|
Report Prepared
by : |
TPT |
RATING EXPLANATIONS
|
RATING |
STATUS |
PROPOSED CREDIT LINE |
|
|
>86 |
Aaa |
Possesses an extremely sound financial base with the strongest
capability for timely payment of interest and principal sums |
Unlimited |
|
71-85 |
Aa |
Possesses adequate working capital. No caution needed for credit
transaction. It has above average (strong) capability for payment of interest
and principal sums |
Large |
|
56-70 |
A |
Financial & operational base are regarded healthy. General
unfavourable factors will not cause fatal effect. Satisfactory capability for
payment of interest and principal sums |
Fairly Large |
|
41-55 |
Ba |
Overall
operation is considered normal. Capable to meet normal commitments. |
Satisfactory |
|
26-40 |
B |
Capability to overcome financial difficulties seems comparatively below
average. |
Small |
|
11-25 |
Ca |
Adverse factors are apparent. Repayment of interest and principal sums
in default or expected to be in default upon maturity |
Limited with
full security |
|
<10 |
C |
Absolute credit risk exists. Caution needed to be exercised |
Credit not
recommended |
|
-- |
NB |
New Business |
-- |
This score serves as a reference to assess SC’s credit risk and
to set the amount of credit to be extended. It is calculated from a composite
of weighted scores obtained from each of the major sections of this report. The
assessed factors and their relative weights (as indicated through %) are as
follows:
Financial
condition (40%) Ownership
background (20%) Payment
record (10%)
Credit history
(10%) Market trend
(10%) Operational
size (10%)
This report is issued at your request without any
risk and responsibility on the part of MIRA INFORM PRIVATE LIMITED (MIPL)
or its officials.