MIRA
INFORM REPORT
|
Report Date : |
27.09.2014 |
IDENTIFICATION DETAILS
|
Name : |
CROWN HIDES LIMITED |
|
|
|
|
Registered Office : |
Adla House, 2A |
|
|
|
|
Country : |
|
|
|
|
|
Financials (as on) : |
31.07.2013 |
|
|
|
|
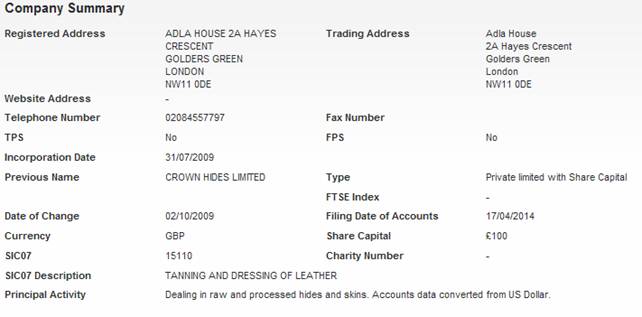
Date of Incorporation : |
31.07.2009 |
|
|
|
|
Com. Reg. No.: |
06977562 |
|
|
|
|
Legal Form : |
Private Limited with Share Capital |
|
|
|
|
Line of Business : |
· Tanning and Dressing of Leather Dealing in Raw and Processed Hides and Skins. |
|
|
|
|
No. of Employees : |
Not Available |
RATING & COMMENTS
|
MIRA’s Rating : |
Ba |
|
RATING |
STATUS |
PROPOSED CREDIT LINE |
|
|
41-55 |
Ba |
Overall operation is considered normal. Capable to meet normal
commitments. |
Satisfactory |
|
Status : |
Satisfactory |
|
|
|
|
Payment Behaviour : |
No Complaints |
|
|
|
|
Litigation : |
Clear |
NOTES:
Any query related to this report can be made
on e-mail: infodept@mirainform.com
while quoting report number, name and date.
ECGC Country Risk Classification List – June 1, 2014
|
Country Name |
Previous Rating (31.03.2014) |
Current Rating (01.06.2014) |
|
|
A1 |
A1 |
|
Risk Category |
ECGC
Classification |
|
Insignificant |
A1 |
|
Low |
A2 |
|
Moderate |
B1 |
|
High |
B2 |
|
Very High |
C1 |
|
Restricted |
C2 |
|
Off-credit |
D |
The
|
Source
: CIA |
REGISTERED NAME & COMPANY
SUMMARY
Company Name
CROWN HIDES LIMITED
DIRECTORS/MANAGEMENT
|
Total Current Directors |
2 |
|
Total Current Secretaries |
0 |
|
Total Previous Directors / Company Secretaries |
4 |
Current directors
|
Name |
Geoffrey Raymond Gluckman |
Date of Birth |
21/04/1955 |
|
Officers Title |
Mr |
Nationality |
Dutch |
|
Present Appointments |
4 |
Function |
Director |
|
Appointment Date |
21/11/2011 |
|
|
|
Address |
Adla
House 2a |
||
|
Name |
Lynn Shireen Gluckman |
Date of Birth |
01/07/1957 |
|
Officers Title |
Mrs |
Nationality |
Dutch |
|
Present Appointments |
1 |
Function |
Director |
|
Appointment Date |
01/11/2010 |
|
|
|
Address |
Adla
House 2a |
||
Previous
Director/Company Secretaries
|
Name |
Current Directorships |
Previous Directorships |
|
Nicolas John Stephens |
11 |
9 |
|
Martin Ian Zulberg |
4 |
4 |
|
Piyush Kumar Jaipuria |
1 |
1 |
|
Christina Cornelia Van Den Berg |
218 |
181 |
NEGATIVE INFORMATION
Trade Debtors / Bad Debt Summary --
Total Number of Documented Trade 0
Total Value of Documented Trade £0
|
No exact match CCJs are
recorded against the company. |
|
Sales in the latest trading period increased 29% on the
previous trading period. |
|
Net Worth increased by 85.2% during the latest trading
period. |
|
A 54.2% growth in Total Assets occurred during the
latest trading period. |
|
Pre-tax profits increased by 221.6% compared to the
previous trading period. |
|
The company saw an increase in their Cash Balance of
600.4% during the latest trading period. |
|
The audit report contains no adverse comments. |
|
The company has undergone recent changes in its
directorships. |
|
The company is part of a group. |
|
The company was established over 5 years ago. |
CCJ
|
Total Number of Exact CCJs - |
0 |
Total Value of Exact CCJs - |
|
Total Number of Possible CCJs
- |
0 |
Total Value of Possible CCJs - |
|
Total Number of Satisfied CCJs
- |
0 |
Total Value of Satisfied CCJs
- |
|
Total Number of Writs - |
- |
|
Exact
CCJ Details
|
No CCJs found |
Possible
CCJs Details
|
There are no possible CCJ details |
Writ
Details
|
No writs found |
SHARE & SHARE CAPITAL INFORMATION
Top 20 Shareholders
|
Name |
Currency |
Share
Count |
Share
Type |
Nominal
Value |
%
of Total Share Count |
|
HANSARD TRUST COMPANY LTD |
GBP |
100 |
ORDINARY |
1 |
100 |
PAYMENT INFORMATION
Payment
Information
Trade
Payment Information
|
Average Invoice Value |
n/a |
|
Invoices available |
n/a |
|
Paid |
n/a |
|
Outstanding |
n/a |
Trade Payment Data is information that we collect from
selected third party partners who send us information about their whole sales
ledger.
|
Disqualified |
|
|
|
|
Average Invoice Value |
n/a |
|
Invoices available |
n/a |
|
Paid |
n/a |
|
Outstanding |
n/a |
|
Trade Payment Data is information that we collect from selected
third party partners who send us information about their whole sales ledger. |
|
|
Within
Terms |
0-30
Days |
31-60
Days |
61-90
Days |
91+
Days |
|
Paid |
|
|
|
|
|
|
Outstanding |
|
|
|
|
|
GROUP STRUCTURE & AFFILIATED COMPANIES
Statistics
|
Group |
2 companies |
|
Linkages |
0 companies |
|
Countries |
In 0 countries |
Summary
|
Holding Company |
- |
|
Ownership Status |
Wholly Owned |
|
Ultimate Holding Company |
HANSARD TRUST CO LTD |
Group Structure
|
Company
Name |
|
Registered
Number |
Latest
Key Financials |
Consol.
Accounts |
Turnover |
|
|
|
N/A |
- |
- |
|
|
|
|
06977562 |
31.07.2013 |
N |
£18,745,160 |
FINANCIAL INFORMATION
Profit & Loss
|
Date
Of Accounts |
31/07/13 |
(%) |
31/07/12 |
(%) |
31/07/11 |
(%) |
31/07/10 |
(%) |
- |
|
|
|
Weeks |
52 |
(%) |
52 |
(%) |
52 |
(%) |
52 |
(%) |
- |
|
|
Currency |
GBP |
(%) |
GBP |
(%) |
GBP |
(%) |
GBP |
(%) |
- |
|
|
Consoli- dated
A/cs |
N |
(%) |
N |
(%) |
N |
(%) |
N |
(%) |
- |
|
|
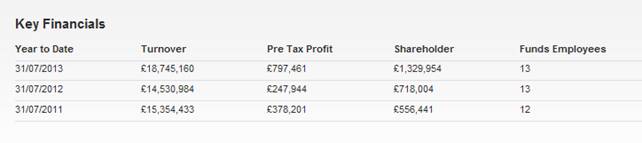
Turnover |
£18,745,160 |
29% |
£14,530,984 |
-5.4% |
£15,354,433 |
50.3% |
£10,218,027 |
- |
- |
|
|
Export |
- |
- |
- |
- |
- |
- |
- |
- |
- |
|
|
Cost
of Sales |
- |
- |
- |
- |
- |
- |
- |
- |
- |
|
|
Gross
Profit |
- |
- |
- |
- |
- |
- |
- |
- |
- |
|
|
Wages
& Salaries |
£657,773 |
6.8% |
£615,816 |
10% |
£559,881 |
-5.7% |
£593,699 |
- |
- |
|
|
Directors
Emoluments |
£339,559 |
7.1% |
£317,028 |
13.9% |
£278,376 |
-4.4% |
£291,284 |
- |
- |
|
|
Operating
Profit |
£825,068 |
194.2% |
£280,456 |
-31.9% |
£411,805 |
15.4% |
£356,934 |
- |
- |
|
|
Depreciation |
£3,378 |
99.4% |
£1,694 |
8.3% |
£1,564 |
-57.5% |
£3,681 |
- |
- |
|
|
Audit
Fees |
£5,272 |
30.6% |
£4,037 |
-37% |
£6,407 |
- |
- |
- |
- |
|
|
Interest
Payments |
£27,511 |
-17% |
£33,139 |
-1.6% |
£33,688 |
61.2% |
£20,899 |
- |
- |
|
|
Pre
Tax Profit |
£797,461 |
221.6% |
£247,944 |
-34.4% |
£378,201 |
12.5% |
£336,098 |
- |
- |
|
|
Taxation |
-£185,511 |
-251.2% |
-£52,816 |
36.1% |
-£82,637 |
-9.7% |
-£75,324 |
- |
- |
|
|
Profit
After Tax |
£611,951 |
213.6% |
£195,128 |
-34% |
£295,564 |
13.3% |
£260,774 |
- |
- |
|
|
Dividends
Payable |
- |
- |
- |
- |
- |
- |
- |
- |
- |
|
|
Retained
Profit |
£611,951 |
213.6% |
£195,128 |
-34% |
£295,564 |
13.3% |
£260,774 |
- |
- |
Balance Sheet
|
Date Of Accounts |
31/07/13 |
(%) |
31/07/12 |
(%) |
31/07/11 |
(%) |
31/07/10 |
(%) |
- |
|
|
|
Tangible Assets |
£8,880 |
13.6% |
£7,819 |
72.1% |
£4,544 |
114.4% |
£2,119 |
- |
- |
|
|
Intangible Assets |
0 |
- |
0 |
- |
0 |
- |
0 |
- |
- |
|
|
Total Fixed Assets |
£8,880 |
13.6% |
£7,819 |
72.1% |
£4,544 |
114.4% |
£2,119 |
- |
- |
|
|
Stock |
£1,413,188 |
22.2% |
£1,156,534 |
-0.1% |
£1,157,885 |
34.5% |
£861,115 |
- |
- |
|
|
Trade Debtors |
£2,107,157 |
56.7% |
£1,344,519 |
-16.8% |
£1,616,860 |
5.1% |
£1,538,141 |
- |
- |
|
|
Cash |
£549,205 |
600.4% |
£78,416 |
729.5% |
£9,453 |
-92.8% |
£132,026 |
- |
- |
|
|
Other Debtors |
£57,282 |
-39.6% |
£94,820 |
4% |
£91,137 |
95.3% |
£46,665 |
- |
- |
|
|
Miscellaneous Current Assets |
0 |
- |
0 |
- |
0 |
- |
0 |
- |
- |
|
|
Total Current Assets |
£4,126,832 |
54.3% |
£2,674,289 |
-7% |
£2,875,334 |
11.5% |
£2,577,947 |
- |
- |
|
|
Trade Creditors |
£1,124,230 |
-1.8% |
£1,145,259 |
-18.2% |
£1,399,642 |
-12.2% |
£1,594,964 |
- |
- |
|
|
Bank Loans & Overdrafts |
0 |
- |
0 |
- |
0 |
- |
0 |
- |
- |
|
|
Other Short Term Finance |
0 |
- |
0 |
- |
0 |
- |
0 |
- |
- |
|
|
Miscellaneous Current Liabilities |
£704,477 |
34.2% |
£524,800 |
14.3% |
£458,959 |
103.5% |
£225,497 |
- |
- |
|
|
Total Current Liabilities |
£1,828,706 |
9.5% |
£1,670,059 |
-10.1% |
£1,858,601 |
2.1% |
£1,820,461 |
- |
- |
|
|
Bank Loans & Overdrafts and LTL |
£977,051 |
232.3% |
£294,045 |
-36.7% |
£464,836 |
-6.8% |
£498,729 |
- |
- |
|
|
Other Long Term Finance |
£61,117 |
-56.6% |
£140,852 |
-16.9% |
£169,509 |
0.2% |
£169,133 |
- |
- |
|
|
Total Long Term Liabilities |
£977,051 |
232.3% |
£294,045 |
-36.7% |
£464,836 |
-6.8% |
£498,729 |
- |
- |
Capital & Reserves
|
|
Date Of Accounts |
31/07/13 |
(%) |
31/07/12 |
(%) |
31/07/11 |
(%) |
31/07/10 |
(%) |
- |
|
|
Called Up Share Capital |
£97 |
- |
£97 |
-6% |
£103 |
- |
£103 |
- |
- |
|
|
P & L Account Reserve |
£1,329,857 |
85.2% |
£717,907 |
29% |
£556,338 |
113.3% |
£260,774 |
- |
- |
|
|
Revaluation Reserve |
- |
- |
- |
- |
- |
- |
- |
- |
- |
|
|
Sundry Reserves |
- |
- |
- |
- |
- |
- |
- |
- |
- |
|
|
Shareholder Funds |
£1,329,954 |
85.2% |
£718,004 |
29% |
£556,441 |
113.3% |
£260,877 |
- |
|
Other Financial Items
|
Date Of Accounts |
31/07/13 |
(%) |
31/07/12 |
(%) |
31/07/11 |
(%) |
31/07/10 |
(%) |
- |
|
|
|
Net Worth |
£1,329,954 |
85.2% |
£718,004 |
29% |
£556,441 |
113.3% |
£260,877 |
- |
- |
|
|
Working Capital |
£2,298,125 |
128.8% |
£1,004,230 |
-1.2% |
£1,016,733 |
34.2% |
£757,487 |
- |
- |
|
|
Total Assets |
£4,135,711 |
54.2% |
£2,682,108 |
-6.9% |
£2,879,878 |
11.6% |
£2,580,067 |
- |
- |
|
|
Total Liabilities |
£2,805,757 |
42.9% |
£1,964,104 |
-15.5% |
£2,323,436 |
0.2% |
£2,319,190 |
- |
- |
|
|
Net Assets |
£1,329,954 |
85.2% |
£718,004 |
29% |
£556,441 |
113.3% |
£260,877 |
- |
- |
Cash Flow
|
Date Of Accounts |
31/07/13 |
(%) |
31/07/12 |
(%) |
31/07/11 |
(%) |
31/07/10 |
(%) |
- |
|
|
|
Net Cashflow from Operations |
-£127,355 |
-138.9% |
£327,691 |
999.9% |
£24,237 |
107.1% |
-£340,170 |
- |
- |
|
|
Net Cashflow before Financing |
-£212,216 |
-200% |
£212,284 |
339.4% |
-£88,679 |
75.8% |
-£366,806 |
- |
- |
|
|
Net Cashflow from Financing |
£683,006 |
578.5% |
-£142,751 |
-321.2% |
-£33,893 |
-106.8% |
£498,832 |
- |
- |
|
|
Increase in Cash |
£470,789 |
577.1% |
£69,533 |
156.7% |
-£122,573 |
-192.8% |
£132,026 |
- |
- |
Miscellaneous
|
Date Of Accounts |
31/07/13 |
(%) |
31/07/12 |
(%) |
31/07/11 |
(%) |
31/07/10 |
(%) |
- |
|
|
|
Net Cashflow from Operations |
-£127,355 |
-138.9% |
£327,691 |
999.9% |
£24,237 |
107.1% |
-£340,170 |
- |
- |
|
|
Net Cashflow before Financing |
-£212,216 |
-200% |
£212,284 |
339.4% |
-£88,679 |
75.8% |
-£366,806 |
- |
- |
|
|
Net Cashflow from Financing |
£683,006 |
578.5% |
-£142,751 |
-321.2% |
-£33,893 |
-106.8% |
£498,832 |
- |
- |
|
|
Increase in Cash |
£470,789 |
577.1% |
£69,533 |
156.7% |
-£122,573 |
-192.8% |
£132,026 |
- |
- |
Ratios
|
Date Of Accounts |
31/07/13 |
31/07/12 |
31/07/11 |
31/07/10 |
- |
|
|
|
Pre-tax profit margin % |
4.25 |
1.71 |
2.46 |
3.29 |
- |
|
|
Current ratio |
2.26 |
1.60 |
1.55 |
1.42 |
- |
|
|
Sales/Net Working Capital |
8.16 |
14.47 |
15.10 |
13.49 |
- |
|
|
Gearing % |
73.50 |
41 |
83.50 |
191.20 |
- |
|
|
Equity in % |
32.20 |
26.80 |
19.30 |
10.10 |
- |
|
|
Creditor Days |
21.83 |
28.68 |
33.18 |
56.81 |
- |
|
|
Debtor Days |
40.91 |
33.68 |
38.33 |
54.79 |
- |
|
|
Liquidity/Acid Test |
1.48 |
0.90 |
0.92 |
0.94 |
- |
|
|
Return On Capital Employed % |
34.56 |
24.49 |
37.03 |
44.24 |
- |
|
|
Return On Total Assets Employed % |
19.28 |
9.24 |
13.13 |
13.02 |
- |
|
|
Current Debt Ratio |
1.37 |
2.32 |
3.34 |
6.97 |
- |
|
|
Total Debt Ratio |
2.10 |
2.73 |
4.17 |
8.88 |
- |
|
|
Stock Turnover Ratio % |
7.53 |
7.95 |
7.54 |
8.42 |
- |
|
|
Return on Net Assets Employed % |
59.96 |
34.53 |
67.96 |
128.83 |
- |
FOREIGN EXCHANGE RATES
NA
ADDITIONAL INFORMATION
Mortgage
Summary
Total Mortgage 0
Outstanding 0
Satisfied 0
Status
History
|
No Status History found |
Event
History
|
Date |
Description |
|
06/08/2014 |
Annual Returns |
|
07/07/2014 |
Mr
P.K. Jaipuria has left the board |
|
30/04/2014 |
New Accounts Filed |
|
30/04/2014 |
New Accounts Filed |
|
23/09/2013 |
New Accounts Filed |
|
05/08/2013 |
Annual Returns |
|
02/08/2013 |
Mr
N.J. Stephens has left the board |
|
26/03/2013 |
New Accounts Filed |
|
03/08/2012 |
Annual Returns |
|
18/01/2012 |
New Accounts Filed |
|
18/01/2012 |
New Accounts Filed |
|
02/12/2011 |
New Board Member Mr G.R. Gluckman appointed |
|
15/08/2011 |
Annual Returns |
|
12/02/2011 |
New Accounts Filed |
|
30/11/2010 |
New Board Member Mrs L.S. Gluckman appointed |
Previous Company Names
|
Date |
Previous
Name |
|
02/10/2009 |
CROWN HIDES LIMITED |
NOTES & COMMENTS
NA
FOREIGN EXCHANGE RATES
|
Currency |
Unit
|
Indian Rupees |
|
US Dollar |
1 |
Rs.61.57 |
|
|
1 |
Rs.100.42 |
|
Euro |
1 |
Rs.78.45 |
INFORMATION DETAILS
|
Analysis Done by
: |
SUB |
|
|
|
|
Report Prepared
by : |
NIT |
RATING EXPLANATIONS
|
RATING |
STATUS |
PROPOSED CREDIT LINE |
|
|
|
>86 |
Aaa |
Possesses an extremely sound financial base with the strongest capability
for timely payment of interest and principal sums |
Unlimited |
|
|
71-85 |
Aa |
Possesses adequate working capital. No caution needed for credit
transaction. It has above average (strong) capability for payment of interest
and principal sums |
Large |
|
|
56-70 |
A |
Financial & operational base are regarded healthy. General unfavourable factors will not cause fatal effect.
Satisfactory capability for payment of interest and principal sums |
Fairly Large |
|
|
41-55 |
Ba |
Overall operation is considered normal. Capable to meet normal
commitments. |
Satisfactory |
|
|
26-40 |
B |
Capability to overcome financial difficulties seems comparatively
below average. |
Small |
|
|
11-25 |
Ca |
Adverse factors are apparent. Repayment of interest and principal sums
in default or expected to be in default upon maturity |
Limited with
full security |
|
|
<10 |
C |
Absolute credit risk exists. Caution needed to be exercised |
Credit not
recommended |
|
|
-- |
NB |
New Business |
-- |
|
This score serves as a reference to assess SC’s credit risk
and to set the amount of credit to be extended. It is calculated from a composite
of weighted scores obtained from each of the major sections of this report. The
assessed factors and their relative weights (as indicated through %) are as
follows:
Financial
condition (40%) Ownership
background (20%) Payment
record (10%)
Credit history
(10%) Market trend
(10%) Operational
size (10%)
This report is issued at your request without any
risk and responsibility on the part of MIRA INFORM PRIVATE LIMITED (MIPL)
or its officials.