MIRA INFORM REPORT
|
Report No. : |
316125 |
|
Report Date : |
04.04.2015 |
IDENTIFICATION DETAILS
|
Name : |
RELIANCE INDUSTRIES LIMITED |
|
|
|
|
Registered
Office : |
3rd Floor, Maker Chamber IV, 222, Nariman Point, Mumbai – 400021, |
|
|
|
|
Country : |
India |
|
|
|
|
Financials (as
on) : |
31.03.2014 |
|
|
|
|
Date of
Incorporation : |
08.05.1973 |
|
|
|
|
Com. Reg. No.: |
11-019786 |
|
|
|
|
Capital
Investment / Paid-up Capital : |
Rs.32320.000 Million |
|
|
|
|
CIN No.: [Company Identification
No.] |
L17110MH1973PLC019786 |
|
|
|
|
TAN No.: [Tax Deduction &
Collection Account No.] |
Not Available |
|
|
|
|
PAN No.: [Permanent Account No.] |
Not Available |
|
|
|
|
Legal Form : |
A Public Limited Liability Company. The Company’s Shares are Listed on
the Stock Exchanges. |
|
|
|
|
Line of Business
: |
Exploration and Production of Oil and Gas, Refining,
Petrochemicals (Polymers, Polyester and fibre intermediates) and Textiles. |
|
|
|
|
No. of Employees
: |
23853 (Approximately) |
RATING & COMMENTS
|
MIRA’s Rating : |
Aaa (86) |
|
RATING |
STATUS |
PROPOSED CREDIT LINE |
|
|
|
>86 |
Aaa |
Possesses an extremely sound financial base with the strongest capability
for timely payment of interest and principal sums |
Unlimited |
|
|
Maximum Credit Limit : |
USD 563000000 |
|
|
|
|
Status : |
Excellent |
|
|
|
|
Payment Behaviour : |
Regular |
|
|
|
|
Litigation : |
Exist |
|
|
|
|
Comments : |
Subject is
India’s largest private sector enterprise with businesses across the energy
and materials value chain, along with a significant presence in retail and
telecom sectors. It is the first Indian private sector company to feature in
Fortune Global 500 list of ‘World’s Largest Corporations’ and has been
consistently featuring in it for the last ten consecutive years. It is a
well-established and reputed company having excellent track record. The rating
reflects company’s leadership position in the petrochemical segment and
strong financial risk profile characterized by robust capital structure, and
highly integrated nature of operations with presence across the entire energy
value chain. Trade relations
are reported as trustworthy. Business is active. Payments are reported to be
regular and as per commitments. The company can
be considered good for normal business dealings at usual trade terms and
conditions. |
NOTES :
Any query related to this report can be made
on e-mail : infodept@mirainform.com
while quoting report number, name and date.
ECGC Country Risk Classification List – December 31, 2014
|
Country Name |
Previous Rating (30.09.2014) |
Current Rating (31.12.2014) |
|
India |
A1 |
A1 |
|
Risk Category |
ECGC
Classification |
|
Insignificant |
A1 |
|
Low |
A2 |
|
Moderate |
B1 |
|
High |
B2 |
|
Very High |
C1 |
|
Restricted |
C2 |
|
Off-credit |
D |
EXTERNAL AGENCY RATING
|
Rating Agency Name |
ICRA |
|
Rating |
Short-Term Non-Convertible Debenture Programme
= A1+ |
|
Rating Explanation |
Very strong degree of safety and carry
lowest credit risk. |
|
Date |
December, 2014 |
RBI DEFAULTERS’ LIST STATUS
Subject’s name is not enlisted as a defaulter
in the publicly available RBI Defaulters’ list.
EPF (Employee Provident Fund) DEFAULTERS’ LIST STATUS
Subject’s name is not enlisted as a defaulter
in the publicly available EPF (Employee Provident Fund) Defaulters’ list as of
31-03-2014.
LOCATIONS
|
Registered/ Corporate Office : |
3rd Floor,
Maker Chambers IV, 222, Nariman Point, Mumbai – 400021, |
|
Tel. No.: |
91-22-30325000/ 30327000/ 22785000/ 22785185 |
|
Fax No.: |
91-22-22785111/
30322268/ 22785185 |
|
E-Mail : |
|
|
Website : |
http://www.ril.com |
|
|
|
|
Head Office 1
: |
Reliance Corporate Park, Building No. 7, C-Wing, 2nd Floor, 5, TTC Industrial Area, Thane-Belapur Road, Ghansoli, Navi Mumbai – 400701, Maharashtra, India |
|
Tel. No.: |
91-22-44780912 |
|
Fax No.: |
91-22-44779050 |
|
E-Mail : |
|
|
|
|
|
Head Office 2
: |
Building No 11, 'A' Wing, Second Floor, Reliance Corporate Park (RCP), Thane-Belapur Road, Ghansoli, Navi Mumbai - 400701, Maharashtra, India |
|
|
|
|
Factories : |
·
Allahabad A/10-A/27,
UPSIDC Industrial Area, P. O. T.S.L., Allahabad - 211010, Uttar Pradesh,
India ·
Barabanki Dewa Road, P.O.
Somaiya Nagar, Barabanki - 225 123, Uttar Pradesh, India ·
Dahej P. O. Dahej, Vagra,
Bharuch - 392 130, Gujarat, India ·
Hazira Village Mora,
Bhatha P.O. Surat-Hazira Road, Surat 394 510, Gujarat, India ·
Nagothane P. O.
Petrochemicals Township, Nagothane, Raigad - 402 125, Maharashtra, India ·
Patalganga B-1 to B-5 and
A3, MIDC Industrial Area, P.O. Rasauani, Patalganga, Near Panvel, District
Raigad - 410207, Maharashtra, India ·
Vadodara P. O.
Petrochemicals, Vadodara - 391 346, Gujarat, India ·
Gadimoga Tallarevu Mandal,
East Godavari District, Gadimoga – 533463, Andhra Pradesh, India ·
Jamnagar Village Meghpar
/ Padana, Taluka Lalpur, Jamnagar – 361280, Gujarat, India ·
Hoshiarpur Dharmshala Road,
V.P.O. Chohal District Hoshiarpur - 146 024, Punjab, India ·
Nagpur Village Dahali,
Mouda Ramtek Road Tehsil Mouda – 441 104, District Nagpur Maharashtra, India. ·
Naroda 103/106, Naroda
Industrial Estate Naroda, Ahmedabad - 382 330, Gujarat, India. ·
Silvassa 342, Kharadpada,
Naroli, Near Silvassa Union Territory of Dadra and Nagar Haveli – 396235,
India |
|
|
|
|
Corporate
Communication Center : |
Maker Chambers
IV, 1st Floor, Nariman Point, Mumbai – 400021, |
|
Tel No. : |
91-22-22785568/
22785585/ 22785000 |
|
Fax No. : |
91-22-22785185 |
|
Email : |
DIRECTORS
AS ON 31.03.2014
|
Name : |
Mr. Mukesh D.
Ambani |
|
Designation : |
Chairman and Managing Director |
|
Qualification: |
Chemical Engineer from |
|
|
|
|
Name : |
Mr. Nikhil R.
Meswani |
|
Designation : |
Executive Director |
|
Qualification: |
Chemical Engineer |
|
|
|
|
Name : |
Mr. Hital R.
Meswani |
|
Designation : |
Executive Director |
|
|
|
|
Name : |
Mr. P.M.S. Prasad |
|
Designation : |
Executive Director |
|
|
|
|
Name : |
Mr. Pawan Kumar Kapil |
|
Designation : |
Executive Director |
|
|
|
|
Name : |
Mr. Ramiklal H.
Ambani |
|
Designation : |
Non-Executive Director |
|
|
|
|
Name : |
Mr. Mansingh L.
Bhakta |
|
Designation : |
Non-Executive Director |
|
|
|
|
Name : |
Mr. Yogendra P.
Trivedi |
|
Designation : |
Non-Executive Director |
|
|
|
|
Name : |
Dr. Dharam Vir
Kapur |
|
Designation : |
Non-Executive Director |
|
|
|
|
Name : |
Mr. Mahesh P.
Modi |
|
Designation : |
Non-Executive Director |
|
|
|
|
Name : |
Prof. Ashok Mishra |
|
Designation : |
Non-Executive Director |
|
|
|
|
Name : |
Prof. Dipak C. Jain |
|
Designation : |
Non-Executive Director |
|
|
|
|
Name : |
Dr. Raghunath A. Mashelkar |
|
Designation : |
Non-Executive Director |
|
|
|
|
Name : |
Mr. Adil Zainulbhai |
|
Designation : |
Non-Executive Director |
KEY EXECUTIVES
|
Name : |
Mr. Alok Agarwal |
|
Designation : |
Chief Financial Officer |
|
|
|
|
Name : |
Mr. K. Sethuraman |
|
Designation : |
Group Company Secretary and Chief Compliance Officer |
|
|
|
|
Name : |
Mr. Kanga and Company |
|
Designation : |
Solicitors and Advocates |
|
|
|
|
Audit Committee
: |
Mr. Yogendra P.
Trivedi (Chairman) Mr. Mahesh P.
Modi Dr. Raghunath A. Mashelkar Mr. Adil Zainulbhai |
|
|
|
|
Corporate Governance and Stakeholders' Interface
Committee : |
Mr. Yogendra P.
Trivedi (Chairman) Mr. Nikhil R.
Meswani Dr. Dharam Vir
Kapur Dr. Raghunath A. Mashelkar |
|
|
|
|
Finance Committee
: |
Mr. Mukesh D.
Ambani (Chairman) Mr. Nikhil R.
Meswani Mr. Hital R.
Meswani |
|
|
|
|
Health, Safety
and Environment
Committee : |
Mr. Hital R.
Meswani (Chairman) Dr. Dharam Vir
Kapur Mr. P.M.S.
Prasad Mr. Pawan Kumar
Kapil |
|
|
|
|
Stakeholders Relationship
Committee: |
Mr. Yogendra P.
Trivedi (Chairman) Mr. Nikhil R.
Meswani Mr. Hital R. Meswani Prof. Ashok Misra |
|
|
|
|
Human Resources, Nomination and
Remuneration Committee : |
Mr. Adil Zainulbhai Mr. Yogendra P. Trivedi Dr. Dharam Vir
Kapur Dr. Raghunath A. Mashelkar |
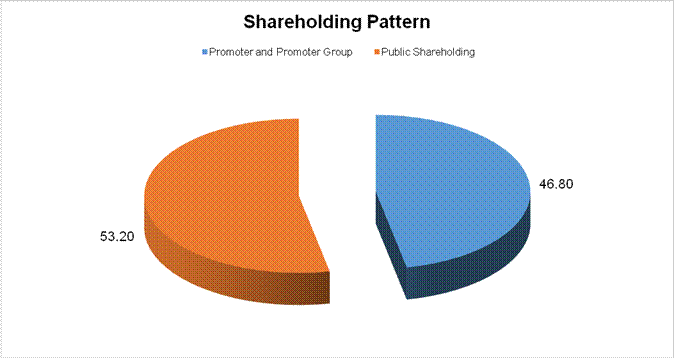
SHAREHOLDING PATTERN
AS ON 31.12.2014
|
Category of Shareholder |
No.
of Shares |
Percentage
of Holding |
|
(A) Shareholding of Promoter and Promoter
Group |
|
|
|
|
|
|
|
|
21172646 |
0.68 |
|
|
1322318328 |
42.27 |
|
|
120471003 |
3.85 |
|
|
120471003 |
3.85 |
|
|
1463961977 |
46.80 |
|
|
|
|
|
Total shareholding of Promoter and Promoter
Group (A) |
1463961977 |
46.80 |
|
(B) Public Shareholding |
|
|
|
|
|
|
|
|
73943397 |
2.36 |
|
|
4985325 |
0.16 |
|
|
3915881 |
0.13 |
|
|
305529499 |
9.77 |
|
|
611394357 |
19.55 |
|
|
999768459 |
31.96 |
|
|
|
|
|
|
116688127 |
3.73 |
|
|
|
|
|
|
320525953 |
10.25 |
|
|
26870265 |
0.86 |
|
|
200249870 |
6.40 |
|
|
20211628 |
0.65 |
|
|
1988978 |
0.06 |
|
|
171883624 |
5.49 |
|
|
6165640 |
0.20 |
|
|
664334215 |
21.24 |
|
Total Public shareholding (B) |
1664102674 |
53.20 |
|
Total (A)+(B) |
3128064651 |
100.00 |
|
(C) Shares held by Custodians and against
which Depository Receipts have been issued |
|
|
|
|
0 |
0.00 |
|
|
107005290 |
0.00 |
|
|
107005290 |
0.00 |
|
Total (A)+(B)+(C) |
3235069941 |
100.00 |
BUSINESS DETAILS
|
Line of Business : |
Exploration and Production of Oil and Gas, Refining,
Petrochemicals (Polymers, Polyester and fibre intermediates) and Textiles. |
||||||||||
|
|
|
||||||||||
|
Products : |
|
||||||||||
|
|
|
||||||||||
|
Brand Names : |
· Reliance Gas · Reliance Aviation · Repol · Relene · Reon · Relpipe · Relpipe PP-R · Relflex™ Elastomers · Relflex™ Cisamer PBR · Relflex™ Stylamer SBR · Relab · Recron® · Recron® IDY · Recron® SHT · Recron® Fancyy · Recron® · Stretch · Recron® · Cotluk · Recron® · Dyefast · Recron® · Superblack · Recron® · Superdye · Recron® · Kooltex · Recron® · Fibrefill etc. |
||||||||||
|
|
|
||||||||||
|
Agencies Held : |
-- |
||||||||||
|
|
|
||||||||||
|
Exports : |
Not Available |
||||||||||
|
|
|
||||||||||
|
Imports : |
Not Available |
||||||||||
|
|
|
||||||||||
|
Terms : |
Not Available |
PRODUCTION STATUS: NOT AVAILABLE
GENERAL INFORMATION
|
Suppliers : |
|
|||||||||||||||||||||||||||||||||||||||||||||
|
|
|
|||||||||||||||||||||||||||||||||||||||||||||
|
Customers : |
|
|||||||||||||||||||||||||||||||||||||||||||||
|
|
|
|||||||||||||||||||||||||||||||||||||||||||||
|
No. of Employees : |
23853 (Approximately) |
|||||||||||||||||||||||||||||||||||||||||||||
|
|
|
|||||||||||||||||||||||||||||||||||||||||||||
|
Bankers : |
·
Allahabad Bank ·
Andhra Bank ·
Bank of ·
Bank of ·
Bank of ·
Bank of ·
Canara Bank ·
Central Bank of ·
Citibank N.A ·
Credit Agricole Corporate and Investment Bank ·
Corporation Bank ·
Deutsche Bank ·
The Hong Kong and ·
Corporation Limited ·
HDFC Bank Limited ·
ICICI Bank Limited ·
IDBI Bank Limited ·
Indian Bank ·
Indian Overseas Bank ·
Oriental Bank of Commerce ·
Punjab National Bank ·
Standard Chartered Bank ·
State Bank of ·
State Bank of ·
State Bank of ·
Syndicate Bank ·
The Royal Bank of ·
Union Bank of ·
Vijaya Bank |
|||||||||||||||||||||||||||||||||||||||||||||
|
|
|
|||||||||||||||||||||||||||||||||||||||||||||
|
Facilities : |
|
|||||||||||||||||||||||||||||||||||||||||||||
|
|
|
|
Auditors 1 : |
|
|
Name : |
Chaturvedi and Shah Chartered Accountants |
|
|
|
|
Auditors 2 : |
|
|
Name : |
Rajendra and Company Chartered Accountants |
|
|
|
|
Auditors 3 : |
|
|
Name : |
Deloitte Haskins and Sells Chartered Accountants |
|
|
|
|
Solicitors &
Advocates : |
Kanga and Company |
|
|
|
|
Subsidiary Companies : |
· Reliance Industrial Investments and Holdings Limited · Reliance Ventures Limited · Reliance Strategic Investments Limited · Reliance Industries (Middle East) DMCC · Reliance Retail Limited (Erstwhile, amalgamated with Reliance Fresh Limited w.e.f. 01.04.2012) · Reliance Retail Limited (Formerly known as Reliance Fresh Limited) · Reliance Haryana SEZ Limited · Retail Concepts and Services (India) Limited (amalgamated with Reliance Financial Distribution and Advisory Services Limited w.e.f. 01.04.2012) · Reliance Retail Insurance Broking Limited · Reliance Dairy Foods Limited · Reliance Exploration and Production DMCC · Reliance Retail Finance Limited · RESQ Limited (amalgamated with Erstwhile Reliance Fresh Limited w.e.f. 01.04.2012) · Reliance Retail Ventures Limited # · Reliance Digital Retail Limited (amalgamated with Erstwhile Reliance Trends Limited w.e.f. 01.04.2012) · Reliance Financial Distribution and Advisory Services Limited · RIL (Australia) Pty Limited · Gapco Kenya Limited · Gapco Rwanda Limited · Gapco Tanzania Limited · Gapco Uganda Limited · Gapoil (Zanzibar) Limited · Gulf Africa Petroleum Corporation · Transenergy Kenya Limited · Recron (Malaysia) Sdn Bhd · Reliance Payment Solutions Limited · Reliance Brands Limited · Reliance Footprint Limited (amalgamated with Erstwhile Reliance Trends Limited w.e.f. 01.04.2012) · Reliance Trading Limited ## · Reliance Lifestyle Holdings Limited · Reliance Universal Ventures Limited (amalgamated with Reliance Industrial Investments and Holdings Limited w.e.f. 01.10.2013) · Delight Proteins Limited · Reliance Autozone Limited (amalgamated with Erstwhile Reliance Fresh Limited w.e.f. 01.04.2012) · Reliance F&B Services Limited · Reliance Gems and Jewels Limited (amalgamated with Erstwhile Reliance Trends Limited w.e.f. 01.04.2012) · Reliance Integrated Agri Solutions Limited (amalgamated with Reliance Financial Distribution and Advisory Services Limited w.e.f. 01.04.2012) · Strategic Manpower Solutions Limited · Reliance Agri Products Distribution Limited (amalgamated with Reliance Financial Distribution and Advisory Services Limited w.e.f. 01.04.2012) · Reliance Digital Media Limited (amalgamated with Erstwhile Reliance Fresh Limited w.e.f. 01.04.2012) · Reliance Food Processing Solutions Limited · Reliance Home Store Limited (amalgamated with Reliance Financial Distribution and Advisory Services Limited w.e.f. 01.04.2012) · Reliance Leisures Limited (amalgamated with Erstwhile Reliance Trends Limited w.e.f. 01.04.2012) · Reliance Loyalty and Analytics Limited (amalgamated with Reliance Financial Distribution and Advisory Services Limited w.e.f. 01.04.2012) · Reliance Retail Securities and Broking Company Limited (amalgamated with Reliance Financial Distribution and Advisory Services Limited w.e.f. 01.04.2012) · Reliance Supply Chain Solutions Limited (amalgamated with Reliance Financial Distribution and Advisory Services Limited w.e.f. 01.04.2012) · Reliance Trade Services Centre Limited (amalgamated with Reliance Financial Distribution and Advisory Services Limited w.e.f. 01.04.2012) · Reliance Vantage Retail Limited · Wave Land Developers Limited · Reliance-GrandOptical Private Limited · Reliance Universal Commercial Limited · Reliance Petroinvestments Limited · Reliance Global Commercial Limited · Reliance People Serve Limited · Reliance Infrastructure Management Services Limited · Reliance Global Business B.V. · Reliance Gas Corporation Limited · Reliance Global Energy Services Limited · Kanhatech Solutions Limited · Reliance Global Energy Services (Singapore) Pte. Limited · Reliance Personal Electronics Limited (amalgamated with Reliance Financial Distribution and Advisory Services Limited w.e.f. 01.04.2012) · Reliance Polymers (India) Limited (amalgamated with Reliance Industrial Investments and Holdings Limited w.e.f. 01.10.2013) · Reliance Polyole"ns Limited · Reliance Aromatics and Petrochemicals Limited · Reliance Energy and Project Development Limited · Reliance Chemicals Limited · Reliance Universal Enterprises Limited · Reliance Review Cinema Limited · Reliance Replay Gaming Limited (amalgamated with Erstwhile Reliance Fresh Limited w.e.f. 01.04.2012) · Reliance Nutritious Food Products Limited* · RIL USA Inc. · Reliance Commercial Land and Infrastructure Limited · Reliance Corporate IT Park Limited · Reliance Eminent Trading and Commercial Private Limited · Reliance Progressive Traders Private Limited · Reliance Proli"c Traders Private Limited · Reliance Universal Traders Private Limited · Reliance Proli"c Commercial Private Limited · Reliance Comtrade Private Limited · Reliance Ambit Trade Private Limited · Reliance Petro Marketing Limited · LPG Infrastructure (India) Limited · Reliance Corporate Centre Limited · Reliance Convention and Exhibition Centre Limited · Central Park Enterprises DMCC · Reliance International B. V. (Liquidated w.e.f. 18.03.2014) · Reliance Corporate Services Limited · Indiawin Sports Private Limited · Reliance Holding USA Inc. · Reliance Marcellus LLC · Reliance Jio Infocomm Limited · Reliance Strategic (Mauritius) Limited · Reliance Eagleford Midstream LLC · Reliance Eagleford Upstream LLC · Reliance Eagleford Upstream GP LLC · Reliance Eagleford Upstream Holding LP · Mark Project Services Private Limited · Reliance Energy Generation and Distribution Limited · Reliance Marcellus II LLC · Reliance Security Solutions Limited · Reliance Industries Investment and Holding Limited · Reliance O$ce Solutions Private Limited (amalgamated with Reliance Financial Distribution and Advisory Services Limited w.e.f. 01.04.2012) · Reliance Style Fashion India Private Limited · GenNext Innovation Ventures Limited · Reliance Home Products Limited (amalgamated with Reliance Financial Distribution and Advisory Services Limited w.e.f. 01.04.2012) · Infotel Telecom Limited · Reliance Styles India Limited · Rancore Technologies Private Limited · Omni Symmetry LLC (amalgamated with Reliance Jio Infocomm USA Inc w.e.f. 31.03.2014) · Reliance Sibur Elastomers Private Limited · Surela Investment and Trading Private Limited · Model Economic Township Limited · Delta Corp East Africa Limited · Delta Square Limited (Desubsidiarized w.e.f. 20.08.2013) · Kaizen Capital LLP · A$nity Names Inc · Reliance USA Gas Marketing LLC · Reliance Aerospace Technologies Limited · Reliance Gas Pipelines Limited · Achman Commercial Private Limited · Reliance Jio Infocomm Pte Limited · Reliance do Brasil Industria e Comercio de Produtos Texteis, Quimicos, Petroquimicos e Derivados Ltda. · Reliance Jio Electronics Private Limited · Reliance Jio Infocomm USA Inc · Reliance Jio Infocomm UK Limited · Reliance Clothing India Private Limited · Reliance Agri Ventures Private Limited · Reliance World Trade Private Limited · Reliance Marcellus Holding LLC |
|
|
|
|
Associates : |
·
Reliance Industrial Infrastructure Limited ·
Reliance Europe Limited ·
Reliance LNG Limited ·
Indian Vaccines Corporation Limited ·
Gujarat Chemical Port Terminal Company Limited ·
Reliance Utilities and Power Private Limited ·
Reliance Utilities Private Limited ·
Reliance Ports and Terminals Limited ·
Reliance Gas Transportation Infrastructure
Limited ·
Reliance Commercial Dealers Limited |
|
|
|
|
Enterprises over which Key Managerial Personnel are able to exercise
significant influence : |
· Dhirubhai Ambani Foundation · Jamnaben Hirachand Ambani Foundation · Hirachand Govardhandas Ambani Public Charitable Trust · HNH Trust and HNH Research Society · Reliance Foundation |
CAPITAL STRUCTURE
AS ON 18.06.2014
Authorised Capital : Rs.60000.000 Million
Issued, Subscribed & Paid-up Capital : Rs.32355.197
Million
AS ON 31.03.2014
Authorised Capital :
|
No. of Shares |
Type |
Value |
Amount |
|
|
|
|
|
|
5000000000 |
Equity Shares |
Rs.10/- each |
Rs. 50000.000 Million |
|
1000000000 |
Preference Shares |
Rs.10/- each |
Rs. 10000.000 Million |
|
|
|
|
|
|
|
Total |
|
Rs. 60000.000
Million |
Issued, Subscribed & Paid-up Capital :
|
No. of Shares |
Type |
Value |
Amount |
|
|
|
|
|
|
3231901858 |
Equity Shares |
Rs.10/- each |
Rs. 32320.000 Million |
|
|
|
|
|
1)
1626793078
Shares
were allotted as Bonus Shares in the last five years by capitalisation of
Securities Premium and Reserves.
2) 69252623 Shares were allotted in the last five years pursuant to the Scheme of amalgamation with Reliance Petroleum Limited without payments being received in cash.
3)
450427345
Shares
were allotted on conversion / surrender of Debentures and Bonds, conversion of
Term Loans, exercise of warrants, against Global Depository Shares (GDS) and
re-issue of forfeited equity shares, since inception.
4)
171883624
Shares held by Subsidiaries do not have Voting Rights and are not eligible for
Bonus Shares
5)
46246280
Shares were bought back and extinguished in the last five years.
The details of
Shareholders holding more than 5% shares:
|
Name of the
Shareholder |
31st
March, 2014 |
|
|
|
No.
of Shares |
%
held |
|
Life Insurance Corporation of India |
26,35,20,679 |
8.15 |
The reconciliation
of the number of shares outstanding is set out below:
|
Particulars |
31st
March, 2014 No.
of Shares |
|
Equity Shares at the beginning of the year |
322,86,63,382 |
|
Add : Shares issued on exercise of Employee Stock Options |
32,38,476 |
|
Less : Shares cancelled on buy back of Equity Shares |
-- |
|
Equity Shares at the end of the year |
323,19,01,858 |
The Company has reserved issuance of 13,05,05,114 (Previous year 13,37,43,590)
Equity Shares of Rs.10 each for offering to eligible employees of the Company
and its subsidiaries under Employees Stock Option Scheme (ESOS). During the
year, the Company has granted 60,866 (Previous Year NIL) options to the
eligible employees at a price of ` 860 per option plus all applicable taxes, as
may be levied in this regard on the Company. The options would vest over a
maximum period of 7 years or such other period as may be decided by the Human
Resources, Nomination and Remuneration Committee from the date of grant based
on specified criteria.
Share application money pending allotment represents application money
received on account of Employees Stock Option Scheme.
FINANCIAL DATA
[all figures are
in Rupees Million]
ABRIDGED BALANCE
SHEET
|
SOURCES OF FUNDS |
31.03.2014 |
31.03.2013 |
31.03.2012 |
|
I.
EQUITY AND LIABILITIES |
|
|
|
|
(1)Shareholders' Funds |
|
|
|
|
(a) Share Capital |
32320.000 |
32290.000 |
32710.000 |
|
(b) Reserves & Surplus |
1938420.000 |
1767660.000 |
1628250.000 |
|
(c) Money received against share warrants |
0.000 |
0.000 |
0.000 |
|
|
|
|
|
|
(2) Share
Application money pending allotment |
170.000 |
250.000 |
0.000 |
|
Total
Shareholders’ Funds (1) + (2) |
1970910.000 |
1800200.000 |
1660960.000 |
|
|
|
|
|
|
(3)
Non-Current Liabilities |
|
|
|
|
(a) Long-term borrowings |
627110.000 |
430120.000 |
480340.000 |
|
(b) Deferred tax liabilities (Net) |
122150.000 |
121930.000 |
121220.000 |
|
(c)
Other long term liabilities |
0.000 |
0.000 |
0.000 |
|
(d)
long-term provisions |
0.000 |
0.000 |
0.000 |
|
Total
Non-current Liabilities (3) |
749260.000 |
552050.000 |
601560.000 |
|
|
|
|
|
|
(4) Current Liabilities |
|
|
|
|
(a)
Short term borrowings |
227700.000 |
115110.000 |
105930.000 |
|
(b)
Trade payables |
578620.000 |
457870.000 |
403240.000 |
|
(c)
Other current liabilities |
107670.000 |
216400.000 |
137130.000 |
|
(d)
Short-term provisions |
41670.000 |
43480.000 |
42580.000 |
|
Total
Current Liabilities (4) |
955660.000 |
832860.000 |
688880.000 |
|
|
|
|
|
|
TOTAL |
3675830.000 |
3185110.000 |
2951400.000 |
|
|
|
|
|
|
II.
ASSETS |
|
|
|
|
(1) Non-current assets |
|
|
|
|
(a)
Fixed Assets |
|
|
|
|
(i)
Tangible assets |
804240.000 |
829620.000 |
880010.000 |
|
(ii)
Intangible Assets |
289820.000 |
267860.000 |
257220.000 |
|
(iii)
Capital work-in-progress |
326730.000 |
135250.000 |
36950.000 |
|
(iv) Intangible assets under development |
90430.000 |
55910.000 |
40590.000 |
|
(b) Non-current Investments |
526920.000 |
241430.000 |
269790.000 |
|
(c) Deferred tax assets
(net) |
0.000 |
0.000 |
0.000 |
|
(d) Long-term Loan
and Advances |
284360.000 |
215280.000 |
143400.000 |
|
(e)
Other Non-current assets |
0.000 |
0.000 |
0.000 |
|
Total
Non-Current Assets |
2322500.000 |
1745350.000 |
1627960.000 |
|
|
|
|
|
|
(2) Current assets |
|
|
|
|
(a)
Current investments |
333700.000 |
283660.000 |
270290.000 |
|
(b)
Inventories |
429320.000 |
427290.000 |
359550.000 |
|
(c)
Trade receivables |
106640.000 |
118800.000 |
184240.000 |
|
(d)
Cash and cash equivalents |
366240.000 |
495470.000 |
395980.000 |
|
(e)
Short-term loans and advances |
112770.000 |
109740.000 |
110890.000 |
|
(f)
Other current assets |
4660.000 |
4800.000 |
2490.000 |
|
Total
Current Assets |
1353330.000 |
1439760.000 |
1323440.000 |
|
|
|
|
|
|
TOTAL |
3675830.000 |
3185110.000 |
2951400.000 |
PROFIT & LOSS
ACCOUNT
|
|
PARTICULARS |
31.03.2014 |
31.03.2013 |
31.03.2012 |
|
|
|
SALES |
|
|
|
|
|
|
|
Income |
3901170.000 |
3602970.000 |
3299040.000 |
|
|
|
Other Income |
89360.000 |
79980.000 |
61920.000 |
|
|
|
TOTAL (A) |
3990530.000 |
3682950.000 |
3360960.000 |
|
|
|
|
|
|
|
|
Less |
EXPENSES |
|
|
|
|
|
|
|
Cost of Materials Consumed |
3293130.000 |
3061270.000 |
2748140.000 |
|
|
|
Purchases of Stock-in-Trade |
5240.000 |
5020.000 |
14410.000 |
|
|
|
Changes in inventories of finished goods, work-in-progress
and Stock-in-Trade |
4120.000 |
(33170.000) |
(8720.000) |
|
|
|
Employees benefits expense |
33700.000 |
33540.000 |
28620.000 |
|
|
|
Other expenses |
256210.000 |
228440.000 |
180400.000 |
|
|
|
TOTAL (B) |
3592400.000 |
3295100.000 |
2962850.000 |
|
|
|
|
|
|
|
|
|
PROFIT
BEFORE INTEREST, TAX, DEPRECIATION AND AMORTISATION (A-B) (C) |
398130.000 |
387850.000 |
398110.000 |
|
|
|
|
|
|
|
|
|
Less |
FINANCIAL
EXPENSES (D) |
32060.000 |
30360.000 |
26670.000 |
|
|
|
|
|
|
|
|
|
|
PROFIT
BEFORE TAX, DEPRECIATION AND AMORTISATION (C-D) (E) |
366070.000 |
357490.000 |
371440.000 |
|
|
|
|
|
|
|
|
|
Less/ Add |
DEPRECIATION/
AMORTISATION (F) |
87890.000 |
94650.000 |
113940.000 |
|
|
|
|
|
|
|
|
|
|
PROFIT BEFORE
TAX (E-F) (G) |
278180.000 |
262840.000 |
257500.000 |
|
|
|
|
|
|
|
|
|
Less |
TAX (H) |
58340.000 |
52810.000 |
57100.000 |
|
|
|
|
|
|
|
|
|
|
PROFIT AFTER TAX
(G-H) (I) |
219840.000 |
210030.000 |
200400.000 |
|
|
|
|
|
|
|
|
|
|
EARNINGS IN
FOREIGN CURRENCY |
|
|
|
|
|
|
|
FOB Value for Exports |
2611180.000 |
2278830.000 |
1982690.000 |
|
|
|
Interest Earnings |
50.000 |
20.000 |
10.000 |
|
|
|
Other Earnings |
2430.000 |
2070.000 |
2040.000 |
|
|
TOTAL EARNINGS |
2613660.000 |
2280920.000 |
1984740.000 |
|
|
|
|
|
|
|
|
|
|
IMPORTS |
|
|
|
|
|
|
|
Raw Materials and Stock-in-Trade |
3026300.000 |
2817190.000 |
2542480.000 |
|
|
|
Stores, Chemicals and Packing Materials |
37190.000 |
32600.000 |
31200.000 |
|
|
|
Capital goods |
42180.000 |
22040.000 |
3250.000 |
|
|
TOTAL IMPORTS |
3105670.000 |
2871830.000 |
2576930.000 |
|
|
|
|
|
|
|
|
|
|
Earnings Per
Share (Rs.) |
68.05 |
64.82 |
61.21 |
|
QUARTERLY RESULTS
|
PARTICULARS |
30.06.2014 |
30.09.2014 |
31.12.2014 |
|
Type |
1st
Quarter |
2nd
Quarter |
3rd
Quarter |
|
Net Sales |
963510.000 |
964860.000 |
801960.000 |
|
Total Expenditure |
888210.000 |
882510.000 |
729880.000 |
|
PBIDT (Excl OI) |
75300.000 |
82350.000 |
72080.000 |
|
Other Income |
20460.000 |
21400.000 |
24020.000 |
|
Operating Profit |
95760.000 |
103750.000 |
96100.000 |
|
Interest |
3240.000 |
7580.000 |
8810.000 |
|
Exceptional Items |
0.000 |
0.000 |
0.000 |
|
PBDT |
92520.000 |
96170.000 |
87290.000 |
|
Depreciation |
20240.000 |
22270.000 |
21050.000 |
|
Profit Before Tax |
72280.000 |
73900.000 |
66240.000 |
|
Tax |
15790.000 |
16480.000 |
15390.000 |
|
Provisions and contingencies |
0.000 |
0.000 |
0.000 |
|
Profit After Tax |
56490.000 |
57420.000 |
50850.000 |
|
Extraordinary Items |
0.000 |
0.000 |
0.000 |
|
Prior Period Expenses |
0.000 |
0.000 |
0.000 |
|
Other Adjustments |
0.000 |
0.000 |
0.000 |
|
Net Profit |
56490.000 |
57420.000 |
50850.000 |
KEY RATIOS
|
PARTICULARS |
|
31.03.2014 |
31.03.2013 |
31.03.2012 |
|
Net Profit Margin (PAT/Sales) |
(%) |
5.64 |
5.83 |
6.07 |
|
|
|
|
|
|
|
Operating Profit Margin (PBDIT/Sales) |
(%) |
10.21 |
10.76 |
12.07 |
|
|
|
|
|
|
|
Return on Total Assets (PBT/Total Assets} |
(%) |
10.18 |
9.55 |
9.89 |
|
|
|
|
|
|
|
Return on Investment (ROI) (PBT/Networth) |
|
0.14 |
0.15 |
0.16 |
|
|
|
|
|
|
|
Debt Equity Ratio (Total Debt/Networth) |
|
0.43 |
0.30 |
0.35 |
|
|
|
|
|
|
|
Current Ratio (Current Asset/Current Liability) |
|
1.42 |
1.73 |
1.92 |
FINANCIAL ANALYSIS
[all figures are
in Rupees Million]
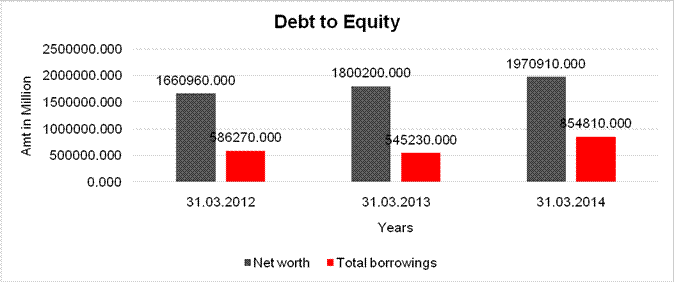
DEBT EQUITY RATIO
|
Particulars |
31.03.2012 |
31.03.2013 |
31.03.2014 |
|
|
(Rs.
In Million) |
(Rs.
In Million) |
(Rs.
In Million) |
|
Share Capital |
32710.000 |
32290.000 |
32320.000 |
|
Reserves & Surplus |
1628250.000 |
1767660.000 |
1938420.000 |
|
Share Application money pending allotment |
0.000 |
250.000 |
170.000 |
|
Net
worth |
1660960.000 |
1800200.000 |
1970910.000 |
|
|
|
|
|
|
Long-term borrowings |
480340.000 |
430120.000 |
627110.000 |
|
Short term borrowings |
105930.000 |
115110.000 |
227700.000 |
|
Total
borrowings |
586270.000 |
545230.000 |
854810.000 |
|
Debt/Equity
ratio |
0.353 |
0.303 |
0.434 |
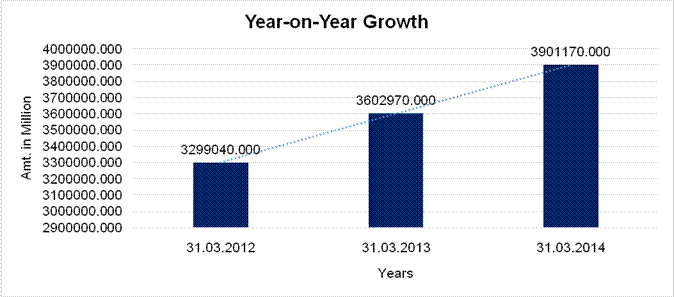
YEAR-ON-YEAR GROWTH
|
Year
on Year Growth |
31.03.2012 |
31.03.2013 |
31.03.2014 |
|
|
(Rs.
In Million) |
(Rs.
In Million) |
(Rs.
In Million) |
|
Sales |
3299040.000 |
3602970.000 |
3901170.000 |
|
|
|
9.213 |
8.277 |
NET PROFIT MARGIN
|
Net
Profit Margin |
31.03.2012 |
31.03.2013 |
31.03.2014 |
|
|
(Rs.
In Million) |
(Rs.
In Million) |
(Rs.
In Million) |
|
Sales |
3299040.000 |
3602970.000 |
3901170.000 |
|
Profit |
200400.000 |
210030.000 |
219840.000 |
|
|
6.07% |
5.83% |
5.64% |
LOCAL AGENCY FURTHER INFORMATION
|
Sr. No. |
Check List by Info Agents |
Available in
Report (Yes / No) |
|
1] |
Year of Establishment |
Yes |
|
2] |
Locality of the firm |
Yes |
|
3] |
Constitutions of the firm |
Yes |
|
4] |
Premises details |
No |
|
5] |
Type of Business |
Yes |
|
6] |
Line of Business |
Yes |
|
7] |
Promoter's background |
Yes |
|
8] |
No. of employees |
Yes |
|
9] |
Name of person contacted |
No |
|
10] |
Designation of contact
person |
No |
|
11] |
Turnover of firm for last
three years |
Yes |
|
12] |
Profitability for last
three years |
Yes |
|
13] |
Reasons for variation
<> 20% |
---------------------- |
|
14] |
Estimation for coming
financial year |
No |
|
15] |
Capital in the business |
Yes |
|
16] |
Details of sister
concerns |
Yes |
|
17] |
Major suppliers |
No |
|
18] |
Major customers |
No |
|
19] |
Payments terms |
No |
|
20] |
Export / Import details
(if applicable) |
No |
|
21] |
Market information |
---------------------- |
|
22] |
Litigations that the firm
/ promoter involved in |
Yes |
|
23] |
Banking Details |
Yes |
|
24] |
Banking facility details |
Yes |
|
25] |
Conduct of the banking
account |
---------------------- |
|
26] |
Buyer visit details |
---------------------- |
|
27] |
Financials, if provided |
Yes |
|
28] |
Incorporation details, if
applicable |
Yes |
|
29] |
Last accounts filed at
ROC |
Yes |
|
30] |
Major Shareholders, if
available |
Yes |
|
31] |
Date of Birth of Proprietor/Partner/Director,
if available |
No |
|
32] |
PAN of
Proprietor/Partner/Director, if available |
No |
|
33] |
Voter ID No of
Proprietor/Partner/Director, if available |
No |
|
34] |
External Agency Rating,
if available |
Yes |
LITIGATION
DETAILS:
|
LITIGATION DETAILS |
||||
|
Bench:- Bombay |
||||
|
Presentation Date:- |
23.07.2014 |
|||
|
Lodging
No.: ITXAL/1398/2014 Filing Date: 23.07.2014 Reg. No.:
ITXA/1601/2014 Reg. Date: 01.11.2014 |
||||
|
Petitioner:- |
THE COMMISSSIONER OF INCOME TAX |
Respondent:- |
RELIANCE INDUSTRIES LIMITED |
|
|
Petn.Adv:- |
A R MALHOTRA (I3164) |
Resp. Adv.:- |
RAJ BANSHILAL DARAK (I5522) |
|
|
District:- |
MUMBAI |
|||
|
Bench:- |
DIVISION |
|
|
|
|
Status:- |
Pre-Admission |
Category:- |
TAX APPEALS |
|
|
Next Date:- |
24.04.2015 |
Stage : |
FOR ADMISSION |
|
|
Coram:- |
ACCORDING TO SITTING LIST ACCORDING TO SITTING LIST |
|||
|
Act :- |
Income Tax Act, 1961 |
Under
Section:- 260A |
||
UNSECURED LOANS
|
PARTICULARS |
31.03.2014 (Rs. In Million) |
31.03.2013 (Rs. In Million) |
|
LONG TERM
BORROWINGS |
|
|
|
Bonds |
99410.000 |
90660.000 |
|
Term Loans- from banks |
512110.000 |
319510.000 |
|
Deferred payment liabilities |
30.000 |
60.000 |
|
SHORT TERM
BORROWINGS |
|
|
|
Other Loans and
Advances |
|
|
|
From Banks |
|
|
|
Foreign Currency Loans - Buyers/Packing credit |
135820.000 |
109780.000 |
|
Rupee Loans |
0.000 |
1000.000 |
|
|
|
|
|
Total |
747370.000 |
521010.000 |
RESULTS OF OPERATIONS
Operating in a volatile and
uncertain environment, the Company demonstrated the resilience of its business
model. The Company’s best-in-class refining configuration and integrated petrochemical
business enabled it to deliver robust profits in the financial year 2013-14.
The highlights of the Company’s performance are as under:
·
Revenue from operations increased by 8.1% to Rs.4013020.000 Million
($ 67.0 billion)
·
Exports increased by 15.3% to Rs.2758250.000 Million
($ 46.0 billion)
·
PBDIT increased by 2.7% at Rs.398130.000 Million ($ 6.6 billion)
·
Profit Before Tax increased by 5.8% at Rs.278180.000 Million
($ 4.6 billion)
·
Cash Profit increased by 1.0% to Rs.307950.000 Million
($ 5.1 billion)
·
Net
profit increased by 4.7% to Rs.219840.000 Million ($ 3.7 billion)
·
Gross Refining Margin was $ 8.1 / BBL for the year
ended March 31, 2014.
The consolidated revenue
from operations of the Company for the year ended March 31, 2014 was
Rs.4463390.000 Million ($ 74.5 billion), an increase of 9.3% on a year-on-year
basis.
The Company is one of
India’s largest contributors to the national exchequer primarily by way of
payment of taxes and duties to various government agencies. During the year, a
total of Rs.313740.000 Million ($ 5.2 billion) was paid in the form of various
taxes and duties.
The Company featured in the
Fortune Global 500 list of the world’s largest corporations for the tenth
consecutive year and was ranked 107th in terms of revenues and 128th in terms
of profits.
MANAGEMENT’S
DISCUSSION AND ANALYSIS
OVERVIEW
The global economy began its modest recovery in FY 2013-14 with improved
demand from OECD economies in the second half of 2013. While the trend is expected
to accelerate in the current year, the positive outlook is subdued by the
potential consequences of ‘tapering’ of some of the US Federal Reserve’s
Quantitative Easing (QE) policies which were undertaken in the aftermath of
global financial crises. Emerging markets like India faced multiple challenges:
capital outflows, intense exchange rate pressures and volatile current account
movement. A combination of persistent intention, fiscal imbalances, external
sector vulnerabilities and low investments resulted in sluggish domestic demand
growth. Fiscal and monetary initiatives taken by the Indian government and the
Reserve Bank of India (RBI) helped stabilise financial market conditions, but
the domestic macro-economic environment still remains challenging.
Economic recovery in the US and Europe had a positive impact on oil
demand, which increased by 1.3 million barrels per day (MMBPD) in 2013. Crude
oil prices fluctuated extensively, driven by supply concerns in Libya, South
Sudan, West Africa and Iraq. Higher US shale oil production helped offset the
impact of these disruptions with Brent crude oil prices averaging marginally
lower at $ 108.7 per barrel in 2013.
Operating in a volatile and uncertain environment, Reliance Industries
Limited (RIL) demonstrated the resilience of its business model. RIL’s
best-in-class raining configuration and integrated petrochemical business
enabled it to deliver robust profits in FY 2013-14. The Company achieved:
·
Highest
ever Revenue of Rs.4013020.000 Million ($ 67.0 billion) and Net profit of
Rs.219840.000 Million ($ 3.7 billion)
·
Record
Exports of Rs.2758250.000 Million ($ 46.0 billion)
·
Record
Refining business EBIT Rs.132200.000 Million ($ 2.2 billion)
·
Highest
ever consolidated Revenue and Net profit of Rs.4463390.000 Million ($ 74.5
billion) and Rs.224930.000 Million ($ 3.8 billion) respectively
·
Dividend
of 95%, highest ever pay-out of Rs.32680.000 Million ($ 545 million).
Operationally, downstream
segments continued to deliver superior performance with operating rates of over
100%. RIL processed 68.0 million tonnes (MMT) of crude oil at its Jamnagar
refinery complex. The KG-D6 (JV) facility produced 2.31 million barrels (MMBL)
of crude and condensate and 178.3 billion cubic feet (BCF) of natural gas.
RIL’s share of gross JV production in US Shale was 154 BCFe in 2013 reflecting
a growth of 52% over previous year.
The Company featured in the
Fortune Global 500 list of the world’s largest corporations for the tenth
consecutive year and was ranked 107th in terms of revenues and 128th
in terms of profits.
BUSINESS PERFORMANCE
REFINING AND MARKETING
MARKET ENVIRONMENT AND OUTLOOK – GLOBAL
CRUDE OIL
Oil markets broadly followed trends of recent years and prices remained
within the range established therein.
New refining capacity in the Middle East, Asia and increased utilisation
of the resurgent US industry led to a weaker refining margin environment.
However, the flexibility and capability in the Reliance system in terms of
feedstock run, product flexibility and efficient product placement, coupled
with a weaker rupee allowed R&M to deliver a record performance in FY
2013-14.
GLOBAL ECONOMY AND OIL DEMAND
The macro-economic environment began to show signs of recovery, led by
the OECD countries. Major economic indicators from USA demonstrated positive
sentiments and the country posted strong GDP numbers across the quarters. The
EU zone, which had witnessed a recession in 2012, recovered in 2013-14.
Emerging markets in contrast struggled to sustain their high growth rates and
deal with inflationary pressures. China in particular looks to have moved to a
more moderate growth path.
Against this mildly positive economic backdrop, oil demand grew by 1.3
MMBPD to 91.4 MMBPD. Non-OECD countries led by China contributed to almost the
entire oil demand growth. Relatively sluggish economic activity and increasing
energy efficiency has led to a decline in absolute demand in developed
economies.
OIL SUPPLY
On the supply side, overall supply increased by 0.6 MMBPD, led by
Non-OPEC supply which grew by 1.3 MMBPD during 2013 reducing the call on OPEC.
Geo-political tension and social unrest in several major oil exporting
countries in the Middle East and Africa impacted oil supplies. As a result,
there were periods when over 3 MMBPD were removed from the market.
The US shale oil revolution has led to a surge in the North American oil
production, contributing significantly to the OECD oil supplies. In 2013, US
oil production (including NGLs) increased by 1 MMBPD to 10.3 MMBPD,
contributing to fundamental changes in global oil trade flows. The increased US
oil production is replacing Latin American and West African crude imports into
US, resulting in increased flows to Asia.
OIL PRICES
Countervailing factors impacted oil markets in 2013. The geo-political
environment continued to remain volatile leading to supply disruptions. Despite
reduced call on OPEC, geo-political concerns on supply outlook together with
actual disruptions, kept Brent oil prices in the $ 90 to $ 115 per barrel range
that has been established over recent years.
Some de-bottlenecking in crude transportation infrastructure, including
huge growth in rail facilities, partly helped US crude prices recover versus
Brent and Dubai. However, WTI is likely to continue to trade at a discount to
global benchmarks due to infrastructure and regulatory constraints. In FY
2013-14, Brent to WTI crude differential narrowed to $ 8.6/bbl as compared to $
18.1/bbl in FY 2012-13.
REFINING MARGINS
The dominant impact on global margins and trade flows was the increase
in US product exports, mainly as a result of higher operating rates, ramp-up of
new facilities and addition of some simple refining capacity. New capacity also
came on-stream in China and in the Middle East – with the Jubail refinery
ramping up production during the year.
On the positive side - impact of material closures in the Atlantic
region last year, high incidences of unplanned outages and delayed
commissioning of refineries, provided some support to margins. Demand for
refined products was also higher than estimates at the beginning of the year.
On an annualised basis margins were weaker as compared to the previous year.
The year witnessed significant divergence in regional margins. US
refineries benefitted from low energy and cheap feedstock prices. While the
narrowing of Brent- WTI differential had a negative impact, absolute refining
margins in the US continue to be at high levels. Growth in demand emanated
largely from the Eastern hemisphere, providing support to Asian margins,
including Reliance. European refining margins witnessed dual pressure on
account of increased import availability from the US and ME region and weak
local demand. Continued margin pressure on European refining system could lead
to further capacity rationalisation.
RIL refining margins outperformed Singapore benchmark, widening the
premium over the benchmark to $ 2.2/bbl during FY 2013-14. RIL benefited from
its ability to run advantaged feedstock, flexibility to upgrade low value
products and the capacity to switch production to the most valuable product as
the market evolved.
MIDDLE DISTILLATES
Middle distillates (diesel and jet/kerosene) continued to remain the key
contributors to complex refining margins. In 2013, middle distillate demand
grew by over 450 KBD, contributing almost 35% of global oil demand growth. In
line with seasonal patterns, gasoil cracks started low in the first quarter but
gained strength through the year as demand picked up. Demand for gasoil
remained supported by growing industrial activity and a colder-than-expected
winter in the US. Subsidies on diesel in most of the emerging Asian economies
continue to support strong demand growth.
Jet witnessed a low margin environment throughout the year amid ample
supplies and warmer weather in North Asia, where kerosene is used for heating.
Indian diesel demand shrank by 1%, the first decline in over a decade.
This was partly in response to the slowdown in industrial activity and in part
due to the removal of subsidies to the commercial sector.
LIGHT DISTILLATES
Light ends witnessed a mixed year. Gasoline cracks remained subdued
through the major part of the year, except the US driving season and the last
quarter of the year. The cracks averaged lower at $ 12.7/bbl during the year as
compared to $ 15.4/bbl in the previous year. Naphtha cracks held relatively
stable during the first half of the FY 2013-14 amid an increase in naphtha
demand from Asian petrochemical sector while the overall naphtha supply
swelled. Cracks improved during the second half of the year on back of firm
petrochemical demand.
Freezing temperatures across US provided significant support to
light-ends during the winter period. Material increase in use of propane for
heating in US resulted in higher LPG prices globally. This supported naphtha
prices as an alternate feedstock for crackers.
FUEL OIL
Fuel Oil (FO) cracks were strong in the first quarter of FY 2013-14, due
to restricted supply of blending components to produce on-spec marine fuels.
Cracks were also supported by reduction in Russian exports of Straight Run Fuel
Oil due to the start of new upgrading capacities. On the demand side, teakettle
refineries reduced throughput and used crude as feedstock due to poor margins,
capping further gains. However, FO cracks collapsed in the second half of the
year, on account of weak bunker demand in Asia, higher stocks and below average
Japanese power sector demand. Cracks improved marginally in January due to
seasonal winter demand, lower inflows from west and improved demand as
feedstock from teakettle refineries ahead of Lunar New Year. Subsequently,
cracks have drifted lower on flat bunker demand.
RIL is able to upgrade its heavy liquid products into higher value
products, and largely tends to benefit in weakness of fuel oil as it lowers the
prices of heavy crude oil.
CRUDE DIFFERENTIALS
A key determinant of complex refining margins has been the differential
between light and heavy crudes. Arab Light – Heavy crude differential widened
to $ 4.2/bbl in FY 2013-14 as compared to $ 3.6/bbl in the previous year.
Heavier crudes, particularly from Latin American sources were also available at
significantly higher differentials during FY 2013-14 with incremental light oil
supply in North America. While new refineries that are getting built are
increasingly complex and require heavy crudes as feedstock, crude production
increase is more on the lighter side over the next few years supporting wider
Light-Heavy differentials in the coming years.
New refinery additions and expansions in existing refineries were partly
offset by closures in the US, Europe and Japan, leading to a net capacity
addition of about 0.9 MMBPD; oil demand growth was higher at 1.3 MMBPD, with a
reversal of the declining trend in OECD demand witnessed over the last three
years.
These refinery closures also resulted in improved average refinery
utilisation rates in North America (84.8% in 2013 compared to 84.1% in 2012).
However, in Europe, utilisation rates (76.4% compared to 79.8% in 2012)
decreased due to weak margins. Asian operating rates were at 85.4%.
PETROCHEMICALS
RIL is one of the most integrated petrochemicals producers globally,
with operations ranging from the production of feedstock and intermediates to
end products in both the polyester and polymer chain. This vertical integration
from refining to petrochemical end products imparts RIL with the fundamental
strength of feedstock safety, scalability, product diversification and
economies of scale.
RIL has a balanced portfolio of naphtha and gas based crackers, along
with matching downstream capacities. RIL’s petrochemical products portfolio
includes polymers (PE, PP, PVC), fibre intermediates (PX, PTA, MEG), polyester
products (PFY, PSF, PET), elastomers and solvents.
The combination of world-scale capacity and deep integration has a
positive impact on the Company’s operating margins and reduces exposure to the
cyclicality of markets and raw material prices. The Company believes that this
strategy is also important in maintaining domestic market leadership in its
major product lines and is a source of competitive advantage.
RIL constantly focuses on technology, cost improvements and safe practices,
whilst continuing to invest in high growth opportunities.
FINANCIAL PERFORMANCE
AND REVIEW
Revenue
from operations
of Rs.4013020.000 Million ($ 67.0 billion), increased 8.1% on a y-o-y basis.
Higher prices accounted for 7.7% growth in revenue and increase in volumes
accounted for 0.4% growth in revenue. Revenues were positively impacted by a
sharp movement in exchange rate, with a 10.4% depreciation of the Indian rupee
vis-à-vis the US dollar. Exports were higher by 15.3% at Rs.2758250.000 Million
($ 46.0 billion) as against Rs.2392660.000 Million in FY 2012- 13.
·
Reining business contributes 78% of revenues
(including inter-divisional transfer) and grew by 8.4% as compared to previous year.
The growth in revenue was driven by 8.1% increase in prices and 0.3% higher
volumes.
·
Petrochemicals business accounted for 21% of
revenues and grew by 9.5% as compared to previous year. The growth in revenue
was contributed by 8.6% increase in price and 0.9% higher volumes.
·
Oil and gas business revenue declined by 26.7% as
compared to previous year largely on account of 39.7% decline in production
OUTLOOK
A two trillion dollar
economy catering to a billion-plus population, more than half of which is below
the age of 30. Such a scenario, a rarity in the world’s demographic profile,
represents the foundation for India’s retail sector growth.
India’s organised retail is
witnessing a new surge of optimism and is projected to touch a 20% share of the
total retail market by 2020 vis-à-vis 8% now.
CHARGES
|
ENTITY |
PERSON |
COMPETENT AUTHORITY |
REGULATORY CHARGES |
REGULATORY ACTION (S) / DATE OF ORDER |
FURTHER DEVELOPMENTS |
|
RELIANCE INDUSTRIES LIMITED |
EPFO |
EXEMPTED AND UNEXEMPTED ESTABLISHMENTS DEFAULTED WITH EPFO INCLUDING PROVIDENT FUND, PENSION AND EDLI CONTRIBUTION, ADMINISTRATION CHARGES AND PENAL DAMAGES OF RS.83.55 LAKHS |
AMONG OTHER
ACTIONS, NAMES OF DEFAULTERS PUT ON THE EPFO WEBSITE |
||
|
RELIANCE INDUSTRIES LIMITED |
NSDL |
HIGH PENDING DEMAT REQUESTS |
PUT UP ON NSDL
WEBSITE FOR PUBLIC NOTICE |
NOT APPEARING IN THE LIST DATED 15/04/2011 |
|
|
RELIANCE INDUSTRIES LIMITED |
CDSL |
HIGH PENDING DEMAT REQUESTS |
PUT UP ON CDSL WEBSITE
FOR PUBLIC NOTICE |
NOT APPEARING IN THE LIST DATED 16/04/2011 |
|
|
RELIANCE INDUSTRIES LIMITED |
NSE |
HIGHEST NUMBER OF COMPLAINTS PENDING AS ON 28-FEBRUARY-2007 |
PUT UP ON NSE
WEBSITE FOR PUBLIC NOTICE |
NOT APPEARING IN LIST AS ON 31-MARCH-2007 |
|
|
RELIANCE INDUSTRIES LIMITED |
SEBI |
DID NOT COMPLY WITH SEBI TAKEOVER REGULATIONS, 1997 |
IMPOSED PENALTY
RS.4,75,000 |
SAT: IMPUGNED ORDER SET ASIDE WITH NO ORDER AS TO COSTS |
UNAUDITED STANDALONE FINANCIAL
RESULTS FOR THE QUARTER/NINE MONTHS ENDED 31ST DECEMBER 2014
(RS.
IN MILLION)
|
PARTICULARS |
Quarter – ended |
Nine Month Ended |
|
|
31.12.2014 |
30.09.2014 |
31.12.2014 |
|
|
|
Unaudited |
Unaudited |
Unaudited |
|
Income from
Operations |
|
|
|
|
Net sales/Income from Operations |
801960.000 |
964860.000 |
2730330.000 |
|
Total Income
from Operations (Net) |
801960.000 |
964860.000 |
2730330.000 |
|
Expenses |
|
|
|
|
Cost of material consumed |
585430.000 |
788510.000 |
2183600.000 |
|
Purchase of Stock-in-trade |
19510.000 |
17360.000 |
54030.000 |
|
Changes in inventories of Finished Goods, Work in Progress and
Stock-in-Trade |
49070.000 |
(5760.000) |
22110.000 |
|
Employee Benefit Expenses |
8320.000 |
9320.000 |
26930.000 |
|
Depreciation and Amortization |
21050.000 |
22270.000 |
63560.000 |
|
Other Expenses |
67550.000 |
73080.000 |
213930.000 |
|
Total |
750930.000 |
904780.000 |
2564160.000 |
|
Profit/ (Loss) from
Operations before other Income and Finance Cost |
51030.000 |
60080.000 |
166170.000 |
|
Other income |
24020.000 |
21400.000 |
65880.000 |
|
Profit/ (Loss)
from Ordinary Activities before Finance Cost |
75050.000 |
81480.0000 |
232050.000 |
|
Finance Costs |
8810.000 |
7580.000 |
19630.000 |
|
Profit/ (Loss)
from ordinary Activities after Finance Cost and before tax |
66240.000 |
73900.000 |
212420.000 |
|
Tax Expenses |
15390.000 |
16480.000 |
47660.000 |
|
Net Profit/ (Loss)
from Ordinary Activities After Tax |
50850.000 |
57420.000 |
164760.000 |
|
Paid up Equity Share Capital (Face value of Rs. 10/- each) |
32350.000 |
32340.000 |
32350.000 |
|
Reserves excluding Revaluation Reserve |
|
|
|
|
Earning per shares of Rs. 10/- each |
|
|
|
|
Basic |
15.7 |
17.7 |
50.9 |
|
Diluted |
15.7 |
17.7 |
50.9 |
|
Particulars |
Quarter –ended |
Nine Month Ended |
|
|
31.12.2014 |
30.09.2014 |
31.12.2014 |
|
|
Public Shareholding |
|
|
|
|
-Number of Shares |
1771.100 |
1770.200 |
1771.100 |
|
-Percentage of Shareholding |
54.75 |
54.74 |
54.75 |
|
Promoter and Promoter Group Shareholding |
|
|
|
|
Pledged /
Encumbered |
|
|
|
|
-Number of shares |
--- |
--- |
--- |
|
-Percentage of shares (as a % of the total
shareholding of promoter and promoter group) |
--- |
--- |
--- |
|
-Percentage of shares (as a % of the total share
capital of the company) |
--- |
--- |
--- |
|
Non- encumbered |
|
|
|
|
-Number of shares |
1464.000 |
1464.000 |
1464.000 |
|
-Percentage of shares (as a % of the total
shareholding of promoter and
promoter group) |
100 |
100 |
100 |
|
-Percentage of shares (as a % of the total share
capital of the company) |
45.25 |
45.26 |
45.25 |
NOTES:
· The figures for the corresponding previous periods have been reworked/regrouped wherever necessary, to make them comparable.
· The Government of India (GoI), by its letters dated 2nd May, 2012, 14th November, 2013 and 10th July, 2014 has communicated that it proposes to disallow certain costs which the Production Sharing Contract (PSC), relating to Block KG-DWN-98/3 entitles the Company to recover. Based on legal advice received, the Company continues to maintain that a Contractor is entitled to recover all of its costs under the terms of the PSC and there are no provisions that entitle the Government to disallow the recovery of any Contract Cost as defined in the PSC. The Company has already referred the issue to arbitration and already communicated the same to GoI for resolution of disputes.
· Pursuant to the enactment of the Companies Act 2013 (the Act), the Company has, effective 1st April 2014, reviewed and revised the estimated useful lives of its fixed assets, generally in accordance with the provisions of Schedule II to the Act. The consequential impact (after considering the transition provision specified in Schedule II) on the depreciation charged and on the results for the quarter is not material.
· Based on alternate interpretation for calculation of diluted EPS as per Accounting Standard (AS) 20 the diluted EPS for the quarter ending Dec 14, Sep 14 and Dec 13, Nine month ending Dec 14 and Dec 13 and Year ended Mar 14 are Rs.15.7, Rs.17.7, Rs.17.0, Rs.50.8, Rs.50.5 and Rs.67.9 respectively.
· There were no investor complaints pending as on 1st October 2014. All the 646 complaints received during the quarter ended 31st December 2014 were resolved and no complaints were outstanding as on 31st December 2014.
· The Audit Committee has reviewed the above results and the Board of Directors have approved the above results and its release at their respective meetings held on 16th January 2015. The Statutory Auditors of the Company have carried out a Limited Review of the aforesaid results.
UNAUDITED STANDALONE SEGMENT INFORMATION FOR THE QUARTER / NINE MONTHS
ENDED 31st DECEMBER 2014
(RS.
IN MILLION)
|
Particulars |
Quarter – ended |
Half Year Ended |
|
|
31.12.2014 |
30.09.2014 |
31.12.2014 |
|
|
1.Segment
Revenue |
|
|
|
|
- Petrochemicals |
213060.000 |
249320.000 |
699530.000 |
|
- Refining |
731520.000 |
917810.000 |
2559310.000 |
|
- Oil and Gas |
13470.000 |
13800.000 |
42840.000 |
|
- Others |
3730.000 |
2210.000 |
7870.000 |
|
Gross Turnover (Turnover and
Inter Segment Transfers) |
961780.000 |
1183140.000 |
3309550.000 |
|
Less: Inter Segment Transfers |
135310.000 |
185440.000 |
491540.000 |
|
Turnover |
826470.000 |
997700.000 |
2818010.000 |
|
Less: Excise Duty / Service Tax Recovered |
24510.000 |
32840.000 |
87680.000 |
|
Net Turnover |
801960.000 |
964860.000 |
2730330.000 |
|
|
|
|
|
|
2. Segment
Results |
|
|
|
|
- Petrochemicals |
21970.000 |
24030.000 |
64850.000 |
|
- Refining |
31990.000 |
37880.000 |
107600.000 |
|
- Oil and Gas |
2670.000 |
3320.000 |
10860.000 |
|
- Others |
740.000 |
660.000 |
1920.000 |
|
Total Segment
Profit before Interest and Tax |
57370.000 |
65890.000 |
185230.000 |
|
(i) Interest Expense |
(8810.000) |
(7580.000) |
(19630.000) |
|
(ii) Interest Income |
13330.000 |
14410.000 |
41310.000 |
|
(iii) Other Un-allocable Income (Net of Expenditure) |
4350.000 |
1180.000 |
5510.000 |
|
Profit before
Tax |
66240.000 |
73900.000 |
212420.000 |
|
(i) Provision for Current Tax |
(13780.000) |
(15390.000) |
(44240.000) |
|
(ii) Provision for Deferred Tax |
(1610.000) |
(1090.000) |
(3420.000) |
|
Profit
after Tax |
50850.000 |
57420.000 |
164760.000 |
|
|
|
|
|
|
3.Capital
Employed (Segment Assets
– Segment Liabilities) |
|
|
|
|
- Petrochemicals |
467650.000 |
471580.000 |
467650.000 |
|
- Refining |
790860.000 |
708880.000 |
790860.000 |
|
- Oil and Gas |
314540.000 |
307010.000 |
314540.000 |
|
- Others |
389820.000 |
383760.000 |
389820.000 |
|
-Unallocated |
1175340.000 |
1177620.000 |
1175340.000 |
|
Total Capital Employed |
3138210.000 |
3048850.000 |
3138210.000 |
Notes to Segment
Information (Standalone) for the Quarter/ Nine Months Ended 31st December 2014
As per Accounting Standard 17 on ‘Segment Reporting’ (AS 17), the Company has reported ‘Segment Information’, as described below:
· The petrochemicals segment includes production and marketing operations of petrochemical products namely, High density Polyethylene, Low density Polyethylene, Linear Low density Polyethylene, Polypropylene, Polyvinyl Chloride, Polyester Yarn, Polyester Fibres, Purified Terephthalic Acid, Paraxylene, Ethylene Glycol, Olefins, Aromatics, Linear Alkyl Benzene, Butadiene, Acrylonitrile, Poly Butadiene Rubber, Caustic Soda and Polyethylene Terephthalate.
· The refining segment includes production and marketing operations of the petroleum products.
· The oil and gas segment includes exploration, development and production of crude oil and natural gas.
· The smaller business segments not separately reportable have been grouped under the others segment.
· Capital employed on other investments / assets and income from the same are considered under unallocable.
CONTINGENT
LIABILITIES
|
PARTICULARS |
31.03.2014 (Rs. In Million) |
31.03.2013 (Rs. In Million) |
|
Claims against the company
/ disputed liabilities not acknowledged as debts |
|
|
|
In respect of Joint Ventures |
4140.000 |
-- |
|
In respect of others |
14330.000 |
16630.000 |
|
Guarantees |
|
|
|
Guarantees to Banks
and Financial Institutions against credit facilities extended to third
parties |
|
|
|
In respect of others |
323080.000 |
310800.000 |
|
Performance
Guarantees |
|
|
|
In respect of others |
2900.000 |
2580.000 |
|
Outstanding guarantees
furnished to Banks and Financial Institutions including in respect of Letters
of Credits |
|
|
|
In respect of joint ventures |
7000.000 |
1600.000 |
|
In respect of others |
48430.000 |
50990.000 |
|
Other Money for which
the company is contingently liable |
|
|
|
Liability in respect of bills discounted with Banks (Including third party bills discounting) |
|
|
|
In respect of others |
49700.000 |
39610.000 |
FIXED ASSETS:
Tangible Assets
- Leasehold Land
- Freehold Land
- Buildings
- Plant and Machinery
- Electrical Installations
- Equipments
- Furniture and Fixtures
- Vehicles
- Ships
- Aircrafts and Helicopters
Intangible Assets
- Technical Knowhow fees
- Software
- Development Rights
CMT REPORT (Corruption, Money Laundering & Terrorism]
The Public Notice information has been collected from various sources
including but not limited to: The Courts,
1] INFORMATION ON
DESIGNATED PARTY
No exist designating subject or any of its beneficial owners,
controlling shareholders or senior officers as terrorist or terrorist
organization or whom notice had been received that all financial transactions
involving their assets have been blocked or convicted, found guilty or against
whom a judgement or order had been entered in a proceedings for violating
money-laundering, anti-corruption or bribery or international economic or
anti-terrorism sanction laws or whose assets were seized, blocked, frozen or
ordered forfeited for violation of money laundering or international
anti-terrorism laws.
2] Court Declaration :
No exist to suggest that subject is or was
the subject of any formal or informal allegations, prosecutions or other
official proceeding for making any prohibited payments or other improper
payments to government officials for engaging in prohibited transactions or
with designated parties.
3] Asset Declaration :
No records exist to suggest that the property or assets of the subject
are derived from criminal conduct or a prohibited transaction.
4] Record on Financial
Crime :
Charges or conviction
registered against subject: None
5] Records on Violation of
Anti-Corruption Laws :
Charges or
investigation registered against subject: None
6] Records on Int’l
Anti-Money Laundering Laws/Standards :
Charges or
investigation registered against subject: None
7] Criminal Records
No
available information exist that suggest that subject or any of its principals have
been formally charged or convicted by a competent governmental authority for
any financial crime or under any formal investigation by a competent government
authority for any violation of anti-corruption laws or international anti-money
laundering laws or standard.
8] Affiliation with
Government :
No record
exists to suggest that any director or indirect owners, controlling
shareholders, director, officer or employee of the company is a government
official or a family member or close business associate of a Government
official.
9] Compensation Package :
Our market
survey revealed that the amount of compensation sought by the subject is fair
and reasonable and comparable to compensation paid to others for similar
services.
10] Press Report :
No press reports / filings exists on
the subject.
CORPORATE GOVERNANCE
MIRA INFORM as part of its Due Diligence do provide comments on
Corporate Governance to identify management and governance. These factors often
have been predictive and in some cases have created vulnerabilities to credit
deterioration.
Our Governance Assessment focuses principally on the interactions
between a company’s management, its Board of Directors, Shareholders and other
financial stakeholders.
CONTRAVENTION
Subject is not known to have contravened any existing local laws,
regulations or policies that prohibit, restrict or otherwise affect the terms
and conditions that could be included in the agreement with the subject.
FOREIGN EXCHANGE RATES
|
Currency |
Unit
|
Indian Rupees |
|
US Dollar |
1 |
Rs. 62.59 |
|
|
1 |
Rs. 92.46 |
|
Euro |
1 |
Rs. 67.51 |
INFORMATION DETAILS
|
Analysis Done by
: |
KAR |
|
|
|
|
Report Prepared
by : |
BVA |
SCORE & RATING EXPLANATIONS
|
SCORE FACTORS |
RANGE |
POINTS |
|
HISTORY |
1~10 |
10 |
|
PAID-UP CAPITAL |
1~10 |
9 |
|
OPERATING SCALE |
1~10 |
10 |
|
FINANCIAL
CONDITION |
|
|
|
--BUSINESS SCALE |
1~10 |
10 |
|
--PROFITABILITY |
1~10 |
10 |
|
--LIQUIDITY |
1~10 |
10 |
|
--LEVERAGE |
1~10 |
9 |
|
--RESERVES |
1~10 |
9 |
|
--CREDIT LINES |
1~10 |
9 |
|
--MARGINS |
-5~5 |
-- |
|
DEMERIT POINTS |
|
|
|
--BANK CHARGES |
YES/NO |
YES |
|
--LITIGATION |
YES/NO |
YES |
|
--OTHER ADVERSE INFORMATION |
YES/NO |
NO |
|
MERIT POINTS |
|
|
|
--SOLE DISTRIBUTORSHIP |
YES/NO |
NO |
|
--EXPORT ACTIVITIES |
YES/NO |
NO |
|
--AFFILIATION |
YES/NO |
YES |
|
--LISTED |
YES/NO |
YES |
|
--OTHER MERIT FACTORS |
YES/NO |
YES |
|
DEFAULTER
|
|
|
|
--RBI |
YES/NO |
NO |
|
--EPF |
YES/NO |
NO |
|
TOTAL |
|
86 |
This score serves as a reference to assess SC’s
credit risk and to set the amount of credit to be extended. It is calculated
from a composite of weighted scores obtained from each of the major sections of
this report. The assessed factors and their relative weights (as indicated
through %) are as follows:
Financial
condition (40%) Ownership
background (20%) Payment
record (10%)
Credit history
(10%) Market trend (10%) Operational size
(10%)
RATING EXPLANATIONS
|
RATING |
STATUS |
PROPOSED CREDIT LINE |
|
|
>86 |
Aaa |
Possesses an extremely sound financial base with the strongest
capability for timely payment of interest and principal sums |
Unlimited |
|
71-85 |
Aa |
Possesses adequate working capital. No caution needed for credit transaction.
It has above average (strong) capability for payment of interest and
principal sums |
Large |
|
56-70 |
A |
Financial & operational base are regarded healthy. General
unfavourable factors will not cause fatal effect. Satisfactory capability for
payment of interest and principal sums |
Fairly Large |
|
41-55 |
Ba |
Overall operation is considered normal. Capable to meet normal
commitments. |
Satisfactory |
|
26-40 |
B |
Capability to overcome financial difficulties seems comparatively below
average. |
Small |
|
11-25 |
Ca |
Adverse factors are apparent. Repayment of interest and principal sums
in default or expected to be in default upon maturity |
Limited with
full security |
|
<10 |
C |
Absolute credit risk exists. Caution needed to be exercised |
Credit not
recommended |
|
-- |
NB |
New Business |
-- |
This report is issued at your request without any
risk and responsibility on the part of MIRA INFORM PRIVATE LIMITED (MIPL) or
its officials.