MIRA INFORM REPORT
|
Report No. : |
316333 |
|
Report Date : |
06.04.2015 |
IDENTIFICATION DETAILS
|
Name : |
ESAB INDIA LIMITED |
|
|
|
|
Registered
Office : |
Plot No. 13, 3rd Main Road, Industrial Estate,
Ambattur, Chennai - 600 058, Tamilnadu |
|
|
|
|
Country : |
India |
|
|
|
|
Financials (as
on) : |
31.12.2013 |
|
|
|
|
Date of
Incorporation : |
10.11.1987 |
|
|
|
|
Com. Reg. No.: |
18-058738 |
|
|
|
|
Capital
Investment / Paid-up Capital : |
Rs. 153.930 Million |
|
|
|
|
CIN No.: [Company Identification
No.] |
L29299TN1987PLC058738 |
|
|
|
|
TAN No.: [Tax Deduction &
Collection Account No.] |
CHEE00299F CHEE03931E CHEE03860D |
|
|
|
|
PAN No.: [Permanent Account No.] |
AAACE0861G AAACE0861G |
|
|
|
|
Legal Form : |
A Public Limited Liability Company. The Company’s Shares are Listed on
the Stock Exchanges. |
|
|
|
|
Line of Business
: |
Manufacturing and Marketing of Welding Electrodes, Gas Cylinder Valves, Medical Equipments, Copper Coated Wires and Arc Welding Machines. |
|
|
|
|
No. of Employees
: |
644 (Approximately) |
RATING & COMMENTS
|
MIRA’s Rating : |
Aa (72) |
|
RATING |
STATUS |
PROPOSED CREDIT LINE |
|
|
71-85 |
Aa |
Possesses adequate working capital. No caution needed for credit transaction.
It has above average (strong) capability for payment of interest and
principal sums |
Large |
|
Maximum Credit Limit : |
USD 10690000 |
|
|
|
|
Status : |
Good |
|
|
|
|
Payment Behaviour : |
Regular |
|
|
|
|
Litigation : |
Clear |
|
|
|
|
Comments : |
Subject is a well-established company having fine track record. The rating reflects company’s healthy financial risk profile marked by
adequate liquidity position and decent profitability levels of the company. Trade relations are reported as fair. Business is active. Payment are
reported to be regular and as per commitment. The company can be considered good for normal business dealings at
usual trade terms and conditions. |
NOTES :
Any query related to this report can be made
on e-mail : infodept@mirainform.com
while quoting report number, name and date.
ECGC Country Risk Classification List – December 31, 2014
|
Country Name |
Previous Rating (30.09.2014) |
Current Rating (31.12.2014) |
|
India |
A1 |
A1 |
|
Risk Category |
ECGC
Classification |
|
Insignificant |
A1 |
|
Low |
A2 |
|
Moderate |
B1 |
|
High |
B2 |
|
Very High |
C1 |
|
Restricted |
C2 |
|
Off-credit |
D |
RBI DEFAULTERS’ LIST STATUS
Subject’s name is not enlisted as a defaulter
in the publicly available RBI Defaulters’ list.
EPF (Employee Provident Fund) DEFAULTERS’ LIST STATUS
Subject’s name is not enlisted as a defaulter
in the publicly available EPF (Employee Provident Fund) Defaulters’ list as of
31-03-2014.
INFORMATION DENIED
Management non cooperative (91-44-43404684/42281100)
LOCATIONS
|
Registered
Office : |
Plot No. 13, 3rd |
|
Tel. No.: |
91-44-42281100 |
|
Fax No.: |
91-44-42281150 |
|
E-Mail : |
|
|
Website : |
|
|
|
|
|
Factory 1 : |
B -28, MIDC Industrial Area, Nagpur – 441501, Maharashtra, India |
|
Tel. No.: |
91-44-42281100 |
|
|
|
|
Factory 2 : |
Welding Consumables Factory, B. T. Road, Khardah, PO : B. D.
Sopan, North 24- Parganas, Kolkata - 743 121, West |
|
|
|
|
Factory 3 : |
Equipment Factory, P-41, Taratala Road, Kolkata - 700 088, India |
|
Tel. No.: |
91-33-24014517 / 18 / 19 |
|
Fax No.: |
91-33-24011880 / 4427 |
|
|
|
|
Factory 4: |
Welding Consumables Factory, Plot No. 13, 3rd
Main Road, Industrial Estate, Ambattur, Chennai - 600 058, India |
|
Tel. No.: |
91-44-43404611 |
|
Fax No.: |
91-44-26253108 |
|
|
|
|
Factory 5: |
Welding Consumables Factory, B-28, MIDC Industrial Area, Kalmeshwar, Nagpur - 441 501, Maharashtra, India |
|
Tel. No.: |
91-7118-271337 / 462 / 463 |
|
Fax No.: |
91-7118-271461 |
|
|
|
|
Factory 6 : |
Equipment Factory, G-22, SIPCOT Industrial park, Irungattukottai, Pennalur
Post, Sriperumbudur Taluk, Kanchipuram District - 602105 |
|
Tel. No.: |
91-44-43192047 / 48 |
|
Fax No.: |
91-44-43192049 |
|
|
|
|
Regional Office |
Located at:- Kolkata, Mumbai, New Delhi, Nagpur, Chennai |
|
Divisional Office |
Located at:- Chennai, Kolkata |
DIRECTORS
As on 31.12.2013
|
Name : |
Mr. Daniel Alexis Pryor |
|
Designation : |
Chairman |
|
Address : |
3630, Prospect Street, NW, Washington, 20007, USA |
|
|
|
|
Name : |
Mr. Kenneth D Konopa |
|
Designation : |
Director |
|
Address : |
3006 W Raye Street, Seattle, WA 98199, USA |
|
|
|
|
Name : |
K Vaidyanathan |
|
Designation : |
Director |
|
Address : |
“Bhaggyam Elegance”, Flat 3A, III Floor, 29/10, TTK road, 1st
Cross Street, Alwarpet, Cheenai – 600018, Tamilnadu, India |
|
|
|
|
Name : |
Mr. Pradeep Mallick |
|
Designation : |
Director |
|
Address : |
A/2, Pallonji Mansion, 43 Cuffee Parade, Mumbai – 400005, Maharashtra,
India |
|
|
|
|
Name : |
Mr. Vikram Tandon |
|
Designation : |
Director |
|
Address : |
Tandons, 57A Friends Colony East, New Delhi – 110065, India |
|
|
|
|
Name : |
Mr. Sudhir Chand |
|
Designation : |
Director |
|
Address : |
10, Belvedere Estate, 8/8 Alipore Road, Kolkata – 700027, India |
|
|
|
|
Name : |
Mr. Suresh N Talwar |
|
Designation : |
Director |
|
Address : |
10, shiv Shanti Bhuvan, 146 Maharshi Karve Road, Churchgate
Raclamation, Mumbai – 400020, Maharashtra, India |
|
|
|
|
Name : |
Mr. Rohit Gambhir |
|
Designation : |
Executive Director and Chief Executive |
KEY EXECUTIVES
|
Name : |
Mr. B Mohan |
|
Designation : |
Vice President – Finance and Chief Financial Officer |
|
|
|
|
Name : |
Mr. S Venkatakrishnan |
|
Designation : |
Company Secretary and Compliance Officer |
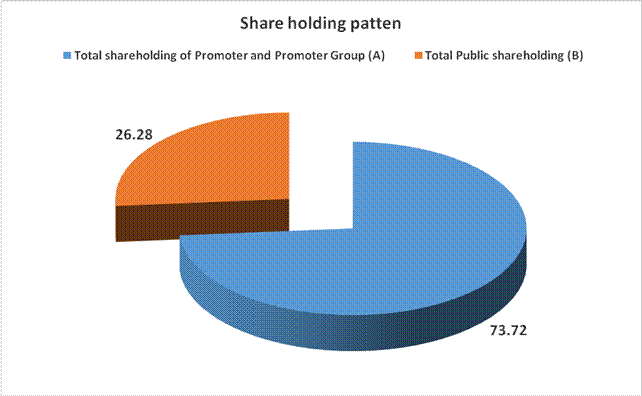
HAREHOLDING PATTERN
As on 31.12.2014
|
Names of Shareholders |
No.
of Shares |
Percentage
of Holding |
|
(A) Shareholding of
Promoter and Promoter Group |
||
|
|
|
|
|
|
|
|
|
|
11347960 |
73.72 |
|
|
11347960 |
73.72 |
|
Total shareholding of
Promoter and Promoter Group (A) |
11347960 |
73.72 |
|
(B) Public
Shareholding |
||
|
|
|
|
|
|
119129 |
0.77 |
|
|
2102 |
0.01 |
|
|
213863 |
1.39 |
|
|
335094 |
2.18 |
|
|
|
|
|
|
379259 |
2.46 |
|
|
|
|
|
|
1668061 |
10.84 |
|
|
84713 |
0.55 |
|
|
1577933 |
10.25 |
|
|
13180 |
0.09 |
|
|
863 |
0.01 |
|
|
1563890 |
10.16 |
|
|
3709966 |
24.10 |
|
Total Public
shareholding (B) |
4045060 |
26.28 |
|
Total (A)+(B) |
15393020 |
100.00 |
|
(C) Shares held by Custodians
and against which Depository Receipts have been issued |
|
|
|
|
0 |
0.00 |
|
|
0 |
0.00 |
|
|
0 |
0.00 |
|
Total (A)+(B)+(C) |
15393020 |
100.00 |
Particulars of
Shareholders holding more than 5% Shares of a class of Shares
|
Names of Shareholders |
No.
of Shares |
Percentage
of Holding |
|
Esab Holdings Limited |
5,743,200 |
37.31% |
|
Exelvia Group India BV |
5,604,760 |
36.41% |
|
Acacia Partners LP |
821,140 |
5.33% |
|
Total |
12,169,100 |
79.05% |
BUSINESS DETAILS
|
Line of Business : |
Manufacturing and Marketing of Welding Electrodes, Gas Cylinder
Valves, Medical Equipments, Copper Coated Wires and Arc Welding Machines. |
||||||||
|
|
|
||||||||
|
Products : |
|
||||||||
|
|
|
||||||||
|
Brand Names : |
Not Available |
||||||||
|
|
|
||||||||
|
Agencies Held : |
Not Available |
||||||||
|
|
|
||||||||
|
Exports : |
Not Divulged |
||||||||
|
|
|
||||||||
|
Imports : |
Not Divulged |
||||||||
|
|
|
||||||||
|
Terms : |
Not Divulged |
GENERAL INFORMATION
|
Suppliers : |
|
||||||||||||
|
|
|
||||||||||||
|
Customers : |
|
||||||||||||
|
|
|
||||||||||||
|
No. of Employees : |
644 (Approximately) |
||||||||||||
|
|
|
||||||||||||
|
Bankers : |
|
||||||||||||
|
|
|
|
Auditors : |
|
|
Name : |
B S R and Company Chartered Accountants |
|
Address : |
No.10, Mahatma Gandhi Road, Nungambakkam, Chennai 600
034. |
|
Tel. No.: |
91-44-3914 5000 |
|
Fax No.: |
91-44-3914 5999 |
|
|
|
|
Group Companies : |
·
ESAB Welding Products (Jiangsu) Co. Limited,
China ·
ESAB Middle East LLC, UAE ·
ESAB Asia / Pacific Pte Limited, Singapore ·
ESAB Middle East FZE, UAE ·
ESAB Cutting Systems GmbH, Germany ·
ESAB SeAH Corporation, Korea ·
ESAB GmbH, Germany ·
ESAB Industria e Comercio Ltda, Brazil ·
ESAB Europe AG, Switzerland ·
ESAB Saldatura SpA, Italy ·
ESAB-ATAS GmbH. Germany ·
OZAS-ESAB Sp. z.o.o, Poland ·
ESAB AB, Sweden ·
ESAB Vamberk sro, Czech Republic ·
PT Karya Yasantara Cakti. Indonesia ·
ESAB Africa Welding and Cutting (Proprietary)
Limited, South Africa ·
ESAB-Mor Kft, Hungary ·
ESAB Welding and Cutting Product ,USA ·
Alcotec Wire Corporation, USA ·
Romar Positioning Equipment International Pte
Limited, Singapore ·
ESAB KK, Japan ESAB Welding and Cutting Products
(Shanghai) Co. Limited, China ·
ESAB Automation Limited, UK ·
ESAB Group Inc, USA ·
ESAB (Malaysia) SDN BHD, Malaysia ·
ESAB Polska Sp.z.o.o, Poland ·
ESAB Welding Products (Weihai) Co. Limited, China
·
ESAB Equipment and Machinery Manufacturing
(Zhangjiagang) Co. Limited ·
ESAB Cutting and Welding Automation (Shangai) Co.
Limited ·
ESAB Welding Equipment AB, Sweden |
CAPITAL STRUCTURE
As on 31.12.2013
Authorised Capital :
|
No. of Shares |
Type |
Value |
Amount |
|
|
|
|
|
|
19,000,000 |
Equity Share |
Rs.10/- each |
Rs.190.000 Million |
|
3,000,000 |
Unclassified Shares |
Rs.10/- each |
Rs.30.000 Million |
|
|
Total |
|
Rs.220.000 Million |
Issued, Subscribed & Paid-up Capital :
|
No. of Shares |
Type |
Value |
Amount |
|
|
|
|
|
|
15,393,020 |
Equity Share |
Rs.10/- each |
Rs.153.930
Million |
|
|
|
|
|
Reconciliation of
shares outstanding at the beginning and at the end of the reporting period
|
|
As at December
31, 2013 |
|
|
Equity Shares |
Number |
Amount |
|
At the
commencement of the year |
15,393,020 |
1,539 |
|
Add : Shares
issued |
- |
- |
|
At the end of
the year |
15,393,020 |
1,539 |
Rights, preferences and restrictions attached to equity shares
The Company has a
single class of equity shares. Accordingly, all equity shares rank equally with
regard to dividends and share in the Company’s residual assets. The equity
shares are entitled to receive dividend as declared. The voting rights of an
equity shareholder on a poll (not on show of hands) are in proportion to its
share of the paid-up equity capital of the Company.
On winding up of
the Company, the holders of equity shares will be entitled to receive the
residual assets of the
Company, remaining
after distribution of all preferential amounts in proportion to the number of
equity shares held.
FINANCIAL DATA
[all figures are
in Rupees Million]
ABRIDGED BALANCE
SHEET
|
SOURCES OF FUNDS |
31.12.2013 |
31.12.2012 |
31.12.2011 |
|
I.
EQUITY
AND LIABILITIES |
|
|
|
|
(1)Shareholders' Funds |
|
|
|
|
(a) Share Capital |
153.900 |
153.900 |
153.900 |
|
(b) Reserves & Surplus |
2518.800 |
2205.600 |
1962.000 |
|
(c) Money
received against share warrants |
0.000 |
0.000 |
0.000 |
|
|
|
|
|
|
(2) Share Application money pending
allotment |
0.000 |
0.000 |
0.000 |
|
Total Shareholders’
Funds (1) + (2) |
2672.700 |
2359.500 |
2115.900 |
|
|
|
|
|
|
(3)
Non-Current Liabilities |
|
|
|
|
(a) long-term borrowings |
0.000 |
0.000 |
0.000 |
|
(b) Deferred tax liabilities (Net) |
32.000 |
33.000 |
46.600 |
|
(c) Other long term
liabilities |
11.700 |
11.400 |
20.100 |
|
(d) long-term
provisions |
41.800 |
42.800 |
37.000 |
|
Total Non-current
Liabilities (3) |
85.500 |
87.200 |
103.700 |
|
|
|
|
|
|
(4)
Current Liabilities |
|
|
|
|
(a) Short
term borrowings |
0.000 |
0.000 |
0.000 |
|
(b) Trade
payables |
525.800 |
438.000 |
423.500 |
|
(c) Other
current liabilities |
120.800 |
177.500 |
149.700 |
|
(d) Short-term
provisions |
98.000 |
248.600 |
123.600 |
|
Total Current
Liabilities (4) |
744.600 |
864.100 |
696.800 |
|
|
|
|
|
|
TOTAL |
3502.800 |
3310.800 |
2916.400 |
|
|
|
|
|
|
II.
ASSETS |
|
|
|
|
(1)
Non-current assets |
|
|
|
|
(a) Fixed
Assets |
|
|
|
|
(i)
Tangible assets |
930.800 |
959.400 |
1010.600 |
|
(ii)
Intangible Assets |
28.600 |
27.800 |
33.200 |
|
(iii)
Capital work-in-progress |
30.500 |
2.500 |
21.100 |
|
(iv)
Intangible assets under development |
0.000 |
3.600 |
1.200 |
|
(b) Non-current Investments |
0.000 |
0.000 |
0.000 |
|
(c) Deferred tax assets (net) |
0.000 |
0.000 |
0.000 |
|
(d) Long-term Loan and Advances |
143.100 |
125.900 |
119.500 |
|
(e) Other
Non-current assets |
20.000 |
0.000 |
82.500 |
|
Total Non-Current
Assets |
1153.000 |
1119.200 |
1268.100 |
|
|
|
|
|
|
(2)
Current assets |
|
|
|
|
(a)
Current investments |
1047.600 |
777.700 |
340.200 |
|
(b)
Inventories |
613.900 |
674.200 |
640.000 |
|
(c) Trade
receivables |
273.800 |
229.000 |
201.200 |
|
(d) Cash
and cash equivalents |
326.200 |
407.300 |
308.000 |
|
(e)
Short-term loans and advances |
81.600 |
84.500 |
148.900 |
|
(f) Other
current assets |
6.700 |
18.900 |
10.000 |
|
Total
Current Assets |
2349.800 |
2191.600 |
1648.300 |
|
|
|
|
|
|
TOTAL |
3502.800 |
3310.800 |
2916.400 |
PROFIT & LOSS
ACCOUNT
|
|
PARTICULARS |
31.12.2013 |
31.12.2012 |
31.12.2011 |
|
|
|
SALES |
|
|
|
|
|
|
|
Income |
4355.500 |
5035.200 |
5445.800 |
|
|
|
Other Income |
70.900 |
51.400 |
32.400 |
|
|
|
TOTAL (A) |
4426.400 |
5086.600 |
5478.200 |
|
|
|
|
|
|
|
|
Less |
EXPENSES |
|
|
|
|
|
|
|
Cost of Materials Consumed |
2307.100 |
2841.900 |
3046.400 |
|
|
|
Purchases of Stock-in-Trade |
406.000 |
440.300 |
449.100 |
|
|
|
Changes in inventories of finished goods, work-in-progress
and Stock-in-Trade |
52.400 |
(61.600) |
(95.900) |
|
|
|
Employees benefits expense |
425.300 |
417.500 |
425.800 |
|
|
|
Other expenses |
648.500 |
788.700 |
829.100 |
|
|
|
TOTAL (B) |
3839.300 |
4426.800 |
4654.500 |
|
|
|
|
|
|
|
|
|
|
|
|
|
|
|
|
PROFIT
BEFORE TAX, DEPRECIATION AND AMORTISATION (C-D) (E) |
587.100 |
659.800 |
823.700 |
|
|
|
|
|
|
|
|
|
Less/ Add |
DEPRECIATION/
AMORTISATION (F) |
112.300 |
118.200 |
117.500 |
|
|
|
|
|
|
|
|
|
|
PROFIT BEFORE
TAX (E-F) (G) |
474.800 |
541.600 |
706.200 |
|
|
|
|
|
|
|
|
|
Less |
TAX (H) |
143.600 |
163.900 |
231.800 |
|
|
|
|
|
|
|
|
|
|
PROFIT AFTER TAX
(G-H) (I) |
331.200 |
377.700 |
474.400 |
|
|
|
|
|
|
|
|
|
|
EARNINGS IN
FOREIGN CURRENCY |
|
|
|
|
|
|
|
Export Earnings |
156.100 |
124.900 |
180.200 |
|
|
|
Income from Services |
38.700 |
36.000 |
60.600 |
|
|
|
Other Earnings |
0.300 |
1.100 |
0.000 |
|
|
TOTAL EARNINGS |
195.100 |
162.000 |
240.800 |
|
|
|
|
|
|
|
|
|
|
IMPORTS |
|
|
|
|
|
|
|
Raw Materials |
168.300 |
260.100 |
210.500 |
|
|
|
Components and Stores parts |
247.300 |
198.400 |
182.700 |
|
|
|
Capital Goods |
72.500 |
11.000 |
75.800 |
|
|
TOTAL IMPORTS |
488.100 |
469.500 |
469.000 |
|
|
|
|
|
|
|
|
|
|
Earnings Per Share
(Rs.) |
21.52 |
54.54 |
30.82 |
|
KEY RATIOS
|
PARTICULARS |
|
31.12.2013 |
31.12.2012 |
31.12.2011 |
|
Net Profit Margin (PAT/Sales) |
(%) |
7.48 |
7.43 |
8.66 |
|
|
|
|
|
|
|
Operating Profit Margin (PBDIT / Sales) |
(%) |
10.90 |
10.76 |
12.97 |
|
|
|
|
|
|
|
Return on Total Assets (PBT/Total Assets} |
(%) |
13.67 |
16.39 |
24.40 |
|
|
|
|
|
|
|
Return on Investment (ROI) (PBT/Networth) |
|
0.18 |
0.23 |
0.33 |
|
|
|
|
|
|
|
Debt Equity Ratio (Total Debt /Networth) |
|
0.00 |
0.00 |
0.00 |
|
|
|
|
|
|
|
Current Ratio (Current Asset/Current Liability) |
|
3.16 |
2.54 |
2.37 |
FINANCIAL ANALYSIS
[all figures are
in Rupees Million]
DEBT EQUITY RATIO
|
Particular |
31.12.2011 |
31.12.2012 |
31.12.2013 |
|
|
(Rs. In Million) |
(Rs. In Million) |
(Rs. In Million) |
|
Share Capital |
153.900 |
153.900 |
153.900 |
|
Reserves & Surplus |
1962.000 |
2205.600 |
2518.800 |
|
Net worth |
2115.900 |
2359.500 |
2672.700 |
|
|
|
|
|
|
long-term borrowings |
0.000 |
0.000 |
0.000 |
|
Short term borrowings |
0.000 |
0.000 |
0.000 |
|
Total borrowings |
0.000 |
0.000 |
0.000 |
|
Debt/Equity ratio |
0.000 |
0.000 |
0.000 |
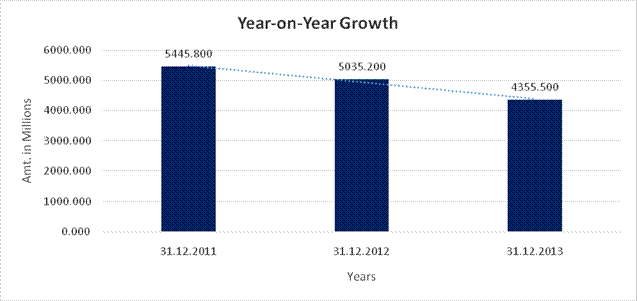
YEAR-ON-YEAR GROWTH
|
Year on Year Growth |
31.12.2011 |
31.12.2012 |
31.12.2013 |
|
|
(Rs. In Million) |
(Rs. In Million) |
(Rs. In Million) |
|
Sales |
5445.800 |
5035.200 |
4355.500 |
|
|
|
(7.540) |
(13.499) |
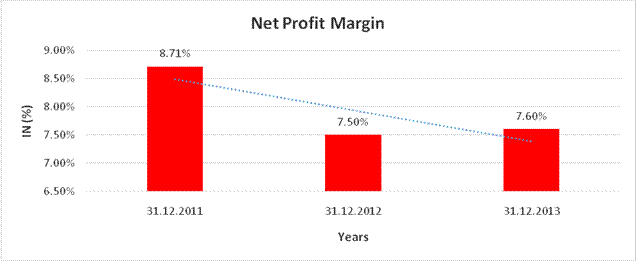
NET PROFIT MARGIN
|
Net Profit Margin |
31.12.2011 |
31.12.2012 |
31.12.2013 |
|
|
(Rs. In Million) |
(Rs. In Million) |
(Rs. In Million) |
|
Sales |
5445.800 |
5035.200 |
4355.500 |
|
Profit |
474.400 |
377.700 |
331.200 |
|
|
8.71% |
7.50% |
7.60% |
LOCAL AGENCY FURTHER INFORMATION
|
Sr. No. |
Check List by Info
Agents |
Available in Report (Yes / No) |
|
1] |
Year of Establishment |
Yes |
|
2] |
Locality of the firm |
Yes |
|
3] |
Constitutions of the firm |
Yes |
|
4] |
Premises details |
No |
|
5] |
Type of Business |
Yes |
|
6] |
Line of Business |
Yes |
|
7] |
Promoter's background |
Yes |
|
8] |
No. of employees |
Yes |
|
9] |
Name of person contacted |
No |
|
10] |
Designation of contact person |
No |
|
11] |
Turnover of firm for last three years |
Yes |
|
12] |
Profitability for last three years |
Yes |
|
13] |
Reasons for variation <> 20% |
---------------------- |
|
14] |
Estimation for coming financial year |
No |
|
15] |
Capital in the business |
Yes |
|
16] |
Details of sister concerns |
Yes |
|
17] |
Major suppliers |
No |
|
18] |
Major customers |
No |
|
19] |
Payments terms |
No |
|
20] |
Export / Import details (if applicable) |
No |
|
21] |
Market information |
---------------------- |
|
22] |
Litigations that the firm / promoter involved in |
---------------------- |
|
23] |
Banking Details |
Yes |
|
24] |
Banking facility details |
No |
|
25] |
Conduct of the banking account |
---------------------- |
|
26] |
Buyer visit details |
---------------------- |
|
27] |
Financials, if provided |
Yes |
|
28] |
Incorporation details, if applicable |
Yes |
|
29] |
Last accounts filed at ROC |
No |
|
30] |
Major Shareholders, if available |
Yes |
|
31] |
Date of Birth of Proprietor/Partner/Director, if available |
No |
|
32] |
PAN of Proprietor/Partner/Director, if available |
No |
|
33] |
Voter ID No of Proprietor/Partner/Director, if available |
No |
|
34] |
External Agency Rating, if available |
No |
COMPANY OVERVIEW
ESAB
India Limited (“the Company”) was incorporated on November 10, 1987 and
commenced its business operations in July 1988. The Company is engaged in the
business of welding consumables i.e. welding electrodes, copper coated wires,
flux cored wires and welding fluxes and of welding equipment i.e. welding
machines and cutting equipments.
As
a result of acquisition of Charter International plc. in January 2012 by Colfax
Corporation, ESAB Holdings Limited, UK and Exelvia Group India B.V. which were
100% subsidiaries of Charter became indirect subsidiaries of Colfax
Corporation. Consequently, the Company became a subsidiary of Colfax in 2012.
Pursuant to an offer made in 2012, Colfax’s ownership has increased from 56% to
74% in the Company
MANAGEMENT DISCUSSION AND ANALYSIS
ECONOMIC
& BUSINESS ENVIRONMENT
The
year 2013 has been a difficult one for most of the segments in the economy as
the Country continued to
experience
low growth and high inflation. A host of local and international factors led to
low levels of business
sentiment
and slowdown across virtually all their customer segments.
Industrial
production continued to contract through the year under the impact of high
interest rates, low investments and a significantly weakened currency. GDP
growth estimates went through a series of downward revisions and the impact was
particularly adverse in the Manufacturing segment that is key to the Company's
prospects.
Several projects were delayed or shelved due to a combination of financial and
policy bottlenecks.
Some
of the recent policy announcements encouraging Foreign Investments in India and
clearances for long
pending
projects present a ray of hope but prospects of revival hinge on timely
execution of the pronouncements
and
policies. A reportedly good monsoon is also expected to help boost flagging
demand. Reduction in the fiscal deficit and a stable currency with reasonable
interest rates are also key to revival prospects. The immediate future
continues
to be fraught with uncertainties and Industry looks to some stability in the
second half of the year.
On
issues specific to their Industry and the Company, the effect of slowdown
across all Steel consuming segments had an adverse effect on volumes and
margins. A significant reduction in infrastructure projects affected their
Equipments business in particular with a cascading impact on Consumables. Input
and conversion cost increases were not fully compensated by selling prices in
an increasingly competitive and tough market. Liquidity conditions were very
tight with persistent hardening of interest rates. This necessitated higher
credit cycles with trade. The above elements together with an increasingly
challenging product mix kept margins under huge pressure throughout the year.
Given the above backdrop, the Company focused strongly on product mix including
new launches, product rationalization, productivity improvement measures and a
tight control on costs to compensate for flat or declining volumes across
product groups.
Business
priorities and the Organization were reviewed continuously to look for
optimizing costs and benefits. The Company maintained its position as a
preferred partner in welding and cutting solutions. The Company is well
positioned as a leaner organization with a strong Balance Sheet to endure a
difficult phase and to capitalize on any opportunities when the trade cycle
improves.
INCOME STATEMENT
Net
Sales (Including Service Income) was down by over 13% over 2012. This was
across all product groups and
segments.
Relatively better performances in the R&M business and Exports that were
aided by a weakening
Rupee,
helped in softening the impact of declines in all other product groups.
Other
income was higher by about 38% due to increase in income from mutual funds.
Cash generation through tight management of working capital was a key positive
in a difficult year and cash surpluses were deployed in debt and liquid funds.
Materials
costs as a percentage to sales improved from 65.5% to 64.1% due to a
combination of enriched product
mix
and supply chain initiatives.
Cost
reduction initiatives including a tight control on discretionary spends
resulted in overheads including employee costs being lower by over 11% from
2012 levels.
Expenditure
on Consumption of Stores and Spares as also Repairs to Plant and Machinery were
lower by 13.6% and 17.5% respectively from 2012 due to initiatives taken at
Plants on Maintenance and cost reductions.
Excise
duty on Finished Goods were lower by Rs.66.500 Million in line with reductions
in Inventory of manufactured items.
Rates
and Taxes fell by Rs.10.600 Million with a reduction in provisioning
requirements for indirect tax matters as compared to 2012.
Transportation
and Freight expenses fell by Rs.35.500 Million through improved recoveries.
Depreciation was lower by 5% as compared to 2012 with Net Fixed Assets at the
same levels as in 2012
OUTLOOK, OPPORTUNITIES AND THREATS
There
has been no significant change in the economic environment in the current
quarter and most of the concerns highlighted in the earlier paragraphs continue
to exist. It is expected that macro-economic elements and the business
sentiments could stabilize towards the second half of the year. Multiple and
inter woven elements driving economic indicators present strong challenges to
any forecasting model.
Our
new product offerings and work currently in progress on development of more
products are expected to help sustain their leadership position. The long term
prospects are still considered positive despite the uncertainties around the
short term outlook. We are well placed as an organization to address growth in
opportunities as and when any economic revival happens.
Governmental
push on infrastructure, emerging focus on Tier II and Tier III cities and also
the spin off effects of a
good
monsoon present opportunities though the eventual impact could take time.
CONTINGENT LIABILITIES AND COMMITMENTS
|
Particulars |
December 31, 2013 |
|
Contingent liabilities |
|
|
Claims against the company not acknowledged
as debts |
824 |
|
Tax matters in dispute under appeal |
2,610 |
|
Bank guarantees outstanding |
480 |
|
|
|
|
Commitments |
|
|
Estimated amount of contracts remaining to
be executed on capital account and not provided for (net of advances) |
248 |
|
Total |
4,162 |
Dues to micro and small suppliers
The management has identified the enterprises which
have provided goods and services to the Company and which qualify under the
definition of micro and small enterprises, as defined under Micro, Small and
Medium Enterprises Development Act, 2006. Such determination / identification
has been done on the basis of information received and available with the
Company and relied upon by the auditors. Accordingly, the disclosure in respect
of the amounts payable to such enterprises as at December 31, 2013 has been
made in the financial statements based on information received and available
with the Company.
STATEMENT OF
STANDALONE UNAUDITED FINANCIAL RESULT FOR THE QUARTER ENDED
DECEMBER 31, 2014
|
Sr. No |
Particulars |
Standalone |
|||
|
Quarter Ended |
Twelve Months Ended |
||||
|
31.12.2014 |
30.09.2014 |
31.12.2014 |
|||
|
Unaudited |
Unaudited |
Unaudited |
|||
|
1 |
Income From
Operations |
|
|
|
|
|
|
a. Net Sales/ Income from Operations (Net of Excise Duty) |
1097.700 |
1076.400 |
4403.000 |
|
|
|
b. Other Operating Income |
17.300 |
11.700 |
49.600 |
|
|
|
Total Income from
Operations (Net) |
1115.000 |
1088.100 |
4452.600 |
|
|
2 |
Expenditure |
|
|
|
|
|
|
a. Cost of material Consumed |
581.100 |
563.600 |
2313.600 |
|
|
|
b. Purchase of Stock-in trade |
114.700 |
110.300 |
447.400 |
|
|
|
c. Changes in inventory of finished Goods, work- in-progress and Stock-in-trade |
41.200 |
27.200 |
99.900 |
|
|
|
d. Employees Benefit Expenses |
117.700 |
106.800 |
448.100 |
|
|
|
e. Depreciation and Amortisation Expenses |
28.400 |
27.900 |
112.100 |
|
|
|
f. Other expenses |
189.500 |
200.800 |
726.400 |
|
|
|
Total Expenses |
1072.600 |
1036.600 |
4147.500 |
|
|
3 |
Profit from
Operations before Other Income, Interest and Exceptional Items |
42.400 |
51.500 |
305.100 |
|
|
4 |
Other Income |
31.000 |
19.400 |
87.600 |
|
|
5 |
Profit from
ordinary activities before finance cost & exceptional items |
73.400 |
70.900 |
392.700 |
|
|
6 |
Finance Costs |
-- |
-- |
-- |
|
|
7 |
Profit from
ordinary activities after finance costs & exceptional items |
73.400 |
70.900 |
392.700 |
|
|
8 |
Exceptional items |
-- |
5.400 |
40.900 |
|
|
9 |
Profit from
ordinary activities before tax |
73.400 |
65.500 |
351.800 |
|
|
10 |
Tax Expense |
22.400 |
15.700 |
101.600 |
|
|
|
- Income Tax |
|
|
|
|
|
|
- Deferred Tax |
|
|
|
|
|
11 |
Net Profit from
ordinary activity after tax |
51.000 |
49.800 |
250.200 |
|
|
12 |
Extraordinary Items |
-- |
-- |
-- |
|
|
13 |
Net Profit After
Tax |
51.000 |
49.800 |
250.200 |
|
|
14 |
Paid-up equity share capital (face value of Rs.10 per share) |
1539 |
1539 |
1539 |
|
|
15 |
Reserves excluding Revaluation Reserve as per balance sheet of previous accounting Year |
-- |
-- |
-- |
|
|
16 |
Earning Per Share (of Rs.10 each) (not annualized) |
|
|
|
|
|
|
Basic EPS |
3.31 |
3.24 |
16.25 |
|
|
|
Diluted EPS |
3.31 |
3.24 |
16.25 |
|
|
A |
PARTICULARS OF
SHAREHOLDING |
|
|
|
|
|
17 |
Public Shareholding |
|
|
|
|
|
|
- No. of shares |
4045060 |
4045060 |
4045060 |
|
|
|
- Percentage of shareholding |
26.28% |
26.28% |
26.28% |
|
|
18 |
Promoter & Promoter
Group Shareholding |
|
|
|
|
|
|
a)
Pledged/Encumbered |
|
|
|
|
|
|
- No. of shares |
Nil |
Nil |
Nil |
|
|
|
- Percentage of shareholding (as a % of the total shareholding of promoter and promoter group) |
Nil |
Nil |
Nil |
|
|
|
- Percentage of shareholding (as a % of the total share capital of the company) |
Nil |
Nil |
Nil |
|
|
|
b) Non-encumbered |
|
|
|
|
|
|
- No. of shares |
11347960 |
11347960 |
11347960 |
|
|
|
- Percentage of shareholding (as a % of the total shareholding of promoter and promoter group) |
100% |
100% |
100% |
|
|
|
- Percentage of shareholding (as a % of the total share capital of the company) |
73.72% |
73.72% |
73.72% |
|
|
|
PARTICULARS |
Quarter ended
December 31, 2014 |
|
B |
INVESTOR COMPLAINTS Pending at the beginning of the quarter Received during the quarter Disposed of during the quarter Remaining unresolved at the end of the year |
Nil 15 15 Nil |
|
SEGMENT REPORTING Segment Revenue (Net) |
Quarter Ended |
Quarter Ended |
Six Months Ended |
|
|
31.12.2014 |
30.09.2014 |
31.12.2014 |
|
|
Unaudited |
Unaudited |
Unaudited |
|
Consumables |
801.300 |
789.700 |
3218.300 |
|
Equipment |
296.400 |
286.700 |
1184.700 |
|
Total |
1097.700 |
1076.400 |
4403.000 |
|
Segment Results |
|
|
|
|
Consumables |
71.400 |
69.200 |
338.900 |
|
Equipment |
15.000 |
6.800 |
56.600 |
|
Total |
86.400 |
76.000 |
395.500 |
|
Less : |
|
|
|
|
|
|
|
|
13.000 |
10.500 |
43.700 |
|
Total Profit Before Tax |
73.400 |
65.500 |
351.800 |
|
Capital Employed |
|
|
|
|
Consumables |
1166.900 |
1224.400 |
1166.900 |
|
Equipment |
342.700 |
397.600 |
342.700 |
|
Unallocated |
1413.300 |
1249.900 |
1413.300 |
|
Total Capital Employed |
2922.900 |
2871.900 |
2922.900 |
Note:
- The above results of the Company were reviewed by the Audit Committee and approved by the Board of Directors on 29 January 2015.
- The statutory auditors have carried out a limited review of the results for the quarter ended 31 December 2014 and have issued an unqualified report.
- A Voluntary Separation Scheme CV5S') was offered to all Die workmen of the Company at Taratala and Khardah plants in Kolkata during the quarter ended 30 June 2014. For the quarter ended December 31,2014 - Nil employees (September 30,2014 -7 employees) have accepted the VSS and the liability on account of the above is Rs. Nil (September 30,2014 - Rs 54 lakhs) and the same is recognised as an 'Exceptional item' In the statement of profit and loss.
- The figures for the quarter ended December 31. 2013 are the balancing figures between audited figures In respect of the full financial year ended December 31, 2013 and the unaudited published year to date figures for the third quarter ended 30 September 2013, which were subjected to limited review.
- During the current year the Company has changed the year end from December to March. Hence, the 12 months ended December 31,2014 Is unaudited as against the audited results for the year ended December 31,2013.
- Previous period's figures have been regrouped or reclassified wherever necessary.
INDEX OF CHARGES
|
S.No. |
Charge ID |
Date of Charge Creation/Modification |
Charge amount secured |
Charge Holder |
Address |
Service Request Number (SRN) |
|
1 |
10500768 |
19/03/2014 |
130,000,000.00 |
HDFC BANK LIMITED |
HDFC BANK HOUSESENAPATI BAPAT MARG, LOWER PAREL (West), MUMBAI, Maharashtra - 400013, INDIA |
C05464029 |
|
2 |
10384878 |
09/10/2012 |
130,000,000.00 |
AXIS BANK LIMITED |
CBB, KARUMUTHU NILAYAM, NO.192 ANNA SALAI, CHENNAI, Tamil Nadu - 600002, INDIA |
B61523296 |
* Date of charge modification
FIXED ASSETS
- Building
- Plant and Machinery
- Furniture and
Fixtures
- Motor
Vehicles
- Intangible
Assets
WEBSITE
DETAILS
Press
release/News
(02.12.2014)
ESAB ANNOUNCES
COLFAX’S ACQUISITION OF VICTOR TECHNOLOGIES HOLDINGS, INC.
ESAB, a member of the Colfax group of companies, today announced that Colfax has entered into a binding agreement to acquire Victor Technologies Holdings, Inc. ("Victor").
The acquisition brings together two leading organizations with world-class products, technologies and R&D. In its 110th year, ESAB is one of the largest and most experienced manufacturers of welding and cutting products with sales and support established in 80 countries and manufacturing plants across five continents. Victor has a century-long history of innovation and is recognized for its leading brands, including Victor®, Tweco®, Cigweld® and Stoody®, which are manufactured, sold and serviced around the globe.
The combination of ESAB and Victor creates a comprehensive product portfolio that brings a broader array of solutions to the global welding and cutting industry. Two of the leading suppliers in the industry, both with large, well-diversified geographic footprints, ESAB and Victor will together deliver more value to more customers in more areas of the world.
"Together, we'll use our combined geographic reach, product technologies, channel resources, and most importantly, organizational talent, to provide innovative welding and cutting solutions for our customers," said Clay Kiefaber, President & CEO ESAB.
ESAB places strong emphasis on constant innovation and improvement guided by the voice of the customer. The Colfax Business System (CBS) will drive ESAB and Victor's joint efforts to develop new products, provide added value to existing products, and deliver differentiated customer solutions.
ABOUT COLFAX CORPORATION -- Colfax Corporation is a diversified global manufacturing and engineering company that provides gas- and fluid-handling and fabrication technology products and services to commercial and governmental customers around the world under the Howden, Colfax Fluid Handling and ESAB brands. Colfax believes its brands are among the most highly recognized in each of the markets that it serves. Colfax is traded on the NYSE under the ticker "CFX."
ABOUT ESAB -- ESAB is one of the world's largest manufacturers of welding consumables, welding and cutting equipment, and associatedautomation. Founded in 1904, ESAB offers products for virtually every welding and cutting process and application, and is widely recognized as the technological leader in the industry. With manufacturing facilities on five continents and more than 8,000 associates, ESAB delivers products and support services quickly and efficiently to customers around the globe.
CMT REPORT (Corruption, Money Laundering & Terrorism]
The Public Notice information has been collected from various sources
including but not limited to: The Courts,
1] INFORMATION ON
DESIGNATED PARTY
No exist designating subject or any of its beneficial owners,
controlling shareholders or senior officers as terrorist or terrorist
organization or whom notice had been received that all financial transactions
involving their assets have been blocked or convicted, found guilty or against
whom a judgement or order had been entered in a proceedings for violating
money-laundering, anti-corruption or bribery or international economic or
anti-terrorism sanction laws or whose assets were seized, blocked, frozen or
ordered forfeited for violation of money laundering or international
anti-terrorism laws.
2] Court Declaration :
No exist to suggest that subject is or was
the subject of any formal or informal allegations, prosecutions or other
official proceeding for making any prohibited payments or other improper payments
to government officials for engaging in prohibited transactions or with
designated parties.
3] Asset Declaration :
No records exist to suggest that the property or assets of the subject
are derived from criminal conduct or a prohibited transaction.
4] Record on Financial
Crime :
Charges or conviction
registered against subject: None
5] Records on Violation of
Anti-Corruption Laws :
Charges or
investigation registered against subject: None
6] Records on Int’l Anti-Money
Laundering Laws/Standards :
Charges or
investigation registered against subject: None
7] Criminal Records
No
available information exist that suggest that subject or any of its principals
have been formally charged or convicted by a competent governmental authority
for any financial crime or under any formal investigation by a competent
government authority for any violation of anti-corruption laws or international
anti-money laundering laws or standard.
8] Affiliation with
Government :
No record
exists to suggest that any director or indirect owners, controlling
shareholders, director, officer or employee of the company is a government
official or a family member or close business associate of a Government
official.
9] Compensation Package :
Our market
survey revealed that the amount of compensation sought by the subject is fair
and reasonable and comparable to compensation paid to others for similar
services.
10] Press Report :
No press reports / filings exists on
the subject.
CORPORATE GOVERNANCE
MIRA INFORM as part of its Due Diligence do provide comments on
Corporate Governance to identify management and governance. These factors often
have been predictive and in some cases have created vulnerabilities to credit
deterioration.
Our Governance Assessment focuses principally on the interactions
between a company’s management, its Board of Directors, Shareholders and other
financial stakeholders.
CONTRAVENTION
Subject is not known to have contravened any existing local laws, regulations
or policies that prohibit, restrict or otherwise affect the terms and
conditions that could be included in the agreement with the subject.
FOREIGN EXCHANGE RATES
|
Currency |
Unit
|
Indian Rupees |
|
US Dollar |
1 |
Rs.62.59 |
|
|
1 |
Rs.92.46 |
|
Euro |
1 |
Rs.67.51 |
INFORMATION DETAILS
|
Information
Gathered by : |
PRT |
|
|
|
|
Analysis Done by
: |
KAR |
|
|
|
|
Report Prepared
by : |
ART |
SCORE & RATING EXPLANATIONS
|
SCORE FACTORS |
RANGE |
POINTS |
|
HISTORY |
1~10 |
8 |
|
PAID-UP CAPITAL |
1~10 |
8 |
|
OPERATING SCALE |
1~10 |
8 |
|
FINANCIAL CONDITION |
|
|
|
--BUSINESS SCALE |
1~10 |
8 |
|
--PROFITABILIRY |
1~10 |
8 |
|
--LIQUIDITY |
1~10 |
8 |
|
--LEVERAGE |
1~10 |
8 |
|
--RESERVES |
1~10 |
8 |
|
--CREDIT LINES |
1~10 |
8 |
|
--MARGINS |
-5~5 |
-- |
|
DEMERIT POINTS |
|
|
|
--BANK CHARGES |
YES/NO |
NO |
|
--LITIGATION |
YES/NO |
NO |
|
--OTHER ADVERSE INFORMATION |
YES/NO |
NO |
|
MERIT POINTS |
|
|
|
--SOLE DISTRIBUTORSHIP |
YES/NO |
NO |
|
--EXPORT ACTIVITIES |
YES/NO |
NO |
|
--AFFILIATION |
YES/NO |
YES |
|
--LISTED |
YES/NO |
YES |
|
--OTHER MERIT FACTORS |
YES/NO |
YES |
|
DEFAULTER |
|
|
|
--RBI |
YES/NO |
NO |
|
--EPF |
YES/NO |
NO |
|
TOTAL |
|
64 |
This score serves as a reference to assess SC’s
credit risk and to set the amount of credit to be extended. It is calculated
from a composite of weighted scores obtained from each of the major sections of
this report. The assessed factors and their relative weights (as indicated
through %) are as follows:
Financial
condition (40%) Ownership
background (20%) Payment
record (10%)
Credit history
(10%) Market trend (10%) Operational size
(10%)
RATING EXPLANATIONS
|
RATING |
STATUS |
PROPOSED CREDIT LINE |
|
|
>86 |
Aaa |
Possesses an extremely sound financial base with the strongest
capability for timely payment of interest and principal sums |
Unlimited |
|
71-85 |
Aa |
Possesses adequate working capital. No caution needed for credit transaction.
It has above average (strong) capability for payment of interest and
principal sums |
Large |
|
56-70 |
A |
Financial & operational base are regarded healthy. General
unfavourable factors will not cause fatal effect. Satisfactory capability for
payment of interest and principal sums |
Fairly Large |
|
41-55 |
Ba |
Overall operation is considered normal. Capable to meet normal
commitments. |
Satisfactory |
|
26-40 |
B |
Capability to overcome financial difficulties seems comparatively below
average. |
Small |
|
11-25 |
Ca |
Adverse factors are apparent. Repayment of interest and principal sums
in default or expected to be in default upon maturity |
Limited with
full security |
|
<10 |
C |
Absolute credit risk exists. Caution needed to be exercised |
Credit not
recommended |
|
-- |
NB |
New Business |
-- |
This report is issued at your request without any
risk and responsibility on the part of MIRA INFORM PRIVATE LIMITED (MIPL) or
its officials.