MIRA INFORM REPORT
|
Report No. : |
316828 |
|
Report Date : |
14.04.2015 |
IDENTIFICATION DETAILS
|
Name : |
VESTUARIO Y PROTECCION LABORAL JOYSA SL |
|
|
|
|
Registered Office : |
Register Madrid, Section 8, Sheet 143218 |
|
|
|
|
Country : |
Spain |
|
|
|
|
Financials (as on) : |
31.12.2013 |
|
|
|
|
Date of Incorporation : |
23.12.1994 |
|
|
|
|
Legal Form : |
Private Company |
|
|
|
|
Line of Business : |
Wholesale of Clothing and Footwear. |
|
|
|
|
No. of Employee : |
17 |
RATING & COMMENTS
|
MIRA’s Rating : |
Ba |
|
RATING |
STATUS |
PROPOSED CREDIT LINE |
|
|
41-55 |
Ba |
Overall operation is considered normal. Capable to meet normal
commitments. |
Satisfactory |
|
Status : |
Satisfactory |
|
|
|
|
Payment Behaviour : |
No complaints |
|
|
|
|
Litigation : |
Clear |
NOTES :
Any query related to this report can be made
on e-mail : infodept@mirainform.com
while quoting report number, name and date.
ECGC Country Risk Classification List – December 31, 2014
|
Country Name |
Previous Rating (30.09.2014) |
Current Rating (31.12.2014) |
|
Spain |
A2 |
A1 |
|
Risk Category |
ECGC
Classification |
|
Insignificant |
A1 |
|
Low |
A2 |
|
Moderate |
B1 |
|
High |
B2 |
|
Very High |
C1 |
|
Restricted |
C2 |
|
Off-credit |
D |
SPAIN ECONOMIC OVERVIEW
Spain experienced a prolonged recession in the wake of the global financial crisis. GDP contracted by 3.7% in 2009, ending a 16-year growth trend, and continued contracting through most of 2013. Economic growth resumed in late 2013, albeit only modestly, as credit contraction in the private sector, fiscal austerity, and high unemployment continued to weigh on domestic consumption and investment. Exports, however, have been resilient throughout the economic downturn, partially offsetting declines in domestic consumption and helped to bring Spain's current account into surplus in 2013 for the first time since 1986. The unemployment rate rose from a low of about 8% in 2007 to more than 26% in 2013, straining Spain's public finances as spending on social benefits increased while tax revenues fell. Spain’s budget deficit peaked at 11.4% of GDP in 2009. Spain gradually reduced the deficit to just under 7% of GDP in 2013, slightly above the 6.5% target negotiated between Spain and the EU. Public debt has increased substantially – from 60.1% of GDP in 2010 to 93.4% in 2013. Rising labor productivity, moderating labor costs, and lower inflation have helped to improve foreign investor interest in the economy and to reduce government borrowing costs. The government's ongoing efforts to implement reforms - labor, pension, health, tax, and education - are aimed at supporting investor sentiment. The government also has shored up struggling banks exposed to Spain's depressed domestic construction and real estate sectors by successfully completing an EU-funded restructuring and recapitalization program in December 2013.
|
Source
: CIA |
Company
name and address
VESTUARIO Y PROTECCION LABORAL JOYSA SL
|
|
|
Localization P.º LAS FLORES, 16 - 28820 COSLADA
(MADRID)
|
Telephone |
914851164 |
|
Web |
|
Activity
|
CNAE |
4642 / Wholesale of clothing and footwear |
|
CNAE activity classification (ANNUAL ACCOUNTS): |
4642 / Wholesale of clothing and footwear |
|
Size |
Medium |
|
Published Trademarks |
No |
|
Audited / Opinion: |
Yes |
|
Tenders Won: |
No |
|
Subsidies Granted: |
No |
|
Quality Certificate: |
No |
DEFAULTS, LEGAL
CLAIMS AND INSOLVENCY PROCEEDINGS
|
|
Number |
Amount |
Last Entry |
|
Insolvency Proceedings, Bankruptcy and Suspension of Payments |
Unpublished |
- |
- |
|
Legal and Administrative Proceedings |
Unpublished |
0 € |
- |
|
Notices of defaults and enforcement |
Unpublished |
0 € |
- |
|
Proceedings heard by the Labour Court |
Unpublished |
0 € |
- |
Key Financial
Indicators in the award of credit:
|
Main Financial Data |
2013 31/12/2013 |
2012 31/12/2012 |
Change 2013 - 2012 |
|
Net total sales |
4.044.685 |
3.869.874 |
4,52% |
|
Gross margin |
20,61% |
24,77% |
-16,81% |
|
Gross Operating Results |
190.444 |
201.958 |
-5,7% |
|
Indebtedness |
1,26 |
1,08 |
17,13% |
|
Financial Year Result |
55.073 |
71.399 |
-22,87% |
|
Equity |
2.096.860 |
2.041.786 |
2,7% |
|
Cash Flow |
130.584 |
5.601 |
2.231,64% |
|
Working Capital |
1.088.483 |
939.723 |
15,83% |
|
Economic Rate of Return |
1,95% |
2,4% |
-18,81% |
|
Financial profitability |
2,63% |
3,5% |
-24,89% |
|
Average payment term |
301 days |
268 days |
12,29% |
|
Average Payment Collection Term |
160 days |
121 days |
32,82% |
|
Number of Employees |
18 |
20,33 |
-11,46% |
ACTIVITY
|
NACE: |
4642 / Wholesale of clothing and footwear |
|
Main Activity: |
Wholesale of clothing and footwear |
|
CNAE Source: |
ANNUAL ACCOUNTS |
|
Company size: |
Medium |
Staff
|
Financial Year |
Permanent Employees |
Temporary Employees |
|
|
2013 |
17 |
1 |
|
|
2012 |
20 |
0 |
|
|
2011 |
20 |
0 |
|
|
2010 |
19 |
0 |
|
|
2009 |
20 |
0 |
|
|
2008 |
23 |
0 |
|
|
2007 |
22 |
2 |
|
|
2006 |
22 |
0 |
|
|
2005 |
16 |
6 |
|
|
2004 |
17 |
0 |
|
|
2003 |
1 |
1 |
|
|
2002 |
1 |
1 |
|
|
2001 |
11 |
2 |
|
|
2000 |
11 |
0 |
|
|
1999 |
5 |
5 |
|
|
1998 |
5 |
3 |
|
Staff
distribution
|
Associations |
Number of Employees 2009 |
|
EXECUTIVES AND MANAGERS |
2 |
|
COMMERCIAL AGENTS, SALESPEOPLE AND SIMILAR |
6 |
|
ADMNISTRATIVE SERVICES AND SIMILAR |
5 |
|
THE REST OF THE STAFF |
7 |
|
TOTAL |
20 |
Basis
for scoring
|
Positive Factors |
Adverse Factors |
|
|
|
Most relevant data
|
More than adequate capacity to meet its financial obligations.
However, this capacity has a higher probability to deteriorate in the
mid-long term than in higher categories. |
Most relevant data
|
The information contained in the latest annual statements has led to a Scoring review for the company. Company's scoring review on 29/05/2014 following the Registry of Commerce's Official Gazette publication of proceedings regarding VESTUARIO Y PROTECCION LABORAL JOYSA SL that might affect its scoring negatively. |
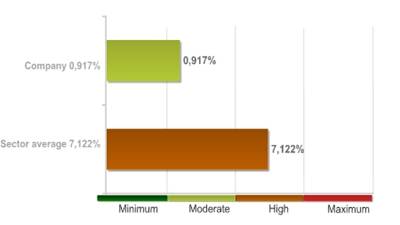
ESTIMATED
PROBABILITY OF DEFAULT
Section showing the probability that the company
queried will not be able to meet the business obligations it takes on over the
next 12 months, as well as a comparison against the average probability within
the sector.
The Estimated Probability of Default should be interpreted as the number
of companies (with similar profiles to that of the company queried) whose loans
have turned non-performing or delinquent, as a percentage of the total number
of companies..
Estimated Probability of Default (next 12 months): 0.917 %
|
Sector in which comparison is carried out : 464 Wholesale of household goods |
|
|
Relative Position:
|
Most relevant data
|
The company's comparative analysis with the rest of the companies that
comprise the sector, shows the company holds a better position with regard to
the probability of non-compliance. The 97.00% of the companies of the sector VESTUARIO Y PROTECCION
LABORAL JOYSA SL belongs to show a higher probability of non-compliance. |
|
The probability of the company's non-compliance with its payment
obligations within deadlines estimated by our qualifications models is
0.917%. In the event they fail to comply with the payment, the seriousness of
the loss will depend on factors such as the promptness of the commencement of
the charging management, the existence of executive documents which match the
credit or the existence of guarantees and free debt assets under the name of
the debtor. Therefore, the probability of non-compliance should not be solely
interpreted as the total loss of the owed amount. |
DEFAULTS, LEGAL CLAIMS AND INSOLVENCY
PROCEEDINGS
Section enabling assessment of the degree of compliance of the company
queried with its payment obligations. It provides information on the existence
and nature of all stages of Insolvency and Legal Proceedings published with
reference to the Company in the country's various Official Bulletins and
national newspapers, as well Defaults Registered in the main national credit
bureaus (ASNEF Empresas and RAI).
Summary
|
There are no of outstanding debts with Public Administration bodies or
resulting from claims filed by individuals before Courts of the different
jurisdictions. |
Chronological
Summary
|
Proceedings and Stages |
Number of Publications |
Amount |
Start date |
End date |
|
Insolvency Proceedings, Bankruptcy and Suspension of Payments |
Unpublished |
- |
- |
- |
|
Request/Declaration |
0 |
- |
|
- |
|
Proceedings |
0 |
- |
|
- |
|
Resolution |
0 |
- |
|
- |
|
Legal and Administrative Proceedings |
Unpublished |
0 |
|
|
|
Notices of defaults and enforcement |
0 |
0 |
|
|
|
Seizures |
0 |
0 |
|
|
|
Auctions |
0 |
0 |
|
|
|
Declarations of insolvency and bad debt |
0 |
0 |
|
|
|
Proceedings heard by the Civil Court |
Unpublished |
0 € |
|
|
|
Proceedings heard by the Labour Court |
Unpublished |
- |
|
|
ACCOUNTS
AND BALANCE SHEET RESULTS
|
Financial Year |
Type of Annual Accounts |
|
|
2013 |
Normal |
September 2014 |
|
2012 |
Normal |
September 2013 |
|
2011 |
Normal |
September 2012 |
|
2010 |
Normal |
August 2011 |
|
2009 |
Normal |
September 2010 |
|
2008 |
Normal |
December 2009 |
|
2007 |
Normal |
April 2009 |
|
2006 |
Normal |
October 2007 |
|
2005 |
Normal |
September 2006 |
|
2004 |
Normal |
September 2005 |
|
2003 |
Normal |
September 2004 |
|
2002 |
Normal |
June 2004 |
|
2001 |
Normal |
October 2002 |
|
2000 |
Normal |
August 2001 |
|
1999 |
Normal |
August 2000 |
|
1998 |
Normal |
July 1999 |
|
1997 |
Normal |
September 1998 |
|
1996 |
Normal |
October 1997 |
|
1995 |
Normal |
October 1996 |
La información del
último Depósito de Cuentas contenida en el informe procede del REGISTRO MERCANTIL
correspondiente al domicilio de la sociedad obtenida a fecha 31/12/2013
Balance en formato Pyme de acuerdo al Nuevo Plan General Contable 2007
Information
corresponding to the fiscal year 2013 2012 2011 2010
2009 is taken from information submitted to the TRADE REGISTER. Data
corresponding to fiscal years before 2013 2012 2011
2010 2009 has been compiled based on the equivalence criteria
stipulated in Act JUS/206/2009. To view details on the methodology.
|
Assets |
Code |
2013 31/12/2013 |
2012 31/12/2012 |
2011 31/12/2011 |
2010 31/12/2010 |
2009 31/12/2009 |
|
|
A) NON-CURRENT ASSETS |
11000 |
1.008.376 |
1.106.707 |
1.202.766 |
1.256.708 |
1.364.599 |
|
|
I. Intangible fixed assets |
11100 |
2.726 |
2.225 |
800 |
800 |
4.028 |
|
|
II. Tangible fixed assets |
11200 |
997.802 |
1.095.464 |
1.192.948 |
1.248.053 |
1.353.355 |
|
|
III. Real estate investment |
11300 |
0 |
0 |
0 |
0 |
0 |
|
|
IV. Long-term investments in Group companies and
associates |
11400 |
0 |
0 |
0 |
0 |
0 |
|
|
V. Long-term financial investments |
11500 |
7.848 |
9.018 |
9.018 |
7.855 |
7.215 |
|
|
VI. Assets for deferred tax |
11600 |
0 |
0 |
0 |
0 |
0 |
|
|
VII. Non-current trade debtors |
11700 |
0 |
0 |
0 |
0 |
0 |
|
|
B) CURRENT ASSETS |
12000 |
3.738.491 |
3.138.105 |
3.663.455 |
3.299.393 |
3.331.941 |
|
|
I. Stocks |
12200 |
1.501.405 |
1.526.202 |
1.931.771 |
1.353.278 |
1.271.914 |
|
|
II. Trade debtors and others receivable accounts |
12300 |
1.775.242 |
1.278.820 |
1.410.784 |
1.654.203 |
1.513.210 |
|
|
1. Trade debtors / accounts
receivable |
12380 |
1.767.892 |
1.274.821 |
1.410.784 |
1.653.398 |
1.513.210 |
|
|
a)
Long-term receivables from sales and services supplied |
12381 |
0 |
0 |
0 |
0 |
0 |
|
|
b)
Customers for sales and provisions of services |
12382 |
1.767.892 |
1.274.821 |
1.410.784 |
1.653.398 |
1.513.210 |
|
|
2. Called up share capital |
12370 |
0 |
0 |
0 |
0 |
0 |
|
|
3. Other accounts receivable |
12390 |
7.350 |
4.000 |
0 |
806 |
0 |
|
|
III. Short-term investment in Group companies and
associates |
12400 |
0 |
0 |
0 |
0 |
0 |
|
|
IV. Short-term financial investments |
12500 |
22.592 |
19.592 |
19.592 |
8.892 |
8.892 |
|
|
V. Short-term accruals |
12600 |
13.505 |
18.327 |
11.745 |
23.573 |
10.621 |
|
|
VI. Cash and other equivalent liquid assets |
12700 |
425.748 |
295.164 |
289.563 |
259.447 |
527.306 |
|
|
TOTAL ASSETS (A + B) |
10000 |
4.746.868 |
4.244.812 |
4.866.221 |
4.556.101 |
4.696.540 |
|
|
Liabilities and
Net Worth |
Code |
2013 31/12/2013 |
2012 31/12/2012 |
2011 31/12/2011 |
2010 31/12/2010 |
2009 31/12/2009 |
|
|
A) NET WORTH |
20000 |
2.096.860 |
2.041.786 |
1.970.387 |
1.875.435 |
1.753.383 |
|
|
A-1) Shareholders' equity |
21000 |
2.096.860 |
2.041.786 |
1.970.387 |
1.875.435 |
1.753.383 |
|
|
I. Capital |
21100 |
120.220 |
120.220 |
120.220 |
120.220 |
120.220 |
|
|
1. Registered capital |
21110 |
120.220 |
120.220 |
120.220 |
120.220 |
120.220 |
|
|
2. (Uncalled capital) |
21120 |
0 |
0 |
0 |
0 |
0 |
|
|
II. Share premium |
21200 |
0 |
0 |
0 |
0 |
0 |
|
|
III. Reserves |
21300 |
1.921.566 |
1.850.167 |
1.755.215 |
1.633.163 |
1.491.327 |
|
|
IV. (Common stock equity) |
21400 |
0 |
0 |
0 |
0 |
0 |
|
|
V. Profit or loss brought forward |
21500 |
0 |
0 |
0 |
0 |
0 |
|
|
VI. Other shareholders' contributions |
21600 |
0 |
0 |
0 |
0 |
0 |
|
|
VII. Result of the period |
21700 |
55.073 |
71.399 |
94.953 |
122.052 |
141.836 |
|
|
VIII. (Interim dividend) |
21800 |
0 |
0 |
0 |
0 |
0 |
|
|
A-2) Changes in net worth |
22000 |
0 |
0 |
0 |
0 |
0 |
|
|
A-3) Received subsidies, donations and legacies |
23000 |
0 |
0 |
0 |
0 |
0 |
|
|
B) NON-CURRENT LIABILITIES |
31000 |
0 |
4.643 |
61.772 |
150.179 |
263.220 |
|
|
I. Long-term provisions |
31100 |
0 |
0 |
0 |
0 |
0 |
|
|
II. Long-term creditors |
31200 |
0 |
4.328 |
60.819 |
147.923 |
261.689 |
|
|
1. Amounts owed to credit
institutions |
31220 |
0 |
0 |
1.705 |
1.705 |
1.705 |
|
|
2. Creditors from financial
leasing |
31230 |
0 |
4.328 |
59.114 |
146.218 |
259.984 |
|
|
3. Other long-term creditors |
31290 |
0 |
0 |
0 |
0 |
0 |
|
|
III. Long-term debts with Group companies and
associates |
31300 |
0 |
0 |
0 |
0 |
0 |
|
|
IV. Liabilities for deferred tax |
31400 |
0 |
315 |
953 |
2.256 |
1.531 |
|
|
V. Long-term accruals |
31500 |
0 |
0 |
0 |
0 |
0 |
|
|
VI. Non-current trade creditors |
31600 |
0 |
0 |
0 |
0 |
0 |
|
|
VII. Special long-term debts |
31700 |
0 |
0 |
0 |
0 |
0 |
|
|
C) CURRENT LIABILITIES |
32000 |
2.650.008 |
2.198.383 |
2.834.062 |
2.530.487 |
2.679.937 |
|
|
I. Short-term provisions |
32200 |
0 |
0 |
0 |
0 |
0 |
|
|
II. Short-term creditors |
32300 |
4.337 |
62.274 |
141.671 |
115.435 |
123.183 |
|
|
1. Amounts owed to credit
institutions |
32320 |
0 |
0 |
52.884 |
0 |
0 |
|
|
2. Creditors from financial
leasing |
32330 |
4.337 |
58.905 |
87.124 |
113.772 |
120.164 |
|
|
3. Other short-term creditors |
32390 |
0 |
3.369 |
1.663 |
1.663 |
3.020 |
|
|
III. Short-term amounts owed to group and
associated companies |
32400 |
0 |
0 |
0 |
0 |
0 |
|
|
IV. Trade creditors and other accounts payable |
32500 |
2.645.671 |
2.136.109 |
2.692.390 |
2.415.051 |
2.556.753 |
|
|
1. Suppliers |
32580 |
2.222.101 |
1.713.869 |
2.491.981 |
2.134.228 |
2.145.936 |
|
|
a)
Long-term debts |
32581 |
0 |
0 |
0 |
0 |
0 |
|
|
b)
Short-term debts |
32582 |
2.222.101 |
1.713.869 |
2.491.981 |
2.134.228 |
2.145.936 |
|
|
2. Other creditors |
32590 |
423.571 |
422.240 |
200.409 |
280.824 |
410.818 |
|
|
V. Short-term accruals |
32600 |
0 |
0 |
0 |
0 |
0 |
|
|
VI. Special short-term debts |
32700 |
0 |
0 |
0 |
0 |
0 |
|
|
TOTAL NET WORTH AND LIABILITIES (A + B + C) |
30000 |
4.746.868 |
4.244.812 |
4.866.221 |
4.556.101 |
4.696.540 |
|
|
Profit and
Loss |
Code |
2013 31/12/2013 |
2012 31/12/2012 |
2011 31/12/2011 |
2010 31/12/2010 |
2009 31/12/2009 |
|
|
1. Net turnover |
40100 |
4.044.685 |
3.869.874 |
4.665.332 |
4.467.665 |
4.284.471 |
|
|
2. Changes in stocks of finished goods and work in
progress |
40200 |
0 |
0 |
0 |
0 |
0 |
|
|
3. Works carried out by the company for its assets |
40300 |
0 |
0 |
0 |
0 |
0 |
|
|
4. Supplies |
40400 |
-2.634.422 |
-2.468.374 |
-3.260.299 |
-3.067.431 |
-2.863.620 |
|
|
5. Other operating income |
40500 |
0 |
0 |
0 |
0 |
0 |
|
|
6. Personnel costs |
40600 |
-643.002 |
-756.638 |
-752.183 |
-696.659 |
-703.153 |
|
|
7. Other operating costs |
40700 |
-576.817 |
-442.903 |
-410.727 |
-400.504 |
-382.638 |
|
|
8. Amortisation of fixed assets |
40800 |
-97.722 |
-100.814 |
-107.325 |
-115.892 |
-122.556 |
|
|
9. Allocation of subsidies of non-financial fixed
assets and other |
40900 |
0 |
0 |
0 |
0 |
0 |
|
|
10. Excess provisions |
41000 |
0 |
0 |
0 |
0 |
0 |
|
|
11. Impairment and result of transfers of fixed
assets |
41100 |
-863 |
0 |
1.220 |
-7.177 |
1.359 |
|
|
12. Other results |
41300 |
10.063 |
2.326 |
1.762 |
188 |
475 |
|
|
A) OPERATING INCOME (1 + 2 + 3 + 4 + 5 + 6 + 7 + 8 + 9 + 10 + 11 + 12) |
49100 |
101.921 |
103.470 |
137.780 |
180.189 |
214.336 |
|
|
13. Financial income |
41400 |
424 |
1 |
7 |
5 |
46 |
|
|
a) Allocation of financial
subsidies, donations and legacies |
41430 |
0 |
0 |
0 |
0 |
0 |
|
|
b) Other financial income |
41490 |
424 |
1 |
7 |
5 |
46 |
|
|
14. Financial expenditure |
41500 |
-903 |
-8.372 |
-11.314 |
-11.356 |
-20.743 |
|
|
15. Changes in fair value of financial instruments |
41600 |
0 |
0 |
0 |
0 |
0 |
|
|
16. Exchange rate differences |
41700 |
0 |
0 |
0 |
0 |
0 |
|
|
17. Impairment and result for transfers of
financial instruments |
41800 |
0 |
0 |
0 |
0 |
0 |
|
|
18. Other financial income and expenditure |
42100 |
0 |
0 |
0 |
0 |
0 |
|
|
a) Incorporation of financial
expenditure to assets |
42110 |
0 |
0 |
0 |
0 |
0 |
|
|
b) Financial income from
arrangement with creditors |
42120 |
0 |
0 |
0 |
0 |
0 |
|
|
c) Other income and
expenditure |
42130 |
0 |
0 |
0 |
0 |
0 |
|
|
B) FINANCIAL REVENUE ( 13 + 14 + 15 + 16 + 17 +18 ) |
49200 |
-479 |
-8.371 |
-11.307 |
-11.351 |
-20.697 |
|
|
C) NET RESULT BEFORE TAXES ( A + B ) |
49300 |
101.442 |
95.099 |
126.474 |
168.839 |
193.639 |
|
|
19. Income taxes |
41900 |
-46.369 |
-23.700 |
-31.521 |
-46.787 |
-51.804 |
|
|
D) RESULT OF THE PERIOD ( C + 19 ) |
49500 |
55.073 |
71.399 |
94.953 |
122.052 |
141.836 |
|
DIAGNOSTICO ECONOMICO-FINANCIERO
Economic-Financial
Comparative Analysis
Data used in the following ratios and indicators is taken from the
Annual Accounts submitted by the company to the TRADE REGISTER.
Comparison within the Sector
|
Cash Flow |
2013 |
2012 |
Change 2013 - 2012 |
|
|||
|
|
Company |
Sector |
Company |
Sector |
Company |
Sector |
|
|
Cash Flow over Sales |
0,03 % |
0,02 % |
0,00 % |
0,00 % |
|
|
|
|
EBITDA over Sales |
4,71 % |
2,15 % |
5,22 % |
1,52 % |
-9,78 % |
42,20 % |
|
|
Cash Flow Yield |
0,03 % |
0,02 % |
0,00 % |
0,00 % |
|
|
|
|
Profitability |
2013 |
2012 |
Change 2013 - 2012 |
|
|||
|
|
Company |
Sector |
Company |
Sector |
Company |
Sector |
|
|
Operating economic profitability |
1,95 % |
1,59 % |
2,40 % |
0,40 % |
-18,81 % |
294,65 % |
|
|
Total economic profitability |
2,16 % |
1,96 % |
2,44 % |
1,46 % |
-11,55 % |
34,47 % |
|
|
Financial profitability |
2,63 % |
-0,55 % |
3,50 % |
-2,21 % |
-24,89 % |
75,10 % |
|
|
Margin |
2,27 % |
1,19 % |
2,61 % |
0,31 % |
-13,11 % |
286,46 % |
|
|
Mark-up |
2,26 % |
0,11 % |
2,40 % |
-0,90 % |
-5,76 % |
112,13 % |
|
|
Solvency |
2013 |
2012 |
Change 2013 - 2012 |
|
|||
|
|
Company |
Sector |
Company |
Sector |
Company |
Sector |
|
|
Liquidity |
0,16 |
0,25 |
0,13 |
0,21 |
19,66 % |
16,23 % |
|
|
Acid Test |
0,84 |
0,90 |
0,72 |
0,83 |
15,75 % |
8,05 % |
|
|
Working Capital / Investment |
0,23 |
0,25 |
0,22 |
0,23 |
3,58 % |
6,66 % |
|
|
Solvency |
1,41 |
1,52 |
1,43 |
1,49 |
-1,17 % |
2,04 % |
|
|
Indebtedness |
2013 |
2012 |
Change 2013 - 2012 |
|
|||
|
|
Company |
Sector |
Company |
Sector |
Company |
Sector |
|
|
Indebtedness level |
1,26 |
1,89 |
1,08 |
2,03 |
17,13 % |
-6,99 % |
|
|
Borrowing Composition |
0,00 |
0,30 |
0,00 |
0,32 |
|
-5,07 % |
|
|
Repayment Ability |
20,29 |
26,70 |
393,36 |
142,79 |
-94,84 % |
-81,30 % |
|
|
Warranty |
1,79 |
1,53 |
1,93 |
1,50 |
-7,03 % |
2,46 % |
|
|
Generated resources / Total creditors |
0,06 |
0,02 |
0,08 |
0,01 |
-26,24 % |
27,36 % |
|
|
Efficiency |
2013 |
2012 |
Change 2013 - 2012 |
|
|||
|
|
Company |
Sector |
Company |
Sector |
Company |
Sector |
|
|
Productivity |
1,30 |
1,19 |
1,27 |
1,13 |
2,31 % |
5,46 % |
|
|
Turnover of Collection Rights |
2,28 |
4,36 |
3,03 |
4,48 |
-24,71 % |
-2,80 % |
|
|
Turnover of Payment Entitlements |
1,21 |
3,07 |
1,36 |
3,01 |
-10,94 % |
1,99 % |
|
|
Stock rotation |
2,63 |
4,03 |
2,47 |
3,74 |
6,59 % |
7,71 % |
|
|
Assets turnover |
0,86 |
1,34 |
0,92 |
1,31 |
-6,57 % |
2,12 % |
|
|
Borrowing Cost |
0,03 |
2,45 |
0,38 |
2,58 |
-91,03 % |
-5,12 % |
|
Trend of indicators under the General Accounting Plan of 2007 (2013,
2012, 2011, 2010, 2009)
|
Cash Flow |
2013 31/12/2013 |
2012 31/12/2012 |
2011 31/12/2011 |
2010 31/12/2010 |
2009 31/12/2009 |
|
|
Cash Flow over Sales |
0,03 % |
0,00 % |
0,01 % |
-0,06 % |
6,97 % |
|
|
EBITDA over Sales |
4,71 % |
5,22 % |
5,19 % |
6,78 % |
7,82 % |
|
|
Cash Flow Yield |
0,03 % |
0,00 % |
0,01 % |
-0,06 % |
6,36 % |
|
|
Profitability |
2013 31/12/2013 |
2012 31/12/2012 |
2011 31/12/2011 |
2010 31/12/2010 |
2009 31/12/2009 |
|
|
Operating economic profitability |
1,95 % |
2,40 % |
2,81 % |
3,97 % |
4,57 % |
|
|
Total economic profitability |
2,16 % |
2,44 % |
2,83 % |
3,96 % |
4,56 % |
|
|
Financial profitability |
2,63 % |
3,50 % |
4,82 % |
6,51 % |
8,09 % |
|
|
Margin |
2,27 % |
2,61 % |
2,92 % |
4,03 % |
4,99 % |
|
|
Mark-up |
2,26 % |
2,40 % |
2,67 % |
3,77 % |
4,51 % |
|
|
Solvency |
2013 31/12/2013 |
2012 31/12/2012 |
2011 31/12/2011 |
2010 31/12/2010 |
2009 31/12/2009 |
|
|
Liquidity |
0,16 |
0,13 |
0,10 |
0,10 |
0,20 |
|
|
Acid Test |
0,84 |
0,72 |
0,61 |
0,76 |
0,76 |
|
|
Working Capital / Investment |
0,23 |
0,22 |
0,17 |
0,17 |
0,14 |
|
|
Solvency |
1,41 |
1,43 |
1,29 |
1,30 |
1,24 |
|
|
Indebtedness |
2013 31/12/2013 |
2012 31/12/2012 |
2011 31/12/2011 |
2010 31/12/2010 |
2009 31/12/2009 |
|
|
Indebtedness level |
1,26 |
1,08 |
1,47 |
1,43 |
1,68 |
|
|
Borrowing Composition |
0,00 |
0,00 |
0,02 |
0,06 |
0,10 |
|
|
Repayment Ability |
20,29 |
393,36 |
96,15 |
-10,01 |
8,74 |
|
|
Warranty |
1,79 |
1,93 |
1,68 |
1,70 |
1,60 |
|
|
Generated resources / Total creditors |
0,06 |
0,08 |
0,07 |
0,09 |
0,09 |
|
|
Efficiency |
2013 31/12/2013 |
2012 31/12/2012 |
2011 31/12/2011 |
2010 31/12/2010 |
2009 31/12/2009 |
|
|
Productivity |
1,30 |
1,27 |
1,32 |
1,44 |
1,48 |
|
|
Turnover of Collection Rights |
2,28 |
3,03 |
3,31 |
2,70 |
2,83 |
|
|
Turnover of Payment Entitlements |
1,21 |
1,36 |
1,36 |
1,44 |
1,27 |
|
|
Stock rotation |
2,63 |
2,47 |
2,35 |
3,16 |
3,20 |
|
|
Assets turnover |
0,86 |
0,92 |
0,96 |
0,98 |
0,92 |
|
|
Borrowing Cost |
0,03 |
0,38 |
0,39 |
0,42 |
0,70 |
|
SECTOR-BASED BALANCE COMPARISON
Sector-based
Comparison under the rules of the New General Accounting Plan.
|
|
2013 |
2012 |
Change 2013 -
2012 |
|
|||
|
|
Company |
Sector |
Company |
Sector |
Company |
Sector |
|
|
ASSETS |
4.746.868 |
1.001.258 |
4.244.812 |
924.781 |
11,83 % |
8,27 % |
|
|
NON-CURRENT ASSETS |
1.008.376 |
248.867 |
1.106.707 |
238.616 |
-8,88 % |
4,30 % |
|
|
Tangible fixed assets |
997.802 |
185.047 |
1.095.464 |
178.279 |
-8,92 % |
3,80 % |
|
|
Intangible fixed assets |
2.726 |
8.918 |
2.225 |
8.419 |
22,52 % |
5,92 % |
|
|
Other Non-current Asset |
7.848 |
54.903 |
9.018 |
51.918 |
-12,97 % |
5,75 % |
|
|
CURRENT ASSETS |
3.738.491 |
752.160 |
3.138.105 |
686.165 |
19,13 % |
9,62 % |
|
|
Stock |
1.501.405 |
299.406 |
1.526.202 |
294.460 |
-1,62 % |
1,68 % |
|
|
Debtors |
1.775.242 |
280.188 |
1.278.820 |
246.639 |
38,82 % |
13,60 % |
|
|
Cash flow |
425.748 |
124.975 |
295.164 |
100.507 |
44,24 % |
24,34 % |
|
|
Another Current Asset |
36.097 |
47.594 |
37.919 |
44.530 |
-4,80 % |
6,88 % |
|
|
|
2013 |
2012 |
Change 2013 -
2012 |
|
|||
|
|
Company |
Sector |
Company |
Sector |
Company |
Sector |
|
|
NET ASSETS AND LIABILITIES |
4.746.868 |
1.001.258 |
4.244.812 |
924.781 |
11,83 % |
8,27 % |
|
|
Net Worth |
2.096.860 |
343.189 |
2.041.786 |
297.989 |
2,70 % |
15,17 % |
|
|
Capital and Share Premiums |
120.220 |
76.949 |
120.220 |
74.149 |
0,00 % |
3,78 % |
|
|
Reserves |
1.921.566 |
300.896 |
1.850.167 |
263.853 |
3,86 % |
14,04 % |
|
|
Other Net Assets |
0 |
-32.739 |
0 |
-33.418 |
|
2,03 % |
|
|
Financial Year Result |
55.073 |
-1.890 |
71.399 |
-6.582 |
-22,87 % |
71,29 % |
|
|
NON-CURRENT LIABILITIES |
0 |
154.778 |
4.643 |
156.127 |
-100,00 % |
-0,86 % |
|
|
Long-term debts incurred with companies of the group
and affiliates |
0 |
11.066 |
0 |
10.906 |
|
1,47 % |
|
|
Other Long-term Debts |
0 |
143.712 |
4.643 |
145.220 |
-100,00 % |
-1,04 % |
|
|
CURRENT LIABILITIES |
2.650.008 |
503.291 |
2.198.383 |
470.664 |
20,54 % |
6,93 % |
|
|
Trade Creditors |
2.645.671 |
352.486 |
2.136.109 |
326.887 |
23,85 % |
7,83 % |
|
|
Short-term debts incurred with companies of the
group and affiliates |
0 |
13.666 |
0 |
5.764 |
|
137,08 % |
|
|
Short-term debts |
4.337 |
137.140 |
62.274 |
138.013 |
-93,04 % |
-0,63 % |
|
|
|
2013 |
2012 |
Change 2013 -
2012 |
|
|||
|
|
Company |
Sector |
Company |
Sector |
Company |
Sector |
|
|
Net total sales |
4.044.685 |
1.209.396 |
3.869.874 |
1.093.479 |
4,52 % |
10,60 % |
|
|
+ Other Operating Income |
0 |
11.096 |
0 |
11.376 |
|
-2,46 % |
|
|
= OPERATING INCOMES |
4.044.685 |
1.220.491 |
3.869.874 |
1.104.855 |
4,52 % |
10,47 % |
|
|
- Miscellaneous operating expenses |
-576.817 |
-188.498 |
-442.903 |
-182.789 |
-30,24 % |
-3,12 % |
|
|
- Operating consumption |
-2.634.422 |
-868.577 |
-2.468.374 |
-776.141 |
-6,73 % |
-11,91 % |
|
|
= COMPANY ADDED VALUE |
833.446 |
163.416 |
958.597 |
145.924 |
-13,06 % |
11,99 % |
|
|
- Staff costs |
-643.002 |
-137.358 |
-756.638 |
-129.356 |
15,02 % |
-6,19 % |
|
|
= GROSS OPERATING RESULT |
190.444 |
26.058 |
201.958 |
16.568 |
-5,70 % |
57,28 % |
|
|
-Amortizaciones de Inmovilizado |
-97.722 |
-12.201 |
-100.814 |
-13.427 |
3,07 % |
9,13 % |
|
|
- Turnover provisions variation |
0 |
2 |
0 |
33 |
|
-94,66 % |
|
|
+ Obsolescence and Results from Disposal of Fixed
Assets and Others |
-863 |
697 |
0 |
296 |
|
135,14 % |
|
|
+ Other Results |
10.063 |
2.310 |
2.326 |
7.439 |
332,67 % |
-68,94 % |
|
|
= OPERATING RESULT |
101.921 |
16.809 |
103.470 |
10.835 |
-1,50 % |
55,14 % |
|
|
+ Financial income |
424 |
2.974 |
1 |
3.859 |
53.556,96 % |
-22,94 % |
|
|
- Financial expenditure |
-903 |
-16.013 |
-8.372 |
-15.977 |
89,21 % |
-0,23 % |
|
|
- Obsolescence and Variation of Financial
Instruments |
0 |
-131 |
0 |
-1.193 |
|
89,02 % |
|
|
= RESULT BEFORE TAXES |
101.442 |
3.639 |
95.099 |
-2.474 |
6,67 % |
247,09 % |
|
|
- Corporation tax |
-46.369 |
-5.533 |
-23.700 |
-4.117 |
-95,65 % |
-34,39 % |
|
|
Fiscal year result from interrupted net of taxes
operations |
0 |
0 |
0 |
0 |
|
|
|
|
= FINANCIAL YEAR RESULT |
55.073 |
-1.890 |
71.399 |
-6.591 |
-22,87 % |
71,33 % |
|
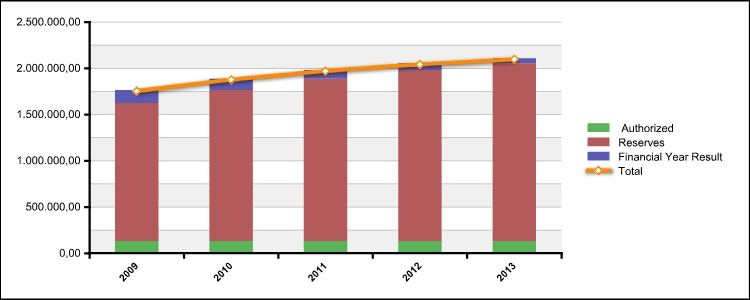
STATEMENT
OF CHANGES IN NET WORTH
Trend of Net Worth
|
Total statement
of changes in equity |
2009 31/12/2009 |
2010 31/12/2010 |
2011 31/12/2011 |
2012 31/12/2012 |
2013 31/12/2013 |
|
|
Authorized |
120.220 |
120.220 |
120.220 |
120.220 |
120.220 |
|
|
Reserves |
1.491.327 |
1.633.163 |
1.755.215 |
1.850.167 |
1.921.566 |
|
|
Financial Year Result |
141.836 |
122.052 |
94.953 |
71.399 |
55.073 |
|
|
Total |
1.753.383 |
1.875.435 |
1.970.387 |
2.041.786 |
2.096.860 |
|
|
|
|
|
Statement of
Changes in Net Worth
Source of data
Data is taken from the annual Profit and Loss Statement submitted by the
company in its Annual Accounts for the fiscal year [ejercicio del balances].
|
Statement of
Changes in Net Worth |
|
TOTAL |
TOTAL |
TOTAL |
TOTAL |
|
|
I. Result in profit and loss account |
528 |
120.220 |
1.755.215 |
94.953 |
1.970.387 |
|
|
A) BALANCE, AS OF END OF FISCAL YEAR 2011 |
511 |
0 |
0 |
0 |
0 |
|
|
I. Adjustments due to criteria changes in fiscal year 2011 and
previous ones |
512 |
0 |
0 |
0 |
0 |
|
|
II. Adjustments due to errors in fiscal year 2011 and previous ones |
513 |
120.220 |
1.755.215 |
94.953 |
1.970.387 |
|
|
B) ADJUSTED BALANCE, AS OF BEGINNING OF FISCAL YEAR 2012 |
514 |
0 |
0 |
71.399 |
71.399 |
|
|
I. Result in profit and loss account |
528 |
0 |
0 |
0 |
0 |
|
|
II. Income and expense acknowledged under net assets |
530 |
0 |
0 |
0 |
0 |
|
|
1. Tax income deferred |
527 |
0 |
0 |
0 |
0 |
|
|
2. Other income and expense acknowledged under net assets |
529 |
0 |
0 |
0 |
0 |
|
|
III. Transactions with partners or owners |
516 |
0 |
0 |
0 |
0 |
|
|
1.- Capital increases |
517 |
0 |
0 |
0 |
0 |
|
|
2.- (-) Capital reductions |
518 |
0 |
0 |
0 |
0 |
|
|
3.- Other transactions with partners or owners |
526 |
0 |
94.953 |
-94.953 |
0 |
|
|
IV. Other net assets variations |
524 |
0 |
0 |
0 |
0 |
|
|
1. Activity of Revaluation reserve |
531 |
0 |
94.953 |
-94.953 |
0 |
|
|
2. Other variations |
532 |
120.220 |
1.850.167 |
71.399 |
2.041.786 |
|
|
C) BALANCE, AS OF END OF FISCAL YEAR 2012 |
511 |
0 |
0 |
0 |
0 |
|
|
I. Adjustments due to criteria changes in fiscal year 2012 |
512 |
0 |
0 |
0 |
0 |
|
|
II. Adjustments due to errors in fiscal year 2012 |
513 |
120.220 |
1.850.167 |
71.399 |
2.041.786 |
|
|
D) ADJUSTED BALANCE, AS OF BEGINNING OF FISCAL YEAR 2013 |
514 |
NaN |
0 |
55.073 |
55.073 |
|
|
II. Income and expense acknowledged under net assets |
530 |
0 |
0 |
0 |
0 |
|
|
1. Tax income deferred |
527 |
0 |
0 |
0 |
0 |
|
|
2. Other income and expense acknowledged under net assets |
529 |
0 |
0 |
0 |
0 |
|
|
III. Transactions with partners or owners |
516 |
0 |
0 |
0 |
0 |
|
|
1.- Capital increases |
517 |
0 |
0 |
0 |
0 |
|
|
2.- (-) Capital reductions |
518 |
0 |
0 |
0 |
0 |
|
|
3.- Other transactions with partners or owners |
526 |
0 |
0 |
0 |
0 |
|
|
IV. Other net assets variations |
524 |
0 |
71.399 |
-71.399 |
0 |
|
|
1. Activity of Revaluation reserve |
531 |
0 |
0 |
0 |
0 |
|
|
2. Other variations |
532 |
0 |
71.399 |
-71.399 |
0 |
|
|
E) BALANCE, AS OF END OF FISCAL YEAR 2013 |
525 |
120.220 |
1.921.566 |
55.073 |
2.096.860 |
|
CASHFLOW
STATEMENT
Model: Normal
Source of information: Data contained in this section is taken from the information
declared in the Annual Accounts submitted to the Trade Register.
|
|
Code |
2013 |
2012 |
2011 |
2010 |
2009 |
|
|
1. Fiscal year result before taxes. |
61100 |
101.442 |
95.099 |
126.474 |
168.839 |
193.639 |
|
|
2. Results adjustments. |
61200 |
98.202 |
109.185 |
118.632 |
127.243 |
143.253 |
|
|
a) Fixed Assets Amortization (+). |
61201 |
97.722 |
100.814 |
107.325 |
115.892 |
122.556 |
|
|
g) Financial income (-). |
61207 |
-424 |
-1 |
-7 |
-5 |
-46 |
|
|
h) Financial Expenses (+). |
61208 |
903 |
8.372 |
11.314 |
11.356 |
20.743 |
|
|
3. Changes in current capital equity. |
61300 |
-6.609 |
-49.031 |
-88.128 |
-423.800 |
133.385 |
|
|
a) Stock (+/-). |
61301 |
24.797 |
405.569 |
-578.493 |
-81.364 |
-74.964 |
|
|
d) Debtors and other accounts receivable (+/-). |
61302 |
-496.421 |
131.963 |
243.420 |
-140.994 |
113.218 |
|
|
c) Other current assets (+/-). |
61303 |
1.822 |
-6.582 |
1.128 |
-12.953 |
2.244 |
|
|
d) Creditors and other accounts payable (+/-). |
61304 |
463.193 |
-579.981 |
245.818 |
-188.489 |
92.888 |
|
|
4. Other cash flows for operating activities. |
61400 |
-479 |
-8.371 |
-11.307 |
-11.351 |
-20.697 |
|
|
a) Interest payments (-). |
61401 |
-903 |
-8.372 |
-11.314 |
-11.356 |
-20.743 |
|
|
c) Interest collection (+). |
61403 |
424 |
1 |
7 |
5 |
46 |
|
|
5. Operating activity cash flows (1 + 2 + 3 + 4) |
61500 |
192.555 |
146.883 |
145.671 |
-139.069 |
449.580 |
|
|
6. Payments for investment (-). |
62100 |
-501 |
-1.425 |
-1.163 |
-640 |
-1.170 |
|
|
b) Intangible fixed assets. |
62102 |
-501 |
-1.425 |
0 |
0 |
0 |
|
|
e) Other financial assets. |
62105 |
0 |
0 |
-1.163 |
-640 |
-1.170 |
|
|
7. Divestment payment collection (+). |
62200 |
98.831 |
97.484 |
55.105 |
108.530 |
112.794 |
|
|
b) Intangible fixed assets. |
62202 |
0 |
0 |
0 |
3.228 |
4.783 |
|
|
c) Fixed assets. |
62203 |
97.661 |
97.484 |
55.105 |
105.302 |
108.011 |
|
|
e) Other financial assets. |
62205 |
1.170 |
0 |
0 |
0 |
0 |
|
|
8. Investment activity cash flows (6 + 7) minus Amortization |
62300 |
608 |
-4.755 |
-53.383 |
-8.002 |
-10.932 |
|
|
9. Payment collection and payments for equity instruments. |
63100 |
0 |
0 |
0 |
0 |
0 |
|
|
a) Issuance of equity instruments (+). |
63101 |
0 |
0 |
0 |
0 |
0 |
|
|
10. Payment collection and payments for financial liabilities
instruments. |
63200 |
-62.579 |
-136.527 |
-62.171 |
-120.789 |
-139.998 |
|
|
a) Issuance |
63201 |
0 |
1.705 |
52.884 |
726 |
0 |
|
|
2. Debts incurred with credit institutions (+). |
63203 |
0 |
0 |
52.884 |
0 |
0 |
|
|
5. Other debts (+). |
63206 |
0 |
1.705 |
0 |
726 |
0 |
|
|
b) Repayment and amortization of |
63207 |
-62.579 |
-138.232 |
-115.056 |
-121.514 |
-139.998 |
|
|
2. Debts incurred with credit institutions (-). |
63209 |
0 |
-54.589 |
0 |
0 |
-3.880 |
|
|
4. Special characteristic debts (-). |
63211 |
-58.896 |
-83.004 |
-113.752 |
-120.158 |
-134.497 |
|
|
5. Other debts (-). |
63212 |
-3.683 |
-638 |
-1.303 |
-1.356 |
-1.622 |
|
|
11. Payments from dividends and remunerations from other assets
instruments. |
63300 |
0 |
0 |
0 |
0 |
0 |
|
|
12. Cash flows for financing activities (9+10+11). |
63400 |
-62.579 |
-136.527 |
-62.171 |
-120.789 |
-139.998 |
|
|
D) EFFECT OF EXCHANGE RATE CHANGES |
64000 |
0 |
0 |
0 |
0 |
0 |
|
|
E) NET INCREASE/DECREASE OF CASH OR EQUIVALENT ASSETS
(+/-5+/-8+/12+/-D) |
65000 |
130.584 |
5.601 |
30.117 |
-267.859 |
298.650 |
|
|
Cash or equivalent assets as of beginning of the
fiscal year. |
65100 |
295.164 |
289.563 |
259.447 |
527.306 |
228.656 |
|
|
Cash or equivalent assets as of end of the fiscal
year. |
65200 |
425.748 |
295.164 |
289.563 |
259.447 |
527.306 |
|
AUDITORIAS
DE CUENTAS ANUALES
|
Financial Year |
Auditor's Company |
Audit Date |
Result |
Audit Cost |
Other Services |
Cost of other Services |
|
2007 |
SICET SERVICIOS INTEGRALES SL |
28/06/2008 |
|
|
|
|
REGISTRY
DATA
|
Mercantile Registry: |
MADRID |
|
Register Data: |
8 Hoja Registral: 143218 |
|
Date of formation: |
23/12/1994 |
|
Corporate Purpose published in the Borme: |
COMERCIO MAYOR DE VESTUARIO Y ACCESORIOS DE PROTECCION LABORAL. EL
DESARROLLO DE LAS ACTIVIDADES DE COMERCIO AL POR MAYOR Y DETALLISTA DE
VESTUARIO Y ACCESORIOS DE PROTECCIÓN LABORAL, ASÍ COMO CONFECCIÓN,
TRANSFORMACIÓN, MARCAJE Y ESTAMPACIÓN DE PRENDAS DE VESTUARIO Y ACCESORIOS DE
PROTECCIÓN LABORAL . FECHA DE PUBLICACION 10/07/2014 |
|
Registered Office: |
PASEO DE LAS FLORES, 16. -COSLADA- MADRID |
|
Auditor / Auditing Firm / Year: |
ESTGER ESTEVEZ RODRIGUEZ / SICET SERVICIOS INTEGRALES SL
/ 2007 |
|
Audit Opinion: |
28/06/2008 |
|
Auditing Firm fees: |
NaN Euros |
CHRONOLOGICAL
SUMMARY
Note: ![]() Important
Important ![]() Very Important
Very Important
|
1995 |
Appointments/ Re-elections (2) Company Formation (1) |
|
1996 |
Accounts deposit (ejer. 1995) |
|
1997 |
Accounts deposit (ejer. 1996) |
|
1998 |
Accounts deposit (ejer. 1997)
Appointments/ Re-elections (1) |
|
1999 |
Accounts deposit (ejer. 1998)
|
|
2000 |
Accounts deposit (ejer. 1999) |
|
2001 |
Accounts deposit (ejer. 2000) |
|
2002 |
Accounts deposit (ejer. 2001) |
|
2004 |
Accounts deposit (ejer. 2002, 2003) |
|
2005 |
Accounts deposit (ejer. 2004)
|
|
2006 |
Accounts deposit (ejer. 2005) |
|
2007 |
Accounts deposit (ejer. 2006) Appointments/ Re-elections (1) |
|
2009 |
Accounts deposit (ejer. 2007, 2008) |
|
2010 |
Accounts deposit (ejer. 2009) |
|
2011 |
Accounts deposit (ejer. 2010) |
|
2012 |
Accounts deposit (ejer. 2011) |
|
2013 |
Accounts deposit (ejer. 2012) |
|
2014 |
Accounts deposit (ejer. 2013)
|
MAIN
HISTORIC CHANGES
|
Concept |
Publication |
Act |
Date |
|
|
|
|
|
|
Corporate Purpose Changes: |
COMERCIO MAYOR DE VESTUARIO Y ACCESORIOS DE PROTECCION LABORAL. |
Company Formation |
30/01/1995 |
BREAKDOWN
OF OWNERS EQUITY
|
Current Notarised Capital: |
120.220 EUROS |
|
Current Paid-up Capital: |
120.220 EUROS |
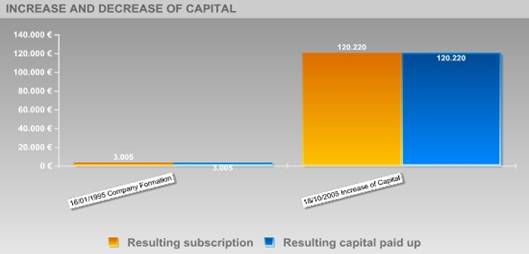
UPDATED EVOLUTION OF THE SUBSCRIBED AND
PAID-IN CAPITAL
|
Inscription date |
Type of Registration |
Capital Subscribed |
Paid up capital |
Underwritten result |
Disbursed Result |
|
18/10/2005 |
Increase of Capital |
117.214,5€ |
117.214,5€ |
120.220€ |
120.220€ |
|
16/01/1995 |
Company Formation |
3.005,06€ |
3.005,06€ |
3.005,06€ |
3.005,06€ |
ACTIVE
SOCIAL BODIES
Órganos Sociales Activos - Total: 4
|
Cargo publicado |
Nombre Órgano
Social |
Fecha
Nombramiento |
Otros Cargos en
esta Sociedad |
|
SINGLE ADMINISTRATOR |
JOSE ANTONIO CABEZAS RUIZ |
07/05/1998 |
2 |
|
PROXY |
SAGRARIO MORENO ARROYO |
17/05/1995 |
1 |
|
PROXY |
JOSE MIGUEL VALDEZ CABEZAS |
17/05/1995 |
1 |
|
ACCOUNTS' AUDITOR / HOLDER |
SICET SERVICIOS INTEGRALES SOCIEDAD LIMITADA UNIPERSONAL |
11/06/2007 |
1 |
EXECUTIVE
BOARD
|
Post |
Name |
|
MANAGING DIRECTOR: |
JOSE CABEZAS |
|
FINANCIAL DIRECTOR: |
ANGEL ALARCO |
VINCULACIONES Y
ANALISIS DE LA INFLUENCIA
Summary of business environment influence:
PROBABILITY OF DEFAULT
|
|
TOTAL |
Maximum |
High |
Moderate |
Minimal |
Unclassified |
|
Shareholders |
2 |
|
|
|
|
2 |
|
Companies' split-ups, takeovers and mergers |
1 |
1 |
|
|
|
|
|
Other relations |
1 |
1 |
|
|
|
|
Full description of business environment influence :
Shareholders
|
Entity |
Capital share |
Status |
Size |
Liquidity |
Solvency |
Indebtedness level |
Probability of Default |
|
JOSE ANTONIO CABEZAS RUIZ |
50 % |
|
|
|
|
|
|
|
SAGRARIO MORENO ARROYO |
50 % |
|
|
|
|
|
|
Companies'
split-ups, takeovers and mergers
Taken over companies
|
Entity |
Status |
Size |
Liquidity |
Solvency |
Indebtedness
level |
Probability of
Default |
|
VESTUARIO LABORAL RAYSER SL |
TERMINATION BY TAKEOVER MERGER |
SMALL |
0.48 |
14.00 |
0.07 |
Máximo |
Other
relations
|
Entity |
Status |
Size |
Liquidity |
Solvency |
Indebtedness
level |
Probability of
Default |
|
VESTUARIO LABORAL RAYSER SL |
TERMINATION BY TAKEOVER MERGER |
SMALL |
0.48 |
14.00 |
0.07 |
Máximo |
INFORMACION
MEDIOAMBIENTAL
In the Memory of this company corresponding to the year 2009 there are
no of investments intended for the protection of the Environment during such
fiscal year
SECTORS OF INTEREST THAT HAVE CONSULTED THIS ENTERPRISE
|
Sector |
2003 (7) |
2004 (12) |
2005 (13) |
2006 (9) |
2007 (16) |
2008 (25) |
2009 (58) |
2010 (26) |
2011 (15) |
2012 (9) |
2013 (21) |
2014 (33) |
2015 (5) |
|
|
MISCELLANEOUS SECTORS |
|
2 |
4 |
|
2 |
11 |
44 |
13 |
|
|
|
2 |
|
|
|
INSURANCE AND FINANCIAL SERVICES |
2 |
|
4 |
2 |
10 |
11 |
2 |
4 |
|
2 |
4 |
9 |
2 |
|
|
WHOLESALERS AND MIDDLEMEN |
|
2 |
|
2 |
|
|
|
|
6 |
1 |
8 |
6 |
|
|
|
TEXTILE, TAILORING, FURRIERY AND FOOTWARE |
|
|
2 |
|
|
2 |
|
3 |
6 |
1 |
1 |
1 |
|
|
|
AUDITORS, ECONOMISTS AND CONSULTANTS |
|
3 |
|
|
|
|
|
|
2 |
2 |
4 |
4 |
|
|
|
MARKETING/PUBLICITY AND PUBLIC RELATIONS |
|
|
|
|
|
|
|
2 |
1 |
1 |
4 |
5 |
1 |
|
|
PRODUCTION OF MATERIALS AND RAW MATERIALS |
|
|
|
|
|
|
10 |
|
|
|
|
|
|
|
|
TRADE REPORTS |
1 |
|
|
|
2 |
1 |
|
2 |
|
|
|
|
|
|
|
RETAIL DEALERS- COMMERCIAL ESTABLISHMENTS |
|
|
|
|
2 |
|
|
|
|
|
|
2 |
2 |
|
|
PRESS, EDITORIAL AND NEWS AGENCIES |
|
|
|
5 |
|
|
|
|
|
|
|
|
|
|
|
COMPUTER SCIENCE, OFFIMATIC AND ELECTRONIC |
|
3 |
|
|
|
|
|
|
|
|
|
|
|
|
|
PUBLIC ADMINISTRATION |
2 |
|
|
|
|
|
|
|
|
|
|
|
|
|
|
GRAPHIC ARTS, EDITION, REPRODUCTION |
2 |
|
|
|
|
|
|
|
|
|
|
|
|
|
|
AGENCIES AND CONSULTANCIES |
|
|
|
|
|
|
|
|
|
2 |
|
|
|
|
|
TRANSPORT AND GOODS |
|
|
|
|
|
|
|
|
|
|
|
2 |
|
|
|
VEHICLES, SPARE PARTS AND ACCESSORIES |
|
|
|
|
|
|
|
2 |
|
|
|
|
|
|
|
E-COMMERCE |
|
|
2 |
|
|
|
|
|
|
|
|
|
|
|
|
CHEMISTRY |
|
2 |
|
|
|
|
|
|
|
|
|
|
|
|
|
MANUFACTURE, REPAIR AND RENT OF CONSUMER GOODS |
|
|
|
|
|
|
2 |
|
|
|
|
|
|
|
|
INDIVIDUALS |
|
|
|
|
|
|
|
|
|
|
|
2 |
|
|
|
INVESTIGATORS/BAD DEBTS CHARGE/SECURITY |
|
|
1 |
|
|
|
|
|
|
|
|
|
|
|
FOREIGN EXCHANGE RATES
|
Currency |
Unit
|
Indian Rupees |
|
US Dollar |
1 |
Rs.62.39 |
|
|
1 |
Rs.91.06 |
|
Euro |
1 |
Rs.66.16 |
INFORMATION DETAILS
|
Analysis Done by
: |
SUB |
|
|
|
|
Report Prepared
by : |
ANK |
RATING EXPLANATIONS
|
RATING |
STATUS |
PROPOSED CREDIT LINE |
|
|
>86 |
Aaa |
Possesses an extremely sound financial base with the strongest
capability for timely payment of interest and principal sums |
Unlimited |
|
71-85 |
Aa |
Possesses adequate working capital. No caution needed for credit
transaction. It has above average (strong) capability for payment of interest
and principal sums |
Large |
|
56-70 |
A |
Financial & operational base are regarded healthy. General
unfavourable factors will not cause fatal effect. Satisfactory capability for
payment of interest and principal sums |
Fairly Large |
|
41-55 |
Ba |
Overall operation is considered normal. Capable to meet normal
commitments. |
Satisfactory |
|
26-40 |
B |
Capability to overcome financial difficulties seems comparatively below
average. |
Small |
|
11-25 |
Ca |
Adverse factors are apparent. Repayment of interest and principal sums
in default or expected to be in default upon maturity |
Limited with
full security |
|
<10 |
C |
Absolute credit risk exists. Caution needed to be exercised |
Credit not
recommended |
|
-- |
NB |
New Business |
-- |
This score serves as a reference to assess
SC’s credit risk and to set the amount of credit to be extended. It is
calculated from a composite of weighted scores obtained from each of the major
sections of this report. The assessed factors and their relative weights (as
indicated through %) are as follows:
Financial
condition (40%) Ownership
background (20%) Payment
record (10%)
Credit history
(10%) Market trend (10%) Operational size
(10%)
This report is issued at your request without any
risk and responsibility on the part of MIRA INFORM PRIVATE LIMITED (MIPL)
or its officials.