MIRA INFORM REPORT
|
Report No. : |
317978 |
|
Report Date : |
17.04.2015 |
IDENTIFICATION DETAILS
|
Name : |
NECTAR LIFE SCIENCES LIMITED [w.e.f.26.03.2004] |
|
|
|
|
Formerly Known
As : |
SURYA MEDICARE LIMITED |
|
|
|
|
Registered
Office : |
Village Saidpura, Tehsil Dera Bassi, District Patiala – 140507, Punjab |
|
Tel. No.: |
91-1762-308000 |
|
|
|
|
Country : |
India |
|
|
|
|
Financials (as
on) : |
31.03.2014 |
|
|
|
|
Date of
Incorporation : |
27.06.1995 |
|
|
|
|
Com. Reg. No.: |
16-016664 |
|
|
|
|
Capital
Investment / Paid-up Capital : |
Rs. 224.260 Million |
|
|
|
|
CIN No.: [Company Identification
No.] |
L24232PB1995PLC016664 |
|
|
|
|
TAN No.: [Tax Deduction &
Collection Account No.] |
PTLS10181D |
|
|
|
|
PAN No.: [Permanent Account No.] |
AABCS6468G |
|
|
|
|
Legal Form : |
A Public Limited Liability Company. The Company’s Shares are Listed on
the Stock Exchanges. |
|
|
|
|
Line of Business
: |
Manufacturer and Exporter of Pharmaceutical Products. |
|
|
|
|
No. of Employees
: |
1500 (Approximately) |
RATING & COMMENTS
|
MIRA’s Rating : |
Ba (50) |
|
RATING |
STATUS |
PROPOSED CREDIT LINE |
|
|
41-55 |
Ba |
Overall operation is considered normal. Capable to meet normal
commitments. |
Satisfactory |
|
Status : |
Satisfactory |
|
|
|
|
Payment Behaviour : |
No Complaints |
|
|
|
|
Litigation : |
Exist |
|
|
|
|
Comments : |
Subject is an established company having satisfactory track record. General financial position of the company seems to be sound and
healthy. Profitability of the company is fair. Trade relations are fair. Business is active. Payment terms are
reported to be usually correct. The company can be considered for business dealings at usual trade
terms and conditions. |
NOTES :
Any query related to this report can be made
on e-mail : infodept@mirainform.com
while quoting report number, name and date.
ECGC Country Risk Classification List – December 31, 2014
|
Country Name |
Previous Rating (30.09.2014) |
Current Rating (31.12.2014) |
|
India |
A1 |
A1 |
|
Risk Category |
ECGC
Classification |
|
Insignificant |
A1 |
|
Low |
A2 |
|
Moderate |
B1 |
|
High |
B2 |
|
Very High |
C1 |
|
Restricted |
C2 |
|
Off-credit |
D |
RBI DEFAULTERS’ LIST STATUS
Subject’s name is not enlisted as a defaulter
in the publicly available RBI Defaulters’ list.
EPF (Employee Provident Fund) DEFAULTERS’ LIST STATUS
Subject’s name is not enlisted as a defaulter
in the publicly available EPF (Employee Provident Fund) Defaulters’ list as of
31-03-2014.
INFORMATION PARTED BY (GENERAL DETAILS)
|
Name : |
Not Divulged |
|
Designation : |
DPT Manager |
|
Contact No.: |
91-1762-308000 |
|
Date : |
16.04.2015 |
LOCATIONS
|
Registered
Office : |
Village Saidpura,
Tehsil Dera Bassi, District |
|
Tel. No.: |
91-1762-308000/
308001/ 231187/ 231287/ 231387 |
|
Fax No.: |
91-1762-281187 |
|
E-Mail : |
|
|
Website : |
|
|
|
|
|
Corporate/
Head Office : |
SCO 38-39, Sector
9-D, Chandigarh – 160009 (U.T.), India |
|
Tel. No.: |
91-172-3047777/
3047701 |
|
Fax No.: |
91-172-3047755 |
|
|
|
|
Marketing
Office : |
D-708, Crysral Plaza, Office New Link Road, Opposite Infinitti Mall, Andheri (West), Mumbai – 400053, Maharashtra, India |
|
Tel. No.: |
91-22-32060171 |
|
Fax No.: |
91-22-26736793 |
|
|
|
|
Delhi Office : |
F-66, 6th
Floor, Himalaya house, 23 KG Marg, C.P., New Delhi – 110001, India |
|
Tel. No.: |
91-11-42403311/
22 |
|
|
|
|
Factories : |
·
Unit I Village: Saidpura, Tehsil: Derabassi,
District Mohali, Punjab, India ·
Unit II Village: Saidpura, Tehsil: Derabassi,
District Mohali, Punjab, India ·
Empty Hard
Gelatin Capsule Unit Village Bhatoli Kalan, Pargana Dharmpur, Tehsil Nalagarh,
District Solan, Himachal Pradesh,
India ·
Formulation Unit Village Bhatoli Kalan, Pargana Dharmpur, Tehsil Nalagarh,
District Solan, Himachal Pradesh,
India ·
Narbada
Industries Plot No. 2, Lane No. 4, Phase II, SIDCO Industrial Complex, Bari
Brahmana, Jammu, Jammu and Kashmir, India |
DIRECTORS
AS ON 31.03.2014
|
Name : |
Mr. Sanjiv Goyal |
|
Designation : |
Chairman and Managing Director |
|
|
|
|
Name : |
Mr. Aryan Goyal |
|
Designation : |
Executive
Director |
|
|
|
|
Name : |
Mr. Vivek Seth |
|
Designation : |
Director |
|
|
|
|
Name : |
Mr. Vijay J Shah |
|
Designation : |
Independent Director |
|
|
|
|
Name : |
Mr. B.K. Goswami,
IAS [Retd.] |
|
Designation : |
Independent Director |
|
|
|
|
Name : |
Dr. [Maj Gen]
S.S. Chauhan, VSM [Retd.] |
|
Designation : |
Independent Director |
|
|
|
|
Name : |
Mr. Raman Kapur |
|
Designation : |
Independent Director |
|
|
|
|
Name : |
Mr. Ajay Swaroop |
|
Designation : |
Independent Director |
|
|
|
|
Name : |
Mr. Dinesh Dua |
|
Designation : |
Chief Executive Officer and Director |
|
|
|
|
Name : |
Mr. H.P. Singh |
|
Designation : |
Nominee Director |
|
|
|
|
Name : |
Ms. Rima
Marphatia |
|
Designation : |
Independent Director |
KEY EXECUTIVES
|
Name : |
Mr. Sandeep Goel |
|
Designation : |
Chief Financial Officer |
|
|
|
|
Name : |
Mr. R.K. Aggarwal |
|
Designation : |
Vice President [Accounts] |
|
|
|
|
Name : |
Mr. Sunder Lal |
|
Designation : |
Vice President and Company Secretary |
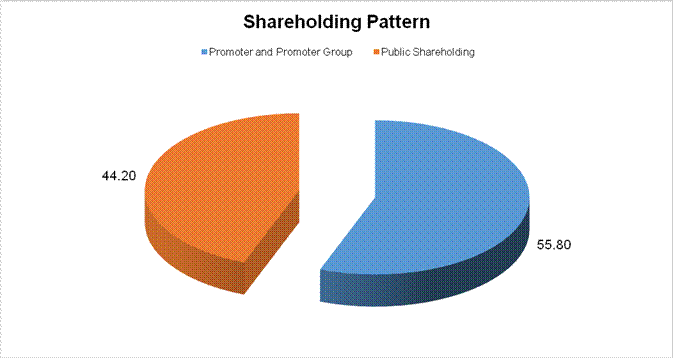
MAJOR SHAREHOLDERS / SHAREHOLDING PATTERN
AS ON 31.12.2014
|
Category of Shareholder |
Total
No. of Shares |
As a % |
|
(A) Shareholding of Promoter and Promoter
Group |
|
|
|
|
|
|
|
|
99468000 |
55.80 |
|
|
99468000 |
55.80 |
|
|
|
|
|
Total shareholding of Promoter and Promoter
Group (A) |
99468000 |
55.80 |
|
(B) Public Shareholding |
|
|
|
|
|
|
|
|
113150 |
0.06 |
|
|
2800000 |
1.57 |
|
|
3872731 |
2.17 |
|
|
26000000 |
14.59 |
|
|
26000000 |
14.59 |
|
|
32785881 |
18.39 |
|
|
|
|
|
|
15878169 |
8.91 |
|
|
|
|
|
|
22035828 |
12.36 |
|
|
5615244 |
3.15 |
|
|
2477848 |
1.39 |
|
|
2224694 |
1.25 |
|
|
232104 |
0.13 |
|
|
21050 |
0.01 |
|
|
46007089 |
25.81 |
|
Total Public shareholding (B) |
78792970 |
44.20 |
|
Total (A)+(B) |
178260970 |
100.00 |
|
(C) Shares held by Custodians and against which
Depository Receipts have been issued |
|
|
|
|
0 |
0.00 |
|
|
46000000 |
0.00 |
|
|
46000000 |
0.00 |
|
Total (A)+(B)+(C) |
224260970 |
100.00 |
BUSINESS DETAILS
|
Line of Business : |
Manufacturer and Exporter of Pharmaceutical Products. |
|
|
|
|
Brand Names : |
-- |
|
|
|
|
Agencies Held : |
-- |
|
|
|
|
Exports : |
|
|
Products : |
Pharmaceutical Products |
|
Countries : |
· Germany · Italy |
|
|
|
|
Imports : |
|
|
Products : |
Raw material |
|
Countries : |
China |
|
|
|
|
Terms : |
|
|
Selling : |
L/C |
|
|
|
|
Purchasing : |
L/C |
PRODUCTION STATUS: NOT AVAILABLE
GENERAL INFORMATION
|
Suppliers : |
|
||||||||||||||||||||||
|
|
|
||||||||||||||||||||||
|
Customers : |
Wholesalers
|
||||||||||||||||||||||
|
|
|
||||||||||||||||||||||
|
No. of Employees : |
1500 (Approximately) |
||||||||||||||||||||||
|
|
|
||||||||||||||||||||||
|
Bankers : |
· Punjab National Bank Sector 16D, Chandigarh, India · State Bank of India Specialized Commercial Branch, Sector 17B, Chandigarh, India · Vijaya Bank Barakhamba Road, New Delhi, India · Exim Bank Mumbai, Maharashtra, India · HSBC Bank Limited Barakhamba Road, New Delhi, India · IFCI Limited · ICICI Bank Limited · State Bank of Bikaner and Jaipur |
||||||||||||||||||||||
|
|
|
||||||||||||||||||||||
|
Facilities : |
|
|
|
|
|
Auditors : |
|
|
Name : |
Datta Singla and Company Chartered Accountants |
|
Address : |
SCO 2935-36, 1st Floor, Sector 22-C, Chandigarh, India |
|
|
|
|
Subsidiary Company : |
Nectar Lifesciences UK Limited, United Kingdom |
|
|
|
|
Related Party : |
ABB Global
Industries and Services Limited |
|
|
|
|
Entities over which key management personnel/ their relatives are able
to exercise significant influence : |
· Surya Narrow Fabrics, New Delhi · Nectar Lifestyles Private Limited, New Delhi · Nectar Organics Private Limited, New Delhi |
CAPITAL STRUCTURE
AS ON 31.03.2014
Authorised Capital :
|
No. of Shares |
Type |
Value |
Amount |
|
|
|
|
|
|
350000000 |
Equity Shares |
Re. 1/- each |
Rs. 350.000 Million |
|
|
|
|
|
Issued, Subscribed & Paid-up Capital :
|
No. of Shares |
Type |
Value |
Amount |
|
|
|
|
|
|
224260970 |
Equity Shares |
Re. 1/- each |
Rs. 224.260 Million |
|
|
|
|
|
FINANCIAL DATA
[all figures are
in Rupees Million]
ABRIDGED BALANCE
SHEET
|
SOURCES OF FUNDS |
31.03.2014 |
31.03.2013 |
31.03.2012 |
|
I.
EQUITY AND LIABILITIES |
|
|
|
|
(1)Shareholders' Funds |
|
|
|
|
(a) Share Capital |
224.260 |
224.260 |
224.260 |
|
(b) Reserves & Surplus |
9046.360 |
8451.800 |
7621.200 |
|
(c) Money received against share warrants |
0.000 |
0.000 |
0.000 |
|
|
|
|
|
|
(2) Share
Application money pending allotment |
0.000 |
0.000 |
0.000 |
|
Total
Shareholders’ Funds (1) + (2) |
9270.620 |
8676.060 |
7845.460 |
|
|
|
|
|
|
(3)
Non-Current Liabilities |
|
|
|
|
(a) long-term borrowings |
2233.380 |
2609.610 |
3636.170 |
|
(b) Deferred tax liabilities (Net) |
1118.920 |
957.560 |
630.230 |
|
(c)
Other long term liabilities |
8.080 |
10.300 |
19.570 |
|
(d)
long-term provisions |
49.000 |
37.890 |
34.260 |
|
Total
Non-current Liabilities (3) |
3409.380 |
3615.360 |
4320.230 |
|
|
|
|
|
|
(4) Current Liabilities |
|
|
|
|
(a)
Short term borrowings |
5798.420 |
5091.110 |
5652.110 |
|
(b)
Trade payables |
4400.610 |
3825.190 |
1944.910 |
|
(c)
Other current liabilities |
867.150 |
1312.760 |
1298.430 |
|
(d)
Short-term provisions |
194.480 |
219.960 |
148.140 |
|
Total
Current Liabilities (4) |
11260.660 |
10449.020 |
9043.590 |
|
|
|
|
|
|
TOTAL |
23940.660 |
22740.440 |
21209.280 |
|
|
|
|
|
|
II.
ASSETS |
|
|
|
|
(1) Non-current assets |
|
|
|
|
(a)
Fixed Assets |
|
|
|
|
(i)
Tangible assets |
9475.430 |
9138.390 |
8578.710 |
|
(ii)
Intangible Assets |
0.000 |
0.000 |
0.000 |
|
(iii)
Capital work-in-progress |
1222.630 |
1385.700 |
1501.340 |
|
(iv) Intangible assets under development |
0.000 |
0.000 |
0.000 |
|
(b) Non-current
Investments |
0.500 |
0.500 |
0.500 |
|
(c) Deferred tax assets
(net) |
0.000 |
0.000 |
0.000 |
|
(d) Long-term Loan
and Advances |
868.670 |
704.860 |
631.850 |
|
(e)
Other Non-current assets |
0.070 |
0.150 |
0.230 |
|
Total
Non-Current Assets |
11567.300 |
11229.600 |
10712.630 |
|
|
|
|
|
|
(2) Current assets |
|
|
|
|
(a)
Current investments |
3.130 |
3.190 |
1.410 |
|
(b)
Inventories |
7584.270 |
6760.000 |
5914.160 |
|
(c)
Trade receivables |
3766.490 |
3493.860 |
3044.930 |
|
(d)
Cash and cash equivalents |
99.780 |
62.400 |
259.250 |
|
(e)
Short-term loans and advances |
658.290 |
868.430 |
1050.420 |
|
(f)
Other current assets |
261.400 |
322.960 |
226.480 |
|
Total
Current Assets |
12373.360 |
11510.840 |
10496.650 |
|
|
|
|
|
|
TOTAL |
23940.660 |
22740.440 |
21209.280 |
PROFIT & LOSS
ACCOUNT
|
|
PARTICULARS |
31.03.2014 |
31.03.2013 |
31.03.2012 |
|
|
|
SALES |
|
|
|
|
|
|
|
Revenue from Operations |
16377.690 |
16248.140 |
13032.880 |
|
|
|
Operating Income |
5.430 |
14.370 |
98.180 |
|
|
|
Other Income |
116.270 |
160.400 |
128.940 |
|
|
|
TOTAL (A) |
16499.390 |
16422.910 |
13260.000 |
|
|
|
|
|
|
|
|
Less |
EXPENSES |
|
|
|
|
|
|
|
Cost of Materials Consumed |
11726.710 |
11465.220 |
9783.500 |
|
|
|
Purchases of Stock-in-Trade |
398.230 |
599.980 |
630.270 |
|
|
|
Changes in inventories of finished goods, work-in-progress
and Stock-in-Trade |
(578.110) |
(644.020) |
(1346.690) |
|
|
|
Employees benefits expense |
513.290 |
486.110 |
476.590 |
|
|
|
Other expenses |
1435.310 |
1454.420 |
1101.880 |
|
|
|
TOTAL (B) |
13495.430 |
13361.710 |
10645.550 |
|
|
|
|
|
|
|
|
Less |
PROFIT
BEFORE INTEREST, TAX, DEPRECIATION AND AMORTISATION (A-B) (C) |
3003.960 |
3061.200 |
2614.450 |
|
|
|
|
|
|
|
|
|
Less |
FINANCIAL
EXPENSES (D) |
1379.870 |
1154.890 |
1152.500 |
|
|
|
|
|
|
|
|
|
|
PROFIT
BEFORE TAX, DEPRECIATION AND AMORTISATION (C-D) (E) |
1624.090 |
1906.310 |
1461.950 |
|
|
|
|
|
|
|
|
|
Less/ Add |
DEPRECIATION/
AMORTISATION (F) |
841.860 |
759.560 |
607.290 |
|
|
|
|
|
|
|
|
|
|
PROFIT BEFORE
TAX (E-F) (G) |
782.230 |
1146.750 |
854.660 |
|
|
|
|
|
|
|
|
|
Less |
TAX (H) |
161.430 |
290.090 |
122.160 |
|
|
|
|
|
|
|
|
|
|
PROFIT AFTER TAX
(G-H) (I) |
620.800 |
856.660 |
732.500 |
|
|
|
|
|
|
|
|
|
|
EARNINGS IN
FOREIGN CURRENCY |
|
|
|
|
|
|
|
FOB Value of Exports |
7486.290 |
9910.030 |
6548.390 |
|
|
|
|
|
|
|
|
|
IMPORTS |
|
|
|
|
|
|
|
Raw Materials |
4290.810 |
3119.800 |
2737.230 |
|
|
|
Traded Goods |
135.830 |
120.410 |
202.080 |
|
|
|
Capital Goods, Stores and Spares etc. |
10.220 |
29.670 |
34.620 |
|
|
TOTAL IMPORTS |
4436.860 |
3269.880 |
2973.930 |
|
|
|
|
|
|
|
|
|
|
Earnings Per
Share (Rs.) |
2.77 |
3.82 |
3.27 |
|
QUARTERLY RESULTS
|
PARTICULARS |
30.06.2014 |
30.09.2014 |
31.12.2014 |
|
Type |
1st
Quarter |
2nd
Quarter |
3rd
Quarter |
|
Net Sales |
3817.200 |
3938.900 |
4444.400 |
|
Total Expenditure |
3159.800 |
3215.700 |
3714.700 |
|
PBIDT (Excl OI) |
657.400 |
723.200 |
729.700 |
|
Other Income |
23.000 |
26.600 |
22.200 |
|
Operating Profit |
680.400 |
749.800 |
751.900 |
|
Interest |
284.000 |
354.900 |
348.300 |
|
Exceptional Items |
0.000 |
0.000 |
0.000 |
|
PBDT |
396.400 |
395.000 |
403.600 |
|
Depreciation |
192.300 |
188.800 |
190.700 |
|
Profit Before Tax |
204.100 |
206.200 |
212.900 |
|
Tax |
41.600 |
42.000 |
44.100 |
|
Provisions and contingencies |
0.000 |
0.000 |
0.000 |
|
Profit After Tax |
162.500 |
164.200 |
168.900 |
|
Extraordinary Items |
0.000 |
0.000 |
0.000 |
|
Prior Period Expenses |
0.000 |
0.000 |
0.000 |
|
Other Adjustments |
0.000 |
0.000 |
0.000 |
|
Net Profit |
162.500 |
164.200 |
168.900 |
KEY RATIOS
|
PARTICULARS |
|
31.03.2014 |
31.03.2013 |
31.03.2012 |
|
Net Profit Margin (PAT/Sales) |
(%) |
3.79 |
5.27 |
5.62 |
|
|
|
|
|
|
|
Operating Profit Margin (PBDIT/Sales) |
(%) |
18.34 |
18.84 |
20.06 |
|
|
|
|
|
|
|
Return on Total Assets (PBT/Total Assets} |
(%) |
3.44 |
5.37 |
4.34 |
|
|
|
|
|
|
|
Return on Investment (ROI) (PBT/Networth) |
|
0.08 |
0.13 |
0.11 |
|
|
|
|
|
|
|
Debt Equity Ratio (Total Debt/Networth) |
|
0.87 |
0.89 |
1.18 |
|
|
|
|
|
|
|
Current Ratio (Current Asset/Current Liability) |
|
1.10 |
1.10 |
1.16 |
FINANCIAL ANALYSIS
[all figures are in
Rupees Million]
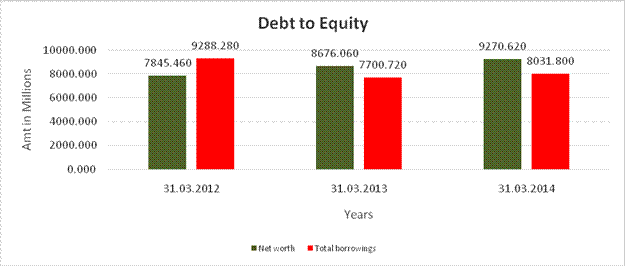
DEBT EQUITY RATIO
|
Particulars |
31.03.2012 |
31.03.2013 |
31.03.2014 |
|
|
(Rs.
In Million) |
(Rs.
In Million) |
(Rs.
In Million) |
|
Share Capital |
224.260 |
224.260 |
224.260 |
|
Reserves & Surplus |
7621.200 |
8451.800 |
9046.360 |
|
Net
worth |
7845.460 |
8676.060 |
9270.620 |
|
|
|
|
|
|
Long-term borrowings |
3636.170 |
2609.610 |
2233.380 |
|
Short term borrowings |
5652.110 |
5091.110 |
5798.420 |
|
Total
borrowings |
9288.280 |
7700.720 |
8031.800 |
|
Debt/Equity ratio |
1.184 |
0.888 |
0.866 |
YEAR-ON-YEAR GROWTH
|
Year on Year Growth |
31.03.2012 |
31.03.2013 |
31.03.2014 |
|
|
(Rs.
In Million) |
(Rs.
In Million) |
(Rs.
In Million) |
|
Sales |
13032.880 |
16248.140 |
16377.690 |
|
|
|
24.670 |
0.797 |
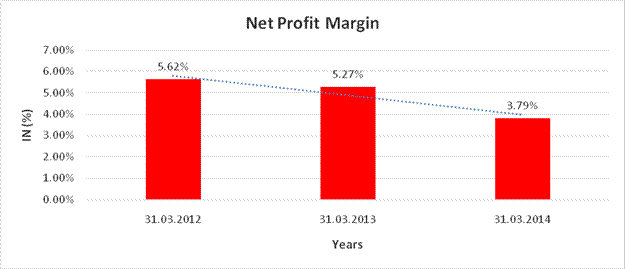
NET PROFIT MARGIN
|
Net Profit Margin |
31.03.2012 |
31.03.2013 |
31.03.2014 |
|
|
(Rs.
In Million) |
(Rs.
In Million) |
(Rs.
In Million) |
|
Sales |
13032.880 |
16248.140 |
16377.690 |
|
Profit |
732.500 |
856.660 |
620.800 |
|
|
5.62% |
5.27% |
3.79% |
LOCAL AGENCY FURTHER INFORMATION
|
Sr. No. |
Check List by Info Agents |
Available in
Report (Yes / No) |
|
1] |
Year of Establishment |
Yes |
|
2] |
Locality of the firm |
Yes |
|
3] |
Constitutions of the firm |
Yes |
|
4] |
Premises details |
No |
|
5] |
Type of Business |
Yes |
|
6] |
Line of Business |
Yes |
|
7] |
Promoter's background |
No |
|
8] |
No. of employees |
Yes |
|
9] |
Name of person contacted |
No |
|
10] |
Designation of contact
person |
Yes |
|
11] |
Turnover of firm for last
three years |
Yes |
|
12] |
Profitability for last
three years |
Yes |
|
13] |
Reasons for variation
<> 20% |
-- |
|
14] |
Estimation for coming
financial year |
No |
|
15] |
Capital in the business |
Yes |
|
16] |
Details of sister
concerns |
Yes |
|
17] |
Major suppliers |
No |
|
18] |
Major customers |
No |
|
19] |
Payments terms |
Yes |
|
20] |
Export / Import details
(if applicable) |
Yes |
|
21] |
Market information |
-- |
|
22] |
Litigations that the firm
/ promoter involved in |
Yes |
|
23] |
Banking Details |
Yes |
|
24] |
Banking facility details |
Yes |
|
25] |
Conduct of the banking
account |
-- |
|
26] |
Buyer visit details |
-- |
|
27] |
Financials, if provided |
Yes |
|
28] |
Incorporation details, if
applicable |
Yes |
|
29] |
Last accounts filed at
ROC |
Yes |
|
30] |
Major Shareholders, if
available |
Yes |
|
31] |
Date of Birth of
Proprietor/Partner/Director, if available |
No |
|
32] |
PAN of Proprietor/Partner/Director,
if available |
No |
|
33] |
Voter ID No of
Proprietor/Partner/Director, if available |
No |
|
34] |
External Agency Rating,
if available |
No |
LITIGATION
DETAILS
|
Case Details For Case CM-2598-CII-2012 |
|||
|
Diary Number |
778203 |
District |
OTHER-DISTRICTS |
|
Category |
- |
Main Case Detail |
ARB-22-2012 |
|
Party Detail |
M/S ABB LTD. V/S NECTAR LIFESCIENCES LTD. & ANR. |
||
|
Advocate Name |
VIVEK SETHI |
List Type |
|
|
Status |
PENDING |
Next date |
|
INDEX OF CHARGES
|
S.NO. |
CHARGE ID |
DATE OF CHARGE CREATION/MODIFICATION |
CHARGE AMOUNT SECURED |
CHARGE HOLDER |
ADDRESS |
SERVICE REQUEST NUMBER (SRN) |
|
1 |
10555532 |
05/03/2015 |
150,000,000.00 |
THE SARASWAT CO-OPERATIVE BANK LIMITED |
20-A, LAJPAT NAGAR - IV, RING ROAD, NEW
DELHI, DELHI - 110024, INDIA |
C46934600 |
|
2 |
10555534 |
05/03/2015 |
250,000,000.00 |
THE SARASWAT CO-OPERATIVE BANK LIMITED |
20-A, LAJPAT NAGAR - IV, RING ROAD, NEW
DELHI, DELHI - 110024, INDIA |
C46935482 |
|
3 |
10550516 |
02/02/2015 |
470,000.00 |
HDFC BANK LIMITED |
HDFC BANK HOUSE, SENAPATI BAPAT MARG, LOWER
PAREL W, MUMBAI, MAHARASHTRA - 400013, INDIA |
C44303469 |
|
4 |
10537006 |
26/11/2014 |
500,000.00 |
HDFC BANK LIMITED |
HDFC BANK HOUSE, SENAPATI BAPAT MARG, LOWER
PAREL W, MUMBAI, MAHARASHTRA - 400013, INDIA |
C37160702 |
|
5 |
10537007 |
26/11/2014 |
500,000.00 |
HDFC BANK LIMITED |
HDFC BANK HOUSE, SENAPATI BAPAT MARG, LOWER
PAREL W, MUMBAI, MAHARASHTRA - 400013, INDIA |
C37161080 |
|
6 |
10527908 |
30/10/2014 |
1,000,000,000.00 |
IFCI LIMITED |
FCI LTD, IFCI TOWER, 61, NEHRU PLACE, NEW
DELHI, DELHI - 110019, INDIA |
C31315369 |
|
7 |
10536895 |
11/10/2014 |
850,000.00 |
HDFC BANK LIMITED |
HDFC BANK HOUSE, SENAPATI BAPAT MARG, LOWER
PAREL W, MUMBAI, MAHARASHTRA - 400013, INDIA |
C37097599 |
|
8 |
10537346 |
30/08/2014 |
600,000.00 |
HDFC BANK LIMITED |
HDFC BANK HOUSE, SENAPATI BAPAT MARG, LOWER
PAREL W, MUMBAI, MAHARASHTRA - 400013, INDIA |
C37367240 |
|
9 |
10536087 |
30/08/2014 |
650,000.00 |
HDFC BANK LIMITED |
HDFC BANK HOUSE, SENAPATI BAPAT MARG, LOWER
PAREL W, MUMBAI, MAHARASHTRA - 400013, INDIA |
C36678902 |
|
10 |
10534563 |
26/07/2014 |
2,250,000.00 |
TOYOTA FINANCIAL SERVICES INDIA LIMITED |
NO. 21 CENTROPOLIS, FIRST FLOOR, 5TH CROSS
LANGFORD ROAD, SHANTI NAGAR, BANGALORE, KARNATAKA - 560025, INDIA |
C35510064 |
|
11 |
10534400 |
18/07/2014 |
2,250,000.00 |
TOYOTA FINANCIAL SERVICES INDIA LIMITED |
NO. 21 CENTROPOLIS, FIRST FLOOR, 5TH CROSS
LANGFORD ROAD, SHANTI NAGAR, BANGALORE, KARNATAKA - 560025, INDIA |
C35509694 |
|
12 |
10506373 |
27/06/2014 |
1,000,000,000.00 |
IFCI LIMITED |
IFCI LTD, IFCI TOWER, 61, NEHRU PLACE, NEW
DELHI, DELHI - 110019, INDIA |
C09519703 |
|
13 |
10504850 |
18/06/2014 |
1,100,000,000.00 |
EXPORT-IMPORT BANK OF INDIA |
CENTRE ONE, FLOOR 21, WORLD TRADE CENTRE,
CUFFE PARADE, MUMBAI, MAHARASHTRA - 400005, INDIA |
C08031254 |
|
14 |
10504975 |
30/05/2014 |
800,000.00 |
ICICI BANK |
SCO : 9-10-11, SECTOR 9-D, CHANDIGARH,
CHANDIGARH |
C08133423 |
|
15 |
10444604 |
23/08/2013 |
500,000,000.00 |
STATE BANK OF BIKANER & JAIPUR |
16/67-68, FAIZ ROAD, KAROL BAGH, NEW DELHI,
DELHI - 110005, INDIA |
B82904855 |
|
16 |
10441331 |
02/08/2013 |
1,000,000,000.00 |
ALLAHABAD BANK |
INDUSTRIAL FINANCE BRANCH, FIRST FLOOR, 17,
PARLIAMENT STREET, NEW DELHI, DELHI - 110001, INDIA |
B81334542 |
|
17 |
10422304 |
26/04/2013 * |
1,300,116,000.00 |
STATE BANK OF INDIA |
SPECIALISED COMMERCIAL BRANCH, SCO 103-106,
SECTOR 17-B, CHANDIGARH, CHANDIGARH - 160017, INDIA |
B73948606 |
|
18 |
10342507 |
06/03/2012 |
3,000,000.00 |
GOVERNMENT OF HIMACHAL PRADESH THROUGH
DIRECTOR OF |
DY. DIRECTOR OF INDUSTRIES, SWCA, BADDI,
SOLAN, HIMACHAL PRADESH - 173205, INDIA |
B35141779 |
|
19 |
10333669 |
07/05/2013 * |
5,364,000,000.00 |
PUNJAB NATIONAL BANK |
SECTOR 16 BRANCH, CHANDIGARH, CHANDIGARH -
160016, INDIA |
B76154293 |
|
20 |
10295257 |
22/05/2012 * |
600,000,000.00 |
EXPORT-IMPORT BANK OF INDIA |
CENTRE ONE, FLOOR 21, WORLD TRADE CENTRE
COMPLEX, |
B41993924 |
|
21 |
10280455 |
22/05/2012 * |
400,000,000.00 |
EXPORT-IMPORT BANK OF INDIA |
CENTRE ONE, FLOOR 21, WORLD TRADE CENTRE
COMPLEX, |
B41989898 |
|
22 |
10280456 |
21/04/2011 |
500,000,000.00 |
EXPORT-IMPORT BANK OF INDIA |
CENTRE ONE BUILDING, FLOOR 21, WORLD TRADE
CENTRE |
B10753598 |
|
23 |
10285034 |
02/04/2011 |
500,000,000.00 |
PUNJAB NATIONAL BANK |
SECTOR 16 BRANCH, CHANDIGARH, CHANDIGARH -
160016, INDIA |
B12419677 |
|
24 |
10263770 |
18/07/2011 * |
2,000,000,000.00 |
STATE BANK OF INDIA |
SPECIALISED COMMERCIAL BRANCH, SCO 103-106,
SECTOR 17-B, CHANDIGARH, CHANDIGARH - 160017, INDIA |
B17163908 |
|
25 |
10264298 |
05/01/2011 |
3,000,000.00 |
GOVERNMENT OF HIMACHAL PRADESH THROUGH
DIRECTOR OF |
DY. DIRECTOR OF INDUSTRIES, SWCA, BADDI,
SOLAN, HIMACHAL PRADESH - 173205, INDIA |
B05379540 |
|
26 |
10190663 |
17/04/2010 * |
500,000,000.00 |
STATE BANK OF INDIA |
SPECIALISED COMMERCIAL BRANCH, SCO 103-106,
SECTOR 17-B, CHANDIGARH, CHANDIGARH - 160017, INDIA |
A85660975 |
|
27 |
10190316 |
17/04/2010 * |
500,000,000.00 |
PUNJAB NATIONAL BANK |
SECTOR 16 BRANCH, CHANDIGARH, CHANDIGARH -
160016, INDIA |
A85587582 |
|
28 |
10182900 |
22/05/2012 * |
600,000,000.00 |
EXPORT-IMPORT BANK OF INDIA |
CENTRE ONE, FLOOR 21, WORLD TRADE CENTRE
COMPLEX, |
B41992686 |
|
29 |
10135497 |
18/06/2009 * |
962,000,000.00 |
HSBC BANK PLC |
SOUTH ASIAN BANKING LEVEL 37, 8, CANADA
SQUARE, LONDON, - E145HQ, UNITED KINGDOM |
A64527427 |
|
30 |
10135496 |
23/12/2008 |
962,000,000.00 |
HSBC BANK PLC |
SOUTH ASIAN BANKING LEVEL 37, 8, CANADA
SQUARE, LONDON, - E145HQ, UNITED KINGDOM |
A53738720 |
* Date of charge modification
UNSECURED LOANS
|
UNSECURED LOANS |
31.03.2014 (Rs.
In Million) |
31.03.2013 (Rs.
In Million) |
|
LONG-TERM BORROWINGS |
|
|
|
Other Loans From Banks |
1.640 |
3.430 |
|
From Others |
5.860 |
1.370 |
|
|
|
|
|
Total |
7.500 |
4.800 |
MANAGEMENT DISCUSSION
AND ANALYSIS
GLOBAL PHARMACEUTICAL
INDUSTRY
The global pharmaceutical industry stands at USD 1 trillion as of 2012-13 and is expected to grow to USD 1.5 trillion by 2016. The global pharmaceutical industry revenue is forecasted to reach an estimated $1,226.0 billion by 2018, with good growth over the next five years (2013-2018).
A distinct shift is expected in market shares across the globe, with the US and EU share of global spending declining.
Meanwhile, 17 high growth emerging markets including China, India, Brazil, Russia, and Mexico will contribute 30% of spending by 2015-16.
ACTIVE PHARMACEUTICAL
INGREDIENTS (APIS)
Active Pharmaceutical Ingredients (API) or bulk drugs are the principal ingredients for finished pharmaceutical products. The global API market can broadly be divided into regulated and semi-regulated markets. The semi-regulated markets offer low entry barriers in terms of regulatory requirements and intellectual property rights.
The highly regulated markets, like the United States, Europe and Japan have high entry barriers in terms of intellectual property rights and regulatory requirements, including facility approvals. As a result, there is a premium for quality and regulatory compliance, along with relatively greater stability for both volumes and prices.
The API growth will be fuelled by rise in demand of generics and biological drugs. The API market was valued at US$ 118.08 billion in 2013, and is expected to grow at a CAGR of8% from 2012 to 2018.
Globally, Asia-Pacific is the third largest regional market for APIs by revenue after the US and Europe.
GLOBAL GENERICS
MARKET
Branded products accounted for nearly two-thirds of global pharmaceutical spending. However, as patents expire in developed markets, that share is expected to decline. Spending on generic drugs is driving most of the growth in the leading emerging markets, which will contribute to the increase in the share of generics pending. Global generic spending is expected to increase from current level of ~USD270-280 billion to USD 500 billion by 2017, of which USD 224-244 billion (70%) of the increase is from low-cost generics in emerging markets.
GENERIC MARKET
DRIVERS:
Mandatory INN (the indication of the non-proprietary name) prescribing
· Generic first dispensing and prescribing
· Large price differential between generic and originator
· Reimbursement levels
· Patient Co-payments
· Incentives for dispensing/prescribing generics
US GENERICS MARKET
The US is the world's largest generics market, estimated at USD85 billion as of 2013 and is expected to grow to USD 120 billion by 2018 at a CAGR of7.9%. Drugs worth USD 90 billion are going off patent between 2012 and 2016. The US government's healthcare bill provides affordable healthcare to 33 million previously Un-insured Americans, which means increased use of generic drugs due to cost and viability factor, accelerating generic growth in the coming years. Moreover, as of 2011, 75%American prescriptions are for generic drugs, which is a positive sign for the generics market.
EU GENERICS MARKET
The European generics market is valued at USD 50-55 billion as of 2013 and is expected to grow to USD 72 billion by 2018 at a CAGR of 7 to 8%. It is expected that, in the near future, there will not be any significant increase in the share of innovative medicines as governments in Central Europe (Poland, Romania, Bulgaria, Hungary, Slovakia and Czech Republic) have been promoting generic consumption, resulting in limited expenditure on branded medicines. Moreover, with an ageing population and member states' healthcare budget under pressure, generic medicines are now a key element of sustainable healthcare.
Japanese Generics Market: As of 2013, this market is valued at USD ~9.5 billion and is expected to reach ~USD 16 billion by 2016 at a CAGR of 10%. The government in Japan has taken several initiatives to ensure growth and promotion of generics industry in the country aimed at reducing healthcare expenditure. Japan's generic market constitutes 22.8%of its pharmaceutical market (volume-wise) (in 2012) but the implementation of numerous supportive measures in 2012 - including additional premiums for practices that prescribe generics - will see this figure rise to approximately 60% by 2017. Moreover, strong promotional activities, numerous impending drug patent expiries and Japan's ageing population are expected to drive growth. Further, the bilateral free-trade agreement signed in February 2011(the FTA will abolish 90% of trade duties for 10 years) will provide a stimulus for exports to Japan.
GLOBAL CRAMS MARKET
The global pharmaceutical outsourcing market was estimated at USD 75-80 billion as of 2013 and is expected to reach USD 120 billion by 2018, growing at10% annually over the five-year period.
GLOBAL SPENDINGON
MEDICINES
Spending on medicines will reach nearly $ 1,100 Bn in 2015, reflecting a slowing growth rate of 3-6% over the five year period compared to 6.2% annual growth over the past five years. The U.S. share of global spending will decline from 41% in 2005 to 31% in 2015, while share of spending from the top 5 European countries will decline from 20% to 13%over the same period. Meanwhile, 17 high growth emerging markets led by China, will contribute 28% of total spending by 2015, up from only 12% in 2005. The next five years will also see an accelerating shift in spending towards generics, rising to 39% of spending in 2015, up from 20% in 2015.
INDIAN PHARMACEUTICAL
MARKET
India's pharmaceutical sector is poised to grow from the present US$ 15.6 billion, toUS$35.9 billion by 2017.
· IPI manufactures over 60,000 generic brands across 60 therapeutic categories.
· Over 120 US FDA and 84 UK MHRA approved manufacturing facilities in India.
· The top 10 therapy areas of the IPM contribute to approximately 90% of the IPM sales.
Chronic therapies (cardio, gastro, CNS and anti-diabetic) have been outperforming the market for the past four years and have grown at a rate of 14%, faster than acute the rapies (anti-invectives, respiratory, pain and gynecology) which grew at 9.6%. The contribution of chronic therapies to the IPM has gone up from 27% in 2010 to 30% in 2013.Growth in the acute segment will be driven by Tier III cities and rural penetration.
OPPURTUNITIES AND
OUTLOOK- NLL's PATH AHEAD
The company expects a positive outlook for the next year. NLL is expecting to continue its strategic entry in US and EU market with a number of filings for its Cephalosporin's range during 2014-15.
The U.S. is the single largest generics market. Regardless of the intense competitionand pricing pressure the US segment will continue to be the single largest market, reaching between $320 Bn to $350 Bn. Europe forms the world's 2nd largest generic market, backed by Govt, reforms to curb healthcare cost and increased demand from ageing population.
Japanese generic market: With a view to reducing burgeoning healthcare costs and tackling rising cases of life-threatening diseases, the Japanese government is taking various measures to increase the adoption of generic drugs among people in the country. The Japanese generic drugs market, evolving to become the world's next generic hub, offers a wide range of opportunities to both domestic and international players. The patent expiry of a large number of branded drugs and active pharmaceutical ingredients are the major attractions for companies willing to enter the market. It is one of the most lucrative destinations for pharmaceutical player mainly because of the rapidly ageing population and increasing incidence of western lifestyle diseases. NLL expects future value growth from this market for Cephalosporin products along with other regulated markets such as US and EU.
NLL also expects continued momentum from its domestic and export markets. Next few years will see NLLs ability to discover new markets and new opportunities gaining an invaluable advantage over competitors.
FUTURE OUTLOOK:
STRATEGIC DIRECTION:
· Enhance accessibility in the regulated generics business.
· Consolidate its presence in the API business by focusing on regulated marketsand pharmerging markets.
· Expand relationships with marque clients with additional new products.
· Enhance market penetration with existing products.
· Focus on long-term partnerships with major pharma companies.
· Increase its operations in emerging markets.
· Focus on Cephalosporin's R and D and work on new cephalosporin molecules.
To unlock the true potential of huge investments made by Neclife in Fixed Assets and Intellectual Property, NecLife is at an inflection point of making strategic entry into highly regulated markets.
STATEMENT OF UNAUDITED FINANCIAL RESULTS
FOR THE QUARTER AND NINE MONTHS ENDED 31.12.2014
[RS. IN MILLION]
|
SR.
NO. |
PARTICULARS |
Quarter Ended 31.12.2014 |
Quarter Ended 30.09.2014 |
9 Months ended 31.12.2014 |
|
|
|
Unaudited |
Unaudited |
Unaudited |
|
|
|
|
||
|
1. |
Income
from Operations (a) Gross Sales |
4714.737 |
4211.315 |
12947.406 |
|
|
Less : Excise Duty |
273.569 |
273.958 |
753.102 |
|
|
Net Sales |
4441.168 |
3937.357 |
12194.304 |
|
|
(b) Other Operating Income |
3.229 |
1.514 |
6.148 |
|
|
Total Income
from Operations (net) |
4444.397 |
3938.871 |
12200.452 |
|
|
|
|
|
|
|
2. |
Expenses (a) Cost of Materials consumed |
2978.310 |
2479.412 |
7989.336 |
|
|
(b) Purchase of Stock in Trade |
152.822 |
72.592 |
367.831 |
|
|
(c) Changes in inventories of finished goods, work-in-progress |
17.879 |
104.370 |
108.093 |
|
|
and
stock-in-trade (d) Employee benefits expense |
150.169 |
146.337 |
435.220 |
|
|
(e) Depreciation and amortisation expense |
190.731 |
188.772 |
571.829 |
|
|
(f) Other expenses |
415.493 |
412.975 |
1189.698 |
|
|
Total Expenses |
3905.404 |
3404.458 |
10662.007 |
|
3. |
Profit from Operations before Other
Income, finance costs and exceptional Items (1-2) |
538.993 |
534.413 |
1538.445 |
|
4. |
Other Income |
22.172 |
26.631 |
71.826 |
|
5. |
Profit before finance costs and exceptional Items (3+4) |
561.165 |
561.044 |
1610.271 |
|
6. |
Finance costs |
348.254 |
354.848 |
987.113 |
|
7. |
Profit after finance costs but
before exceptional Items (5-6) |
212.911 |
206.196 |
623.158 |
|
8. |
Exceptional Items |
0.000 |
0.000 |
0.000 |
|
9. |
Profit from ordinary activities before tax (7+8) |
212.911 |
206.196 |
623.158 |
|
10. |
Tax Expense |
44.058 |
42.017 |
127.622 |
|
11. |
Net Profit from ordinary activities after tax (9-10) |
168.853 |
164.179 |
495.536 |
|
12. |
Extraordinary Item (net of tax expense) |
0.000 |
0.000 |
0.000 |
|
13. |
Net Profit for
the period (11-12) |
168.853 |
164.179 |
495.536 |
|
14. |
Paid up Equity Share Capital (Face Value
per share : Re.1/-) |
224.261 |
224.261 |
224.261 |
|
15. |
Reserves excluding Revaluation Reserves |
-- |
-- |
-- |
|
16.i |
Earnings per Share (EPS) (before
extraordinary items) a) Basic |
0.75 |
0.73 |
2.21 |
|
|
b) Diluted |
0.75 |
0.73 |
2.21 |
|
16.ii |
Earnings per Share (EPS) (after extraordinary
items) a) Basic |
0.75 |
0.73 |
2.21 |
|
|
b) Diluted |
0.75 |
0.73 |
2.21 |
|
Part II Select Information for the
Quarter and nine months ended 31.12.2014 |
||||
|
A |
Particulars of shareholding |
|
|
|
|
1. |
Public Shareholding - Number of Shares - Percentage of Shareholding |
124792970 55.65 |
124792970 55.65 |
124792970 55.65 |
|
2. |
Promoters and Promoter Group Shareholding
a) Pledged/Encumbered - Number of Shares - Percentage of Shares ( as a % of the total shareholding of promoter and promoter group) - Percentage of Shares ( as a % of the total share capital of the company b) Non-encumbered - Number of Shares - Percentage of Shares ( as a % of the total shareholding of promoter and promoter group) - Percentage of Shares ( as a % of the total share capital of the company |
55555600 55.85 24.77 43912400 44.15 19.58 |
55555600 55.85 24.77 43912400 44.15 19.58 |
55555600 55.85 24.77 43912400 44.15 19.58 |
|
B |
Investor Complaints |
3 Months ended 31.12.2014 |
|
|
Pending at the beginning of Quarter |
-- |
|
Received During the Quarter |
13 |
|
|
Disposed Off During the Quarter |
13 |
|
|
Pending at the end of Quarter |
-- |
NOTES:
1) The above financial results were reviewed by Audit Committee on 12.02.15 and approved by the Board in its meeting held on even date i.e. 13.02.15 and further limited reviewed by the Statutory Auditors of the Company.
2)
The company is
exclusively in the pharmaceutical business segment.
3)
Previous year
figures have been regrouped and reclassified wherever necessary to make them
comparable with current period.
4) The above financial results are on standalone basis.
CONTINGENT
LIABILITIES:
|
Particulars |
31.03.2014 (Rs.
In Million) |
31.03.2013 (Rs.
In Million) |
|
Claims not acknowledgeable as debts ** |
|
|
|
- Income Tax matters |
18.470 |
5.970 |
|
- Excise Matters |
111.450 |
108.060 |
|
- Service tax matters |
13.950 |
13.930 |
|
- ESI matters |
3.540 |
3.540 |
|
Bank Guarantees |
9.220 |
8.700 |
|
Bills Discounted |
105.550 |
144.410 |
|
Letter of Credit [Foreign / Inland] |
171.770 |
398.010 |
|
Other money for which Company is contingently liable Differential amount of custom duty in respect of machinery imported
under EPCG Scheme |
0.390 |
0.290 |
|
|
|
|
|
Total |
434.340 |
682.910 |
|
NOTE: ** The matters are subject to legal proceedings in the ordinary course
of business. In the opinion of the management, legal proceedings for above
cases, when ultimately concluded will not have a material effect on the
results of operation or financial position of the company. |
||
FIXED ASSETS:
· Freehold Land and Site Development
· Leasehold Land
· Buildings
· Tubewell
· Plant and Machinery
· Boiler
· Pollution Control Equipment
· Laboratory
· Furniture and Fixture
· Motor Vehicles
· Computers
CMT REPORT (Corruption, Money Laundering & Terrorism]
The Public Notice information has been collected from various sources
including but not limited to: The Courts,
1] INFORMATION ON
DESIGNATED PARTY
No exist designating subject or any of its beneficial owners, controlling
shareholders or senior officers as terrorist or terrorist organization or whom
notice had been received that all financial transactions involving their assets
have been blocked or convicted, found guilty or against whom a judgement or
order had been entered in a proceedings for violating money-laundering,
anti-corruption or bribery or international economic or anti-terrorism sanction
laws or whose assets were seized, blocked, frozen or ordered forfeited for
violation of money laundering or international anti-terrorism laws.
2] Court Declaration :
No records exist to suggest that subject is
or was the subject of any formal or informal allegations, prosecutions or other
official proceeding for making any prohibited payments or other improper payments
to government officials for engaging in prohibited transactions or with
designated parties.
3] Asset Declaration :
No records exist to suggest that the property or assets of the subject
are derived from criminal conduct or a prohibited transaction.
4] Record on Financial
Crime :
Charges or conviction
registered against subject: None
5] Records on Violation of
Anti-Corruption Laws :
Charges or
investigation registered against subject: None
6] Records on Int’l
Anti-Money Laundering Laws/Standards :
Charges or
investigation registered against subject: None
7] Criminal Records
No
available information exist that suggest that subject or any of its principals
have been formally charged or convicted by a competent governmental authority
for any financial crime or under any formal investigation by a competent
government authority for any violation of anti-corruption laws or international
anti-money laundering laws or standard.
8] Affiliation with
Government :
No record
exists to suggest that any director or indirect owners, controlling
shareholders, director, officer or employee of the company is a government
official or a family member or close business associate of a Government
official.
9] Compensation Package :
Our market survey
revealed that the amount of compensation sought by the subject is fair and
reasonable and comparable to compensation paid to others for similar services.
10] Press Report :
No press reports / filings exists on
the subject.
CORPORATE GOVERNANCE
MIRA INFORM as part of its Due Diligence do provide comments on
Corporate Governance to identify management and governance. These factors often
have been predictive and in some cases have created vulnerabilities to credit
deterioration.
Our Governance Assessment focuses principally on the interactions
between a company’s management, its Board of Directors, Shareholders and other
financial stakeholders.
CONTRAVENTION
Subject is not known to have contravened any existing local laws,
regulations or policies that prohibit, restrict or otherwise affect the terms
and conditions that could be included in the agreement with the subject.
FOREIGN EXCHANGE RATES
|
Currency |
Unit
|
Indian Rupees |
|
US Dollar |
1 |
Rs. 62.37 |
|
|
1 |
Rs. 92.44 |
|
Euro |
1 |
Rs. 66.56 |
INFORMATION DETAILS
|
Information
Gathered by : |
KMN |
|
|
|
|
Analysis Done by
: |
KAR |
|
|
|
|
Report Prepared
by : |
BVA |
SCORE & RATING EXPLANATIONS
|
SCORE FACTORS |
RANGE |
POINTS |
|
HISTORY |
1~10 |
6 |
|
PAID-UP CAPITAL |
1~10 |
5 |
|
OPERATING SCALE |
1~10 |
6 |
|
FINANCIAL CONDITION |
|
|
|
--BUSINESS SCALE |
1~10 |
6 |
|
--PROFITABILIRY |
1~10 |
6 |
|
--LIQUIDITY |
1~10 |
5 |
|
--LEVERAGE |
1~10 |
5 |
|
--RESERVES |
1~10 |
6 |
|
--CREDIT LINES |
1~10 |
5 |
|
--MARGINS |
-5~5 |
-- |
|
DEMERIT POINTS |
|
|
|
--BANK CHARGES |
YES/NO |
YES |
|
--LITIGATION |
YES/NO |
YES |
|
--OTHER ADVERSE INFORMATION |
YES/NO |
NO |
|
MERIT POINTS |
|
|
|
--SOLE DISTRIBUTORSHIP |
YES/NO |
NO |
|
--EXPORT ACTIVITIES |
YES/NO |
NO |
|
--AFFILIATION |
YES/NO |
YES |
|
--LISTED |
YES/NO |
YES |
|
--OTHER MERIT FACTORS |
YES/NO |
YES |
|
DEFAULTERS |
|
|
|
--RBI |
YES/NO |
NO |
|
--EPF |
YES/NO |
NO |
|
TOTAL |
|
50 |
This score serves as a reference to assess SC’s
credit risk and to set the amount of credit to be extended. It is calculated
from a composite of weighted scores obtained from each of the major sections of
this report. The assessed factors and their relative weights (as indicated
through %) are as follows:
Financial
condition (40%) Ownership
background (20%) Payment
record (10%)
Credit history
(10%) Market trend (10%) Operational size
(10%)
RATING EXPLANATIONS
|
RATING |
STATUS |
PROPOSED CREDIT LINE |
|
|
>86 |
Aaa |
Possesses an extremely sound financial base with the strongest
capability for timely payment of interest and principal sums |
Unlimited |
|
71-85 |
Aa |
Possesses adequate working capital. No caution needed for credit transaction.
It has above average (strong) capability for payment of interest and
principal sums |
Large |
|
56-70 |
A |
Financial & operational base are regarded healthy. General unfavourable
factors will not cause fatal effect. Satisfactory capability for payment of
interest and principal sums |
Fairly Large |
|
41-55 |
Ba |
Overall operation is considered normal. Capable to meet normal
commitments. |
Satisfactory |
|
26-40 |
B |
Capability to overcome financial difficulties seems comparatively
below average. |
Small |
|
11-25 |
Ca |
Adverse factors are apparent. Repayment of interest and principal sums
in default or expected to be in default upon maturity |
Limited with
full security |
|
<10 |
C |
Absolute credit risk exists. Caution needed to be exercised |
Credit not
recommended |
|
-- |
NB |
New Business |
-- |
This report is issued at your request without any
risk and responsibility on the part of MIRA INFORM PRIVATE LIMITED (MIPL) or
its officials.