MIRA INFORM REPORT
|
Report No. : |
314531 |
|
Report Date : |
21.04.2015 |
IDENTIFICATION DETAILS
|
Name : |
WARIS COTTON |
|
|
|
|
|
|
Registered
Office : |
S. No. 401/A, Village Bhojwa, Ta. Viramgam, District Ahmedabad –
382150, Gujarat |
|
|
Tel. No.: |
91-7777906707 [Mr. Mohaddis] |
|
|
|
|
|
|
Country : |
India |
|
|
|
|
|
|
Financials (as
on) : |
31.12.2014 (Provisional) |
|
|
|
|
|
|
Year of
Establishment : |
12.07.2010 |
|
|
|
|
|
|
Capital
Investment : |
Rs. 9.552 Million |
|
|
|
|
|
|
PAN No.: [Permanent Account No.] |
AABFW1587D |
|
|
|
|
|
|
Legal Form : |
Partnership Concern with an Unlimited Liability of the Partners |
|
|
|
|
|
|
Line of Business
: |
Manufacturer of Cotton Bales and Cotton Seeds from Raw Cotton. |
|
|
|
|
|
|
No. of Employees
: |
13 (Approximately) |
|
RATING & COMMENTS
|
MIRA’s Rating : |
B (31) |
|
RATING |
STATUS |
PROPOSED CREDIT LINE |
|
|
26-40 |
B |
Capability to overcome financial difficulties seems comparatively
below average. |
Small |
|
Status : |
Moderate |
|
|
|
|
Payment Behaviour : |
Slow but correct |
|
|
|
|
Litigation : |
Clear |
|
|
|
|
Comments : |
Subject is a partnership concern with limited operational history,
commencing its commercial operations from April 2012; having moderate track
record. The concern possesses a moderate financial profile marked by
acceptable capital structure along with slight working capital intensive
operations. Management has witnessed a better increase in its revenue base,
whereas has reported a low net profitability as well as margins from its
operations during FY14. The ratings also take into consideration, the partnership nature of
the business and the concentration of ownership of business land in the name
of an individual partner which does not become the firms property simply by
being used for the purpose of the partnership, further which may not be
considered as firms asset subsequently may act as a threat in relation to any
dispute among the partners which may land the entity into loose-loose
situation leading to dissolution at times. Moreover, the cotton prices have started rising in the past couple of
months helped by Cotton Corporation of India’s procurement of crop and lower
yield estimates due to erratic rainfall which may somehow positively back the
projected growth. However, trade relations seem to be fair. Business is active. Payment
terms are reported as slow but correct. In view of experienced promoters, the concern can be considered for
business dealings with caution. |
NOTES :
Any query related to this report can be made
on e-mail : infodept@mirainform.com
while quoting report number, name and date.
ECGC Country Risk Classification List – December 31, 2014
|
Country Name |
Previous Rating (30.09.2014) |
Current Rating (31.12.2014) |
|
India |
A1 |
A1 |
|
Risk Category |
ECGC Classification |
|
Insignificant |
A1 |
|
Low |
A2 |
|
Moderate |
B1 |
|
High |
B2 |
|
Very High |
C1 |
|
Restricted |
C2 |
|
Off-credit |
D |
EXTERNAL AGENCY RATING
NOT AVAILABLE
RBI DEFAULTERS’ LIST STATUS
Subject’s name is not enlisted as a defaulter
in the publicly available RBI Defaulters’ list.
EPF (Employee Provident Fund) DEFAULTERS’ LIST STATUS
Subject’s name is not enlisted as a defaulter
in the publicly available EPF (Employee Provident Fund) Defaulters’ list as of
31-03-2014.
INFORMATION PARTED BY
|
Name : |
Mr. Mohaddis |
|
Designation : |
Manager and Overall In-charge |
|
Contact No.: |
91-7777906707 |
|
Date : |
13.04.2015 |
LOCATIONS
|
Registered Office/ Factory : |
S. No. 401/A, Village Bhojwa, Ta. Viramgam, District Ahmedabad –
382150, Gujarat, India |
|
Tel. No.: |
Not Available |
|
Mobile No.: |
91-7777906707 [Mr. Mohaddis] |
|
Fax No.: |
Not Available |
|
E-Mail : |
|
|
Location : |
Owned |
PARTNERS
|
Name : |
Mr. Ibrahimbhai U. Shaikh |
|
Designation : |
Partner |
|
Address : |
29, Khadiya,
Raiyapur Road, Viramgam, Ahmedabad – 382150, Gujarat, India |
|
Date of Birth/Age : |
27.06.1962 |
|
PAN No.: |
BSEPS6909K |
|
Voter ID : |
GJ/09/063/097421 |
|
|
|
|
Name : |
Mr. Altafhusen Shaikh |
|
Designation : |
Partner |
|
Address : |
Khadiya,
Viramgam, Ahmedabad, Gujarat, India |
|
Date of Birth/Age : |
23.11.1964 |
|
PAN No.: |
BFCPS3617F |
|
|
|
|
Name : |
Mr. Niyazahmed U. Shaikh |
|
Designation : |
Partner |
|
Address : |
Khadiya,
Viramgam, Ahmedabad, Gujarat, India |
|
Date of Birth/Age : |
01.03.1967 |
|
PAN No.: |
BCUPS1040R |
|
Voter ID : |
GJ/09/063/097422 |
|
|
|
|
Name : |
Mr. Altamas Altafhusen Shaikh |
|
Designation : |
Partner |
|
Address : |
29, Raiyapur
Road, (Opposite Addans Masjid), Ad Miyas Tekro, Viramgam, Ahmedabad – 382150,
Gujarat, India |
|
Date of Birth/Age : |
03.06.1992 |
|
PAN No.: |
CVVPS8715C |
|
Voter ID : |
UTG1766435 |
KEY EXECUTIVES
|
Name : |
Mr. Mohaddis |
|
Designation : |
Manager and Overall In-charge |
BUSINESS DETAILS
|
Line of Business : |
Manufacturer of Cotton Bales and Cotton Seeds from Raw Cotton. |
|
|
|
|
Brand Names : |
-- |
|
|
|
|
Agencies Held : |
-- |
|
|
|
|
Exports : |
|
|
Products : |
-- |
|
Countries : |
-- |
|
|
|
|
Imports : |
|
|
Products : |
-- |
|
Countries : |
-- |
|
|
|
|
Terms : |
|
|
Selling : |
Cash and Credit [30 days and 60 days] |
|
|
|
|
Purchasing : |
Cash |
PRODUCTION STATUS
|
Products |
Installed
Capacity |
Actual
Production |
|
Cotton Bales |
1280664 Kgs. |
426909 Kgs. |
|
|
|
|
|
Cotton Seeds |
1707552 Kgs. |
569212 Kgs. |
GENERAL INFORMATION
|
Suppliers : |
|
||||||||||||||||||||||||||||||||||||||||||||||||||||||||||||||||||||||||||||||||||||||||||||||||||||||||||||||
|
|
|
||||||||||||||||||||||||||||||||||||||||||||||||||||||||||||||||||||||||||||||||||||||||||||||||||||||||||||||
|
Customers : |
Wholesalers and Retailers
· Mulchandbhai and Sons Address: Golwadi Road,
Viramgam, Ahmedabad, Gujarat, India Contact Person: Mr. Dilipbhai
Vaniya Contact No.: 91-9825082794 · Mulchandbhai and Sons Address: B-507, Ganesh Plaza,
Opposite Navrangpura Bus Stand, Navrangpura, Ahmedabad – 380009, Gujarat,
India Contact Person: Mr. Rameshbhai
Shah Contact No.: 91-79-26569996/
26447462 |
||||||||||||||||||||||||||||||||||||||||||||||||||||||||||||||||||||||||||||||||||||||||||||||||||||||||||||||
|
|
|
||||||||||||||||||||||||||||||||||||||||||||||||||||||||||||||||||||||||||||||||||||||||||||||||||||||||||||||
|
No. of Employees : |
13 (Approximately) |
||||||||||||||||||||||||||||||||||||||||||||||||||||||||||||||||||||||||||||||||||||||||||||||||||||||||||||||
|
|
|
||||||||||||||||||||||||||||||||||||||||||||||||||||||||||||||||||||||||||||||||||||||||||||||||||||||||||||||
|
Bankers : |
· ICICI Bank Limited Address: Mandal Road,
Robhort Ciment, Bhojava, Viramgam, Ahmedabad, Gujarat, India Account No.: 098905001345 Account Open
Date: 30.12.2013 |
||||||||||||||||||||||||||||||||||||||||||||||||||||||||||||||||||||||||||||||||||||||||||||||||||||||||||||||
|
|
|
||||||||||||||||||||||||||||||||||||||||||||||||||||||||||||||||||||||||||||||||||||||||||||||||||||||||||||||
|
Facilities : |
|
|
|
|
|
Auditors : |
|
|
Name : |
A.M.N. and Company Chartered Accountants |
|
|
|
|
Associates/Subsidiaries : |
· Bharat Industries Address: GIDC, Viramgam,
Ahmedabad, Gujarat, India Activity: Manufacturer of
Wire, Wire Draw, etc. · Bharat Steel Corporation Address: GIDC, Viramgam, Ahmedabad,
Gujarat, India Activity: Trader of Wire. |
CAPITAL STRUCTURE
AS ON 31.12.2014 [PROVISIONAL]
|
SR. NO. |
PARTICULARS |
AMOUNT IN
MILLION |
|
|
|
|
|
1 |
Mr. Ibrahimbhai U. Shaikh |
2.659 |
|
2 |
Mr. Altafbhai U. Shaikh |
3.851 |
|
3 |
Mr. Niyazahmed U. Shaikh |
2.556 |
|
4 |
Mr. Altamas A. Shaikh |
0.486 |
|
|
|
|
|
|
Total |
9.552 |
FINANCIAL DATA
[all figures are
in Rupees Million]
Note : Sole Proprietary and Partnership concerns are exempted
from filing their financials with the Government Authorities or Registry.
ABRIDGED BALANCE
SHEET
|
SOURCES OF FUNDS |
31.12.2014 [Provisional] |
31.03.2014 |
31.03.2013 |
31.03.2012 |
|
|
SHAREHOLDERS FUNDS |
|
|
|
|
|
|
1] Partners Capital |
9.552 |
8.989 |
7.538 |
2.107 |
|
|
2] Share Application Money |
0.000 |
0.000 |
0.000 |
0.000 |
|
|
3] Profit and Loss Account |
0.100 |
0.000 |
0.000 |
0.000 |
|
|
4] (Accumulated Losses) |
0.000 |
0.000 |
0.000 |
0.000 |
|
|
NETWORTH |
9.652 |
8.989 |
7.538 |
2.107 |
|
|
LOAN FUNDS |
|
|
|
|
|
|
1] Secured Loans |
4.206 |
4.081 |
4.322 |
1.537 |
|
|
2] Unsecured Loans |
0.000 |
0.000 |
0.000 |
0.000 |
|
|
TOTAL BORROWING |
4.206 |
4.081 |
4.322 |
1.537 |
|
|
DEFERRED TAX LIABILITIES |
0.000 |
0.000 |
0.000 |
0.000 |
|
|
|
|
|
|
|
|
|
TOTAL |
13.858 |
13.070 |
11.860 |
3.644 |
|
|
|
|
|
|
|
|
|
APPLICATION OF
FUNDS |
|
|
|
|
|
|
|
|
|
|
|
|
|
FIXED ASSETS [Net Block] |
6.720 |
6.721 |
7.511 |
2.136 |
|
|
Capital work-in-progress |
0.000 |
0.000 |
0.000 |
0.000 |
|
|
|
|
|
|
|
|
|
INVESTMENT |
0.000 |
0.000 |
0.000 |
0.075 |
|
|
DEFERRED TAX ASSETS |
0.000 |
0.000 |
0.000 |
0.000 |
|
|
|
|
|
|
|
|
|
CURRENT ASSETS, LOANS & ADVANCES |
|
|
|
|
|
|
|
Inventories |
21.430
|
28.635
|
9.362 |
0.000 |
|
|
Sundry Debtors |
3.828
|
1.536
|
3.258 |
0.000 |
|
|
Cash & Bank Balances |
0.132
|
0.125
|
0.339 |
1.515 |
|
|
Other Current Assets |
0.000
|
0.182
|
0.230 |
0.617 |
|
|
Loans & Advances |
0.150
|
0.000
|
0.000 |
0.000 |
|
Total
Current Assets |
25.540
|
30.478
|
13.189 |
2.132 |
|
|
Less : CURRENT
LIABILITIES & PROVISIONS |
|
|
|
|
|
|
|
Sundry Creditors |
18.018
|
23.394
|
8.502 |
0.736 |
|
|
Other Current Liabilities |
0.384
|
0.726
|
0.000 |
0.000 |
|
|
Provisions |
0.000
|
0.009
|
0.338 |
0.000 |
|
Total
Current Liabilities |
18.402
|
24.129
|
8.840 |
0.736 |
|
|
Net Current Assets |
7.138
|
6.349
|
4.349 |
1.396 |
|
|
|
|
|
|
|
|
|
MISCELLANEOUS EXPENSES |
0.000 |
0.000 |
0.000 |
0.037 |
|
|
|
|
|
|
|
|
|
TOTAL |
13.858 |
13.070 |
11.860 |
3.644 |
|
PROFIT & LOSS
ACCOUNT
|
|
PARTICULARS |
31.12.2014 [Provisional] |
31.03.2014 |
31.03.2013 |
31.03.2012 |
|
|
|
SALES |
|
|
|
|
|
|
|
|
Sales |
24.092 |
47.637 |
17.764 |
-- |
|
|
|
Other Income |
0.000 |
0.197 |
0.000 |
-- |
|
|
|
TOTAL |
24.092 |
47.834 |
17.764 |
-- |
|
|
|
|
|
|
|
|
|
Less |
EXPENSES |
|
|
|
|
|
|
|
|
Cost of Goods sold |
21.379 |
42.494 |
15.152 |
-- |
|
|
|
Interest to Partners |
0.253 |
0.494 |
0.414 |
-- |
|
|
|
Remuneration to Partners |
0.396 |
0.245 |
0.160 |
-- |
|
|
|
Sundry Expenses |
0.000 |
0.000 |
0.037 |
-- |
|
|
|
Electric Bill Expenses |
0.209 |
0.426 |
0.157 |
-- |
|
|
|
Interest |
0.329 |
0.436 |
0.439 |
-- |
|
|
|
Labour Majuri Expenses |
0.203 |
0.439 |
0.205 |
-- |
|
|
|
Salary |
0.198 |
0.216 |
0.102 |
-- |
|
|
|
Trade Discount |
0.000 |
0.197 |
0.074 |
-- |
|
|
|
Other Expenses |
1.025 |
2.095 |
0.299 |
-- |
|
|
|
TOTAL |
23.992 |
47.042 |
17.039 |
-- |
|
|
|
|
|
|
|
|
|
|
PROFIT
BEFORE DEPRECIATION AND AMORTISATION |
0.100 |
0.792 |
0.725 |
-- |
|
|
|
|
|
|
|
|
|
|
Less/ Add |
DEPRECIATION/
AMORTISATION |
0.000 |
0.773 |
0.707 |
-- |
|
|
|
|
|
|
|
|
|
|
|
NET PROFIT |
0.100 |
0.019 |
0.018 |
-- |
|
KEY RATIOS
|
PARTICULARS |
|
31.12.2014 [Provisional] |
31.03.2014 |
31.03.2013 |
31.03.2012 |
|
Net Profit Margin (PAT/Sales) |
(%) |
0.42
|
0.04
|
0.10 |
-- |
|
|
|
|
|
|
|
|
Return on Total Assets (PBT/Total Assets} |
(%) |
0.31
|
0.05
|
0.09 |
-- |
|
|
|
|
|
|
|
|
Return on Investment (ROI) (PBT/Networth) |
|
0.01
|
0.00
|
0.00 |
-- |
|
|
|
|
|
|
|
|
Debt Equity Ratio (Total Debt/Networth) |
|
0.44
|
0.45
|
0.57 |
0.73 |
|
|
|
|
|
|
|
|
Current Ratio (Current Asset/Current Liability) |
|
1.39
|
1.26
|
1.49 |
2.90 |
FINANCIAL ANALYSIS
[all figures are
in Rupees Million]
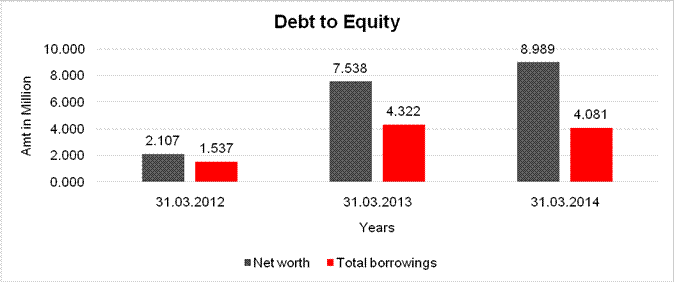
DEBT EQUITY RATIO
|
Particulars |
31.03.2012 |
31.03.2013 |
31.03.2014 |
|
|
(Rs.
In Million) |
(Rs.
In Million) |
(Rs.
In Million) |
|
Partners’ Capital |
2.107 |
7.538 |
8.989 |
|
Profit and Loss Account |
0.000 |
0.000 |
0.000 |
|
Net
worth |
2.107 |
7.538 |
8.989 |
|
|
|
|
|
|
Secured Loans |
1.537 |
4.322 |
4.081 |
|
Unsecured Loans |
0.000 |
0.000 |
0.000 |
|
Total
borrowings |
1.537 |
4.322 |
4.081 |
|
Debt/Equity
ratio |
0.729 |
0.573 |
0.454 |
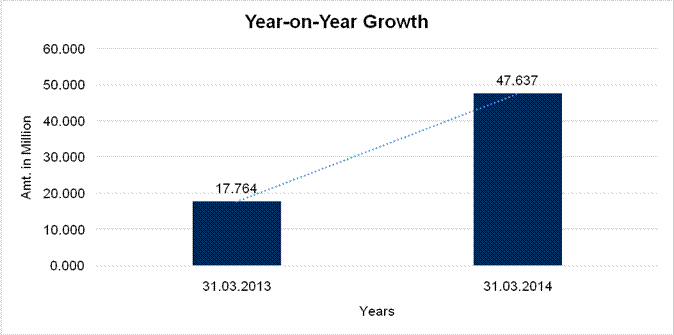
YEAR-ON-YEAR GROWTH
|
Year
on Year Growth |
31.03.2013 |
31.03.2014 |
|
|
(Rs.
In Million) |
(Rs.
In Million) |
|
Sales |
17.764 |
47.637 |
|
|
|
168.166 |
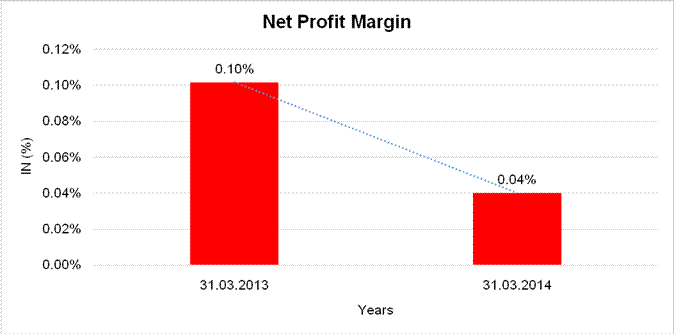
NET PROFIT MARGIN
|
Net
Profit Margin |
31.03.2013 |
31.03.2014 |
|
|
(Rs.
In Million) |
(Rs.
In Million) |
|
Sales |
17.764 |
47.637 |
|
Profit |
0.018 |
0.019 |
|
|
0.10% |
0.04% |
LOCAL AGENCY FURTHER INFORMATION
|
Sr. No. |
Check List by Info Agents |
Available in
Report (Yes / No) |
|
1] |
Year of Establishment |
Yes |
|
2] |
Locality of the firm |
Yes |
|
3] |
Constitutions of the firm |
Yes |
|
4] |
Premises details |
No |
|
5] |
Type of Business |
Yes |
|
6] |
Line of Business |
Yes |
|
7] |
Promoter's background |
Yes |
|
8] |
No. of employees |
Yes |
|
9] |
Name of person contacted |
Yes |
|
10] |
Designation of contact
person |
Yes |
|
11] |
Turnover of firm for last
three years and nine months |
Yes |
|
12] |
Profitability for last
two years and nine months |
Yes |
|
13] |
Reasons for variation
<> 20% |
-- |
|
14] |
Estimation for coming
financial year |
Yes |
|
15] |
Capital in the business |
Yes |
|
16] |
Details of sister
concerns |
Yes |
|
17] |
Major suppliers |
No |
|
18] |
Major customers |
Yes |
|
19] |
Payments terms |
Yes |
|
20] |
Export / Import details (if
applicable) |
No |
|
21] |
Market information |
-- |
|
22] |
Litigations that the firm
/ promoter involved in |
-- |
|
23] |
Banking Details |
Yes |
|
24] |
Banking facility details |
Yes |
|
25] |
Conduct of the banking
account |
Yes |
|
26] |
Buyer visit details |
-- |
|
27] |
Financials, if provided |
Yes |
|
28] |
Incorporation details, if
applicable |
No |
|
29] |
Last accounts filed at
ROC |
Yes |
|
30] |
Major Shareholders, if
available |
No |
|
31] |
Date of Birth of Proprietor/Partner/Director,
if available |
Yes |
|
32] |
PAN of
Proprietor/Partner/Director, if available |
Yes |
|
33] |
Voter ID No of
Proprietor/Partner/Director, if available |
Yes |
|
34] |
External Agency Rating,
if available |
No |
------------------------------------------------------------------------------------------------------------------------------
SUMMARY OF INCOME
MR. IBRAHIMBHAI U. SHAIKH
(RS. IN MILLION)
|
PARTICULARS |
2013-2014 |
||
|
Salary
|
|
|
0.000 |
|
Business and Profession |
|
|
0.206 |
|
|
|
|
|
|
Other Sources |
|
|
0.000 |
|
|
|
|
|
|
Gross Total Income |
|
|
0.206 |
|
|
|
|
|
|
Total Deductions |
|
|
0.012 |
|
|
|
|
------------- |
|
Total Income |
|
|
0.194 |
|
|
|
|
|
|
Agriculture Income |
|
|
0.163 |
|
|
|
|
|
|
Tax Due |
|
|
0.000 |
|
|
|
|
|
|
Exempt Income |
|
|
0.006 |
|
|
|
|
|
|
Salary Income |
|||
|
Total Salary |
|
|
0.000 |
|
|
|
|
|
|
Business and
Profession Remuneration
from Firms |
|||
|
WARIS COTTON |
|
|
|
|
Remuneration |
0.074 |
|
|
|
Interest |
0.132 |
|
|
|
Net |
|
0.206 |
|
|
|
|
|
|
|
Net Income |
|
|
0.206 |
|
|
|
|
|
|
Section 80
Deductions |
|||
|
Section 80D (Medical Premia) |
|
0.011 |
|
|
Relationship to Assessee Medical Premium |
|
0.011 |
|
|
|
|
|
|
|
Total |
|
|
0.011 |
|
|
|
|
|
|
Income Tax |
|||
|
Agriculture Income |
|
|
0.163 |
|
|
|
|
|
|
Total Income |
|
|
0.194 |
|
|
|
|
|
|
Basic Exemption |
|
|
0.200 |
|
|
|
|
|
|
Income Tax |
|
|
0.000 |
|
|
|
|
|
|
Payable |
|
|
0.000 |
|
|
|
|
|
|
Exempt Income |
|||
|
Agriculture Income |
|
0.163 |
|
|
|
|
|
|
|
Net |
|
|
0.163 |
------------------------------------------------------------------------------------------------------------------------------
COMPUTATION OF INCOME
MR. NIYAZAHMED U. SHAIKH
(RS. IN MILLION)
|
PARTICULARS |
2012-2013 |
||
|
|
|
|
|
|
PROFIT AND GAINS OF BUSINESS OR PROFESSION |
|
|
|
|
Profit before tax as per Profit and Loss
Account |
|
0.031 |
|
|
|
|
|
|
|
Add: Disallowable / Additions |
|
|
|
|
Depreciation treated separately |
|
0.034 |
|
|
|
|
|
|
|
Less: Deductions / Expenses claimed |
|
|
|
|
Depreciation as per Statement |
|
0.034 |
|
|
|
|
------------- |
0.031 |
|
|
|
|
|
|
INCOME FROM SHARE IN PROFIT OF FIRMS |
|
|
|
|
20.00% share of profit from the Firm |
|
|
|
|
Bharat Industries |
|
|
|
|
Raiyapur |
|
|
|
|
Viramgam |
|
|
|
|
Ahmedabad |
|
|
|
|
As computed in firms case |
0.006 |
|
|
|
Remuneration |
0.150 |
|
|
|
Interest |
0.054 |
|
|
|
|
|
0.210 |
|
|
|
|
|
|
|
15.00% share of profit from the Firm |
|
|
|
|
Warish Cotton |
|
|
|
|
Mandal Road |
|
|
|
|
Viramgam |
|
|
|
|
Ahmedabad |
|
|
|
|
As computed in firms case |
0.004 |
|
|
|
Remuneration |
0.016 |
|
|
|
Interest |
0.197 |
|
|
|
|
|
0.217 |
|
|
Less: Share of Profit exempted u/s 10(2A) |
|
0.010 |
|
|
Less: Deductions/ Expenses claimed expenses |
|
0.014 |
0.402 |
|
|
|
|
|
|
SUMMARY OF TOTAL
INCOME |
|
|
|
|
Profit and Gains of Business or Profession |
|
|
|
|
Own Business or Profession |
|
0.031 |
|
|
Share in Profit/ Loss Firms |
|
0.402 |
|
|
|
|
|
0.433 |
|
|
|
|
------------- |
|
GROSS TOTAL
INCOME |
|
|
0.433 |
|
|
|
|
|
|
Less: Deductions under Chapter VI-A |
|
|
|
|
Deduction u/s 80-C |
|
|
|
|
School/ College Tution Fee paid for Child |
0.031 |
|
|
|
Life Insurance Premium (LIP) |
0.009 |
|
|
|
Allowable Deduction u/s 80-C |
------------- |
0.040 |
|
|
|
|
|
|
|
Deduction u/s 80-D |
|
|
|
|
Medical Insurance Premium |
0.010 |
|
|
|
Allowable Deduction u/s 80-D |
------------- |
0.010 |
|
|
|
|
------------- |
|
|
Total Deductions under Chapter VI-A |
|
|
0.050 |
|
|
|
|
------------- |
|
NET TOTAL INCOME
|
|
|
0.383 |
|
|
|
|
|
|
AGRICULTURE INCOME FOR RATE PURPOSE |
|
|
|
|
Sale of Produces |
|
0.143 |
|
|
|
|
|
|
|
Less: Deductions/ Expenses claimed Expenses |
|
0.035 |
|
|
|
|
------------- |
0.108 |
|
|
|
|
|
|
CALCULATION OF
TAX (Case of Male) |
|||
|
|
|
|
|
|
Tax on Total Income |
|
0.018 |
|
|
Add: Education Cess ………………@ 2.00% |
|
0.001 |
|
|
Secondary and Higher Education Cess ………………@
1.00% |
|
0.000 |
|
|
|
|
0.019 |
|
|
|
|
|
|
|
Add: Interest u/s 234-A for 8 months @ 1.00% |
0.002 |
|
|
|
Interest u/s 234-B |
|
|
|
|
On 18900 for 12 months @ 1.00% |
0.002 |
|
|
|
Interest u/s 234-C |
|
|
|
|
For Shortfall in 1st Inst. |
0.000 |
|
|
|
For Shortfall in 2nd Inst. |
0.001 |
|
|
|
For Shortfall in 3rd Inst. |
0.000 |
0.005 |
|
|
|
|
------------- |
|
|
Less: Self-Assessment Tax paid on 25.03.2014 |
|
0.024 |
|
|
BSR: 0000497 CIN: 00004 |
|
|
|
|
|
|
|
|
|
Net Tax Refundable (Subject to interest u/s 244A) |
|
|
0.000 |
------------------------------------------------------------------------------------------------------------------------------
SUMMARY OF INCOME
MR. ALTAFHUSEN SHAIKH
(RS. IN MILLION)
|
PARTICULARS |
2013-2014 |
||
|
|
|
|
|
|
Salary |
|
|
0.000 |
|
Business and Profession |
|
|
0.271 |
|
Other Sources |
|
|
0.000 |
|
|
|
|
|
|
Gross Total Income |
|
|
0.271 |
|
|
|
|
|
|
Total Deductions |
|
|
0.061 |
|
|
|
|
|
|
Total Income |
|
|
0.210 |
|
|
|
|
|
|
Agriculture Income |
|
|
0.253 |
|
|
|
|
|
|
Tax Due |
|
|
0.000 |
|
|
|
|
|
|
Exempt Income |
|
|
0.006 |
|
|
|
|
|
|
Salary Income |
|||
|
Total Salary |
|
|
0.000 |
|
|
|
|
|
|
Business and
Profession Remuneration
from Firms |
|||
|
WARIS COTTON |
|
|
|
|
Remuneration |
0.073 |
|
|
|
Interest |
0.198 |
|
|
|
Net |
|
0.271 |
|
|
|
|
|
|
|
Net Income |
|
|
0.271 |
|
|
|
|
|
|
Section 80
Deductions |
|||
|
Sec 80C |
|
0.052 |
|
|
|
0.052 |
|
|
|
|
|
|
|
|
Section 80D (Medical Premia) |
|
0.009 |
|
|
Relationship to Assessee Medical Premium |
|
|
|
|
|
0.009 |
|
|
|
Total |
|
|
0.061 |
|
|
|
|
|
|
Income Tax |
|||
|
Agriculture Income |
|
|
0.253 |
|
|
|
|
|
|
Total Income |
|
|
0.210 |
|
|
|
|
|
|
Basic Exemption |
|
|
0.200 |
|
|
|
|
|
|
Income Tax (Before Tax Credit u/s 87A) |
|
|
0.026 |
|
|
|
|
|
|
Tax Credit u/s 87A |
|
|
0.001 |
|
|
|
|
|
|
Income tax |
|
|
0.025 |
|
|
|
|
|
|
Agriculture Relief |
|
|
0.025 |
|
|
|
|
|
|
Payable |
|
|
0.000 |
|
|
|
|
|
|
Exempt Income |
|||
|
Agriculture Income |
|
0.253 |
|
|
|
|
|
|
|
Net |
|
|
0.253 |
------------------------------------------------------------------------------------------------------------------------------
SUMMARY OF INCOME
MR. ALTAMAS ALTAFHUSEN
SHAIKH
(RS. IN MILLION)
|
PARTICULARS |
2013-2014 |
||
|
|
|
|
|
|
Salary |
|
|
0.000 |
|
Business and Profession |
|
|
0.061 |
|
Other Sources |
|
|
0.000 |
|
|
|
|
|
|
Gross Total Income |
|
|
0.061 |
|
|
|
|
|
|
Total Income |
|
|
0.061 |
|
|
|
|
|
|
Tax Due |
|
|
0.000 |
|
|
|
|
|
|
Exempt Income |
|
|
0.001 |
|
|
|
|
|
|
Salary Income |
|||
|
Total Salary |
|
|
0.000 |
|
|
|
|
|
|
Business and
Profession Remuneration
from Firms |
|||
|
WARIS COTTON |
|
|
|
|
Remuneration |
0.037 |
|
|
|
Interest |
0.024 |
|
|
|
Net |
|
0.061 |
|
|
|
|
|
|
|
Net Income |
|
|
0.061 |
|
|
|
|
|
|
Section 80
Deductions |
|||
|
|
|
|
|
|
Total |
|
|
0.000 |
|
|
|
|
|
|
Income Tax |
|||
|
|
|
|
|
|
Total Income |
|
|
0.061 |
|
|
|
|
|
|
Basic Exemption |
|
|
0.200 |
|
|
|
|
|
|
Income Tax |
|
|
0.000 |
|
|
|
|
|
|
Payable |
|
|
0.000 |
------------------------------------------------------------------------------------------------------------------------------
COST OF PROJECT
(RS. IN MILLION)
|
PARTICULARS |
EXISTING AMOUNT |
PROPOSED AMOUNT |
TOTAL AMOUNT |
|
|
|
|
|
|
Land and Site Development |
|
|
|
|
Factory Land
|
1.700 |
-- |
1.700 |
|
|
|
|
|
|
Buildings |
|
|
|
|
Factory Building |
2.245 |
1.629 |
3.874 |
|
|
|
|
|
|
Plant and Machineries |
|
|
|
|
Indigenous Machineries |
4.142 |
4.523 |
8.665 |
|
Tools, Jigs and Fixture |
0.114 |
-- |
0.114 |
|
|
|
|
|
|
Total Capital Cost of Project |
8.201 |
6.152 |
14.353 |
|
|
|
|
|
|
Margin Money for Working Capital |
3.187 |
2.581 |
5.768 |
|
|
|
|
|
|
TOTAL COST OF PROJECT |
11.388 |
8.733 |
20.121 |
------------------------------------------------------------------------------------------------------------------------------
MEANS OF FINANCE
(RS. IN MILLION)
|
PARTICULARS |
EXISTING AMOUNT |
PROPOSED AMOUNT |
TOTAL AMOUNT |
|
|
|
|
|
|
Partners’ Capital |
|
|
|
|
All Partners |
8.989 |
2.000 |
10.989 |
|
Total Partners Capital |
8.989 |
2.000 |
10.989 |
|
|
|
|
|
|
Depreciation Fund |
1.480 |
-- |
1.480 |
|
|
|
|
|
|
Long/ Medium Term Borrowings |
|
|
|
|
VIMCO Bank |
0.919 |
-- |
0.919 |
|
Proposed Bank |
-- |
3.300 |
3.300 |
|
Total Long/ Medium Term Borrowings |
0.919 |
3.300 |
4.219 |
|
|
|
|
|
|
Unsecured Loans/ Deposits |
|
|
|
|
From Farmers - Creditors |
-- |
3.433 |
3.433 |
|
Total Unsecured Loans/ Deposits |
-- |
3.433 |
3.433 |
|
|
|
|
|
|
TOTAL MEANS OF FINANCE |
11.388 |
8.733 |
20.121 |
------------------------------------------------------------------------------------------------------------------------------
PROFITABILITY AND NET CASH ACCRUALS
(RS. IN MILLION)
|
PARTICULARS |
2014-15 Estimates |
2015-16 Projection |
2016-17 Projection |
2017-18 Projection |
2018-19 Projection |
2019-20 Projection |
|
|
|
|
|
|
|
|
|
Revenue / Income / Realisation |
|
|
|
|
|
|
|
Gross Sales Realisation |
54.037 |
81.055 |
83.218 |
84.298 |
85.379 |
86.459 |
|
Less: Excise Duties/ Levies |
-- |
-- |
-- |
-- |
-- |
-- |
|
|
|
|
|
|
|
|
|
Net Sales Realisation |
54.037 |
81.055 |
83.218 |
84.298 |
85.379 |
86.459 |
|
|
|
|
|
|
|
|
|
Total Revenue / Income / Realisation |
54.037 |
81.055 |
83.218 |
84.298 |
85.379 |
86.459 |
|
|
|
|
|
|
|
|
|
Expenses/ Cost of Products/ Services/ Items |
|
|
|
|
|
|
|
Main Material Cost |
|
|
|
|
|
|
|
Manufacturing Item |
43.811 |
65.717 |
67.469 |
68.346 |
69.222 |
70.098 |
|
Consumables, Stores, etc. |
0.540 |
0.811 |
1.732 |
2.143 |
2.254 |
2.465 |
|
Employees Expenses |
1.462 |
1.535 |
1.611 |
1.692 |
1.777 |
1.865 |
|
Power/ Electricity Expenses |
0.811 |
1.216 |
1.248 |
1.264 |
1.281 |
1.297 |
|
Depreciation |
1.508 |
1.299 |
1.119 |
0.965 |
0.832 |
0.719 |
|
Partners Remuneration |
0.525 |
0.550 |
1.075 |
1.100 |
1.125 |
1.150 |
|
Partners Interest on Capital |
0.350 |
0.375 |
0.800 |
0.825 |
0.850 |
0.875 |
|
|
|
|
|
|
|
|
|
Total Cost of Manufacture |
49.007 |
71.503 |
75.054 |
76.335 |
77.341 |
78.469 |
|
Add: Opening stock W.I.P. |
-- |
-- |
-- |
-- |
-- |
-- |
|
|
|
|
|
|
|
|
|
Less: Closing stock W.I.P. |
-- |
-- |
-- |
-- |
-- |
-- |
|
|
|
|
|
|
|
|
|
Net Cost of Output/ Services |
49.007 |
71.503 |
75.054 |
76.335 |
77.341 |
78.469 |
|
|
|
|
|
|
|
|
|
Add: Opening stock of Finished Goods |
28.635 |
25.695 |
21.417 |
21.295 |
21.589 |
21.908 |
|
|
|
|
|
|
|
|
|
Less: Closing stock of Finished Goods |
25.695 |
21.417 |
21.295 |
21.589 |
21.908 |
22.257 |
|
|
|
|
|
|
|
|
|
Cost of Output of Goods sold |
51.947 |
75.781 |
75.176 |
76.042 |
77.021 |
78.120 |
|
|
|
|
|
|
|
|
|
Gross Profit |
2.090 |
5.274 |
8.042 |
8.256 |
8.358 |
8.339 |
|
|
|
|
|
|
|
|
|
Administration Expenses |
1.823 |
2.644 |
3.219 |
3.862 |
3.906 |
3.951 |
|
|
|
|
|
|
|
|
|
Financial Charges |
|
|
|
|
|
|
|
Long/ Medium Term Borrowings |
0.085 |
0.406 |
0.300 |
0.221 |
0.142 |
0.063 |
|
On Working Capital Borrowings |
0.047 |
1.560 |
1.560 |
1.560 |
1.560 |
1.560 |
|
|
|
|
|
|
|
|
|
Total Financial Charges |
0.132 |
1.966 |
1.860 |
1.781 |
1.702 |
1.623 |
|
|
|
|
|
|
|
|
|
Selling Expenses |
-- |
-- |
2.000 |
1.600 |
1.500 |
1.200 |
|
|
|
|
|
|
|
|
|
Total Cost of Sales |
53.902 |
80.391 |
82.255 |
83.285 |
84.129 |
84.894 |
|
|
|
|
|
|
|
|
|
Net Profit before Taxes |
0.135 |
0.664 |
0.963 |
1.013 |
1.250 |
1.565 |
|
|
|
|
|
|
|
|
|
Tax on Profit |
0.028 |
0.191 |
0.283 |
0.298 |
0.371 |
0.468 |
|
|
|
|
|
|
|
|
|
Net Profit after Taxes |
0.108 |
0.474 |
0.680 |
0.715 |
0.879 |
1.096 |
|
|
|
|
|
|
|
|
|
Depreciation added back |
1.508 |
1.299 |
1.119 |
0.965 |
0.832 |
0.719 |
|
|
|
|
|
|
|
|
|
Net Cash Accruals |
1.615 |
1.772 |
1.799 |
1.680 |
1.711 |
1.816 |
------------------------------------------------------------------------------------------------------------------------------
SOURCES AND DISPOSITION OF FUNDS
(RS. IN MILLION)
|
PARTICULARS |
2014-15 Estimates |
2015-16 Projection |
2016-17 Projection |
2017-18 Projection |
2018-19 Projection |
2019-20 Projection |
|
|
|
|
|
|
|
|
|
SOURCES OF FUNDS |
|
|
|
|
|
|
|
Net Profit before Tax with Interest Charges
added back but after Depreciation Provision
|
0.267 |
2.630 |
2.823 |
2.794 |
2.952 |
3.188 |
|
|
|
|
|
|
|
|
|
Partners’ Capital |
-- |
-- |
-- |
-- |
-- |
-- |
|
|
|
|
|
|
|
|
|
Depreciation |
1.508 |
1.299 |
1.119 |
0.965 |
0.832 |
0.719 |
|
|
|
|
|
|
|
|
|
Increase in Long/ Medium Term Proposed – Proposed
Bank |
-- |
-- |
-- |
-- |
-- |
-- |
|
|
|
|
|
|
|
|
|
Increase in Unsecured Loans
Proposed-from-Farmers |
-- |
-- |
-- |
-- |
-- |
-- |
|
|
|
|
|
|
|
|
|
Increase in Bank Borrowings for Working
Capital |
0.029 |
10.000 |
-- |
-- |
-- |
-- |
|
|
|
|
|
|
|
|
|
Increase in Current Liabilities |
(6.412) |
(13.644) |
0.651 |
0.516 |
0.504 |
0.496 |
|
|
|
|
|
|
|
|
|
TOTAL SOURCES OF FUNDS |
(4.608) |
0.285 |
4.593 |
4.275 |
4.288 |
4.403 |
|
|
|
|
|
|
|
|
|
DISPOSITIONS OF FUNDS |
|
|
|
|
|
|
|
Increase in Capital Expenses |
-- |
-- |
-- |
-- |
-- |
-- |
|
|
|
|
|
|
|
|
|
Increase in Current Assets |
(3.550) |
(3.771) |
2.565 |
1.828 |
1.341 |
0.863 |
|
|
|
|
|
|
|
|
|
Decrease in Long/ Medium Term Existing-VIMCO
Bank |
0.460 |
0.459 |
-- |
-- |
-- |
-- |
|
|
|
|
|
|
|
|
|
Proposed – Proposed Bank |
-- |
0.495 |
0.660 |
0.660 |
0.660 |
0.660 |
|
|
|
|
|
|
|
|
|
Decrease in Unsecured Loans |
-- |
-- |
-- |
-- |
-- |
-- |
|
Interest/ Financial Expenses |
0.132 |
1.966 |
1.860 |
1.781 |
1.702 |
1.623 |
|
|
|
|
|
|
|
|
|
Taxes on Profit |
0.028 |
0.191 |
0.283 |
0.298 |
0.371 |
0.468 |
|
|
|
|
|
|
|
|
|
TOTAL DISPOSITION |
(2.930) |
(0.660) |
5.368 |
4.567 |
4.074 |
3.614 |
|
|
|
|
|
|
|
|
|
Opening Balance |
2.705 |
1.027 |
1.973 |
1.198 |
0.906 |
1.120 |
|
|
|
|
|
|
|
|
|
Net Surplus/ Deficit |
(1.678) |
0.946 |
(0.775) |
(0.292) |
0.214 |
0.789 |
|
|
|
|
|
|
|
|
|
Closing Balance |
1.027 |
1.973 |
1.198 |
0.906 |
1.120 |
1.909 |
------------------------------------------------------------------------------------------------------------------------------
PROJECTED BALANCE SHEET
(RS. IN MILLION)
|
PARTICULARS |
2014-15 Estimates |
2015-16 Projection |
2016-17 Projection |
2017-18 Projection |
2018-19 Projection |
2019-20 Projection |
|
LIABILITIES |
|
|
|
|
|
|
|
Capital at the Beginning |
8.989 |
11.096 |
11.569 |
12.249 |
12.964 |
13.843 |
|
Add: Net Profit after Taxes |
0.107 |
0.473 |
0.680 |
0.715 |
0.879 |
1.097 |
|
Add: Additions to Capital |
2.000 |
-- |
-- |
-- |
-- |
-- |
|
|
|
|
|
|
|
|
|
Capital at the end of the year |
11.096 |
11.569 |
12.249 |
12.964 |
13.843 |
14.940 |
|
|
|
|
|
|
|
|
|
Long/ Medium Term Borrowings |
|
|
|
|
|
|
|
Existing VIMCO Bank |
0.459 |
-- |
-- |
-- |
-- |
-- |
|
Proposed- Proposed Bank |
3.300 |
2.805 |
2.145 |
1.485 |
0.825 |
0.165 |
|
|
|
|
|
|
|
|
|
Unsecured Loans/ Deposits |
|
|
|
|
|
|
|
Proposed-from Farmer-Creditors |
3.433 |
3.433 |
3.433 |
3.433 |
3.433 |
3.433 |
|
Bank Borrowing for Working Capital |
3.000 |
13.000 |
13.000 |
13.000 |
13.000 |
13.000 |
|
|
|
|
|
|
|
|
|
Current Liabilities |
|
|
|
|
|
|
|
Sundry Creditors |
-- |
-- |
-- |
-- |
-- |
-- |
|
Other Current Liabilities |
17.907 |
4.263 |
4.915 |
5.431 |
5.935 |
6.431 |
|
Total Current Liabilities |
17.907 |
4.263 |
4.915 |
5.431 |
5.935 |
6.431 |
|
|
|
|
|
|
|
|
|
TOTAL LIABILITIES |
39.195 |
35.070 |
35.742 |
36.313 |
37.036 |
37.969 |
|
|
|
|
|
|
|
|
|
ASSETS |
|
|
|
|
|
|
|
Fixed Assets |
|
|
|
|
|
|
|
Gross Block |
14.353 |
14.353 |
14.353 |
14.353 |
14.353 |
14.353 |
|
Less: Depreciation |
2.988 |
4.287 |
5.406 |
6.371 |
7.203 |
7.922 |
|
|
|
|
|
|
|
|
|
Net Block |
11.365 |
10.066 |
8.947 |
7.982 |
7.150 |
6.431 |
|
|
|
|
|
|
|
|
|
Current Assets |
|
|
|
|
|
|
|
Stock on hand |
25.695 |
21.417 |
21.295 |
21.589 |
21.908 |
22.257 |
|
Receivables |
0.901 |
1.351 |
1.387 |
1.405 |
1.423 |
1.441 |
|
Cash and Bank Balances |
1.027 |
1.973 |
1.198 |
0.906 |
1.120 |
1.909 |
|
Other Current Assets |
0.207 |
0.263 |
2.915 |
4.431 |
5.435 |
5.931 |
|
|
|
|
|
|
|
|
|
Total Current Assets |
27.830 |
25.004 |
26.795 |
28.331 |
29.886 |
31.538 |
|
|
|
|
|
|
|
|
|
TOTAL ASSETS |
39.195 |
35.070 |
35.742 |
36.313 |
37.036 |
37.969 |
------------------------------------------------------------------------------------------------------------------------------
PROFITABILITY RATIOS, DSCR, DEBT EQUITY,
ETC.
(RS. IN MILLION)
|
PARTICULARS |
2014-15 Estimates |
2015-16 Projection |
2016-17 Projection |
2017-18 Projection |
2018-19 Projection |
2019-20 Projection |
|
|
|
|
|
|
|
|
|
Profit percentages to Net Sales |
|
|
|
|
|
|
|
Gross Profit |
2.090 |
5.274 |
8.042 |
8.256 |
8.358 |
8.339 |
|
% of GP to Net Sales |
3.87 |
6.51 |
9.66 |
9.79 |
9.79 |
9.65 |
|
|
|
|
|
|
|
|
|
P.B.I.D.T. |
1.775 |
3.929 |
3.942 |
3.759 |
3.784 |
3.907 |
|
% of PBIDT to Net Sales |
3.28 |
4.85 |
4.74 |
4.46 |
4.43 |
4.52 |
|
|
|
|
|
|
|
|
|
Net Profit before Taxes |
0.135 |
0.664 |
0.963 |
1.013 |
1.250 |
1.565 |
|
% of NPBT to Net Sales |
0.25 |
0.82 |
1.16 |
1.20 |
1.46 |
1.81 |
|
|
|
|
|
|
|
|
|
Net Profit after Taxes |
0.107 |
0.473 |
0.680 |
0.715 |
0.879 |
1.097 |
|
% of NPAT to Net Sales |
0.20 |
0.58 |
0.82 |
0.85 |
1.03 |
1.27 |
|
|
|
|
|
|
|
|
|
Net Cash Accruals |
1.615 |
1.772 |
1.799 |
1.680 |
1.711 |
1.816 |
|
% of Cash Accruals to Net Sales |
2.99 |
2.19 |
2.16 |
1.99 |
2.00 |
2.10 |
|
|
|
|
|
|
|
|
|
Debt Service Coverage Ratio |
|
|
|
|
|
|
|
Funds available to Service Debts |
|
|
|
|
|
|
|
Net Profit after Taxes |
0.107 |
0.473 |
0.680 |
0.715 |
0.879 |
1.097 |
|
Depreciation Charges |
1.508 |
1.299 |
1.119 |
0.965 |
0.832 |
0.719 |
|
Interest on Long/ Medium Term |
0.085 |
0.406 |
0.300 |
0.221 |
0.142 |
0.063 |
|
|
|
|
|
|
|
|
|
Total |
1.700 |
2.178 |
2.099 |
1.901 |
1.853 |
1.879 |
|
|
|
|
|
|
|
|
|
Debt Service Obligations |
|
|
|
|
|
|
|
Repayment of Long/ Medium Term |
0.460 |
0.954 |
0.660 |
0.660 |
0.660 |
0.660 |
|
Interest on Long/ Medium Term |
0.085 |
0.406 |
0.300 |
0.221 |
0.142 |
0.063 |
|
|
|
|
|
|
|
|
|
Total |
0.545 |
1.360 |
0.960 |
0.881 |
0.802 |
0.723 |
|
|
|
|
|
|
|
|
|
D.S.C.R. (Individual) |
3.12 |
1.60 |
2.19 |
2.16 |
2.31 |
2.60 |
|
|
|
|
|
|
|
|
|
D.S.C.R. (Cumulative) |
3.12 |
2.04 |
2.09 |
2.10 |
2.14 |
2.20 |
|
|
|
|
|
|
|
|
|
D.S.C.R. (Overall) |
2.46 |
|||||
|
|
|
|
|
|
|
|
|
Indebtedness Ratios Initial |
|
|
|
|
|
|
|
Debt / Equity [Non Quasi] |
0.65 |
0.54 |
0.46 |
0.38 |
0.31 |
0.24 |
|
|
|
|
|
|
|
|
|
Debt / Equity [Quasi] |
0.26 |
0.19 |
0.14 |
0.09 |
0.05 |
0.01 |
|
|
|
|
|
|
|
|
|
TOL/ TNW [Non Quasi] |
2.53 |
2.03 |
1.92 |
1.80 |
1.68 |
1.54 |
|
|
|
|
|
|
|
|
|
TOL/ TNW [Quasi] |
1.70 |
1.34 |
1.28 |
1.21 |
1.14 |
1.07 |
|
|
|
|
|
|
|
|
|
Assets Turnover Ratio (x) |
1.38 |
2.31 |
2.33 |
2.32 |
2.31 |
2.28 |
|
|
|
|
|
|
|
|
|
Interest Coverage PBIDT/ Int. |
1.345 |
2.00 |
2.12 |
2.11 |
2.22 |
2.41 |
------------------------------------------------------------------------------------------------------------------------------
BREAK EVEN ANALYSIS
(RS. IN MILLION)
|
PARTICULARS |
2014-15 Estimates |
2015-16 Projection |
2016-17 Projection |
2017-18 Projection |
2018-19 Projection |
2019-20 Projection |
|
|
|
|
|
|
|
|
|
Total Value of Output/ Services |
54.037 |
81.056 |
83.218 |
84.298 |
85.379 |
86.460 |
|
Other Operating Income |
-- |
-- |
-- |
-- |
-- |
-- |
|
|
|
|
|
|
|
|
|
Total Operating Income |
54.037 |
81.056 |
83.218 |
84.298 |
85.379 |
86.460 |
|
|
|
|
|
|
|
|
|
Variable Cost of Output/ Services |
|
|
|
|
|
|
|
Main Material Cost |
43.811 |
65.717 |
67.469 |
68.346 |
69.222 |
70.098 |
|
Other Material Cost |
-- |
-- |
-- |
-- |
-- |
-- |
|
Packing Material Cost |
-- |
-- |
-- |
-- |
-- |
-- |
|
Interest on Working Capital |
0.047 |
1.560 |
1.560 |
1.560 |
1.560 |
1.560 |
|
Sales Commission Variable Expenses |
-- |
-- |
-- |
-- |
-- |
-- |
|
Less: W.I.P. Adjustments |
-- |
-- |
-- |
-- |
-- |
-- |
|
|
|
|
|
|
|
|
|
Total Variable Cost |
43.858 |
67.277 |
69.029 |
69.906 |
70.782 |
71.658 |
|
|
|
|
|
|
|
|
|
Net Contribution |
10.179 |
13.779 |
14.189 |
14.392 |
14.597 |
14.802 |
|
|
|
|
|
|
|
|
|
Profit Volume Ratio [%] |
18.83 |
16.99 |
17.05 |
17.07 |
17.09 |
17.12 |
|
|
|
|
|
|
|
|
|
Semi Fixed / Semi Variable Expenses / Semi
Fixed Expenses |
|
|
|
|
|
|
|
Employees Expenses |
0.819 |
0.819 |
0.819 |
0.819 |
0.819 |
0.819 |
|
Power/ Electricity Expenses |
0.001 |
0.001 |
0.001 |
0.001 |
0.001 |
0.001 |
|
Depreciation Charges |
1.508 |
1.299 |
1.119 |
0.965 |
0.832 |
0.719 |
|
Deferred Expenses w/off |
-- |
-- |
-- |
-- |
-- |
-- |
|
Interest Charges |
0.085 |
0.406 |
0.300 |
0.221 |
0.142 |
0.063 |
|
Less: Misc. Income |
-- |
-- |
-- |
-- |
-- |
-- |
|
Total Net Fixed Expenses |
2.413 |
2.525 |
2.239 |
2.006 |
1.794 |
1.602 |
|
|
|
|
|
|
|
|
|
Total Net Cash Fixed Expenses |
0.905 |
1.226 |
1.120 |
1.041 |
0.962 |
0.883 |
|
|
|
|
|
|
|
|
|
Semi Fixed Expenses [Semi-Fixed] |
|
|
|
|
|
|
|
Consumables, Stores etc. |
-- |
0.223 |
0.983 |
1.323 |
1.414 |
1.589 |
|
Partners Remuneration |
-- |
0.012 |
0.280 |
0.293 |
0.306 |
0.319 |
|
Partners Interest on Capital |
-- |
0.015 |
0.274 |
0.289 |
0.305 |
0.320 |
|
Administration and Selling Expenses |
-- |
0.569 |
2.356 |
2.525 |
2.486 |
2.309 |
|
|
|
|
|
|
|
|
|
Total Semi Fixed Expenses |
-- |
0.821 |
3.896 |
4.432 |
4.512 |
4.538 |
|
|
|
|
|
|
|
|
|
Semi Fixed Expenses [Variable] |
|
|
|
|
|
|
|
Consumables, Stores etc. |
0.540 |
0.587 |
0.748 |
0.819 |
0.839 |
0.875 |
|
Employees Expenses |
0.642 |
0.715 |
0.791 |
0.872 |
0.957 |
1.045 |
|
Power/Electricity Expenses |
0.809 |
1.214 |
1.246 |
1.262 |
1.279 |
1.295 |
|
Partners Remuneration |
0.525 |
0.537 |
0.794 |
0.806 |
0.818 |
0.830 |
|
Partners Interest on Capital |
0.350 |
0.359 |
0.525 |
0.535 |
0.544 |
0.554 |
|
Administration and Selling Expenses |
1.823 |
2.074 |
2.862 |
2.936 |
2.919 |
2.841 |
|
|
|
|
|
|
|
|
|
Total Semi Fixed Expenses |
4.690 |
5.488 |
6.968 |
7.233 |
7.359 |
7.444 |
|
|
|
|
|
|
|
|
|
Total Expenses |
7.104 |
8.836 |
13.104 |
13.672 |
13.667 |
13.585 |
|
|
|
|
|
|
|
|
|
Total Cash Expenses |
5.596 |
7.537 |
11.985 |
12.707 |
12.835 |
12.866 |
|
|
|
|
|
|
|
|
|
Cash Break Even Sales |
29.707 |
44.336 |
70.291 |
74.428 |
75.072 |
75.151 |
|
|
|
|
|
|
|
|
|
Cash Margin of Safety |
24.329 |
36.718 |
12.926 |
9.869 |
10.306 |
11.307 |
|
|
|
|
|
|
|
|
|
Break Even Sales |
37.712 |
51.978 |
76.854 |
80.080 |
79.939 |
79.351 |
|
|
|
|
|
|
|
|
|
Margin of Safety |
16.324 |
29.076 |
6.363 |
4.217 |
5.439 |
7.107 |
|
At Maximum Utilisation: |
Year |
7.00 |
|
[as % to Installed Capacity] |
|
|
|
|
|
|
|
Cash B.E.P. |
% |
70.28 |
|
B.E.P. |
% |
73.63 |
------------------------------------------------------------------------------------------------------------------------------
ASSESSMENT OF WORKING CAPITAL REQUIREMENTS
OPERATING STATEMENT
(RS. IN MILLION)
|
SR. NO. |
PARTICULARS |
2014-15 Estimates |
2015-16 Projection |
2016-17 Projection |
2017-18 Projection |
2018-19 Projection |
2019-20 Projection |
|
|
|
|
|
|
|
|
|
|
1 |
Gross Sales |
|
|
|
|
|
|
|
|
a) Domestic Sales |
54.037 |
81.055 |
83.218 |
84.298 |
85.379 |
86.459 |
|
|
b) Export Sales |
0.000 |
0.000 |
0.000 |
0.000 |
0.000 |
0.000 |
|
|
|
|
|
|
|
|
|
|
|
Total |
54.037 |
81.055 |
83.218 |
84.298 |
85.379 |
86.459 |
|
|
|
|
|
|
|
|
|
|
2 |
Less: Excise Duty |
-- |
-- |
-- |
-- |
-- |
-- |
|
|
|
|
|
|
|
|
|
|
3 |
Net Sales [1-2] |
54.037 |
81.055 |
83.218 |
84.298 |
85.379 |
86.459 |
|
|
|
|
|
|
|
|
|
|
4 |
%age rise (+) or fall (-) in net sales as compared to previous year |
13.43 |
50 |
2.67 |
1.3 |
1.28 |
1.26 |
|
|
|
|
|
|
|
|
|
|
5 |
Cost of Sales |
|
|
|
|
|
|
|
|
i. Raw Material [including stores and other
items used in the process of manufacture] |
|
|
|
|
|
|
|
|
- Imported |
43.811 |
65.717 |
67.459 |
68.346 |
69.222 |
70.098 |
|
|
- Indigenous |
-- |
-- |
-- |
-- |
-- |
-- |
|
|
|
|
|
|
|
|
|
|
|
ii. Other Spares |
|
|
|
|
|
|
|
|
- Imported |
-- |
-- |
-- |
-- |
- |
-- |
|
|
- Indigenous |
0.540 |
0.811 |
1.732 |
2.143 |
2.254 |
2.465 |
|
|
|
|
|
|
|
|
|
|
|
iii. Power and Fuel |
0.811 |
1.216 |
1.248 |
1.264 |
1.281 |
1.297 |
|
|
|
|
|
|
|
|
|
|
|
iv. Direct Labour [Factory Wages and
Salaries] |
1.462 |
1.535 |
1.611 |
1.692 |
1.777 |
1.865 |
|
|
|
|
|
|
|
|
|
|
|
v. Other Manufacturing Expenses |
0.875 |
0.925 |
1.875 |
1.925 |
1.975 |
2.025 |
|
|
|
|
|
|
|
|
|
|
|
vi. Depreciation |
1.508 |
1.299 |
1.119 |
0.965 |
0.832 |
0.719 |
|
|
|
|
|
|
|
|
|
|
|
vii. Sub-Total [i to vi] |
49.007 |
71.503 |
75.054 |
76.335 |
77.341 |
78.469 |
|
|
|
|
|
|
|
|
|
|
|
viii. Add: Opening stock in process |
-- |
-- |
-- |
-- |
-- |
-- |
|
|
|
|
|
|
|
|
|
|
|
Sub-Total |
49.007 |
71.503 |
75.054 |
76.335 |
77.341 |
78.469 |
|
|
|
|
|
|
|
|
|
|
|
ix. Less: Closing Stock in process |
-- |
-- |
-- |
-- |
-- |
-- |
|
|
|
|
|
|
|
|
|
|
|
x. Cost of Production |
49.007 |
71.503 |
75.054 |
76.335 |
77.341 |
78.469 |
|
|
|
|
|
|
|
|
|
|
|
xi. Add: Opening stock of Finished Goods |
28.635 |
25.695 |
21.417 |
21.295 |
21.589 |
21.908 |
|
|
|
|
|
|
|
|
|
|
|
Sub-Total |
77.642 |
97.198 |
96.471 |
97.630 |
98.930 |
100.377 |
|
|
|
|
|
|
|
|
|
|
|
xii. Less: Closing Stock of Finished Goods |
25.695 |
21.417 |
21.295 |
21.589 |
21.908 |
22.257 |
|
|
|
|
|
|
|
|
|
|
|
xiii. Sub-Total (Total Cost of Sales) |
51.947 |
75.781 |
75.176 |
76.041 |
77.022 |
78.120 |
|
|
|
|
|
|
|
|
|
|
6 |
Selling, General & Administrative Expenses |
1.823 |
2.644 |
5.219 |
5.462 |
5.406 |
5.151 |
|
|
|
|
|
|
|
|
|
|
7 |
Sub-Total [5+6] |
53.770 |
78.425 |
80.395 |
81.503 |
82.428 |
83.271 |
|
|
|
|
|
|
|
|
|
|
8 |
Operating Profit before Interest [3.-7] |
0.267 |
2.630 |
2.823 |
2.795 |
2.951 |
3.188 |
|
|
|
|
|
|
|
|
|
|
9 |
Interest |
0.132 |
1.966 |
1.860 |
1.781 |
1.702 |
1.623 |
|
|
|
|
|
|
|
|
|
|
10 |
Operating profit after Interest [8-9] |
0.135 |
0.664 |
0.963 |
1.014 |
1.249 |
1.565 |
|
|
|
|
|
|
|
|
|
|
11 |
(i) Add: Other non-operating
income |
-- |
-- |
-- |
-- |
-- |
-- |
|
|
|
|
|
|
|
|
|
|
|
Sub-total
(Income) |
-- |
-- |
-- |
-- |
-- |
-- |
|
|
|
|
|
|
|
|
|
|
|
(ii) Deduct:
Other non-operating expense |
-- |
-- |
-- |
-- |
-- |
-- |
|
|
|
|
|
|
|
|
|
|
|
Sub-total
(Expenses) |
-- |
-- |
-- |
-- |
-- |
-- |
|
|
|
|
|
|
|
|
|
|
|
(iii) Net of other non-operating incomes/ expenses (net of 8(i) &
8(ii)) |
-- |
-- |
-- |
-- |
-- |
-- |
|
|
|
|
|
|
|
|
|
|
12 |
Profit before Tax/Loss |
0.135 |
0.664 |
0.963 |
1.014 |
1.249 |
1.565 |
|
|
|
|
|
|
|
|
|
|
13 |
Provision for Taxes |
0.028 |
0.191 |
0.283 |
0.298 |
0.371 |
0.468 |
|
|
|
|
|
|
|
|
|
|
14 |
Net Profit [12-13] |
0.107 |
0.473 |
0.680 |
0.716 |
0.878 |
1.097 |
|
|
|
|
|
|
|
|
|
|
15 |
(i) Equity dividend Paid |
-- |
-- |
-- |
-- |
-- |
-- |
|
|
(ii) Dividend Rate |
-- |
-- |
-- |
-- |
-- |
-- |
|
|
|
|
|
|
|
|
|
|
16 |
Retained Profit |
0.107 |
0.473 |
0.680 |
0.716 |
0.878 |
1.097 |
|
|
|
|
|
|
|
|
|
|
17 |
Retained profit / Net Profit (%age) |
100 |
100 |
100 |
100 |
100 |
100 |
------------------------------------------------------------------------------------------------------------------------------
ANALYSIS OF BALANCE SHEET
(RS. IN MILLION)
|
SR. NO. |
PARTICULARS |
2014-15 Estimates |
2015-16 Projection |
2016-17 Projection |
2017-18 Projection |
2018-19 Projection |
2019-20 Projection |
|
|
|
|
|
|
|
|
|
|
|
CURRENT LIABILITIES |
|
|
|
|
|
|
|
1 |
Short
term borrowings from bank (incl. Bills purchased, discounted & excess
borrowings placed on repayment basis) |
|
|
|
|
|
|
|
|
(i) From Applicant Bank |
3.000 |
13.000 |
13.000 |
13.000 |
13.000 |
13.000 |
|
|
(ii)
From Other Banks |
-- |
-- |
-- |
-- |
-- |
--- |
|
|
(iii)
of which BP & BD |
-- |
-- |
-- |
-- |
-- |
--- |
|
|
|
|
|
|
|
|
|
|
|
Sub-Total (A) |
3.000 |
13.000 |
13.000 |
13.000 |
13.000 |
13.000 |
|
|
|
|
|
|
|
|
|
|
2 |
Short
term borrowings from others |
-- |
-- |
-- |
-- |
-- |
--- |
|
|
|
|
|
|
|
|
|
|
3 |
Sundry
Creditors - Trade |
-- |
-- |
-- |
-- |
-- |
--- |
|
|
|
|
|
|
|
|
|
|
4 |
Advance
payments from Customers/ Deposits from dealers |
-- |
-- |
-- |
-- |
-- |
--- |
|
|
|
|
|
|
|
|
|
|
5 |
Provision
for Taxation |
-- |
-- |
-- |
-- |
-- |
--- |
|
|
|
|
|
|
|
|
|
|
6 |
Dividend
Payable |
-- |
-- |
-- |
-- |
-- |
--- |
|
|
|
|
|
|
|
|
|
|
7 |
Other
statutory liabilities (due within one year) |
-- |
-- |
-- |
-- |
-- |
--- |
|
|
|
|
|
|
|
|
|
|
8 |
Deposits/Instalments
of term loan/ DPGs/ Debentures etc. (due within one year) |
0.954 |
0.660 |
0.660 |
0.660 |
0.660 |
0.165 |
|
|
|
|
|
|
|
|
|
|
9 |
Other
current liabilities & Provisions (due within one year) (Specify major
items) |
|
|
|
|
|
|
|
|
Accrued Expenses |
0.207 |
0.263 |
0.415 |
0.431 |
0.435 |
0.431 |
|
|
Statutory Liabilities |
-- |
-- |
-- |
-- |
-- |
--- |
|
|
Misc. C/ Liability 3 |
3.500 |
4.000 |
4.500 |
5.000 |
5.500 |
6.000 |
|
|
Misc. C/ Liability 4 |
0.200 |
-- |
-- |
-- |
-- |
--- |
|
|
Creditors for RM |
14.000 |
-- |
-- |
-- |
-- |
-- |
|
|
|
|
|
|
|
|
|
|
|
Sub-Total (B) |
18.861 |
4.923 |
5.575 |
6.091 |
6.595 |
6.596 |
|
|
|
|
|
|
|
|
|
|
|
TOTAL CURRENT LIABILITIES [Total of 1 to 9] |
21.861 |
17.923 |
18.575 |
19.091 |
19.595 |
19.596 |
|
|
|
|
|
|
|
|
|
|
|
TERM LIABILITIES |
|
|
|
|
|
|
|
11 |
Debentures
(not maturing within one year) |
-- |
-- |
-- |
-- |
-- |
--- |
|
|
|
|
|
|
|
|
|
|
12 |
Preference
Shares (redeemable after one year) |
-- |
-- |
-- |
-- |
-- |
--- |
|
|
|
|
|
|
|
|
|
|
13 |
Term
loans (excluding instalments payable within one year) |
2.805 |
2.145 |
1.485 |
0.825 |
0.165 |
0.000 |
|
|
|
|
|
|
|
|
|
|
14 |
Deferred
Payment Credits (excluding instalments due within one year) |
-- |
-- |
-- |
-- |
-- |
--- |
|
|
|
|
|
|
|
|
|
|
15 |
Term
Deposits (excluding instalments payable within one year) |
3.433 |
3.433 |
3.433 |
3.433 |
3.433 |
3.433 |
|
|
|
|
|
|
|
|
|
|
16 |
Other
Term Liabilities |
-- |
-- |
-- |
-- |
-- |
--- |
|
|
|
|
|
|
|
|
|
|
17 |
TOTAL TERM LIABILITIES (Total of 11 to 16) |
6.238 |
5.578 |
4.918 |
4.258 |
3.598 |
3.433 |
|
|
|
|
|
|
|
|
|
|
18 |
TOTAL OUTSIDE LIABILITIES [10+17] |
28.099 |
23.501 |
23.493 |
23.349 |
23.193 |
23.029 |
|
|
|
|
|
|
|
|
|
|
|
NET WORTH |
|
|
|
|
|
|
|
19 |
Ordinary
Capital |
11.096 |
11.569 |
12.249 |
12.965 |
13.843 |
14.940 |
|
|
|
|
|
|
|
|
|
|
20 |
General
Reserve |
-- |
-- |
-- |
-- |
-- |
-- |
|
|
|
|
|
|
|
|
|
|
21 |
Revaluation
Reserve |
-- |
-- |
-- |
-- |
-- |
-- |
|
|
|
|
|
|
|
|
|
|
22 |
Other
Reserves (excluding provisions) |
-- |
-- |
-- |
-- |
-- |
-- |
|
|
|
|
|
|
|
|
|
|
23 |
Surplus
(+) or deficit (-) in Profit & Loss Account |
-- |
-- |
-- |
-- |
-- |
-- |
|
|
|
|
|
|
|
|
|
|
24 |
NET WORTH |
11.096 |
11.569 |
12.249 |
12.965 |
13.843 |
14.940 |
|
|
|
|
|
|
|
|
|
|
25 |
TOTAL
LIABILITIES [18+24] |
39.195 |
35.070 |
35.742 |
36.314 |
37.036 |
37.969 |
|
|
|
|
|
|
|
|
|
|
|
CURRENT ASSETS |
|
|
|
|
|
|
|
26 |
Cash
& Bank balances |
1.027 |
1.973 |
1.198 |
0.906 |
1.120 |
1.909 |
|
|
|
|
|
|
|
|
|
|
27 |
Investments [Other than long term
investments] |
|
|
|
|
|
|
|
|
1. Government and Other Trustee
Securities |
-- |
-- |
-- |
-- |
-- |
-- |
|
|
|
|
|
|
|
|
|
|
|
2. Fixed Deposits with Banks |
-- |
-- |
-- |
-- |
-- |
-- |
|
|
|
|
|
|
|
|
|
|
28 |
i.
Receivables other than Deferred and Exports [including
Bills purchased / discounted by Banks] |
0.901 |
1.351 |
1.387 |
1.405 |
1.423 |
1.441 |
|
|
|
|
|
|
|
|
|
|
|
ii. Export Receivables [including Bills purchased
/ discounted by Banks] |
-- |
-- |
-- |
-- |
-- |
-- |
|
|
|
|
|
|
|
|
|
|
29 |
Installment of Deferred Receivables [due
within one year] |
-- |
-- |
-- |
-- |
-- |
-- |
|
|
|
|
|
|
|
|
|
|
30 |
Inventory |
|
|
|
|
|
|
|
|
(i) Raw materials (including stores and other items
in process of manufacture) |
|
|
|
|
|
|
|
|
(a)
Imported |
-- |
-- |
-- |
-- |
-- |
-- |
|
|
(b)
Indigenous |
-- |
-- |
-- |
-- |
-- |
-- |
|
|
|
|
|
|
|
|
|
|
|
(ii)
Stock-in-process |
-- |
-- |
-- |
-- |
-- |
-- |
|
|
|
|
|
|
|
|
|
|
|
(iii)
Finished Goods |
25.695 |
21.417 |
21.295 |
21.589 |
21.908 |
22.257 |
|
|
|
|
|
|
|
|
|
|
|
(iv)
Other consumable stores |
|
|
|
|
|
|
|
|
(a)
Imported |
-- |
-- |
-- |
-- |
-- |
-- |
|
|
(b)
Indigenous |
-- |
-- |
-- |
-- |
-- |
-- |
|
|
|
|
|
|
|
|
|
|
31 |
Advance
to suppliers of Raw materials & stores/spares |
-- |
-- |
-- |
-- |
-- |
-- |
|
|
|
|
|
|
|
|
|
|
32 |
Advance
payment of taxes |
-- |
-- |
-- |
-- |
-- |
-- |
|
|
|
|
|
|
|
|
|
|
33 |
Other
Current Assets |
|
|
|
|
|
|
|
|
Pre-paid Expenses |
0.207 |
0.263 |
0.415 |
0.432 |
0.435 |
0.431 |
|
|
Other Current Assets |
-- |
-- |
-- |
-- |
-- |
-- |
|
|
Misc. C/ Assets 2 |
-- |
-- |
-- |
-- |
-- |
-- |
|
|
Misc. C/ Assets 5 |
0.000 |
0.000 |
2.500 |
4.000 |
5.000 |
5.500 |
|
|
|
|
|
|
|
|
|
|
34 |
TOTAL CURRENT ASSETS [Total 26 to 33] |
27.830 |
25.004 |
26.795 |
28.332 |
29.886 |
31.538 |
|
|
|
|
|
|
|
|
|
|
|
FIXED ASSETS |
|
|
|
|
|
|
|
35 |
Gross
Block (land & building machinery vehicles work-in-progress) |
14.353 |
14.353 |
14.353 |
14.353 |
14.353 |
14.353 |
|
|
|
|
|
|
|
|
|
|
36 |
Depreciation
to date |
2.988 |
4.287 |
5.406 |
6.371 |
7.203 |
7.922 |
|
|
|
|
|
|
|
|
|
|
37 |
NET BLOCK (35-36) |
11.365 |
10.066 |
8.947 |
7.982 |
7.150 |
6.431 |
|
|
|
|
|
|
|
|
|
|
|
OTHER NON-CURRENT ASSETS |
|
|
|
|
|
|
|
38 |
Investments/
book debts/ advances deposits which are not current assets |
|
|
|
|
|
|
|
|
i.(a)
Investments in subsidiary companies/ affiliates |
-- |
-- |
-- |
-- |
-- |
-- |
|
|
(b)
Others |
-- |
-- |
-- |
-- |
-- |
-- |
|
|
|
|
|
|
|
|
|
|
|
ii.
Advances to suppliers of capital goods & contractors |
-- |
-- |
-- |
-- |
-- |
-- |
|
|
|
|
|
|
|
|
|
|
|
iii.
Deferred receivables (maturity exceeding one year) |
-- |
-- |
-- |
-- |
-- |
-- |
|
|
|
|
|
|
|
|
|
|
|
iv.
Others |
-- |
-- |
-- |
-- |
-- |
-- |
|
|
|
|
|
|
|
|
|
|
39 |
Non
consumables stores & spare |
-- |
-- |
-- |
-- |
-- |
-- |
|
|
|
|
|
|
|
|
|
|
40 |
Other
non-current assets (incl. Dues from director) |
-- |
-- |
-- |
-- |
-- |
-- |
|
|
|
|
|
|
|
|
|
|
41 |
TOTAL OTHER NON-CURRENT ASSETS (Total of 38
to 40) |
-- |
-- |
-- |
-- |
-- |
-- |
|
|
|
|
|
|
|
|
|
|
42 |
Intangible
assets (patents, goodwill, prelim, expenses, bad/ doubtful debts not provided
for etc.) |
-- |
-- |
-- |
-- |
-- |
-- |
|
|
|
|
|
|
|
|
|
|
43 |
TOTAL
ASSETS (Total of 34, 37, 41 & 42) |
39.195 |
35.070 |
35.742 |
36.314 |
37.036 |
37.969 |
|
|
|
|
|
|
|
|
|
|
44 |
Tangible Net Worth (24-42) |
11.096 |
11.569 |
12.249 |
12.965 |
13.843 |
14.940 |
|
|
|
|
|
|
|
|
|
|
45 |
Net Working Capital [34 - 10] |
5.969 |
7.081 |
8.220 |
9.241 |
10.291 |
11.942 |
|
|
|
|
|
|
|
|
|
|
46 |
Current
Ratio |
1.27 |
1.40 |
1.44 |
1.48 |
1.53 |
1.61 |
|
|
|
|
|
|
|
|
|
|
47 |
Total
Outside Liabilities / Net Worth
(18/44) |
2.53 |
2.03 |
1.92 |
1.80 |
1.68 |
1.54 |
------------------------------------------------------------------------------------------------------------------------------
FUNDS FLOW STATEMENT
(RS. IN MILLION)
|
SR. NO. |
PARTICULARS |
2014-15 Estimates |
2015-16 Projection |
2016-17 Projection |
2017-18 Projection |
2018-19 Projection |
2019-20 Projection |
|
|
|
|
|
|
|
|
|
|
1 |
SOURCES |
|
|
|
|
|
|
|
|
[a] Net profit (after tax) |
0.107 |
0.473 |
0.680 |
0.716 |
0.878 |
1.097 |
|
|
[b] Depreciation |
1.508 |
1.299 |
1.119 |
0.965 |
0.832 |
0.719 |
|
|
[c]
Increase in Capital |
2.000 |
-- |
-- |
-- |
-- |
-- |
|
|
[d]
Increase in Term Liabilities (including Public deposits) |
5.319 |
-- |
-- |
-- |
-- |
-- |
|
|
[e] Decrease in |
|
|
|
|
|
|
|
|
[i]
Fixed Assets |
-- |
-- |
-- |
-- |
-- |
-- |
|
|
[ii] Other non-current Assets |
-- |
-- |
-- |
-- |
-- |
-- |
|
|
[f]
Others |
-- |
-- |
-- |
-- |
-- |
-- |
|
|
|
|
|
|
|
|
|
|
|
[g] Total |
8.934 |
1.772 |
1.799 |
1.681 |
1.710 |
1.816 |
|
|
|
|
|
|
|
|
|
|
2 |
USES |
|
|
|
|
|
|
|
|
[a]
Net Loss |
-- |
-- |
-- |
-- |
-- |
-- |
|
|
[b]
Decrease in Term Liabilities (Incl. Public deposits) |
-- |
0.660 |
0.660 |
0.660 |
0.660 |
0.165 |
|
|
[c]
Increase in |
|
|
|
|
|
|
|
|
[i] Fixed Assets |
6.152 |
-- |
-- |
-- |
-- |
-- |
|
|
[ii] Other non-current Assets |
-- |
-- |
-- |
-- |
-- |
-- |
|
|
[d]
Dividend Payments |
-- |
-- |
-- |
-- |
-- |
-- |
|
|
[e]
Others |
-- |
-- |
-- |
-- |
-- |
-- |
|
|
|
|
|
|
|
|
|
|
|
[f] Total |
6.152 |
0.660 |
0.660 |
0.660 |
0.660 |
0.165 |
|
|
|
|
|
|
|
|
|
|
3 |
Long
Term Surplus (+) /
Deficit (-) [1-2] |
2.782 |
1.112 |
1.139 |
1.021 |
1.050 |
1.651 |
|
|
|
|
|
|
|
|
|
|
4 |
Increase/
(Decrease) in current assets |
(2.647) |
(2.826) |
1.791 |
1.537 |
1.554 |
1.652 |
|
|
|
|
|
|
|
|
|
|
5 |
Increase/
(Decrease) in Current Liabilities other than Bank Borrowings |
(5.458) |
(13.938) |
0.652 |
0.516 |
0.504 |
0.001 |
|
|
|
|
|
|
|
|
|
|
6 |
Increase/
(Decrease) in Working Capital Gap |
2.811 |
11.112 |
1.139 |
1.021 |
1.050 |
1.651 |
|
|
|
|
|
|
|
|
|
|
7 |
Net Surplus (+)/ Deficit (-) [Difference of
3 and 6] |
(0.029) |
(10.000) |
-- |
-- |
-- |
-- |
|
|
|
|
|
|
|
|
|
|
8 |
Increase/
(Decrease) in Bank Borrowings |
0.029 |
10.000 |
-- |
-- |
-- |
-- |
|
|
|
|
|
|
|
|
|
|
|
Increase/ (Decrease) in Net Sales |
6.400 |
27.018 |
2.163 |
1.080 |
1.081 |
1.080 |
|
|
|
|
|
|
|
|
|
|
|
* Break up of (4) |
|
|
|
|
|
|
|
1 |
Increase/ (Decrease) in Raw material |
-- |
-- |
-- |
-- |
-- |
-- |
|
2 |
Increase/ (Decrease) in Stock in process |
-- |
-- |
-- |
-- |
-- |
-- |
|
3 |
Increase/ (Decrease) in finished goods |
(2.940) |
(4.278) |
(0.122) |
0.294 |
0.319 |
0.349 |
|
4 |
Increase/ (Decrease) in Receivables |
|
|
|
|
|
|
|
|
[a] Domestic |
(0.635) |
0.450 |
0.036 |
0.018 |
0.018 |
0.018 |
|
|
[b] Export |
-- |
-- |
-- |
-- |
-- |
-- |
|
5 |
Increase/ (Decrease) in stores & spares |
-- |
-- |
-- |
-- |
-- |
-- |
|
6 |
Increase/ (Decrease) in other Current
Assets |
0.928 |
1.002 |
1.877 |
1.225 |
1.217 |
1.285 |
------------------------------------------------------------------------------------------------------------------------------
COMPARATIVE STATEMENT OF CURRENT ASSETS
& CURRENT LIABILITIES
(RS. IN MILLION)
|
SR. NO. |
PARTICULARS |
2014-15 Estimates |
2015-16 Projection |
2016-17 Projection |
2017-18 Projection |
2018-19 Projection |
2019-20 Projection |
|
|
|
|
|
|
|
|
|
|
|
A. CURRENT ASSETS: |
|
|
|
|
|
|
|
1 |
Raw
Materials (including stores and other items in process of manufacture) |
|
|
|
|
|
|
|
|
(a)
Imported |
-- |
-- |
-- |
-- |
-- |
-- |
|
|
Months Consumption |
-- |
-- |
-- |
-- |
-- |
-- |
|
|
|
|
|
|
|
|
|
|
|
(b) Indigenous |
-- |
-- |
-- |
-- |
-- |
-- |
|
|
Months Consumption |
-- |
-- |
-- |
-- |
-- |
-- |
|
|
|
|
|
|
|
|
|
|
2 |
Other
Consumable Spares, excluding those included in 1 above |
|
|
|
|
|
|
|
|
(a)
Imported |
-- |
-- |
-- |
-- |
-- |
-- |
|
|
Months Consumption |
-- |
-- |
-- |
-- |
-- |
-- |
|
|
|
|
|
|
|
|
|
|
|
(b) Indigenous |
-- |
-- |
-- |
-- |
-- |
-- |
|
|
Months Consumption |
-- |
-- |
-- |
-- |
-- |
-- |
|
|
|
|
|
|
|
|
|
|
3 |
Stock-in-process |
-- |
-- |
-- |
-- |
-- |
-- |
|
|
Months Cost of Production |
-- |
-- |
-- |
-- |
-- |
-- |
|
|
|
|
|
|
|
|
|
|
4 |
Finished
Goods |
25.695 |
21.417 |
21.295 |
21.589 |
21.908 |
22.257 |
|
|
Months Cost of Sales |
4.05 |
2.68 |
2.68 |
2.68 |
2.68 |
2.68 |
|
|
|
|
|
|
|
|
|
|
5 |
Receivables
other than deferred & exports (incl. Bills purchased & discounted by
bankers) |
0.901 |
1.351 |
1.387 |
1.405 |
1.423 |
1.441 |
|
|
Months Domestic Sales excluding Deferred
Sales |
0.2 |
0.2 |
0.2 |
0.2 |
0.2 |
0.2 |
|
|
|
|
|
|
|
|
|
|
6 |
Export
Receivables (incl. Bills purchased & discounted by banks) |
-- |
-- |
-- |
-- |
-- |
-- |
|
|
Months Export Sales |
-- |
-- |
-- |
-- |
-- |
-- |
|
|
|
|
|
|
|
|
|
|
7 |
Advance
to suppliers of Raw materials & stores/spares |
-- |
-- |
-- |
-- |
-- |
-- |
|
|
|
|
|
|
|
|
|
|
8 |
Other
current assets including Cash and Bank Balances and Deferred Receivables due
within one year [Specify major items] |
-- |
-- |
-- |
-- |
-- |
-- |
|
|
Cash and Bank Balances |
1.027 |
1.973 |
1.198 |
0.906 |
1.120 |
1.909 |
|
|
Investments [Other than Long term
Investments] |
|
|
|
|
|
|
|
|
1. Government and Other Trustee Securities |
-- |
-- |
-- |
-- |
-- |
-- |
|
|
2. Fixed Deposits with Banks |
-- |
-- |
-- |
-- |
-- |
-- |
|
|
|
|
|
|
|
|
|
|
|
Investments of Deferred Receivables [Due
within one year] |
-- |
-- |
-- |
-- |
-- |
-- |
|
|
|
|
|
|
|
|
|
|
|
Advance Payment of Taxes |
-- |
-- |
-- |
-- |
-- |
-- |
|
|
Other Current Assets [Specify major items] |
|
|
|
|
|
|
|
|
Pre-paid Expenses |
0.207 |
0.263 |
0.415 |
0.432 |
0.435 |
0.431 |
|
|
Other Current Assets |
-- |
-- |
-- |
-- |
-- |
-- |
|
|
Misc. C/ Assets 2 |
-- |
-- |
-- |
-- |
-- |
-- |
|
|
Misc. C/ Assets 5 |
-- |
-- |
2.500 |
4.000 |
5.000 |
5.500 |
|
|
|
|
|
|
|
|
|
|
9 |
TOTAL CURRENT ASSETS [To agree
with item 34 in Form III] |
27.830 |
25.004 |
26.795 |
28.332 |
29.886 |
31.538 |
|
|
|
|
|
|
|
|
|
|
|
B. CURRENT LIABILITIES
|
|
|
|
|
|
|
|
|
(Other than bank
borrowings for working capital) |
|
|
|
|
|
|
|
10 |
Creditors for Purchase of Raw Materials,
Stores and Consumable Spares |
-- |
-- |
-- |
-- |
-- |
-- |
|
|
Months Purchase |
-- |
-- |
-- |
-- |
-- |
-- |
|
|
|
|
|
|
|
|
|
|
11 |
Advances from Customer |
-- |
-- |
-- |
-- |
-- |
-- |
|
|
|
|
|
|
|
|
|
|
12 |
Statutory Liabilities |
-- |
-- |
-- |
-- |
-- |
-- |
|
|
|
|
|
|
|
|
|
|
13 |
Other Current Liabilities [Specify major items] |
|
|
|
|
|
|
|
|
Short term borrowings from others |
-- |
-- |
-- |
-- |
-- |
-- |
|
|
Provision for taxation |
-- |
-- |
-- |
-- |
-- |
-- |
|
|
Dividend payable deposits/ Installments of Term
Loans/ DPGs/ Debentures etc. [Due within one year] |
0.954 |
0.660 |
0.660 |
0.660 |
0.660 |
0.165 |
|
|
Misc. Current Liabilities |
|
|
|
|
|
|
|
|
Accrued Expenses |
0.207 |
0.263 |
0.415 |
0.431 |
0.435 |
0.431 |
|
|
Statutory Liabilities |
-- |
-- |
-- |
-- |
-- |
-- |
|
|
Installment due within |
-- |
-- |
-- |
-- |
-- |
-- |
|
|
Misc. C/ Liability – 3 |
3.500 |
4.000 |
4.500 |
5.000 |
5.500 |
6.000 |
|
|
Misc. C/ Liability – 4 |
0.200 |
-- |
-- |
-- |
-- |
-- |
|
|
Creditors for RM |
14.000 |
-- |
-- |
-- |
-- |
-- |
|
|
|
|
|
|
|
|
|
|
|
TOTAL CURRENT LIABILITIES [To agree with
Sub-total B in Form III] |
18.861 |
4.923 |
5.575 |
6.091 |
6.595 |
6.596 |
------------------------------------------------------------------------------------------------------------------------------
COMPUTATION OF MAXIMUM PERMISSIBLE BANK
FINANCE FOR WORKING CAPITAL
(RS. IN MILLION)
|
SR. NO. |
PARTICULARS |
2014-15 Estimates |
2015-16 Projection |
2016-17 Projection |
2017-18 Projection |
2018-19 Projection |
2019-20 Projection |
|
|
|
|
|
|
|
|
|
|
|
FIRST METHOD OF LENDING |
|
|
|
|
|
|
|
1 |
Total
Current Assets (Form IV) |
27.830 |
25.004 |
26.795 |
28.332 |
29.886 |
31.538 |
|
|
|
|
|
|
|
|
|
|
2 |
Other
Current Liabilities (other than bank borrowings) (14 of Form IV) |
18.861 |
4.923 |
5.575 |
6.091 |
6.595 |
6.596 |
|
|
|
|
|
|
|
|
|
|
3 |
Working
Capital Gap (WCP) (1-2) |
9.923 |
20.741 |
21.880 |
22.901 |
23.951 |
25.107 |
|
|
|
|
|
|
|
|
|
|
4 |
Minimum
stipulated net working Capital - 25% of WCG/ total current assets other than
Export Receivables (as at 28(ii) of form III) |
2.481 |
5.185 |
5.470 |
5.725 |
5.988 |
6.277 |
|
|
|
|
|
|
|
|
|
|
5 |
Actual/Projected
net working capital (45 in form III) |
6.923 |
7.741 |
8.880 |
9.901 |
10.951 |
12.107 |
|
|
|
|
|
|
|
|
|
|
6 |
Item
3 minus item 4 |
7.442 |
15.556 |
16.410 |
17.176 |
17.963 |
18.830 |
|
|
|
|
|
|
|
|
|
|
7 |
Item
3 minus item 5 |
3.000 |
13.000 |
13.000 |
13.000 |
13.000 |
13.000 |
|
|
|
|
|
|
|
|
|
|
8 |
Maximum
permissible bank finance (item 6 or 7 whichever is less) |
3.000 |
13.000 |
13.000 |
13.000 |
13.000 |
13.000 |
|
|
|
|
|
|
|
|
|
|
9 |
Excess
borrowings, if any representing short fall in NWC (4-5) |
-- |
-- |
-- |
-- |
-- |
-- |
|
|
|
|
|
|
|
|
|
|
|
SECOND METHOD OF LENDING |
|
|
|
|
|
|
|
1 |
Total
Current Assets (Form IV) |
27.830 |
25.004 |
26.795 |
28.332 |
29.886 |
31.538 |
|
|
|
|
|
|
|
|
|
|
2 |
Other
Current Liabilities (other than bank borrowings) (14 of Form IV) |
18.861 |
4.923 |
5.575 |
6.091 |
6.595 |
6.596 |
|
|
|
|
|
|
|
|
|
|
3 |
Working
Capital Gap (WCP) (1-2) |
9.923 |
20.741 |
21.880 |
22.901 |
23.951 |
25.107 |
|
|
|
|
|
|
|
|
|
|
4 |
Minimum
stipulated net working Capital - 25% of WCG/ total current assets other than
Export Receivables (as at 28(ii) of form III) |
6.958 |
6.251 |
6.699 |
7.083 |
7.472 |
7.885 |
|
|
|
|
|
|
|
|
|
|
5 |
Actual/Projected
net working capital (45 in form III) |
6.923 |
7.741 |
8.880 |
9.901 |
10.951 |
12.107 |
|
|
|
|
|
|
|
|
|
|
6 |
Item
3 minus item 4 |
2.966 |
14.490 |
15.181 |
15.818 |
16.480 |
17.223 |
|
|
|
|
|
|
|
|
|
|
7 |
Item
3 minus item 5 |
3.000 |
13.000 |
13.000 |
13.000 |
13.000 |
13.000 |
|
|
|
|
|
|
|
|
|
|
8 |
Maximum
permissible bank finance (item 6 or 7 whichever is less) |
2.966 |
13.000 |
13.000 |
13.000 |
13.000 |
13.000 |
|
|
|
|
|
|
|
|
|
|
9 |
Excess
borrowings, if any representing short fall in NWC (4-5) |
0.035 |
-- |
-- |
-- |
-- |
-- |
------------------------------------------------------------------------------------------------------------------------------
NETWORTH STATEMENT
MR. ALTAMAS ALTAFHUSEN
SHAIKH
(RS. IN MILLION)
BANK
|
Bank |
Branch |
SB/ CD Account
No. |
Present Balance |
|
Bank of India |
Viramgam |
-- |
0.001 |
|
|
|
|
|
|
The Mehsana Urban Co-operative Bank Limited |
Viramgam |
221001002638 |
-- |
DETAILS
OF ASSETS
MOVABLE PROPERTY
INSURANCE POLICIES
|
Name of Company & Branch |
Policy No |
Date of issue |
Sum assured |
Annual premium |
Premium paid
upto what period |
|
|
|
|
|
|
|
|
ICICI Prudential Life Insurance |
18530420 |
27.03.2014 |
0.500 |
0.050 |
Ten Years |
CAPITAL INVESTED IN BUSINESS
|
Name of Firm/ Company |
31.12.2014 |
|
|
|
|
Waris Cotton |
0.486 |
LIABILITIES
AS GUARANTOR
|
Name of the person to whom Guaranteed |
Name of the
Bank/ Financial Institution |
Guarantee Amount |
Present Status
of Account |
Outstanding
Balance |
|
|
|
|
|
|
|
Waris Cotton |
VIMCO Bank |
4.590 |
STD |
4.206 |
------------------------------------------------------------------------------------------------------------------------------
NETWORTH STATEMENT
MR. NIYAZAHMED U. SHAIKH
(RS. IN MILLION)
BANK
|
Bank |
Branch |
SB/ CD Account
No. |
|
The Mehsana Urban Co-operative Bank Limited |
Viramgam |
537 |
|
|
|
|
|
Kotak Mahindra Bank Limited |
Viramgam |
375 |
DETAILS
OF ASSETS
IMMOVABLE PROPERTY
|
Assets |
Own / Joint name |
Area |
Free hold or
Lease hold |
Location/ address |
Purchase Cost |
Present Value |
Whether
encumbered (Give details) |
|
Non Agri. Land |
|
|
|
|
|
|
|
|
i. Commercial |
Own |
6028 Sq. Mt. |
Freehold |
S. No. 401/A,
Bhojwa, Mandal Road, Viramgam |
2.858 |
22.500 |
Yes with VIMCO |
|
ii. Residential |
-- |
-- |
-- |
-- |
-- |
-- |
-- |
|
Flat / House |
|
|
|
|
|
|
|
|
Agri. Land |
Joint |
8600 Sq. Mt. |
Freehold |
S. No. 1354,
Viramgam |
NA |
21.500 |
No |
|
Others |
-- |
-- |
-- |
-- |
-- |
-- |
-- |
JEWELLERY
|
Particulars |
Quantity |
Valuation
(Approx.) |
|
|
|
|
|
Gold |
1.5 |
0.150 |
CAPITAL INVESTED IN BUSINESS
|
Name of Firm/ Company |
31.12.2014 |
|
|
|
|
Waris Cotton |
2.555 |
LIABILITIES
AS GUARANTOR
|
Name of the person to whom Guaranteed |
Name of the
Bank/ Financial Institution |
Guarantee Amount |
Present Status
of Account |
Outstanding
Balance |
|
|
|
|
|
|
|
Waris Cotton |
VIMCO Bank |
4.500 |
STD |
4.206 |
LEGAL HEIRS / FAMILY PARTICULARS
|
Name |
Occupation |
Relation |
Age |
Marital Status |
Address |
|
Noman N. Shaikh |
Student |
Son |
18 |
Unmarried |
Viramgam, Ahmedabad, Gujarat, India |
|
|
|
|
|
|
|
|
Waris N. Shaikh |
Student |
Son |
16 |
Unmarried |
Viramgam, Ahmedabad, Gujarat, India |
------------------------------------------------------------------------------------------------------------------------------
NETWORTH STATEMENT
MR. ALTAFHUSEN SHAIKH
(RS. IN MILLION)
BANK
|
Bank |
Branch |
SB/ CD Account
No. |
Present Balance |
|
The Mehsana Urban Co-operative Bank Limited |
VGM Branch |
00221001002740 |
0.001 |
|
|
|
|
|
|
State Bank of India |
VGM Branch |
31753620788 |
-- |
DETAILS
OF ASSETS
IMMOVABLE PROPERTY
|
Assets |
Own / Joint name |
Area |
Free hold or Lease
hold |
Location/ address |
Purchase Cost |
Present Value |
Whether
encumbered (Give details) |
|
Non Agri. Land |
|
|
|
|
|
|
|
|
i. Commercial |
-- |
-- |
-- |
-- |
-- |
-- |
-- |
|
ii. Residential |
-- |
-- |
-- |
-- |
-- |
-- |
-- |
|
Flat / House |
|
|
|
|
|
|
|
|
Agri. Land |
Joint |
8600 Sq. Mt. |
Freehold |
S. No. 1354,
Viramgam, Ahmedabad, Gujarat, India |
NA |
21.500 |
No |
|
Others |
-- |
-- |
-- |
-- |
-- |
-- |
-- |
JEWELLERY
|
Particulars |
Quantity |
Valuation
(Approx.) |
|
|
|
|
|
Gold |
-- |
0.210 |
CAPITAL INVESTED IN BUSINESS
|
Name of Firm/ Company |
31.12.2014 |
|
|
|
|
Waris Cotton |
3.851 |
LIABILITIES
AS GUARANTOR
|
Name of the person to whom Guaranteed |
Name of the
Bank/ Financial Institution |
Guarantee Amount |
Present Status
of Account |
Outstanding
Balance |
|
|
|
|
|
|
|
Waris Cotton |
VIMCO Bank |
4.500 |
STD |
4.206 |
LEGAL HEIRS / FAMILY PARTICULARS
|
Name |
Occupation |
Relation |
Age |
Marital Status |
Address |
|
|
|
|
|
|
|
|
Altamas A. Shaikh |
Job |
Son |
23 |
Unmarried |
Viramgam, Ahmedabad, Gujarat, India |
------------------------------------------------------------------------------------------------------------------------------
NETWORTH STATEMENT
MR. IBRAHIMBHAI U. SHAIKH
(RS. IN MILLION)
BANK
|
Bank |
Branch |
SB/ CD Account
No. |
|
|
|
|
|
The Mehsana Urban Co-operative Bank Limited |
VGM |
221001002739 |
DETAILS
OF ASSETS
IMMOVABLE PROPERTY
|
Assets |
Own / Joint name |
Area |
Free hold or
Lease hold |
Location/ address |
Purchase Cost |
Present Value |
Whether
encumbered (Give details) |
|
Non Agri. Land |
|
|
|
|
|
|
|
|
i. Commercial |
-- |
-- |
-- |
-- |
-- |
-- |
-- |
|
ii. Residential |
-- |
-- |
-- |
-- |
-- |
-- |
-- |
|
Flat / House |
|
|
|
|
|
|
|
|
Agri. Land |
Joint |
8600 Sq. Mt. |
Freehold |
S. No. 1354,
Viramgam, Ahmedabad, Gujarat, India |
NA |
21.500 |
No |
|
Others |
-- |
-- |
-- |
-- |
-- |
-- |
-- |
VEHICLES
|
Type of Vehicle |
Cost at the time
of purchase |
Present Value |
|
|
|
|
|
Hero Passion |
0.044 |
0.025 |
JEWELLERY
|
Particulars |
Quantity |
Valuation
(Approx.) |
|
|
|
|
|
Gold |
-- |
0.200 |
CAPITAL INVESTED IN BUSINESS
|
Name of Firm/ Company |
31.12.2014 |
|
|
|
|
Waris Cotton |
2.658 |
LIABILITIES
AS GUARANTOR
|
Name of the person to whom Guaranteed |
Name of the
Bank/ Financial Institution |
Guarantee Amount |
Present Status
of Account |
Outstanding
Balance |
|
|
|
|
|
|
|
Waris Cotton |
VIMCO Bank |
4.500 |
STD |
4.206 |
LEGAL HEIRS / FAMILY PARTICULARS
|
Name |
Occupation |
Relation |
Age |
Marital Status |
Address |
|
Mohaddis I. Shaikh |
Business |
Son |
25 |
Unmarried |
Viramgam, Ahmedabad, Gujarat, India |
|
|
|
|
|
|
|
|
Parvej I. Shaikh |
Job and Study |
Son |
23 |
Unmarried |
Viramgam, Ahmedabad, Gujarat, India |
|
|
|
|
|
|
|
|
Kamil I. Shaikh |
Study |
Son |
17 |
Unmarried |
Viramgam, Ahmedabad, Gujarat, India |
------------------------------------------------------------------------------------------------------------------------------
VALUATION REPORT FOR SAINATH HOTEL
SUBJECT: Report of Valuation of Immovable Property on 20.02.2015,
R.S. No. 47, At Devpura, Ta. Vijapur, District Mehsana (N.G.), belonging to Soni
Kiritbhai Govindbhai and Patel Bharatbhai Shivabhai.
PART I
INTRODUCTION: Pursuant to the
Instruction received from Soni Kiritbhai Govindbhai, Inspected their Commercial
Property Situated as per above on dated 20.02.2015 with a view to report to
find out its market value for guarantor evidence in Loan Purpose.
GENERAL
|
Purpose for which Valuation is made |
To find out its market value for loan
purpose |
||||||||||||||||||||||||||||||||||||||||||||||||||||||||||||||||||||||||||||||
|
|
|
||||||||||||||||||||||||||||||||||||||||||||||||||||||||||||||||||||||||||||||
|
Name of Firm |
SAINATH HOTEL |
||||||||||||||||||||||||||||||||||||||||||||||||||||||||||||||||||||||||||||||
|
|
|
||||||||||||||||||||||||||||||||||||||||||||||||||||||||||||||||||||||||||||||
|
Date of Valuation |
20.02.2015 |
||||||||||||||||||||||||||||||||||||||||||||||||||||||||||||||||||||||||||||||
|
|
|
||||||||||||||||||||||||||||||||||||||||||||||||||||||||||||||||||||||||||||||
|
Name of Owner |
Soni Kiritbhai Govindbhai |
||||||||||||||||||||||||||||||||||||||||||||||||||||||||||||||||||||||||||||||
|
|
|
||||||||||||||||||||||||||||||||||||||||||||||||||||||||||||||||||||||||||||||
|
Year of Construction |
2007 |
||||||||||||||||||||||||||||||||||||||||||||||||||||||||||||||||||||||||||||||
|
|
|
||||||||||||||||||||||||||||||||||||||||||||||||||||||||||||||||||||||||||||||
|
LAND DETAILS This is a Non Agricultural Land Plot situated
R.S. No. 47, At Devpura, Ta. Vijapur, District Mehsana (N.G.). It is freehold
and its admeasuring is 5113.00 Sq. Mt. with plinth level and shape is
rectangular.
STRUCTURAL DETAILS The Structural of SAINATH HOTEL
having comprising of Dining Hall, Open Shed is describe as under: STRUCTURE DETAILS It is consist of brick load bearing structural
R.C.C. Slab Roofing and G.I. Sheet Roofing Supported by fabricated purlins
and truss is supported on brick wall internal smooth plaster work is
provided. Iron Doors Z Section windows ventilation kotastone flooring, I.P.S.
Flooring at open shed, well developed compound wall. Bath and WC is provided
well furnitured and oil paint rollings provided for opening.
COST OF STRUCTURE
NOTE:
|
|||||||||||||||||||||||||||||||||||||||||||||||||||||||||||||||||||||||||||||||
------------------------------------------------------------------------------------------------------------------------------
VALUATION REPORT OF PROPERTY BELONGING TO
BHARAT STEEL CORPORATION
|
Purpose for which valuation is made |
For fair market value of property |
||||||||
|
|
|
||||||||
|
Valuation done by |
Naresh K. Shah [Government Reg. Valuer] |
||||||||
|
|
|
||||||||
|
Date of Valuation is made |
2th September, 2013 |
||||||||
|
|
|
||||||||
|
The name of person in whose name property
stands registered |
BHARAT STEEL CORPORATION [Prop. Niyaz Ahmed Usmangani Shekh] |
||||||||
|
|
|
||||||||
|
Location and Situation of the property |
B/S No. 401/ Apaiki of Bholya, Viramgam, Ta-Viramgam,
District Ahmedabad |
||||||||
|
|
|
||||||||
|
Purpose of Valuation |
Loan Purpose |
||||||||
|
|
|
||||||||
|
Zone of the Property |
Industrial Zone |
||||||||
|
|
|
||||||||
|
Whether leasehold or freehold property |
Leasehold property |
||||||||
|
|
|
||||||||
|
Name of the Property |
“Warish Cotton” |
||||||||
|
|
|
||||||||
|
Area of the Land |
Total area = 2422.0 Sq. Mt. |
||||||||
|
|
|
||||||||
|
Value of the land |
6028.0 Sq. Mt. at 3500.0 Rs./ Sq. Mt. Value of Land = Rs. 21.098 Million |
||||||||
|
|
|
||||||||
|
Value of Construction |
R.C.C. WEIGHT BRIDGE ROOM 13.0 Sq. Mt. at 12000.0 Rs. / Sq. Mt. That gives Rs. = 0.156 Million OFFICE STORE, URINAL, W.C. 65.50 Sq. Mt. at 5000.0 Rs./ Sq. Mt. That gives Rs. = 0.328 Million (Load bearing, AC Roof) STORE ROOM 03 553.72 Sq. Mt. at 5000.0 Rs./ Sq. Mt. That gives Rs. = 2.769 Million (A.C. Roof) STORAGE PLATE FORM 80.0 Sq. Mt. at 1000.0 Rs./ Sq. Mt. That gives Rs. = 0.080 Million STORAGE ROOM 17.42 Sq. Mt. at 12000.0 Rs./ Sq. Mt. That gives Rs. = 0.209 Million (Load bearing, R.C.C. Slab) BATH 4.75 Sq. Mt. at 5000.0 Rs./ Sq. Mt. That gives Rs. = 0.024 Million PRESS BUILDING 176.40 Sq. Mt. at 6000.0 Rs./ Sq. Mt. That gives Rs. = 1.058 Million (GIC Roof Height 8.82) STORE ROOM 02, CLOCK ROOM 65.52 Sq. Mt. at 5000.0 Rs./ Sq. Mt. That gives Rs. = 0.328 Million STORE ROOM 03 92.44 Sq. Mt. at 5000.0 Rs./ Sq. Mt. That gives Rs. = 0.462 Million FACTORY SHED 478.40 Sq. Mt. at 6000.0 Rs./ Sq. Mt. That gives Rs. = 2.870 Million (GIC Roof) STORE 11.78 Sq. Mt. at 12000.0 Rs./ Sq. Mt. That gives Rs. = 0.141 Million (RCC Slab) STORE 10.60 Sq. Mt. at 5000.0 Rs./ Sq. Mt. That gives Rs. = 0.053 Million (GIC Roof) DUST COLLECTION 10.94 Sq. Mt. at 12000.0 Rs./ Sq. Mt. That gives Rs. = 0.131 Million (RCC Slab) UGW TANK 19000.0 Lt at 20 Rs. / Lt. That gives Rs. = 0.380 Million R.C.C.
FOUNDATION FOR CHARKHA That
L.S. Rs. = 1.000 Million R.C.C. FOUNDATION FOR That L.S. Rs. = 0.300 Million Value of Construction = Rs. 10.289 Million |
||||||||
|
|
|
||||||||
|
Year in which the property was constructed |
About Six (10.0) years old Construction |
||||||||
|
|
|
||||||||
|
Deduction for depreciation at 10% less of
the Construction value |
|
||||||||
|
|
|
||||||||
|
Total value of the property |
|
||||||||
|
|
|
||||||||
|
Please state the property used by the owner
or hired out |
By the Owner |
||||||||
|
|
|
||||||||
|
The expected life of the Property |
About 30 years in normal condition. |
||||||||
|
|
|
||||||||
|
Whether repairing is required or not |
Not |
------------------------------------------------------------------------------------------------------------------------------
TRADE REFERENCES
· Bharat Industries
· Bharat Steel Corporation
FIXED ASSETS
· Land and Building Construction
· Electric Fitting
· Machinery
CMT REPORT (Corruption, Money Laundering & Terrorism]
The Public Notice information has been collected from various sources
including but not limited to: The Courts,
1] INFORMATION ON
DESIGNATED PARTY
No records exist designating subject or any of its beneficial owners, controlling
shareholders or senior officers as terrorist or terrorist organization or whom
notice had been received that all financial transactions involving their assets
have been blocked or convicted, found guilty or against whom a judgement or
order had been entered in a proceedings for violating money-laundering,
anti-corruption or bribery or international economic or anti-terrorism sanction
laws or whose assets were seized, blocked, frozen or ordered forfeited for
violation of money laundering or international anti-terrorism laws.
2] Court Declaration :
No records exist to suggest that subject is
or was the subject of any formal or informal allegations, prosecutions or other
official proceeding for making any prohibited payments or other improper payments
to government officials for engaging in prohibited transactions or with
designated parties.
3] Asset Declaration :
No records exist to suggest that the property or assets of the subject
are derived from criminal conduct or a prohibited transaction.
4] Record on Financial
Crime :
Charges or conviction
registered against subject: None
5] Records on Violation of
Anti-Corruption Laws :
Charges or
investigation registered against subject: None
6] Records on Int’l Anti-Money
Laundering Laws/Standards :
Charges or
investigation registered against subject: None
7] Criminal Records
No
available information exist that suggest that subject or any of its principals have
been formally charged or convicted by a competent governmental authority for
any financial crime or under any formal investigation by a competent government
authority for any violation of anti-corruption laws or international anti-money
laundering laws or standard.
8] Affiliation with
Government :
No record
exists to suggest that any director or indirect owners, controlling
shareholders, director, officer or employee of the company is a government
official or a family member or close business associate of a Government
official.
9] Compensation Package :
Our market
survey revealed that the amount of compensation sought by the subject is fair
and reasonable and comparable to compensation paid to others for similar
services.
10] Press Report :
No press reports / filings exists on
the subject.
CORPORATE GOVERNANCE
MIRA INFORM as part of its Due Diligence do provide comments on
Corporate Governance to identify management and governance. These factors often
have been predictive and in some cases have created vulnerabilities to credit
deterioration.
Our Governance Assessment focuses principally on the interactions
between a company’s management, its Board of Directors, Shareholders and other
financial stakeholders.
CONTRAVENTION
Subject is not known to have contravened any existing local laws,
regulations or policies that prohibit, restrict or otherwise affect the terms
and conditions that could be included in the agreement with the subject.
FOREIGN EXCHANGE RATES
|
Currency |
Unit
|
Indian Rupees |
|
US Dollar |
1 |
Rs. 62.92 |
|
|
1 |
Rs. 93.57 |
|
Euro |
1 |
Rs. 67.34 |
INFORMATION DETAILS
|
Information
Gathered by : |
PPT |
|
|
|
|
Analysis Done by
: |
SUB |
|
|
|
|
Report Prepared
by : |
BVA |
SCORE & RATING EXPLANATIONS
|
SCORE FACTORS |
RANGE |
POINTS |
|
HISTORY |
1~10 |
4 |
|
PAID-UP CAPITAL |
1~10 |
4 |
|
OPERATING SCALE |
1~10 |
3 |
|
FINANCIAL CONDITION |
|
|
|
--BUSINESS SCALE |
1~10 |
5 |
|
--PROFITABILITY |
1~10 |
3 |
|
--LIQUIDITY |
1~10 |
3 |
|
--LEVERAGE |
1~10 |
3 |
|
--RESERVES |
1~10 |
3 |
|
--CREDIT LINES |
1~10 |
3 |
|
--MARGINS |
-5~5 |
-- |
|
DEMERIT POINTS |
|
|
|
--BANK CHARGES |
YES/NO |
YES |
|
--LITIGATION |
YES/NO |
NO |
|
--OTHER ADVERSE INFORMATION |
YES/NO |
NO |
|
MERIT POINTS |
|
|
|
--SOLE DISTRIBUTORSHIP |
YES/NO |
NO |
|
--EXPORT ACTIVITIES |
YES/NO |
NO |
|
--AFFILIATION |
YES/NO |
YES |
|
--LISTED |
YES/NO |
NO |
|
--OTHER MERIT FACTORS |
YES/NO |
YES |
|
DEFAULTER |
|
|
|
--RBI |
YES/NO |
NO |
|
--EPF |
YES/NO |
NO |
|
TOTAL |
|
31 |
This score serves as a reference to assess
SC’s credit risk and to set the amount of credit to be extended. It is
calculated from a composite of weighted scores obtained from each of the major
sections of this report. The assessed factors and their relative weights (as
indicated through %) are as follows:
Financial
condition (40%) Ownership
background (20%) Payment
record (10%)
Credit history
(10%) Market trend (10%) Operational size
(10%)
RATING EXPLANATIONS
|
RATING |
STATUS |
PROPOSED CREDIT LINE |
|
|
>86 |
Aaa |
Possesses an extremely sound financial base with the strongest
capability for timely payment of interest and principal sums |
Unlimited |
|
71-85 |
Aa |
Possesses adequate working capital. No caution needed for credit transaction.
It has above average (strong) capability for payment of interest and
principal sums |
Large |
|
56-70 |
A |
Financial & operational base are regarded healthy. General
unfavourable factors will not cause fatal effect. Satisfactory capability for
payment of interest and principal sums |
Fairly Large |
|
41-55 |
Ba |
Overall operation is considered normal. Capable to meet normal
commitments. |
Satisfactory |
|
26-40 |
B |
Capability to overcome financial difficulties seems comparatively below
average. |
Small |
|
11-25 |
Ca |
Adverse factors are apparent. Repayment of interest and principal sums
in default or expected to be in default upon maturity |
Limited with
full security |
|
<10 |
C |
Absolute credit risk exists. Caution needed to be exercised |
Credit not
recommended |
|
-- |
NB |
New Business |
-- |
This report is issued at your request without any
risk and responsibility on the part of MIRA INFORM PRIVATE LIMITED (MIPL) or
its officials.