MIRA INFORM REPORT
|
Report No. : |
318822 |
|
Report Date : |
23.04.2015 |
IDENTIFICATION DETAILS
|
Name : |
BHUSHAN STEEL LIMITED (w.e.f. 2007) |
|
|
|
|
Formerly Known
As : |
BHUSHAN STEEL AND STRIPS LIMITED |
|
|
|
|
Registered
Office : |
Bhushan Centre, Ground Floor, Hyatt Regency Complex, Bhikaji Cama
Place, New Delhi - 110066 |
|
Tel. No.: |
91-11-26462373 (5 Lines) / 42297777 / 42295555 / 39194000/ 71194000 |
|
|
|
|
Country : |
India |
|
|
|
|
Financials (as
on) : |
31.03.2014 |
|
|
|
|
Date of
Incorporation : |
07.01.1983 |
|
|
|
|
Com. Reg. No.: |
55-014942 |
|
|
|
|
Capital
Investment / Paid-up Capital : |
Rs.1490.248 Million |
|
|
|
|
CIN No.: [Company Identification
No.] |
L74899DL1983PLC014942 |
|
|
|
|
TAN No.: [Tax Deduction & Collection
Account No.] |
DELB07323B |
|
|
|
|
PAN No.: [Permanent Account No.] |
AAACB1247M |
|
|
|
|
Legal Form : |
A Public Limited Liability Company. The Company’s Shares are listed on
the Stock Exchanges. |
|
|
|
|
Line of Business
: |
Manufacturer and Distributor of Cold Rolled Steel Strips/Sheets/Coils
and Galvanized Cold Rolled Steel Strips/Sheets/Coils. |
|
|
|
|
No. of Employees
: |
10000 (Approximately) |
RATING & COMMENTS
|
MIRA’s Rating : |
Ca (18) |
|
RATING |
STATUS |
PROPOSED CREDIT LINE |
|
|
11-25 |
Ca |
Adverse factors are apparent. Repayment of interest and principal sums
in default or expected to be in default upon maturity |
Limited with
full security |
|
Status : |
Moderate |
|
|
|
|
Payment Behaviour : |
Slow and delayed |
|
|
|
|
Litigation : |
Exist |
|
|
|
|
Comments : |
Subject is one of the well-established leading player in the steel
industry having moderate track. The management has seen a deterioration in the company’s credit
profile characterized by decline in its net profitability and further
aggravated by slower than expected ramping up of operations of Orissa phase
II expansion project. Moreover, the management has reported a loss from its operations
during the October – December quarter as a result of the working capital
intensive operations along with the large debt funded project expansion due
to which the management has seen an increase in its external borrowings
during the year, which has further weakened the liquidity position. The ratings also take into consideration, the company’s vice chairman
and managing director Mr. Neeraj Singhal, has been named and arrested in a
bribery case registered by central bureau of Investigation (CBI) in relation
with extension of credit facilities by syndicate bank to the company midst of
a crisis in which the company has planned to garner around a sufficient sum
through monetising its assets to stay afloat and manage its debt commitments. However, Business is active. Payment terms are reported as slow and
delayed. In view of experience of the promoters and the company’s established track in the industry the subject can be considered for business dealings on a safe and secured trade terms and conditions. |
NOTES:
Any query related to this report can be made
on e-mail : infodept@mirainform.com
while quoting report number, name and date.
ECGC Country Risk Classification List – December 31, 2014
|
Country Name |
Previous Rating (30.09.2014) |
Current Rating (31.12.2014) |
|
India |
A1 |
A1 |
|
Risk Category |
ECGC
Classification |
|
Insignificant |
A1 |
|
Low |
A2 |
|
Moderate |
B1 |
|
High |
B2 |
|
Very High |
C1 |
|
Restricted |
C2 |
|
Off-credit |
D |
EXTERNAL AGENCY RATING
|
Rating Agency Name |
CARE |
|
Rating |
Non-convertible debenture (NCD) programme-I
= D |
|
Rating Explanation |
Default or are expected to be in default
soon. |
|
Date |
22.12.2014 |
RBI DEFAULTERS’ LIST STATUS
Subject’s name is not enlisted as a defaulter
in the publicly available RBI Defaulters’ list.
EPF (Employee Provident Fund) DEFAULTERS’ LIST STATUS
Subject’s name is not enlisted as a defaulter
in the publicly available EPF (Employee Provident Fund) Defaulters’ list as of
31-03-2014.
LOCATIONS
|
Registered/
Corporate Office 1 : |
Bhushan Centre, Ground Floor, Hyatt Regency Complex, Bhikaji Cama
Place, New Delhi - 110066,
India |
|
Tel. No.: |
91-11-26462373 (5 Lines) / 42297777 / 42295555 / 39194000/ 71194000 |
|
Fax No.: |
91-11-26478750 / 26415845/ 46518611 |
|
E-Mail : |
|
|
Website : |
|
|
|
|
|
Factory 1 and Marketing Office – Sahibabad : |
23, Site IV,
Sahibabad Industrial Area, Sahibabad, District |
|
Tel. No.: |
91-120-2770601-
04/ 3028000-09 |
|
Fax No.: |
91-120-2770509/
4100574 |
|
E-Mail : |
|
|
|
|
|
Corporate
Office 2 : |
F Block, 1st
Floor, International Trade Tower, Nehru Place, New Delhi – 110019, India |
|
|
|
|
Factory 2 : |
28/4, Site IV,
Sahibabad Industrial Area, Sahibabad, District |
|
|
|
|
Factory 3 : |
Village Nifran,
Savroli and Dehvali, Taluka – Khalapura, (Near Khopoli), District Raigad –
410 203, |
|
Tel. No.: |
91-2192-274146/
302000 |
|
Fax No.: |
91-2192-274294/
274354 |
|
E-Mail : |
|
|
|
|
|
Factory 4 : |
Narendra Pur, P O
Shibapur, Village Meramandali, District – Dhenkanal – 759 121, |
|
Tel. No. : |
91-6764-300000/
326443/ 325133/ 325857 |
|
Fax No.: |
91-11-66173997 |
|
E-mail : |
|
|
|
|
|
Branches : |
Located at: ·
Agra ·
Ahmedabad ·
Aurangabad ·
Bengaluru ·
Bhubaneshwar ·
Chandigarh ·
Chennai ·
Coimbatore ·
Dehradun ·
Delhi ·
Faridabad ·
Gurgaon ·
Guwahati ·
Haldwani ·
Hyderabad ·
Hosur ·
Indore ·
Jaipur ·
Jammu ·
Kullu ·
Kolkata ·
Kanpur ·
Ludhiana ·
Mandigovindgarh ·
Mumbai ·
Pilkhuwa (Hapur) ·
Pune ·
Parwanoo ·
Rishikesh ·
Varanasi |
DIRECTORS
As on 31.03.2014
|
Name : |
Mr. Brij Bhushan
Singal |
|
Designation : |
Chairman |
|
Address: |
W-29, Greater Kailash, Part-II, New Delhi-110046, |
|
Date of Birth/
Age: |
20.11.1936 |
|
Date of
Appointment: |
15.01.1987 |
|
|
|
|
Name : |
Mr. Neeraj Singal |
|
Designation : |
Vice Chairman and Managing Director |
|
Address: |
W-29, Greater Kailash, Part-II, New Delhi-110046, |
|
Date of Birth/
Age: |
23.04.1968 |
|
Qualification: |
Graduate |
|
Date of
Appointment: |
01.04.1992 |
|
|
|
|
Name : |
Mr. Nittin Johari |
|
Designation : |
Whole-time
Director [Finance] |
|
Qualification: |
M.Com, FCA |
|
Date of
Appointment: |
06.01.1995 |
|
|
|
|
Name : |
Mr. Rahul Sen Gupta |
|
Designation : |
Whole-time
Director [Technical] |
|
|
|
|
Name : |
Mr. P.K. Aggarwal |
|
Designation : |
Whole time Director [Commercial] |
|
|
|
|
Name : |
Mr. Mohan Lal |
|
Designation : |
Director |
|
Address: |
19-A, Udham Singh Nagar, |
|
|
|
|
Name : |
Mr. B B Tondon |
|
Designation : |
Director |
|
|
|
|
Name : |
Mr. V.K. Mehrotra |
|
Designation : |
Director |
|
|
|
|
Name : |
Mr. M. V. Surya
Narayana |
|
Designation : |
Director |
|
Address: |
12-2-417/A/11, Gudimalkapur,
Jaya Nagar, Hydedrabad - 500028, Andhra Pradesh, India |
|
Date of Birth/
Age: |
05.04.1946 |
|
Date of
Appointment: |
25.09.2010 |
|
|
|
|
Name : |
Mrs. Sunita
Sharma |
|
Designation : |
Nominee Director
of LIC |
KEY EXECUTIVES
|
Name : |
Mr. O. P. Davra |
|
Designation : |
Company Secretary |
|
|
|
|
Name : |
Ms. Neha |
|
Designation : |
Reception |
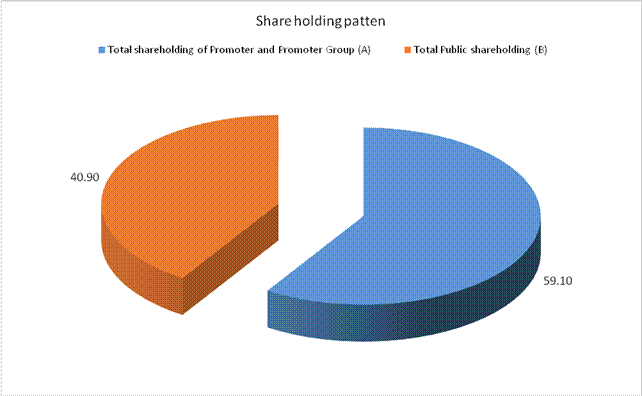
MAJOR SHAREHOLDERS / SHAREHOLDING PATTERN
As on 31.12.2014
|
Category of Shareholders |
No. of Shares |
Percentage of
Holding |
|
(A) Shareholding of Promoter
and Promoter Group |
|
|
|
|
|
|
|
|
101852018 |
44.96 |
|
|
32010805 |
14.13 |
|
|
133862823 |
59.10 |
|
|
|
|
|
Total shareholding of Promoter
and Promoter Group (A) |
133862823 |
59.10 |
|
(B) Public Shareholding |
|
|
|
|
|
|
|
|
5269 |
0.00 |
|
|
31300 |
0.01 |
|
|
9016484 |
3.98 |
|
|
3235202 |
1.43 |
|
|
12288255 |
5.42 |
|
|
|
|
|
|
63259193 |
27.93 |
|
|
|
|
|
|
10719293 |
4.73 |
|
|
4729930 |
2.09 |
|
|
1655252 |
0.73 |
|
|
319559 |
0.14 |
|
|
1171193 |
0.52 |
|
|
164500 |
0.07 |
|
|
80363668 |
35.48 |
|
Total Public shareholding (B) |
92651923 |
40.90 |
|
Total (A)+(B) |
226514746 |
100.00 |
|
(C) Shares held by Custodians
and against which Depository Receipts have been issued |
0 |
0.00 |
|
|
0 |
0.00 |
|
|
0 |
0.00 |
|
|
0 |
0.00 |
|
Total (A)+(B)+(C) |
226514746 |
0.00 |
BUSINESS DETAILS
|
Line of Business : |
Manufacturer and Distributor of Cold Rolled Steel Strips/Sheets/Coils
and Galvanized Cold Rolled Steel Strips/Sheets/Coils. |
||||||||
|
|
|
||||||||
|
Products : |
· Cold Rolled · Galvanised · Bhushan Galume · Colour Coated Coil · Colour Coated Tiles · Drawn Tubes of OEM Grade · Hardened and Tempered Strip · High Tensile Steel Stripping · Wire Rods and Alloy Billets · Sponge Iron |
||||||||
|
|
|
||||||||
|
Brand Names : |
Not Available |
||||||||
|
|
|
||||||||
|
Agencies Held : |
Not Available |
||||||||
|
|
|
||||||||
|
Exports : |
Not Available |
||||||||
|
|
|
||||||||
|
Imports : |
Not Available |
||||||||
|
|
|
||||||||
|
Terms : |
Not Available |
GENERAL INFORMATION
|
Suppliers : |
|
|||||||||||||||||||||||||||||||||||||||||||||||||||||||||||||||||||||||||||||
|
|
|
|||||||||||||||||||||||||||||||||||||||||||||||||||||||||||||||||||||||||||||
|
Customers |
|
|||||||||||||||||||||||||||||||||||||||||||||||||||||||||||||||||||||||||||||
|
|
|
|||||||||||||||||||||||||||||||||||||||||||||||||||||||||||||||||||||||||||||
|
No. of Employees : |
10,000 (Approximately) |
|||||||||||||||||||||||||||||||||||||||||||||||||||||||||||||||||||||||||||||
|
|
|
|||||||||||||||||||||||||||||||||||||||||||||||||||||||||||||||||||||||||||||
|
Bankers : |
· State Bank of India ·
Punjab National Bank ·
The Saraswat Co-Operative Bank Limited ·
Small Industries Development Bank of India ·
Axis Bank Limited ·
Punjab and Sind Bank ·
Export-Import Bank of India ·
Yes Bank Limited IDBI Bank Limited ·
Bank of Maharashtra |
|||||||||||||||||||||||||||||||||||||||||||||||||||||||||||||||||||||||||||||
|
|
|
|||||||||||||||||||||||||||||||||||||||||||||||||||||||||||||||||||||||||||||
|
Facilities : |
|
|||||||||||||||||||||||||||||||||||||||||||||||||||||||||||||||||||||||||||||
|
|
|
|
Financial Institution: |
SREI Equipment Finance Limited, 'Vishwakarma', 86C, Topsia
Road, Kolkata - 700046, West Bengal, India |
|
|
|
|
Auditors : |
|
|
Name : |
Mehra Goel and Company Chartered
Accountants |
|
|
|
|
Joint Venture
(31.03.2014): |
Andal East Coal Company Private Limited |
|
|
|
|
Associates
(31.03.2014): |
Angul Sukinda Railway Limited Bhusahan Energy Limited Bhushan Capital and Credit Services Private Limited (from 30.09.2013) Jawahar Credit and Holdings Private Limited (from 30.09.2013) |
|
|
|
|
Subsidiary
companies (31.03.2014): |
|
|
|
|
|
Enterprises over
which Key Management Personnel and their relatives are able to exercise
significant influence (31.03.2014): |
|
CAPITAL STRUCTURE
After as on:
20.09.2014
Authorized Capital: Rs. 2750.000
Million
Issued, Subscribed & Paid-up Capital: Rs.1755.147 Million
As on 31.03.2014
Authorized Capital :
|
No. of Shares |
Type |
Value |
Amount |
|
400000000 |
Equity Shares |
Rs.2/- each |
Rs.800.000 Million |
|
14500000 |
Preference Shares |
Rs.100/- each |
Rs.1450.000Million |
|
|
Total |
|
Rs.
2250.000 Million |
Issued Capital :
|
No. of Shares |
Type |
Value |
Amount |
|
230605220 |
Equity Shares |
Rs. 2/- each |
Rs.461.210 Million |
|
8235433 |
10% Redeemable Cumulative Preference Shares |
Rs. 100/- each |
Rs. 823.543 Million |
|
3,36,751 |
4% Non-convertible Cumulative Redeemable Preference Shares |
Rs. 100/- each |
Rs. 33.675 Million |
|
4,00,000 |
25% Non-convertible Cumulative Redeemable Preference Shares |
Rs. 100/- each |
Rs.40.000 Million |
|
1400000 |
2% Non-Convertible Cumulative Redeemable Preference Shares of `100/- each |
Rs. 100/- each |
Rs.1400.000 Million |
|
|
Total |
|
Rs. 1498.428 Million |
Subscribed and
Paid-up Capital:
|
No. of Shares |
Type |
Value |
Amount |
|
22,65,14,746 |
Equity Shares |
Rs. 2/- each |
Rs.453.029 Million |
|
|
Add: Shares forfeited |
|
Rs. 0.001 Million |
|
8235433 |
10% Redeemable Cumulative Preference Shares |
Rs. 100/- each |
Rs. 823.543 Million |
|
3,36,751 |
4% Non-convertible Cumulative Redeemable Preference Shares |
Rs. 100/- each |
Rs. 33.675 Million |
|
4,00,000 |
25% Non-convertible Cumulative Redeemable Preference Shares |
Rs. 100/- each |
Rs.40.000 Million |
|
1400000 |
2% Non-Convertible Cumulative Redeemable Preference Shares of `100/- each |
Rs. 100/- each |
Rs.1400.000 Million |
|
|
Total |
|
Rs. 1490.248 Million |
Detail of
Shareholders holding more than 5% shares:
|
Name of
Shareholders |
As at 31st March,2014 |
|
|
|
No. of Shares |
% Held |
|
(A) Equity Shareholders |
|
|
|
1. Brij Bhushan Singal |
45628672 |
20.14 |
|
2. Neeraj Singal |
73105933 |
32.27 |
|
3. Bhushan Infrastructure Private Limited |
32431540 |
14.32 |
|
(B) Preference Shareholders |
|
|
|
1. Bhushan Energy Limited |
- |
- |
|
2. Bhushan Finance Limited |
840000 |
8.10 |
|
3. Robust Transportation Limited |
531567 |
5.12 |
|
4. Shri Neeraj Singal |
2491133 |
24.02 |
|
5. Brij Bhushan Singal |
920433 |
8.87 |
|
Particulars |
As at 31st March,2014 |
|
|
No. of Shares |
Amount (Rs. In
Million |
|
|
Reconciliation of
number of shares outstanding is set out |
|
|
|
below: |
|
|
|
(A) Equity Shares |
|
|
|
At the beginning of the year |
226515530 |
424.717 |
|
Add : Shares Issued |
- |
14.157 |
|
Less: Shares forfeited |
784 |
-- |
|
At the end of the year |
226514746 |
438.874 |
|
(B) Preference
Shares (Non-Convertible Cumulative Redeemable Preference Shares) |
|
|
|
10% Preference
Shares |
|
|
|
At the beginning of the year |
9405367 |
779.527 |
|
Add : Shares Issued |
723400 |
161.010 |
|
Less: Shares Redeemed |
1893334 |
-- |
|
At the end of the year |
8235433 |
940.537 |
|
4% Preference
Shares |
|
|
|
At the beginning of the year |
354000 |
39.900 |
|
Add : Shares Issued |
-- |
-- |
|
Less: Shares Redeemed |
17249 |
4.500 |
|
At the end of the year |
336751 |
35.400 |
|
25% Preference
Shares |
|
|
|
At the beginning of the year |
400000 |
40.000 |
|
Add : Shares Issued |
-- |
-- |
|
Less: Shares Redeemed |
-- |
-- |
|
At the end of the year |
400000 |
40.000 |
|
2% Preference Shares |
|
|
|
At the beginning of the year |
- |
- |
|
Add : Shares Issued |
1400000 |
140.000 |
|
Less: Shares Redeemed |
-- |
-- |
|
At the end of the year |
1400000 |
140.000 |
The holders of Equity Shares has one vote for each equity share held by them. The registered holders of Equity Shares are entitled to dividend declared from time to time. The Preference Shareholders are entitled to pro-rata dividend in preference over Equity Shareholders. The dividend is cumulative at the rate specified against each category.
The premium on redemption of preference shares to the extent of premium received on issue will be adjusted against the security premium account and any premium paid over the above said amount shall be paid out of current appropriation / General Reserve.
FINANCIAL DATA
[all figures are
in Rupees Million]
ABRIDGED BALANCE
SHEET
|
SOURCES
OF FUNDS |
31.03.2014 |
31.03.2013 |
31.03.2012 |
|
|
|
|
|
|
I.
EQUITY AND LIABILITIES |
|
|
|
|
(1)Shareholders' Funds |
|
|
|
|
(a) Share Capital |
1490.248 |
1454.811 |
1284.144 |
|
(b) Reserves & Surplus |
90041.038 |
89026.194 |
72679.500 |
|
(c) Money received against
share warrants |
0.000 |
0.000 |
0.000 |
|
|
|
|
|
|
(2) Share Application money
pending allotment |
0.000 |
0.000 |
3830.100 |
|
Total
Shareholders’ Funds (1) + (2) |
91531.286 |
90481.005 |
77793.744 |
|
|
|
|
|
|
(3) Non-Current Liabilities |
|
|
|
|
(a) long-term borrowings |
255661.017 |
216642.128 |
155287.802 |
|
(b) Deferred tax liabilities
(Net) |
13751.925 |
13427.818 |
10388.183 |
|
(c) Other long term
liabilities |
21616.310 |
21794.561 |
15058.998 |
|
(d) long-term provisions |
0.000 |
0.000 |
0.000 |
|
Total
Non-current Liabilities (3) |
291029.252 |
251864.507 |
180734.983 |
|
|
|
|
|
|
(4) Current Liabilities |
|
|
|
|
(a) Short term borrowings |
62730.742 |
52328.639 |
42877.823 |
|
(b) Trade payables |
23508.729 |
16170.235 |
9931.250 |
|
(c) Other current liabilities |
41379.861 |
21011.854 |
22622.509 |
|
(d) Short-term provisions |
427.572 |
759.843 |
548.366 |
|
Total
Current Liabilities (4) |
128046.904 |
90270.571 |
75979.948 |
|
|
|
|
|
|
TOTAL |
510607.442 |
432616.083 |
334508.675 |
|
|
|
|
|
|
II.
ASSETS |
|
|
|
|
(1) Non-current assets |
|
|
|
|
(a) Fixed Assets |
|
|
|
|
(i) Tangible assets |
218713.565 |
181415.523 |
157327.164 |
|
(ii) Intangible Assets |
9.040 |
11.584 |
11.801 |
|
(iii) Capital work-in-progress |
163182.620 |
125953.132 |
90686.743 |
|
(iv) Intangible assets under
development |
0.000 |
0.000 |
0.000 |
|
(b) Non-current Investments |
6232.415 |
4024.554 |
3047.026 |
|
(c) Deferred tax assets (net) |
17939.360 |
0.000 |
0.000 |
|
(d) Long-term Loan and Advances |
0.000 |
24959.380 |
28260.352 |
|
(e) Other Non-current assets |
0.000 |
214.014 |
193.754 |
|
Total
Non-Current Assets |
406077.000 |
336578.187 |
279526.840 |
|
|
|
|
|
|
(2) Current assets |
|
|
|
|
(a) Current investments |
0.000 |
247.500 |
247.500 |
|
(b) Inventories |
64802.492 |
55596.755 |
33114.261 |
|
(c) Trade receivables |
24644.492 |
23430.872 |
12203.763 |
|
(d) Cash and cash equivalents |
829.596 |
1536.256 |
3349.803 |
|
(e) Short-term loans and
advances |
14244.258 |
15226.513 |
6066.508 |
|
(f) Other current assets |
9.604 |
0.000 |
0.000 |
|
Total
Current Assets |
104530.442 |
96037.896 |
54981.835 |
|
|
|
|
|
|
TOTAL |
510607.442 |
432616.083 |
334508.675 |
PROFIT & LOSS
ACCOUNT
|
|
PARTICULARS |
31.03.2014 |
31.03.2013 |
31.03.2012 |
|
|
SALES |
|
|
|
|
|
Income |
96758.331 |
107442.697 |
99414.077 |
|
|
Other Income |
291.120 |
173.359 |
273.442 |
|
|
TOTAL
(A) |
97049.451 |
107616.056 |
99687.519 |
|
|
|
|
|
|
|
Less |
EXPENSES |
|
|
|
|
|
Cost of Materials Consumed |
51893.933 |
57986.415 |
55067.473 |
|
|
Purchases of Stock-in-Trade |
390.520 |
811.855 |
0.000 |
|
|
Changes in inventories of
finished goods, work-in-progress and Stock-in-Trade |
(213.802) |
(1058.367) |
(653.307) |
|
|
Employees benefits expense |
1885.271 |
1734.541 |
1439.797 |
|
|
Other expenses |
15867.586 |
14818.588 |
13519.329 |
|
|
TOTAL
(B) |
69823.508 |
74293.032 |
69373.292 |
|
|
|
|
|
|
|
PROFIT/
(LOSS) BEFORE INTEREST, TAX,
DEPRECIATION AND AMORTISATION (C) |
27225.943 |
33323.024 |
30314.227 |
|
|
|
|
|
|
|
|
Less |
FINANCIAL
EXPENSES (D) |
16632.959 |
12874.431 |
10462.673 |
|
|
|
|
|
|
|
|
PROFIT
/ (LOSS) BEFORE TAX, DEPRECIATION AND AMORTISATION (C-D) (E) |
10592.984 |
20448.593 |
19851.554 |
|
|
|
|
|
|
|
Less |
DEPRECIATION/
AMORTISATION (F) |
9639.641 |
8308.619 |
6199.295 |
|
|
|
|
|
|
|
|
PROFIT/
(LOSS) BEFORE TAX (E-F) (G) |
953.343 |
12139.974 |
13652.259 |
|
|
|
|
|
|
|
Less |
TAX
(I) |
333.747 |
3051.071 |
3417.51 |
|
|
|
|
|
|
|
|
PROFIT/
(LOSS) AFTER TAX (G-I)
(J) |
619.596 |
9088.903 |
10234.749 |
|
|
|
|
|
|
|
Add |
PREVIOUS
YEARS’ BALANCE BROUGHT FORWARD |
217.632 |
89.309 |
37.769 |
|
|
|
|
|
|
|
Less |
APPROPRIATIONS |
|
|
|
|
|
Proposed Dividend on Equity
Shares |
113.257 |
113.258 |
106.179 |
|
|
Proposed Dividend on
Preference Shares |
77.799 |
1.148 |
0.407 |
|
|
Provision for Dividend Tax |
32.470 |
19.443 |
17.291 |
|
|
Interim Dividend on Preference
Shares |
22.469 |
89.547 |
75.050 |
|
|
Dividend Tax on Interim
Dividend |
3.819 |
14.527 |
12.193 |
|
|
Transferred to Capital
Redemption Reserve |
69.334 |
0.000 |
0.000 |
|
|
Transferred to Debenture Redemption Reserve |
320.000 |
2696.250 |
847.500 |
|
|
Transfer to General Reserve |
70.000 |
6000.000 |
9000.000 |
|
|
Premium paid on Redemption of Preference Shares |
16.806 |
26.407 |
124.589 |
|
|
|
|
|
|
|
|
Balance
Carried to the B/S (J+K+L-M) |
111.274 |
217.632 |
89.309 |
|
|
|
|
|
|
|
|
EARNINGS
IN FOREIGN CURRENCY |
|
|
|
|
|
FOB Value of Export |
19009.564 |
18128.945 |
14553.645 |
|
|
Interest Received |
0.000 |
1.862 |
14.816 |
|
|
TOTAL
EARNINGS |
19009.564 |
18130.807 |
14568.461 |
|
|
|
|
|
|
|
|
IMPORTS |
|
|
|
|
|
Raw Materials |
18757.762 |
16794.751 |
14937.369 |
|
|
Stores & Spares |
6258.346 |
1219.888 |
599.81 |
|
|
Capital Goods |
1355.351 |
12426.676 |
19137.965 |
|
|
TOTAL
IMPORTS |
26371.459 |
30441.315 |
34675.144 |
|
|
|
|
|
|
|
|
Earnings
/ (Loss) Per Share (Rs.) |
2.23 |
41.61 |
47.78 |
KEY RATIOS
|
PARTICULARS |
|
31.03.2014 |
31.03.2013 |
31.03.2012 |
|
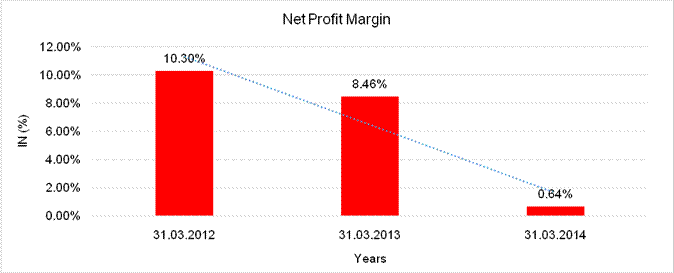
Net Profit Margin (PAT / Sales) |
(%) |
0.64 |
8.46 |
10.30 |
|
|
|
|
|
|
|
Operating Profit Margin (PBIDT/Sales) |
(%) |
28.14 |
31.01 |
30.49 |
|
|
|
|
|
|
|
Return on Total Assets (PBT/Total Assets} |
(%) |
0.29 |
4.01 |
5.67 |
|
|
|
|
|
|
|
Return on Investment (ROI) (PBT/Networth) |
|
0.01 |
0.13 |
0.18 |
|
|
|
|
|
|
|
Debt Equity Ratio (Total Debt /Networth) |
|
3.48 |
2.97 |
2.55 |
|
|
|
|
|
|
|
Current Ratio (Current Asset/Current Liability) |
|
0.82 |
1.06 |
0.72 |
FINANCIAL ANALYSIS
[all figures are
in Rupees Million]
DEBT EQUITY RATIO
|
Particular |
31.03.2012 |
31.03.2013 |
31.03.2014 |
|
|
(Rs.
In Million) |
(Rs.
In Million) |
(Rs.
In Million) |
|
Share Capital |
1284.144 |
1454.811 |
1490.248 |
|
Reserves & Surplus |
72679.500 |
89026.194 |
90041.038 |
|
Share Application money pending allotment |
3830.100 |
0.000 |
0.000 |
|
Net
worth |
77793.744 |
90481.005 |
91531.286 |
|
|
|
|
|
|
long-term borrowings |
155287.802 |
216642.128 |
255661.017 |
|
Short term borrowings |
42877.823 |
52328.639 |
62730.742 |
|
Total
borrowings |
198165.625 |
268970.767 |
318391.759 |
|
Debt/Equity
ratio |
2.547 |
2.973 |
3.479 |

YEAR-ON-YEAR GROWTH
|
Year
on Year Growth |
31.03.2012 |
31.03.2013 |
31.03.2014 |
|
|
(Rs.
In Million) |
(Rs.
In Million) |
(Rs.
In Million) |
|
Sales |
99414.077 |
107442.697 |
96758.331 |
|
|
|
8.076 |
(9.944) |

NET PROFIT MARGIN
|
Net
Profit Margin |
31.03.2012 |
31.03.2013 |
31.03.2014 |
|
|
(Rs.
In Million) |
(Rs.
In Million) |
(Rs.
In Million) |
|
Sales |
99414.077 |
107442.697 |
96758.331 |
|
Profit |
10234.749 |
9088.903 |
619.596 |
|
|
10.30% |
8.46% |
0.64% |
LOCAL AGENCY FURTHER INFORMATION
|
Sr. No. |
Check List by Info Agents |
Available in
Report (Yes / No) |
|
1] |
Year of Establishment |
Yes |
|
2] |
Locality of the firm |
Yes |
|
3] |
Constitutions of the firm |
Yes |
|
4] |
Premises details |
No |
|
5] |
Type of Business |
Yes |
|
6] |
Line of Business |
Yes |
|
7] |
Promoter's background |
Yes |
|
8] |
No. of employees |
Yes |
|
9] |
Name of person contacted |
No |
|
10] |
Designation of contact
person |
No |
|
11] |
Turnover of firm for last
three years |
Yes |
|
12] |
Profitability for last
three years |
Yes |
|
13] |
Reasons for variation
<> 20% |
-- |
|
14] |
Estimation for coming
financial year |
No |
|
15] |
Capital in the business |
Yes |
|
16] |
Details of sister
concerns |
Yes |
|
17] |
Major suppliers |
No |
|
18] |
Major customers |
Yes |
|
19] |
Payments terms |
Yes |
|
20] |
Export / Import details
(if applicable) |
No |
|
21] |
Market information |
-- |
|
22] |
Litigations that the firm
/ promoter involved in |
Yes |
|
23] |
Banking Details |
Yes |
|
24] |
Banking facility details |
Yes |
|
25] |
Conduct of the banking
account |
-- |
|
26] |
Buyer visit details |
-- |
|
27] |
Financials, if provided |
Yes |
|
28] |
Incorporation details, if
applicable |
Yes |
|
29] |
Last accounts filed at
ROC |
Yes |
|
30] |
Major Shareholders, if
available |
Yes |
|
31] |
Date of Birth of
Proprietor/Partner/Director, if available |
Yes |
|
32] |
PAN of
Proprietor/Partner/Director, if available |
No |
|
33] |
Voter ID No of
Proprietor/Partner/Director, if available |
No |
|
34] |
External Agency Rating,
if available |
Yes |
LITIGATION
DETAILS
|
IN THE HIGH COURT OF DELHI AT NEW DELHI
Re-notify on 23rd March, 2015 MARCH 18, 2015 COURT MASTER |
NOTE: Registered office of the company has been shifted from F Block, 1st Floor, International Trade Tower, Nehru Place, New Delhi – 110019, India, to the present
UNSECURED LOAN
|
PARTICULARS |
31.03.2014 (Rs.
In Million) |
31.03.2013 (Rs.
In Million) |
|
LONG TERM BORROWINGS |
|
|
|
Term Loan |
|
|
|
Foreign Currency Loans |
|
|
|
From Indian Banks |
0.000 |
1791.900 |
|
From Foreign Banks |
32.200 |
4234.735 |
|
From Others |
330.821 |
84.711 |
|
Less: current maturity of Long Term Borrowing |
(33849.697) |
(16263.148) |
|
|
|
|
|
SHORT TERM BORROWINGS |
|
|
|
From Bank |
|
|
|
Rupee Loan |
|
|
|
Term Loan / Commercial Paper |
1382.000 |
6803.175 |
|
Foreign Currency
Loans |
|
|
|
From Indian Banks |
0.000 |
1286.749 |
|
|
|
|
|
Total |
(32104.676) |
(2061.878) |
GROSS REVENUE AND
EXPORTS:
During the year the Company has achieved the Gross sales of Rs. 106000.000 Million in comparison of previous year’s level of Rs. 118000.000 Million.
Further the company has achieved the Export Turnover of Rs. 190.100 Million, registering a growth of 4.85 % over previous year’s level of Rs. 18130.000 Million.
EXPORT &
MARKETING
Their products are being exported across the globe and with a firm commitment and through sustained efforts, Million company continues to maintain good rapport with Global Customers. Our quality products and timely delivery have found wide acceptance in the highly competitive international market. The company is marketing its products through in-house marketing department as well as through trading houses / agents world-wide. The company has also established an office in Dubai for covering the markets of Middle East, Sudan & Ethopia etc. Timely delivery of quality material has been our strength and on that basis we have been getting repeat business with our many customers for last so many years.
PROJECTS UNDER
IMPLEMENTATION
The company is implementing various projects at Integrated Steel Plant at Orissa to augment steelmaking capacity, to augment availability of Coke, Washed Coal & Captive Power, to optimize cost and to comply with regulations. Details of these projects are given below:
Capacity Expansion
Projects
i. Debottlenecking of the HR Facility to increase HR capacity by 0.5 MTPA to 4.9 MTPA. This project is expected to be commissioned in FY 2015
ii. Implementation of 0.35 MTPA Culled Rolling cum Electrical Steel Complex at an estimated project cost of ` 1563 Million. The facility is expected to be complete by July 2015.
iii. Completion of Coke oven plant (1.3 MTPA), Coal Washery (2.5 MTPA), 2 DRI Kilns (aggregate capacity of 0.34 MTPA) and 197 MW Power Plant. Efficiency, Cost Reduction & Environmental Compliance Initiatives
iv. Addition, Modifications and Replacement (AMR) Scheme Project at Orissa to stabilize operation by optimizing logistics and energy conservation and to comply with environmental guidelines. The estimated project cost is ` 3892 Million and the project is expected to be completed by March 2015.
FINANCE
During the year the Company has faced multiple challenges due to suppressed economic conditions and delay in stabilizing Phase III operations due to unfortunate accident. On account of these challenges, the Long Term Credit Rating of the Company was also down-graded to Care BB (Double BB) and Short Term Credit Rating was downgraded to CARE A4 (A Four). Despite these challenges, Million company’s bankers have demonstrated continued confidence on the company and during the year following major credit facilities were extended:
1. Corporate loan of Rs. 42000.000 Million for shoring up of Net Working Capital/ normal capex requirements of the company. The company has tied up corporate loan of Rs. 35750.000 Million out of Rs. 42000.000 Million from 14 banks and the tie up for the balance amount is in process.
Term Loan of Rs. 27000.000 Million for Addition, Modifications and Replacement (AMR) Scheme Project at Orissa. The company has tied up the term loan of Rs. 15600.000 Million out of term loan of Rs. 27000.000 Million from 8 banks and the tie up for the balance amount is in process.
Term Loan of Rs. 27000.000 Million for Addition, Modifications and Replacement (AMR) Scheme Project at Orissa. The company has tied up the term loan of Rs. 156.000 Million out of term loan of Rs. 27000.000 Million from 8 banks and the tie up for the balance amount is in process.
MANAGEMENT DISCUSSION
AND ANALYSIS:
GLOBAL ECONOMY
Global activity has broadly strengthened and is expected to improve further in 2014–15, with much of the impetus coming from advanced economies. Activity in many emerging market economies has disappointed in a less favorable external financial environment, although they continue to contribute more than two-thirds of global growth. Their output growth is expected to be lifted by stronger exports to advanced economies. In this setting, downside risks identified in previous World Economic Outlook reports have diminished somewhat. There are three caveats: emerging market risks have increased, there are risks to activity from lower-than expected inflation in advanced economies, and geopolitical risks have resurfaced. Overall, the balance of risks, while improved, remains on the downside.
Looking ahead, global growth is projected to strengthen from 3 percent in 2013 to 3.6 percent in 2014 and 3.9 percent in 2015. In advanced economies, growth is expected to increase to about 2¼ percent in 2014– 15, an improvement of about 1 percentage point compared with 2013. Growth will be strongest in the United States at about 2¾ percent. Growth is projected to be positive but varied in the euro area: stronger in the core, but weaker in countries with high debt and financial fragmentation. In emerging market and developing economies, growth is projected to pick up gradually from 4.7 percent in 2013 to about 5 percent in 2014 and 5¼ percent in 2015. Growth will be helped by stronger external demand from advanced economies, but tighter financial conditions will dampen domestic demand growth. In China, growth is projected to remain at about 7½ percent in 2014 as the authorities seek to rein in credit and advance reforms while ensuring a gradual transition to a more balanced and sustainable growth path and in India GDP growth is projected to strengthen to 5.4.
Growth in emerging market economies is projected to pick up only modestly. These economies are adjusting to a more difficult external financial environment in which international investors are more sensitive to policy weakness and vulnerabilities given prospects for better growth and monetary policy normalization in some advanced economies. India may emerge favourable on policy front with a stable central government expected after General Election 2014.
INDIAN ECONOMY
After achieving unprecedented growth of over 9 per cent for three successive years between 2005-06 and 2007-08 and recovering swiftly from the global financial crisis of 2008-09, the Indian economy has been going through challenging times that culminated in lower than 5 per cent growth of GDP at factor cost at constant prices for two consecutive years, i.e. 2012-13 and 2013-14. Sub-5 per cent GDP growth for two years in succession was last witnessed a quarter of a century ago in 1986-87 and 1987-88. Persistent uncertainty in the global outlook, caused by the crisis in the Euro area and general slowdown in the global economy, compounded by domestic structural constraints and inflationary pressures, resulted in a protracted slowdown. The slowdown is broadly in sync with trends in other emerging economies, but relatively deeper. India’s growth declined from an average of 8.3 per cent per annum during 2004-05 to 2011-12 to an average of 4.6 per cent in 2012-13 and 2013-14. Average growth in the emerging markets and developing economies including China declined from 6.8 per cent to 4.9 per cent in this period (calendar-year basis). What is particularly worrisome is the slowdown in manufacturing growth that averaged 0.2 per cent per annum in 2012-13 and 2013-14.
The growth slowdown in the last two years was broad based, affecting in particular the industry sector. Inflation continued to be above the comfort zone, owing primarily to the elevated level of food inflation. Yet, the developments on the macro stabilization front, particularly the dramatic improvement in the external economic situation with the current account deficit (CAD) declining to manageable levels after two years of worryingly high levels was the redeeming feature of 2013-14. The fiscal deficit of the Centre as a proportion of GDP also declined for the second year in a row as per the announced medium term policy stance. The improvements in the twin deficits would, no doubt, feed into a higher growth in 2014-15, but the pace of recovery may be gradual. Electing the above and the expectations of a change for the better, financial markets have surged. Moderation in inflation would help ease the monetary policy stance and revive the confidence of investors, and with the global economy expected to recover moderately, particularly on account of performance in some advanced economies, the economy can look forward to better growth prospects in 2014-15 and beyond. In General Election 2014, India, is expected to have stable central government and Indian Economy is poised to overcome the sub-5 per cent growth of gross domestic product (GDP) witnessed over the last two years. However, it will take a while before we start achieving GDP growth of 7% - 8% p.a. and above. As per IMF, real GDP growth is projected to strengthen to 5.4 percent in 2014 and 6.4 percent in 2015 supported by slightly stronger global growth, improving export competitiveness, and implementation of recently approved investment projects (assuming that government efforts to revive investment growth succeed).
FUTURE OUTLOOK
The increase in demand by key end use sectors like construction, infrastructure and automobiles is expected to result in a rise in steel product demand in the future. The domestic steel demand is expected to post a CAGR of -8% between 2012-13 and 2016-17 and is expected to touch 94 million tons by 2016-17.
Infrastructure spending to boost construction
activities:
- Infrastructure sector is the largest consumer of steel. The investment in this industry accounts for nearly 11% of India’s GDP and 50% of its Gross Capital Formation. Further, infrastructure sector accounts for more than 8% of GDP. In the twelfth five-year plan (2012-17), the government has plans for investment of about USD one trillion in
- Infrastructure sector. With infrastructure spend giving a boost to the construction sector, steel demand is expected to grow.
- Per capita steel consumption expected to improve: India’s per capita steel consumption is 59 kg in FY 2012. It ranks among the bottom of all developing nations and compares poorly with world average per capita steel consumption of 217 kg and other developing countries like China (459 kg) and Brazil (123 kg). With huge infrastructure spending committed by the government in the Twelfth Five Year Plan (2012-17) and steel use being promoted increasingly, demand is expected to increase and this should help India improve its per capita steel consumption.
- Flat steel demand to grow on account of increase in demand from automobiles and pipeline industries: On the back of healthy demand from key end-use industries like automobiles, pipelines and consumer durables, the demand for flat steel is expected to grow. The demand for steel pipes will continue to be driven by the huge network of pipelines planned in the oil and gas sector and government’s increasing focus on water and irrigation
- Projects. Further, the automobile industry has registered CAGR of 13.4% in previous five years and is expected to remain robust in future. According to market research, with expected high growth in pipeline and automobile industries, the demand for flat steels product is expected to grow at an annual average of 7-8% over the next 5
- Years. With this, flat steel consumption in India is expected to reach 45-46 million tones and account for over half of the finished steel consumption in India by 2017-18.
- Long steel demand to grow on account of increase in investment in infrastructure and industrial construction: Owing to continued investment in infrastructure and industrial construction, the demand for long steel is likely to show a positive trend. Cumulative investments in infrastructure are expected to record a CAGR of 9 per cent over
- The 2013-14 to 2017-18period vis-à-vis the last 5 years. According to market research, demand for long steel products is expected to record a 6-7 per cent CAGR over the next 5 years and is expected to reach 47-48 million tons by 2017-18.
INDEX
OF CHARGES
|
S.No. |
Charge Id |
Date Of Charge
Creation/Modification |
Charge Amount
Secured |
Charge Holder |
Address |
Service Request
Number (Srn) |
|
1 |
10530520 |
31/12/2014 * |
1,000,000,000.00 |
THE SARASWAT CO-OPERATIVE BANK LIMITED |
SARASWAT BANK
BHAVAN, PLOT NO. 953, APPASAHEB MA |
C40643025 |
|
2 |
10508498 |
10/07/2014 |
200,000,000.00 |
SMALL INDUSTRIES DEVELOPMENT BANK OF INDIA |
OKHALA B.O., GF, BLOCK-E, NSIC ADMIN. BUILDING, NSIC-NTSC COMPLEX, G. NO-3, OIA, PHASE -3, NEW DELHI - 110020, INDIA |
C10910552 |
|
3 |
10509602 |
25/06/2014 |
95,000,000.00 |
SREI EQUIPMENT FINANCE LIMITED |
'VISHWAKARMA', 86C, TOPSIA ROAD, KOLKATA - 700046, WEST BENGAL, INDIA |
C11740552 |
|
4 |
10504216 |
11/06/2014 |
1,400,000,000.00 |
AXIS BANK LIMITED |
STATESMAN HOUSE, 2ND FLOOR, 148, BARAKHAMBA ROAD, NEW DELHI - 110001, INDIA |
C07340888 |
|
5 |
10507843 |
28/05/2014 |
1,000,000,000.00 |
PUNJAB & SIND BANK |
2400, HARDHYAN SINGH ROAD, KAROL BAGH, NEW DELHI - 110005, INDIA |
C10395119 |
|
6 |
10496017 |
22/04/2014 |
1,640,000,000.00 |
EXPORT-IMPORT BANK OF INDIA |
CENTRE ONE BUILDING, FLOOR 21, WORLD TRADE CENTRE COMPLEX, CUFFE PARADE, MUMBAI - 400005, MAHARASHTRA, INDIA |
C04848552 |
|
7 |
10489093 |
31/03/2014 |
1,200,000,000.00 |
YES BANK LIMITED |
YES BANK LIMITED, CHANAKYAPURI, NEW DELHI - 110021, INDIA |
C02673267 |
|
8 |
10486433 |
27/03/2014 |
2,000,000,000.00 |
IDBI BANK LIMITED |
INDIAN RED CROSS
SOCIETY BUILDING, 1, RED CROSS ROAD, POST BAG NO. 231, NEW DELHI -
110001, |
C01011865 |
|
9 |
10485721 |
21/03/2014 |
3,210,000,000.00 |
BANK OF MAHARASHTRA |
CONNAUGHT PLACE BRANCH, B 29, CONNAUGHT PLACE, NEW DELHI - 110001, INDIA |
C00779686 |
|
10 |
10483976 |
19/02/2015 * |
5,000,000,000.00 |
ICICI BANK LIMITED |
LANDMARKRACE COURCE CIRCLE, ALKAPURI, BARODA - 390015, GUJARAT, INDIA |
C46547410 |
* Date of charge modification
STATEMENT OF UNAUDITED FINANCIAL RESULTS FOR THE QUARTER AND NINE
MONTHS ENDED 31.12.2014
(Rs. In Million)
|
Sr. No. |
Particular |
Quarter Ended |
Nine Months Ended |
|
|
|
|
31.12.2014 |
30.09.2014 |
31.12.2014 |
|
|
|
(Unaudited) |
||
|
1. |
Income from operations |
|
|
|
|
|
Domestic Sales |
22534.900 |
25724.200 |
73634.800 |
|
|
Export Sales |
3378.000 |
4664.600 |
12120.800 |
|
|
Total Gross Sales of Finished Goods |
25912.900 |
30388.800 |
85755.600 |
|
|
Less : Excise
Duty |
2461.600 |
2813.000 |
8015.700 |
|
(a) |
Net Sales/Income
from Operations |
23451.300 |
27575.800 |
77739.900 |
|
|
Other operating
income |
1218.800 |
2158.500 |
4767.900 |
|
|
Less : Excise
Duty |
68.200 |
94.400 |
249.200 |
|
|
Net Other
Operating Income |
1150.600 |
2064.100 |
4518.700 |
|
|
Net Sales / Total
Income from Operations |
24601.900 |
29639.900 |
82258.600 |
|
2. |
Expenditure |
|
|
|
|
|
Cost
of materials consumed |
13944.000 |
17262.900 |
45315.600 |
|
|
Purchase
of stock in trade |
389.200 |
68.800 |
458.000 |
|
|
Changes
in inventories of finished goods, work in progress and stock in trade |
(210.800) |
49.600 |
1061.100 |
|
|
Employee
benefits expenses |
665.500 |
616.600 |
1830.700 |
|
|
Depreciation
and amortization expenses |
3225.000 |
3187.200 |
9477.400 |
|
|
Power
& Fuel |
2962.200 |
3037.500 |
8721.300 |
|
|
Other
expenses |
2386.000 |
2760.700 |
7408.900 |
|
|
Total Expenses |
23361.100 |
26983.300 |
74273.000 |
|
3. |
Profit/ (Loss) from Operations
before Other Income, Interest and Exceptional Items (1-2) |
1240.800 |
2656.600 |
7985.600 |
|
4. |
Other
Income |
18.100 |
25.600 |
64.100 |
|
5. |
Profit/ (Loss) from ordinary
activities before finance costs and Exceptional
Items (3+4) |
1258.900 |
2682.200 |
8049.700 |
|
6. |
Finance
Cost (net) |
5801.300 |
5654.100 |
16980.300 |
|
7. |
Profit/ (Loss) from ordinary
activities after finance costs and but before Exceptional Items (5-6) |
(4542.400) |
(2971.900) |
(8930.600) |
|
8. |
Exceptional
Items |
-- |
-- |
-- |
|
9. |
Profit/ (Loss) from ordinary
activities before tax (7+8) |
(4542.400) |
(2971.900) |
(8930.600) |
|
10. |
Tax
Expense |
-- |
-- |
-- |
|
11. |
Profit/ (Loss) from ordinary activities
after tax (9-10) |
(4542.400) |
(2971.900) |
(8930.600) |
|
12. |
Extraordinary Items (net of
tax expenses) |
-- |
-- |
-- |
|
13 |
Net Profit/ (Loss) for the
period (11-12) |
(4542.400) |
(2971.900) |
(8930.600) |
|
14. |
Paid-up Equity Share Capital (Face Value per share Re.10) |
453.000 |
453.000 |
453.000 |
|
16i. |
Earnings Per Share
– (Before Extraordinary Items) |
|
|
|
|
|
Basic |
(20.18) |
(13.24) |
(39.79) |
|
|
Diluted |
(20.18) |
(13.24) |
(39.79) |
|
|
|
|
|
|
|
A |
PARTICULARS OF
SHAREHOLDING |
|
|
|
|
1. |
Public Shareholding |
|
|
|
|
|
-Number
of Shares |
83926442 |
83257277 |
83926442 |
|
|
-
Percentage of Shareholding |
37.05 |
36.76 |
37.05 |
|
|
|
|
|
|
|
2. |
Promoters and Promoter Group Shareholding |
|
|
|
|
|
a) Pledged/Encumbered |
|
|
|
|
|
-
Number of Shares |
99681656 |
100966768 |
99681656 |
|
|
-
Percentage of Shares (as a % of the Total Shareholding of promoter and
promoter group) |
69.91 |
70.48 |
69.91 |
|
|
-
Percentage of Shares (as a % of the Total Share Capital of the Company) |
44.01 |
44.57 |
44.01 |
|
|
|
|
|
|
|
|
b) Non Encumbered |
|
|
|
|
|
-
Number of Shares |
42906648 |
42290701 |
42906648 |
|
|
-
Percentage of Shares (as a % of the Total Shareholding of Promoter and
Promoter Group) |
30.09 |
29.52 |
30.09 |
|
|
-
Percentage of Shares (as a % of the Total Share Capital of the Company) |
18.94 |
18.67 |
18.94 |
|
|
|
|
|
|
|
Particulars |
|
|
||
|
Pending at the beginning of the quarter |
Nil |
|
||
|
Received during the quarter |
2 |
|
||
|
Disposed of during the quarter |
1 |
|
||
|
Remaining unresolved at the end of the
quarter |
1 |
|
||
Notes:
1. The above results have been reviewed by Audit committee and approved by the Board of Directors at New Delhi on 14th February, 2015.
2. The limited review for the quarter ended on 31st December, 2014, as required under clause 41 of the listing agreement with the Stock Exchanges has been carried out by the Statutory Auditor.
3. During the current quarter the company has allotted 413340, 1% Redeemable Cumulative Preference Shares of Rs.100/- each at a premium of Rs.200/- per share on private placement basis.
4. The Company is engaged in the steel business, which in the context of Accounting Standard (AS)- 17, is considered the only business segment.
5. In accordance with requirements prescribed under Schedule II and other applicable provisions of Companies Act, 2013, the Company is in the process of identification of various components of all plants and machineries of the Company and determination of their useful life. Keeping in view the quantum of Company’s business activities, the proposed activity may take considerable time for implementation, therefore, the impact of same if any, will be reflected in financial of the Company for the year ended March 31, 2015.
6. The Supreme Court of India, vide its order dated 24/09/2014, cancelled number of coal blocks allocated to various entities which includes two coal blocks allocated to the company and one of its associated company which were under development. Subsequently, the Government of India has issued the Coal Mines (Special Provision) Second Ordinance, 2014, which inter-alia deal with the compensation in regard to investment in coal blocks. No effect has been taken on the value of investment made in coal blocks resulting from the de-allocation of coal blocks. In the opinion of the management, the Company will receive back the payments/expenditure paid/ made, including borrowing cost and other incidental expenditure, relating to de-allocated coal blocks.
7. Previous year/period figures have been regrouped / rearranged wherever considered necessary.
Fixed Assets
v
Tangible
Assets
· Freehold Land
· Leasehold Land / Building
· Plant and Machinery
· Railway Siding
· Furniture and Fixtures
· Vehicles
· Office Equipment
v
Intangible
Assets
· Computer Software
PRESS
RELEASES
BHUSHAN STEEL SLUMPS TO 52-WEEK LOW
Capital
Market August 7, 2014: Bhushan Steel was locked in 20% lower circuit at Rs
2437.000 Million at 14:41 IST on BSE, with the stock extending recent fall.
Meanwhile, the BSE Sensex was up 102.09 points, or 0.4%, to 25,767.36
On BSE, so far 45,963 shares were
traded in the counter with pending sell orders of 6.32 lakh shares at lower
circuit. The stock has an average daily volume of 60,145 shares in the past one
quarter.
The stock opened with a downward
gap, declining by the maximum 20% daily circuit and remained locked at the 20%
level at Rs 2437.000 Million so far during
the day, which is also 52-week low for the counter. The stock had hit a 52-week
high of Rs 5040.000 Million on 11 November 2013.
The stock had underperformed the
market over the past one month till 6 August 2014, falling 24.29% compared with
1.14% fall in the Sensex. The scrip had also underperformed the market in past
one quarter, sliding 31.96% as against Sensex's 14.03% rise.
The mid-cap company has an equity
capital of Rs 453.000 Million Face value per share is Rs 2.
Shares of Bhushan Steel had dropped
4.23% to Rs 3781.500 Million on Monday, 4 August 2014, after the Central Bureau
of Investigation (CBI) on Saturday, 2 August 2014, arrested the now-suspended
Chairman-cum-Managing Director of Syndicate Bank SK Jain after he had allegedly
demanded a bribe of Rs 5.000 Million from Bhushan Steel to not convert the
company's outstanding loan into a Non Performing Asset (NPA). As per reports,
Bhushan Steel had taken a loan of Rs 1000.000 Million from Syndicate Bank while
Prakash Industries had taken a loan of Rs 1200.000 Million. Both companies were
desperate to avoid their loans being declared NPAs for default in repayments.
Shares of Bhushan Steel rose 0.69% to settle at Rs 3807.500 on Tuesday, 5
August 2014. The stock fell by maximum permissible daily limit of 20% to Rs
3046.000 Million on Wednesday, 6 August 2014.
CBI Director Ranjit Sinha had
reportedly ordered an internal inquiry after his team did not arrest Bhushan
Steel vice-chairman Neeraj Singhal during searches at his residence in the
Syndicate Bank bribery case, despite clear instructions to pick him up. Neeraj
Singhal is on the run from the time of the raid and the CBI has been trying to
trace him since, so that he can be arrested, reports added.
Meanwhile, a Delhi court on
Wednesday, 6 August 2014 reportedly dismissed the anticipatory bail plea of
Neeraj Singhal in connection with the Syndicate Bank bribery case.
In view of the ongoing development
and the possible impact of the same on the credit risk profile of Bhushan
Steel, rating firm CARE on Wednesday, 6 August 2014 placed the ratings on
Credit Watch. CARE is in discussion with Bhushan Steel on the ongoing
developments and would take necessary action when greater clarity emerges, a
press release issued by CARE indicated.
Bhushan Steel reported net loss of
Rs 195.700 Million in Q4 March 2014 as compared to net profit of Rs 2802.100
Million in Q4 March 2013. Net sales fell 10.9% to Rs 23997.300 Million in Q4
March 2014 over Q4 March 2013.
BANKS FRET OVER RS. 400000.000 MILLION LOAN TO BHUSHAN STEEL
Friday, 2 January
2015: Lenders to the troubled Bhushan Steel
called an emergency meeting in Mumbai on Wednesday to step up pressure on the
company to bring in promoter's equity of Rs 10000.000 Million, so that the
restructuring process can go on stream and prevent the account from turning a
bad loan.
Heads of all major public sector banks
participated in the meeting. A senior banker who attended the meeting told dna:
"Bank chiefs have reiterated to the company to sell off all its marketable
assets so that there are cash flows into the company. Banks have asked the
company to sell off its Khopoli plant, near Pune, where the company converts
flat steel to finished auto components part. The company will have to explore
selling all assets it has, so that operating costs are minimised and cash flows
generated."
JSW STEEL IN TALKS TO BUY BHUSHAN STEEL'S ODISHA PLANT
December 2, 2014: Sajjan Jindal-controlled JSW Steel is
reported to be in talks to acquire Bhushan Steel 's
Odisha plant and also looking at picking up the company's stake in Orissa
Sponge Iron and Steel Limited.
The total value of the deal could
be around Rs 300000.000 Million, according to banking sources.
The move is reported to have been
initiated by the consortium of banks that have lent money to Bhushan Steel,
which has a total debt of around Rs 350000.000 Million on its books. Bhushan
Steel has been asked by the banks to sell its Odisha steel plant, which has a
capacity of 5.6 million tonnes per annum.
However, promoters of Bhushan Steel
have been trying to find ways of bringing down the Odisha unit is up for sale.
Bhushan Steel had informed the
Bombay Stock Exchange recently that the Board of Directors at its meeting held
on November 14 inter alia approved the draft notice of postal ballot for
passing special resolutions for payment of managerial remuneration, appointment
of Ajoy Kumar Deb nominated as nominee director by the State Bank of India
(SBI) and accepted the resignation of Sushant Jain as independent additional
director.
Sources pointed out that this
reflects that the banks are strengthening their control over running the
company. JSW Steel neither confirmed nor denied the move. "We do not want
to comment on market rumor or speculation," a JSW spokesman told Mail
Today.
Bhushan Energy has about 15 per
cent stake in Orissa Sponge, in which Monnet Ispat holds 41-per cent stake. JSW
Steel has put its West Bengal steel and power plant on hold due to uncertainty
of raw material linkages for the proposed Rs 350000.000 Million project. JSW
Bengal has already invested Rs 7000.000 Million in the project, at Salboni,
West Midnapur.
"It was keen about the
project but given the unclear situation about coal and iron ore, it was not
practical to go ahead with the project," Jindal had told journalists on
Sunday. According to industry sources, JSW would be looking for alternative
expansion through the merger and acquisition route and acquisition of the
Bhushan Steel assets would be a good strategic fit for the company.
BHUSHAN STEEL IN TALKS WITH BANKS FOR DEBT RESTRUCTURING
Mar 19, 2015: NEW DELHI: Bhushan Steel has
said it is in talks with banks for restructuring of debt to the tune of $3.7 billion
(about Rs 230000.000 Million.
"The matter regarding
realignment of debt maturity profile is at discussion stage with the bankers.
The relevant information in this regard would certainly be announced... as soon
as the same is finalized and approved by the bankers concerned," Bhushan
Steel said in a filing to the BSE.
A consortium of bankers led by
Punjab National Bank (PNB) has a total exposure of about Rs 400000.000 Million
in the company.
Besides PNB, the other banks
include State Bank of India, Canara Bank,
Bank of India and Dena Bank.
An extension of maturity will help
banks in making lower provision for the loan given to the debt-ridden steel
manufacturer.
It may be noted that last August
Bhushan Steel Vice Chairman and Managing Director Neeraj Singal was
arrested by the CBI in an alleged cash-for-loan scam involving the then
Syndicate Bank chairman and managing director S K Jain, who was later suspended
by the government.
After the arrest, lenders formed a
committee with officials from various banks, which are closely monitoring the
functioning of the company. They had also appointed some new directors to the
company's board.
CMT REPORT (Corruption, Money Laundering & Terrorism]
The Public Notice information has been collected from various sources
including but not limited to: The Courts,
1] INFORMATION ON
DESIGNATED PARTY
No exist designating subject or any of its beneficial owners,
controlling shareholders or senior officers as terrorist or terrorist
organization or whom notice had been received that all financial transactions
involving their assets have been blocked or convicted, found guilty or against
whom a judgement or order had been entered in a proceedings for violating
money-laundering, anti-corruption or bribery or international economic or
anti-terrorism sanction laws or whose assets were seized, blocked, frozen or
ordered forfeited for violation of money laundering or international
anti-terrorism laws.
2] Court Declaration :
No records exist to suggest that subject is
or was the subject of any formal or informal allegations, prosecutions or other
official proceeding for making any prohibited payments or other improper
payments to government officials for engaging in prohibited transactions or
with designated parties.
3] Asset Declaration :
No records exist to suggest that the property or assets of the subject
are derived from criminal conduct or a prohibited transaction.
4] Record on Financial
Crime :
Charges or conviction
registered against subject: None
5] Records on Violation of
Anti-Corruption Laws :
Charges or
investigation registered against subject: None
6] Records on Int’l
Anti-Money Laundering Laws/Standards :
Charges or
investigation registered against subject: None
7] Criminal Records
No
available information exist that suggest that subject or any of its principals
have been formally charged or convicted by a competent governmental authority
for any financial crime or under any formal investigation by a competent government
authority for any violation of anti-corruption laws or international anti-money
laundering laws or standard.
8] Affiliation with
Government :
No record
exists to suggest that any director or indirect owners, controlling
shareholders, director, officer or employee of the company is a government
official or a family member or close business associate of a Government
official.
9] Compensation Package :
Our market
survey revealed that the amount of compensation sought by the subject is fair
and reasonable and comparable to compensation paid to others for similar
services.
10] Press Report :
No press reports / filings exists on
the subject.
CORPORATE GOVERNANCE
MIRA INFORM as part of its Due Diligence do provide comments on Corporate
Governance to identify management and governance. These factors often have been
predictive and in some cases have created vulnerabilities to credit
deterioration.
Our Governance Assessment focuses principally on the interactions
between a company’s management, its Board of Directors, Shareholders and other
financial stakeholders.
CONTRAVENTION
Subject is not known to have contravened any existing local laws,
regulations or policies that prohibit, restrict or otherwise affect the terms
and conditions that could be included in the agreement with the subject.
FOREIGN EXCHANGE RATES
|
Currency |
Unit
|
Indian Rupees |
|
US Dollar |
1 |
Rs.62.82 |
|
|
1 |
Rs.93.85 |
|
Euro |
1 |
Rs.67.59 |
INFORMATION DETAILS
|
Analysis Done by
: |
SUB |
|
|
|
|
Report Prepared
by : |
MTN |
SCORE & RATING EXPLANATIONS
|
SCORE FACTORS |
RANGE |
POINTS |
|
HISTORY |
1~10 |
4 |
|
PAID-UP CAPITAL |
1~10 |
2 |
|
OPERATING SCALE |
1~10 |
2 |
|
FINANCIAL
CONDITION |
|
|
|
--BUSINESS SCALE |
1~10 |
3 |
|
--PROFITABILITY |
1~10 |
2 |
|
--LIQUIDITY |
1~10 |
1 |
|
--LEVERAGE |
1~10 |
1 |
|
--RESERVES |
1~10 |
2 |
|
--CREDIT LINES |
1~10 |
1 |
|
--MARGINS |
-5~5 |
-- |
|
DEMERIT POINTS |
|
|
|
--BANK CHARGES |
YES/NO |
YES |
|
--LITIGATION |
YES/NO |
YES |
|
--OTHER ADVERSE INFORMATION |
YES/NO |
NO |
|
MERIT POINTS |
|
|
|
--SOLE DISTRIBUTORSHIP |
YES/NO |
NO |
|
--EXPORT ACTIVITIES |
YES/NO |
NO |
|
--AFFILIATION |
YES/NO |
YES |
|
--LISTED |
YES/NO |
NO |
|
--OTHER MERIT FACTORS |
YES/NO |
YES |
|
DEFAULTER
|
|
|
|
--RBI |
YES/NO |
NO |
|
--EPF |
YES/NO |
NO |
|
|
|
|
|
TOTAL |
|
18 |
This score serves as a reference to assess
SC’s credit risk and to set the amount of credit to be extended. It is calculated
from a composite of weighted scores obtained from each of the major sections of
this report. The assessed factors and their relative weights (as indicated
through %) are as follows:
Financial
condition (40%) Ownership
background (20%) Payment record
(10%)
Credit history
(10%) Market trend (10%) Operational size
(10%)
RATING EXPLANATIONS
|
RATING |
STATUS |
PROPOSED CREDIT LINE |
|
|
>86 |
Aaa |
Possesses an extremely sound financial base with the strongest
capability for timely payment of interest and principal sums |
Unlimited |
|
71-85 |
Aa |
Possesses adequate working capital. No caution needed for credit
transaction. It has above average (strong) capability for payment of interest
and principal sums |
Large |
|
56-70 |
A |
Financial & operational base are regarded healthy. General
unfavourable factors will not cause fatal effect. Satisfactory capability for
payment of interest and principal sums |
Fairly Large |
|
41-55 |
Ba |
Overall operation is considered normal. Capable to meet normal
commitments. |
Satisfactory |
|
26-40 |
B |
Capability to
overcome financial difficulties seems comparatively below average. |
Small |
|
11-25 |
Ca |
Adverse factors are apparent. Repayment of interest and principal sums
in default or expected to be in default upon maturity |
Limited with
full security |
|
<10 |
C |
Absolute credit risk exists. Caution needed to be exercised |
Credit not
recommended |
|
-- |
NB |
New Business |
-- |
This report is issued at your request without any
risk and responsibility on the part of MIRA INFORM PRIVATE LIMITED (MIPL)
or its officials.