IRA INFORM REPORT
|
Report No. : |
319015 |
|
Report Date : |
24.04.2015 |
IDENTIFICATION DETAILS
|
Name : |
HINDALCO INDUSTRIES LIMITED |
|
|
|
|
Registered
Office : |
Century Bhavan, 3rd Floor, Dr. Annie Besant Road, Worli,
Mumbai – 400025, Maharashtra |
|
Tel No. : |
91-22-2430 8491 |
|
|
|
|
Country : |
India |
|
|
|
|
Financials (as
on) : |
31.03.2014 |
|
|
|
|
Date of
Incorporation : |
15.12.1958 |
|
|
|
|
Com. Reg. No.: |
11-011238 |
|
|
|
|
Capital
Investment / Paid-up Capital : |
Rs.2064.800 Million |
|
|
|
|
CIN No.: [Company Identification
No.] |
L27020MH1958PLC011238 |
|
|
|
|
TIN No.: |
Not Available |
|
|
|
|
IEC No.: |
Not Available |
|
|
|
|
TAN No.: [Tax Deduction & Collection
Account No.] |
MUMI05060G |
|
|
|
|
PAN No.: [Permanent Account No.] |
AAACH1201R |
|
|
|
|
Legal Form : |
A Public Limited Liability Company.
The Company’s Shares are Listed on the Stock Exchanges. |
|
|
|
|
Line of Business
: |
Manufacturer of
Aluminum and Copper. |
|
|
|
|
No. of Employees
: |
Information denied by management |
RATING & COMMENTS
|
MIRA’s Rating : |
Aa (74) |
|
RATING |
STATUS |
PROPOSED CREDIT LINE |
|
|
71-85 |
Aa |
Possesses adequate working capital. No caution needed for credit
transaction. It has above average (strong) capability for payment of interest
and principal sums |
Large |
|
Status : |
Good |
|
|
|
|
Payment Behaviour : |
Regular |
|
|
|
|
Litigation : |
Exist |
|
|
|
|
Comments : |
Subject is one of the largest integrated aluminum manufacturer in
India. It is a well-established and reputed company having fine track record. The rating reflects company’s healthy financial risk profile marked by
adequate liquidity position and decent profitability levels of the company. Trade relations are reported as fair. Business is active. Payments are
reported to be regular and as per commitments. The company can be considered good for normal business dealings at usual
trade terms and conditions. |
NOTES :
Any query related to this report can be made
on e-mail : infodept@mirainform.com
while quoting report number, name and date.
ECGC Country Risk Classification List – December 31, 2014
|
Country Name |
Previous Rating (30.09.2014) |
Current Rating (31.12.2014) |
|
India |
A1 |
A1 |
|
Risk Category |
ECGC
Classification |
|
Insignificant |
A1 |
|
Low |
A2 |
|
Moderate |
B1 |
|
High |
B2 |
|
Very High |
C1 |
|
Restricted |
C2 |
|
Off-credit |
D |
EXTERNAL AGENCY RATING
|
Rating Agency Name |
CRISIC |
|
Rating |
Long Term Rating = AA |
|
Rating Explanation |
High degree of safety and very low credit risk |
|
Date |
26.09.2014 |
|
Rating Agency Name |
CRISIC |
|
Rating |
Short Term Rating = A1+ |
|
Rating Explanation |
Very strong degree of safety and lowest credit risk |
|
Date |
26.09.2014 |
RBI DEFAULTERS’ LIST STATUS
Subject’s name is not enlisted as a defaulter
in the publicly available RBI Defaulters’ list.
EPF (Employee Provident Fund) DEFAULTERS’ LIST STATUS
Subject’s name is not enlisted as a defaulter
in the publicly available EPF (Employee Provident Fund) Defaulters’ list as of
31-03-2014.
INFORMATION DENIED
Management Non Co-Operative (Tel No.: 91-22-66525000)
LOCATIONS
|
Registered Office/ Marketing Head Office: |
Century Bhavan, 3rd
Floor, Dr. Annie Besant Road, Worli, Mumbai – 400 025, Maharashtra, India |
|
Tel. No.: |
91-22-24308491 / 92
/ 93 / 66626666 |
|
Fax No.: |
91-22-24227586 /
24362516 |
|
E-Mail : |
|
|
Website : |
|
|
|
|
|
Corporate
Office 1/ - Marketing Head Office
(Copper) : |
Aditya Birla Centre, III Floor, B Wing, S. K. Ahire Marg,
Worli, Mumbai – 400030, |
|
Tel No.: |
91-22-66525000 / 24995000 |
|
Fax No.: |
91-22-66525847 / 24995841 |
|
Email : |
|
|
Website: |
|
|
|
|
|
Corporate
Office 2: |
Foil and Packaging Business, Kalwa Works, Thane Belapur
Road, Near Vitawa Village, Kalwa, Thane-400 605, Maharashtra, India |
|
Tel. No.: |
91-22-25347151 |
|
Fax No. : |
91-22-24227586 |
|
Email : |
|
|
|
|
|
Domestic Marketing -
West Zone |
264-265, Vasvani Chambers, 2nd Floor, Dr. Annie Besant Rd, Opposite Old Passport Office, Worli, Mumbai - 400 030, Maharashtra, India |
|
Tel. No.: |
91-22-49204252 |
|
Fax No. : |
91-22-49204500 |
|
Email : |
|
|
|
|
|
Regional
Office – Aluminum : |
Ahura Centre, 1st
Floor, 82, Mahakali Caves Road, Mumbai – 400093, Maharashtra, India Tel No.: 91-22-66917031 / 30 / 37 / 40 /00 Fax No.:91-22-66917070 Vandhana, 5th Floor ,11 Tolstoy Marg, New Delhi – 110001, India Tel No.: 91-11-42200204 / 228 / 230 / 271 / 200 Fax No.:91-11-23721595 Jeevan Deep, 2nd Floor 1, Middleton Street Kolkata – 700071, West Bengal, India Tel No.: 91-33-22809710 Fax No.:91-33-22886139 Industry House, 7th Floor, 45, Race Course Road, Bangalore – 560001, Karnataka, India Tel No.:91-80-4041 6010 / 21 / 22 / 00 |
|
|
|
|
Principal
Office and Works / Renusagar Power Division : |
District Sonbhadra,
P. O. Renukoot – 231217, Mirzapur, Uttar Pradesh, India |
|
Tel. No.: |
91-5446-252077-9/
272501-5 |
|
Fax No.: |
91-5446-252107 /
252427/ 272382 |
|
E-Mail : |
|
|
|
|
|
Birla Copper
Division: |
P. O. Dahej,
Lakhigam, District Bharuch – 392130, Gujarat, India |
|
Tel. No.: |
91-2641-256004-06/251009 |
|
Fax No.: |
91-2641-251002-3 |
|
E-Mail : |
|
|
|
|
|
Foil and Wheels Division: |
Village Khutli,
Khanvel, Silvassa – 396230, |
|
Tel. No.: |
91-260-2677021-4 |
|
Fax No.: |
91-260-2677025 |
|
|
|
|
Export Office: |
9/1, R. N.
Mukherjee Road, Kolkata – 700001, West Bengal, India |
|
Tel. No.: |
91-33-22480949 /
22200464 |
|
Fax No.: |
91-33-22200214 |
|
Email: |
|
|
|
|
|
Factory : |
ALUMINIUM
AND POWER Renukoot
Plant P.O. Renukoot -231217, District Sonbhadra, Uttar Pradesh,
India Tel No.:
91-5446-252077-9 Fax No.:91-5446-252107 Renusagar
Power Division P. O. Renusagar, District Sonbhadra, Uttar Pradesh, India Tel No.:
91-5446-272502-5 Fax No.:
91-5446272382 Hirakud
Smelter Hirakud 768 016, District Sambalpur, Orissa,
India Tel No.:
91-663- 2481307/1452 Fax No.:91-663-2481356 Hirakud
Power Post Box No.12, Hirakud 768 016, District: Sambalpur,
Orissa Alupuram, India Tel No.: 91-663-
2481307 Fax No.: 91-663- 2481342/365 Mahan Aluminium NH-75-E, Singrauli, Sidhi Road, P.O., Bargawan, District- Singaruli - 486886, Madhya Pradesh, India Tel No.: 07805281014 Aditya Aluminium Lapanga, District Sambalpur – 768212, Orissa, India Tel No.:91- 663-2114424 Fax No.: 91- 663-2590434 COPPER: Birla
Copper Division P.O. Dahej, Lakhigam Post, District. Bharuch – 392 130, Tel No.: 91-2641- 256004-06/ 251009 Fax No.:
91-2641- 251002-3 CHEMICALS: Muri
Alumina Post Chotamuri-835 101, District Ranchi,
India Tel No.: : 91-6522- 244396 Fax No.:
91-6522-244231 Village Yamanapur , Tel No.: 91-831-2472716 Fax No.:91-831-2472728 MINES Chandgad
Mines At Post: Chandgad – 416509, District: Kolhapur,
Maharashtra, India Tel/Fax: (02320) 213342 Durgmanwadi
Mines At Post Radhanagri, District: Kolhapur, Maharashtra – 416
212, India Tel No.:
91-2321-260036 Fax No.:
91-2321-260037 Lohardaga
Mines District: Lohardaga – 835 302, Jharkhand, India Tel No.:
91-6526-224446 Fax No.:
91-6526-224446 Talabira
Mines Talabira-1, Qrs. No. A6/1, Saraswati Vihar, P.O. Sankarma,
District Sambalpur, Orissa, India Tel No.:
91-663-2230573 SHEET,
FOIL, WHEEL, PACKAGING AND EXTRUSIONS Foils and Wheels Division, Village Khutli, Khanvel,
Silvassa-396230, U.T., India Tel No.: 91-260-2677021/4 Fax No.: 91-260-2677025 Belur
Sheet 39, Grand Trunk Road, Belurmath 711 202, District: Howrah,
West Bengal, India Tel No.: 91-33-26547210 Fax No.:
91-33-26549982 Taloja
Sheet Plot 2, MIDC Industrial Area, Taloja A.V., District:
Raigad, Navi Mumbai – 410 208, Maharashtra, India Tel No.
91-22-27412261/ 66292929 Fax No.:
91-22-27412430 Alupuram
Extrusions Alupuram, P.B. No.30, Kalamassery – 683 104, District:
Ernakulam, Kerala, India Tel No.:
91-484-2532441 Fax No.: 91-484- 2532468 Mouda
Unit Village Dahali, Tel No:
91-7115-660777/786 Kollur
Works Village- Kollur, Re Puram Mandal, Via Mutangi, Medak
District, Andhra Pradesh – 502 300, India Tel No::
91-8413- 234300/ 234204/05 Fax No.:
91-8455-288829 Hirakud FRP Hirakud, District – Sambalpur -– 768016, Orissa, India Tel No.:91-663-6625000 Fax No.:91-663-2481344 |
DIRECTORS
As on 31.03.2014
|
Name : |
Mr. Kumar Mangalam Birla |
|
Designation : |
Chairman |
|
Address : |
16-A, IL-Palazzo, Little Gibbs Road, Mumbai – 400 006, Maharashtra,
India |
|
Qualification : |
A.C.A, M.B.A. |
|
Date of Birth : |
14.06.1967 |
|
Date of Appointment : |
16.11.1992 |
|
|
|
|
Name : |
Mr. Debnaranyan Bhattacharya |
|
Designation : |
Managing Director |
|
Qualification : |
B. E. (Chemicals), IIT |
|
Date of Birth : |
13.09.1948 |
|
Date of Appointment : |
30.04.2003 |
|
|
|
|
Name : |
Mr. Satish Pai, |
|
Designation : |
Deputy Managing Director |
|
|
|
|
Name : |
Mrs. Rajashree Birla |
|
Designation : |
Non-Executive Director |
|
Address : |
16-A, IL- Palazzo, Little Gibbs Road, Mumbai – 400 006, Maharashtra, India |
|
Date of Appointment : |
15.03.1996 |
|
|
|
|
Name : |
Mr. Madhukar Manilal Bhagat |
|
Designation : |
Non-Executive Directors |
|
|
|
|
Name : |
Mr. Kailash Nath Bhandari |
|
Designation : |
Non-Executive Directors |
|
|
|
|
Name : |
Mr. Askaran K. Agarwala |
|
Designation : |
Non-Executive Director |
|
Address : |
“Haveli”, Flat No.3, L.D. Ruparel Marg, Mumbai – 400 006, Maharashtra,
India |
|
Qualification : |
B.Com, F.C.A, LLB |
|
Date of Birth : |
01.07.1993 |
|
Date of Appointment : |
11.09.1998 |
|
|
|
|
Name : |
Mr. Narendra Jamnadas Jhaveri |
|
Designation : |
Non-Executive Directors |
|
|
|
|
Name : |
Mr. Ram Charan |
|
Designation : |
Non-Executive Directors |
|
|
|
|
Name : |
Mr. Jagdish Khattar |
|
Designation : |
Non-Executive Directors |
|
Qualification : |
BA (Hons), LLB |
|
Date of Birth : |
18.12.1942 |
|
Date of Appointment : |
09.05.2011 |
KEY EXECUTIVES
|
Name : |
Mr. Anil Malik |
|
Designation : |
Company Secretary |
|
|
|
|
Name : |
Mr. Praveen
Maheshwari |
|
Designation : |
Chief Financial Officer |
|
|
|
|
BUSINESS / UNIT HEAD: |
|
|
Name : |
Mr. Dilip Gaur |
|
Designation : |
Group Executive President, Copper |
|
|
|
|
Name : |
Mr. Sachin Satpute |
|
Designation : |
Chief Marketing
Officer, Aluminium |
|
|
|
|
Name : |
Mr. Satish Mohan Bhatia |
|
Designation : |
Chief Marketing Offi cer, Aluminium |
|
|
|
|
Name : |
Mr. Sanjay Sehgal |
|
Designation : |
President (Chemicals) |
|
|
|
|
Name : |
Mr. Dinesh Kumar Kohly |
|
Designation : |
Chief Operating Offi cer (Renukoot, Renusagar & Mahan Units) |
|
|
|
|
Name : |
Mr. B. Arun Kumar |
|
Designation : |
President (Operations) |
|
|
|
|
CORPORATE : |
|
|
Name : |
Mr. Bharat
Bhushan Jha |
|
Designation : |
Senior President
(Corporate Projects and Procurement) |
|
|
|
|
Name : |
Mr. Vineet Kaul |
|
Designation : |
Chief People Officer |
|
|
|
|
NOVELIS INC |
|
|
Name : |
Mr. Debnarayan
Bhattacharya |
|
Designation : |
Vice Chairman |
|
|
|
|
Name : |
Mr. Philip Martens |
|
Designation : |
President and Chief Executive Officer |
|
|
|
|
UTKAL ALUMINA INTERNATIONAL LIMITED |
|
|
|
|
|
Name : |
Mr. Vijay Sapra |
|
Designation : |
President |
|
|
|
|
ADITYA BIRLA MINERALS LIMITED |
|
|
|
|
|
Name : |
Mr. Debnarayan Bhattacharya |
|
Designation : |
Chairman |
|
|
|
|
Name : |
Mr. Sunil Kulwal |
|
Designation : |
Chief Executive Officer and MD |
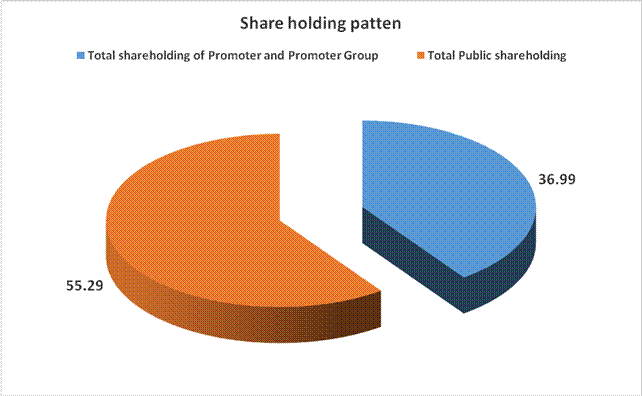
SHAREHOLDING PATTERN
As on 31.03.2015
|
Category of
Shareholder |
No.
of Shares |
Percentage
of Holding |
|
(A) Shareholding of
Promoter and Promoter Group |
||
|
|
|
|
|
|
2398696 |
0.12 |
|
|
745082362 |
36.08 |
|
|
16316130 |
0.79 |
|
|
16316130 |
0.79 |
|
|
763797188 |
36.99 |
|
|
|
|
|
Total shareholding
of Promoter and Promoter Group (A) |
763797188 |
36.99 |
|
(B) Public
Shareholding |
||
|
|
|
|
|
|
21898565 |
1.06 |
|
|
43474184 |
2.11 |
|
|
58040 |
0.02 |
|
|
215317901 |
10.43 |
|
|
574208373 |
27.81 |
|
|
854957063 |
41.42 |
|
|
|
|
|
|
86741720 |
4.21 |
|
|
|
|
|
|
124802625 |
6.68 |
|
|
9979311 |
0.52 |
|
|
16159558 |
2.46 |
|
|
8619070 |
0.51 |
|
|
3665936 |
0.18 |
|
|
0.00 |
1.58 |
|
|
3874552 |
0.19 |
|
|
237683214 |
13.87 |
|
Total Public
shareholding (B) |
1092640277 |
55.29 |
|
Total (A)+(B) |
1856437465 |
92.28 |
|
(C) Shares held by Custodians
and against which Depository Receipts have been issued |
|
|
|
|
14542309 |
0.70 |
|
|
144860149 |
7.02 |
|
|
159402458 |
7.72 |
|
Total (A)+(B)+(C) |
2015839923 |
100.00 |
BUSINESS DETAILS
|
Line of Business : |
Manufacturer of
Aluminum and Copper. |
||||||||||||
|
|
|
||||||||||||
|
Products : |
|
||||||||||||
|
|
|
||||||||||||
|
Brand Names : |
-- |
||||||||||||
|
|
|
||||||||||||
|
Agencies Held : |
-- |
||||||||||||
|
|
|
||||||||||||
|
Exports : |
Not Divulged |
||||||||||||
|
|
|
||||||||||||
|
Imports : |
Not Divulged |
||||||||||||
|
|
|
||||||||||||
|
Terms : |
|
||||||||||||
|
Selling : |
Not Divulged |
||||||||||||
|
|
|
||||||||||||
|
Purchasing : |
Not Divulged |
PRODUCTION STATUS – NOT AVAILABLE
GENERAL INFORMATION
|
Suppliers : |
|
||||||||||||||||||||||||||||||||||||||||||
|
|
|
||||||||||||||||||||||||||||||||||||||||||
|
Customers : |
|
||||||||||||||||||||||||||||||||||||||||||
|
|
|
||||||||||||||||||||||||||||||||||||||||||
|
No. of Employees : |
Information denied by management |
||||||||||||||||||||||||||||||||||||||||||
|
|
|
||||||||||||||||||||||||||||||||||||||||||
|
Bankers : |
|
||||||||||||||||||||||||||||||||||||||||||
|
|
|
||||||||||||||||||||||||||||||||||||||||||
|
Facilities : |
Note: Long Term Borrowings * Current maturities of long-term borrowings are disclosed under the head “Other Current Liabilities”. Debentures comprise
of following:
All the above Debentures are secured by all the movable, both present and future (except moveable assets of Mahan Aluminium Project, Aditya Aluminium Project, Kalwa plant and Current Assets), and certain immovable properties of the Company. Term Loans of Rs.72275.400 Million from Banks and Rs.1491.800 Million from Other Parties for Aditya Aluminium Project and Term Loan of Rs.70463.700 Million from Banks and Rs.906.300 Million from Other Parties for Mahan Aluminium Project have been prepaid by the Company on 17th September, 2013 and 3rd January, 2014, respectively. Term Loans from Banks of Rs.73650.000 Million to be secured by a first ranking charge/mortgage/security interest in respect of all the movable assets of Mahan Aluminium Project (except Current Assets) and all the immovable properties of Mahan Aluminium Project, both present and future. However, security creation is pending for want of no due certifi ate from previous term loan lenders. Total loan of Rs.75000.000 Million carry interest at the State Bank of India’s base rate plus 0.50% and are repayable in 40 quarterly instalments commencing from 31st March, 2014 and ending on 31st December, 2023. The repayment in each financial year in percentage is 1.8, 7.95, 9.2, 9.2, 10.2, 10.2, 10.2, 10.2, 11.1, 11.4 and 8.55 of the loan amount. Term Loans from Banks of Rs.88500.000 Million to be secured by a first ranking charge/mortgage/security interest in favour of the State Bank of India, in respect of all the movable and immovable properties of Aditya Aluminium Project, both present and future. However, security on 2,579.89 acres of Project land is pending due to non-availability of approval from the appropriate authority. Above loans carry interest at the State Bank of India’s base rate plus 1.25% till project COD and 0.25% thereafter, and are repayable in 34 quarterly instalments commencing from 1st June, 2015 and ending on 1st September, 2023. The repayment in each financial year in percentage is 2.32, 4.20, 6.20, 8.60, 9, 11.50, 16, 26 and 16.18 of the loan amount. The Company will have an option to prepay all or any portion of these loans, without payment of Prepayment Penalty within 30 (Thirty) days after any annual Interest Reset Date. Term Loans from Other Parties include Foreign Currency Term Loans from Export Development Canada (EDC) of USD 90.70 million (Previous year USD 100.00 million) are secured by a first charge on all movable assets of the Mahan Aluminium Project and a second charge on the current assets of the Company, both present and future. Total loan of USD 100 million carry interest at the LIBOR plus 3.50% and are repayable in 43 quarterly instalments commencing from 30th June, 2013 and ending on 31st December, 2023. The repayment in each financial year in percentage is 9.30, 9.30, 9.30, 9.30, 9.30, 9.30. 9.30. 9.30, 9.30, 9.30 and 7 of the loan amount. Subject to the prevailing RBI ECB Regulations, the Company may prepay all or any part of these loans at any time. Short-term
borrowings Working Capital Loan for Aluminium Business, granted under
the Consortium Lending Arrangement, are secured by a first pari passu charge on
entire stocks of raw materials, work-in-process, finished goods, consumable
stores and spares and also book debts pertaining to the Company’s Aluminium
business. Working Capital Loan of State Bank of India for the Copper business
is secured by a first pari passu charge by way of hypothecation of stocks of
raw materials, work-in-process, finished goods and consumable stores and
spares, and also book debts and other movable assets of Copper business, both
present and future. |
|
|
|
|
Auditors : |
|
|
Name : |
Singhi and Company Chartered Accountants |
|
Address : |
Kolkata, West Bengal, India |
|
|
|
|
Cost Auditors : |
|
|
Name : |
R. Nanabhoy and Company Cost Accountant |
|
Address : |
Mumbai, Maharashtra India |
|
|
|
|
Memberships : |
-- |
|
|
|
|
Collaborators : |
-- |
|
|
|
|
Subsidiaries: |
|
|
|
|
|
Associates: |
|
|
|
|
|
Joint Ventures: |
|
|
|
|
|
Trust of the Company: |
|
CAPITAL STRUCTURE
As on 31.03.2014
Authorised Capital :
|
No. of Shares |
Type |
Value |
Amount |
|
|
|
|
|
|
2100000000 |
Equity Shares |
Re.1/- each |
Rs.2100.000 Million |
|
25000000 |
Redeemable Cumulative Preference Shares |
Rs.2/- each |
Rs.50.000 Million |
|
|
Total |
|
Rs.2150.000
Million |
Issued Capital :
|
No. of Shares |
Type |
Value |
Amount |
|
|
|
|
|
|
2065141514 |
Equity Shares |
Re. 1/- each |
Rs.2065.100 Million |
Subscribed & Paid-up Capital :
|
No. of Shares |
Type |
Value |
Amount |
|
|
|
|
|
|
2065134117 |
Equity Shares |
Re. 1/- each |
Rs.2065.100 Million |
|
|
Less: Face Value of Equity Shares forfeited |
|
Rs.0.500 Million |
|
|
Add: Forfeited Shares (Amount originally Paid-up) |
|
Rs.0.200 Million |
|
|
Total |
|
Rs.2064.800
Million |
# Issued Equity Share Capital includes 7397
Equity Shares of Re.1/- each issued on Rights basis kept in abeyance due to
legal case pending.
(a) Reconciliation of shares outstanding at the beginning and at the end
of the reporting period:
|
Equity Shares |
Number
of Shares |
Rs.
In Million |
|
Shares outstanding at the beginning of the year |
1914583068 |
1914.600 |
|
Shares allotted pursuant to exercise of ESOP |
4800 |
|
|
Equity Shares Allotted pursuant to exercise of Share Warrants |
150000000 |
150.000 |
|
Equity Shares Outstanding at the end of the period |
2064587868 |
2064.600 |
(b) Rights, preferences and restrictions attached to Equity Shares:
The Company has one class of equity shares
having a par value of Re.1/- per share. Each shareholder is eligible for one
vote per share held. The dividend proposed by the Board of Directors is subject
to the approval of the shareholders in the ensuing Annual General Meeting,
except in case of interim dividend. In the event of liquidation, the equity
shareholders are eligible to receive the remaining assets of the Company after
distribution of all preferential amounts, in proportion to their shareholding.
(c) Details of shareholders holding more than 5% equity Shares in the
Company on reporting date:
|
Name of
Shareholder |
Number
of Shares |
% holding |
|
IGH Holdings Private Limited |
349963487 |
16.95 |
|
Turquoise Investment and Finance Limited |
124012468 |
6.01 |
|
Morgan Guaranty Trust Company of New York
(represents GDRs) |
162138001 |
7.85 |
|
Life Insurance Corporation of India and
its Associates |
239089223 |
11.58 |
(d) Shares Reserved
for Issue under Options:
The Company has reserved Equity Shares for issue under the
Employee Stock Options Scheme.
FINANCIAL DATA
[all figures are
in Rupees Million]
ABRIDGED BALANCE
SHEET
|
SOURCES OF
FUNDS |
31.03.2014 |
31.03.2013 |
31.03.2012 |
|
I.
EQUITY
AND LIABILITIES |
|
|
|
|
(1)Shareholders' Funds |
|
|
|
|
(a) Share Capital |
2,064.800 |
1,914.800 |
1,914.800 |
|
(b) Reserves & Surplus |
365,259.700 |
332,396.000 |
312,996.800 |
|
(c) Money
received against share warrants |
0.000 |
0.000 |
0.000 |
|
|
|
|
|
|
(2) Share Application money pending
allotment |
0.000 |
5,413.100 |
5,413.100 |
|
Total
Shareholders’ Funds (1) + (2) |
367,324.500 |
339,723.900 |
320,324.700 |
|
|
|
|
|
|
(3)
Non-Current Liabilities |
|
|
|
|
(a) long-term borrowings |
221,085.800 |
204,430.500 |
111,151.300 |
|
(b) Deferred tax liabilities (Net) |
11,743.100 |
11,911.400 |
12,245.600 |
|
(c) Other long term
liabilities |
8,308.600 |
9,742.800 |
9,531.000 |
|
(d) long-term
provisions |
3,419.600 |
3,009.400 |
2,873.200 |
|
Total Non-current
Liabilities (3) |
244,557.100 |
229,094.100 |
135,801.100 |
|
|
|
|
|
|
(4)
Current Liabilities |
|
|
|
|
(a) Short
term borrowings |
42,583.700 |
37,017.200 |
34,567.800 |
|
(b) Trade
payables |
43,837.500 |
30,440.500 |
46,597.700 |
|
(c) Other
current liabilities |
29,019.100 |
19,240.900 |
9,986.100 |
|
(d) Short-term
provisions |
10,377.600 |
10,669.000 |
9,198.800 |
|
Total Current
Liabilities (4) |
125,817.900 |
97,367.600 |
100,350.400 |
|
|
|
|
|
|
TOTAL |
737,699.500 |
666,185.600 |
556,476.200 |
|
|
|
|
|
|
II.
ASSETS |
|
|
|
|
(1)
Non-current assets |
|
|
|
|
(a) Fixed
Assets |
|
|
|
|
(i)
Tangible assets |
180,249.800 |
70,710.000 |
71,259.500 |
|
(ii) Intangible
Assets |
297.300 |
266.500 |
242.500 |
|
(iii)
Capital work-in-progress |
172,771.300 |
236,051.100 |
162,567.000 |
|
(iv)
Intangible assets under development |
1.000 |
0.100 |
2.400 |
|
(b) Non-current Investments |
153,124.500 |
140,501.700 |
135,037.000 |
|
(c) Deferred tax assets (net) |
0.000 |
0.000 |
0.000 |
|
(d) Long-term Loan and Advances |
11,611.500 |
16,810.800 |
22,495.300 |
|
(e) Other
Non-current assets |
125.200 |
345.100 |
78.100 |
|
Total Non-Current
Assets |
518,180.600 |
464,685.300 |
391,681.800 |
|
|
|
|
|
|
(2)
Current assets |
|
|
|
|
(a)
Current investments |
65,950.100 |
64,319.600 |
45,834.000 |
|
(b)
Inventories |
89,145.800 |
77,026.100 |
77,428.600 |
|
(c) Trade
receivables |
12,836.500 |
15,150.400 |
14,274.500 |
|
(d) Cash
and cash equivalents |
11,631.700 |
14,978.200 |
7,223.000 |
|
(e)
Short-term loans and advances |
32,264.000 |
22,617.300 |
16,476.500 |
|
(f) Other
current assets |
7,690.800 |
7,408.700 |
3,557.800 |
|
Total
Current Assets |
219,518.900 |
201,500.300 |
164,794.400 |
|
|
|
|
|
|
TOTAL |
737,699.500 |
666,185.600 |
556,476.200 |
PROFIT & LOSS
ACCOUNT
|
|
PARTICULARS |
31.03.2014 |
31.03.2013 |
31.03.2012 |
|
|
|
SALES |
|
|
|
|
|
|
|
Income |
278,509.300 |
260,569.300 |
265,967.800 |
|
|
|
Other Income |
11,244.200 |
9,830.900 |
6,157.900 |
|
|
|
TOTAL (A) |
289,753.500 |
270,400.200 |
272,125.700 |
|
|
|
|
|
|
|
|
Less |
EXPENSES |
|
|
|
|
|
|
|
Purchases of Stock-in-Trade |
0.300 |
3.800 |
2,059.800 |
|
|
|
Cost of Materials Consumed |
188,042.800 |
171,365.100 |
178,430.800 |
|
|
|
Changes in inventories of
finished goods, work-in-progress and Stock-in-Trade |
(6,762.100) |
1,279.400 |
(4,073.100) |
|
|
|
Employees benefits expense |
13,461.000 |
12,008.000 |
11,133.500 |
|
|
|
Impairment Loss/(Reversal)
(Net) |
0.000 |
172.500 |
0.000 |
|
|
|
Power and Fuel |
35,576.100 |
30,730.400 |
28,706.700 |
|
|
|
Other expenses |
23,272.400 |
23,145.400 |
18,662.500 |
|
|
|
Exceptional Items |
3,959.800 |
0.000 |
0.000 |
|
|
|
TOTAL
(B) |
257,550.300 |
238,704.600 |
234,920.200 |
|
|
|
|
|
|
|
|
Less |
PROFIT
BEFORE INTEREST, TAX, DEPRECIATION AND AMORTISATION (A-B) (C) |
32,203.200 |
31,695.600 |
37,205.500 |
|
|
|
|
|
|
|
|
|
Less |
FINANCIAL
EXPENSES (D) |
7,116.500 |
4,359.800 |
2,936.300 |
|
|
|
|
|
|
|
|
|
|
PROFIT
BEFORE TAX, DEPRECIATION AND AMORTISATION (C-D) (E) |
25,086.700 |
27,335.800 |
34,269.200 |
|
|
|
|
|
|
|
|
|
Less/ Add |
DEPRECIATION/
AMORTISATION (F) |
8,232.900 |
6,869.500 |
6,899.700 |
|
|
|
|
|
|
|
|
|
|
PROFIT BEFORE
TAX (E-F) (G) |
16,853.800 |
20,466.300 |
27,369.500 |
|
|
|
|
|
|
|
|
|
Less |
TAX (H) |
2,720.500 |
3,474.300 |
4,997.500 |
|
|
|
|
|
|
|
|
|
|
PROFIT AFTER TAX
(G-H) (I) |
14,133.300 |
16,992.000 |
22,372.000 |
|
|
|
|
|
|
|
|
|
Add |
PREVIOUS
YEARS’ BALANCE BROUGHT FORWARD |
7,500.000 |
4,000.000 |
3,500.000 |
|
|
|
|
|
|
|
|
|
Less |
APPROPRIATIONS |
|
|
|
|
|
|
|
Debenture Redemption Reserve |
1,500.000 |
1,500.000 |
0.000 |
|
|
|
General Reserve |
10,559.700 |
8,994.800 |
18,520.300 |
|
|
|
Proposed Dividend |
2,064.600 |
2,680.500 |
2,967.600 |
|
|
|
Corporate Dividend Tax |
9.000 |
316.700 |
384.100 |
|
|
BALANCE CARRIED
TO THE B/S |
7,500.000 |
7,500.000 |
4,000.000 |
|
|
|
|
|
|
|
|
|
|
EARNINGS IN
FOREIGN CURRENCY |
|
|
|
|
|
|
|
Export Earnings |
82,919.500 |
75,715.500 |
78,566.000 |
|
|
|
Commission Earnings |
2,043.500 |
7.500 |
0.400 |
|
|
TOTAL EARNINGS |
84,963.000 |
75,723.000 |
78,566.400 |
|
|
|
|
|
|
|
|
|
|
IMPORTS |
|
|
|
|
|
|
|
Raw Materials |
57,574.700 |
160,752.500 |
150,812.900 |
|
|
|
Coal and Fuel |
1,730.300 |
4,011.900 |
2,590.300 |
|
|
|
Stores and Spares |
985.900 |
724.300 |
896.200 |
|
|
|
Capital Goods |
3,517.800 |
17,738.300 |
13,002.500 |
|
|
|
Trading Goods |
0.000 |
0.000 |
2,047.000 |
|
|
TOTAL IMPORTS |
63,808.700 |
183,227.000 |
169,348.900 |
|
|
|
|
|
|
|
|
|
|
Earnings Per
Share (Rs.) |
|
|
|
|
|
|
Basic |
7.09 |
8.88 |
11.69 |
|
|
|
Diluted
|
7.09 |
8.87 |
11.68 |
|
QUARTERLY RESULTS
|
Particulars |
|
30.06.2014 (Unaudited) |
30.09.2014 (Unaudited) |
|
|
|
1st
Quarter |
2nd
Quarter |
|
Net Sales |
|
79961.400 |
85543.100 |
|
Total Expenditure |
|
72477.300 |
76573.100 |
|
PBIDT (Excl OI) |
|
7484.100 |
8970.000 |
|
Other Income |
|
2163.000 |
2233.500 |
|
Operating Profit |
|
9647.100 |
11203.500 |
|
Interest |
|
3375.600 |
3857.200 |
|
Exceptional Items |
|
0.000 |
(4312.200) |
|
PBDT |
|
6271.500 |
3034.100 |
|
Depreciation |
|
1870.600 |
1960.400 |
|
Profit Before Tax |
|
4400.900 |
1073.700 |
|
Tax |
|
1125.900 |
286.000 |
|
Provisions and contingencies |
|
0.000 |
0.000 |
|
Profit After Tax |
|
3275.000 |
787.700 |
|
Extraordinary Items |
|
0.000 |
0.000 |
|
Prior Period Expenses |
|
0.000 |
0.000 |
|
Other Adjustments |
|
0.000 |
0.000 |
|
Net Profit |
|
3275.000 |
787.700 |
KEY RATIOS
|
PARTICULARS |
|
31.03.2014 |
31.03.2013 |
31.03.2012 |
|
Net Profit Margin (PAT/Sales) |
(%) |
5.07 |
6.52 |
8.41 |
|
|
|
|
|
|
|
Operating Profit Margin (PBDIT/Sales) |
(%) |
11.56 |
12.16 |
13.99 |
|
|
|
|
|
|
|
Return on Total Assets (PBT/Total Assets} |
(%) |
4.09 |
7.07 |
10.57 |
|
|
|
|
|
|
|
Return on Investment (ROI) (PBT/Networth) |
|
0.05 |
0.06 |
0.09 |
|
|
|
|
|
|
|
Debt Equity Ratio (Total Debt /Networth) |
|
0.72 |
0.71 |
0.45 |
|
|
|
|
|
|
|
Current Ratio (Current Asset/Current Liability) |
|
1.74 |
2.07 |
1.64 |
FINANCIAL ANALYSIS
[all figures are
in Rupees Million]
DEBT EQUITY RATIO
|
Particular |
31.03.2012 |
31.03.2013 |
31.03.2014 |
|
|
Rs.
In Million |
Rs.
In Million |
Rs.
In Million |
|
Share Capital |
1914.800 |
1914.800 |
2064.800 |
|
Reserves & Surplus |
312996.800 |
332396.000 |
365259.700 |
|
Money received against share
warrants |
0.000 |
0.000 |
0.000 |
|
Share Application money pending
allotment |
5413.100 |
5413.100 |
0.000 |
|
Net
worth |
320324.700 |
339723.900 |
367324.500 |
|
|
|
|
|
|
long-term borrowings |
111151.300 |
204430.500 |
221085.800 |
|
Short term borrowings |
34567.800 |
37017.200 |
42583.700 |
|
Total
borrowings |
145719.100 |
241447.700 |
263669.500 |
|
Debt/Equity
ratio |
0.455 |
0.711 |
0.718 |
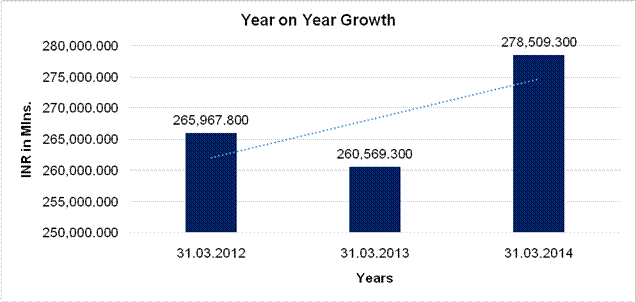
YEAR-ON-YEAR GROWTH
|
Year
on Year Growth |
31.03.2012 |
31.03.2013 |
31.03.2014 |
|
|
Rs.
In Million |
Rs.
In Million |
Rs.
In Million |
|
Sales |
265,967.800 |
260,569.300 |
278,509.300 |
|
|
|
(2.030) |
6.885 |
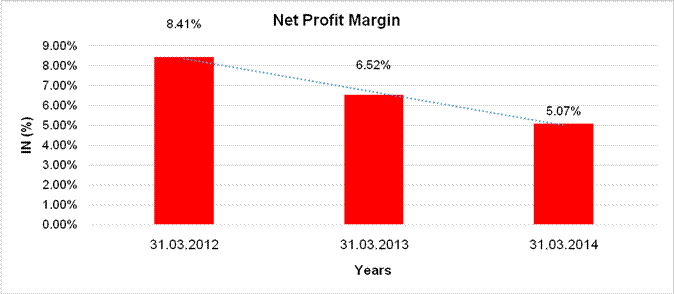
NET PROFIT MARGIN
|
Net
Profit Margin |
31.03.2012 |
31.03.2013 |
31.03.2014 |
|
|
Rs.
In Million |
Rs.
In Million |
Rs.
In Million |
|
Sales
|
265,967.800 |
260,569.300 |
278,509.300 |
|
Profit |
22,372.000 |
16,992.000 |
14,133.300 |
|
|
8.41% |
6.52% |
5.07% |
LOCAL AGENCY FURTHER INFORMATION
|
Sr. No. |
Check List by Info Agents |
Available in
Report (Yes / No) |
|
1] |
Year of Establishment |
Yes |
|
2] |
Locality of the firm |
Yes |
|
3] |
Constitutions of the firm |
Yes |
|
4] |
Premises details |
No |
|
5] |
Type of Business |
Yes |
|
6] |
Line of Business |
Yes |
|
7] |
Promoter's background |
Yes |
|
8] |
No. of employees |
No |
|
9] |
Name of person contacted |
No |
|
10] |
Designation of contact
person |
No |
|
11] |
Turnover of firm for last
three years |
Yes |
|
12] |
Profitability for last
three years |
Yes |
|
13] |
Reasons for variation
<> 20% |
-- |
|
14] |
Estimation for coming
financial year |
No |
|
15] |
Capital in the business |
Yes |
|
16] |
Details of sister
concerns |
Yes |
|
17] |
Major suppliers |
No |
|
18] |
Major customers |
No |
|
19] |
Payments terms |
No |
|
20] |
Export / Import details
(if applicable) |
No |
|
21] |
Market information |
-- |
|
22] |
Litigations that the firm
/ promoter involved in |
Yes |
|
23] |
Banking Details |
Yes |
|
24] |
Banking facility details |
Yes |
|
25] |
Conduct of the banking
account |
-- |
|
26] |
Buyer visit details |
-- |
|
27] |
Financials, if provided |
Yes |
|
28] |
Incorporation details, if
applicable |
Yes |
|
29] |
Last accounts filed at
ROC |
Yes |
|
30] |
Major Shareholders, if
available |
Yes |
|
31] |
Date of Birth of
Proprietor/Partner/Director, if available |
Yes |
|
32] |
PAN of Proprietor/Partner/Director,
if available |
No |
|
33] |
Voter ID No of
Proprietor/Partner/Director, if available |
No |
|
34] |
External Agency Rating,
if available |
Yes |
LITIGATION DETAILS
|
CASE DETAILS BENCH:-BOMBAY
|
UNSECURED LOAN:
|
Particulars |
31.03.2014 Rs.
In Million |
31.03.2014 Rs.
In Million |
|
LONG TERM
BORROWINGS |
|
|
|
Deferred Payment Liabilities |
13.300 |
18.900 |
|
SHORT-TERM
BORROWINGS |
|
|
|
Buyers’ Credit |
19277.500 |
22844.700 |
|
Packing Credit |
23194.000 |
12974.000 |
|
Others |
0.0000 |
400.000 |
|
Total |
42484.800 |
36237.600 |
Note:
Long-term
Borrowings
Deferred Payment Liabilities represent sales tax deferral which
is payable in yearly instalment by FY 2018.
FINANCIAL PERFORMANCE
Standalone performance for the year ended March 31, 2014 witnessed the net sales grew by 7% with Profit before depreciation, interest and tax growth at 13%. Interest costs went up significantly consequent to higher borrowing and capitalization of some assets at projects. Due to higher interest cost and exceptional items, the standalone Net Profit was lower at Rs.14130.000 Million.
An exceptional item of Rs.3960.000 Million relates to a liability of Rs.3240.000 Million under The UP Tax on Entry of Goods into Local Areas Act, 2007 (UP Entry Tax) and a Liability of Rs.720.000 Million under The Madhya Pradesh Gramin Avsanrachna Tatha Sarak Vikas Adhiniyam (MPGATSVA). Both these levies have been contested by the Company and appeals against these are pending before the Hon’ble Supreme Court. The Consolidated Revenue as well as Profit before Depreciation, Interest and Taxes extended by 9% and 5% respectively in comparison to the last year’s corresponding figures. Net profit was lower at Rs.21750.000 Million, because of higher interest and depreciation and exceptional items.
AWARDS AND
RECOGNITIONS
Renukoot Aluminum Complex wins Greentech HR Platinum Award, in the Best Strategy category, the highest in this segment. Taloja Rolling Plant wins National Safety Awards presented by the National Safety Council (Maharashtra Chapter) for Longest Accident Free Period 2012 and Lowest Accident Frequency Rate, 2012.
Taloja Rolling Plant awarded Best Supplier in aluminum metal category by Tata Toyo Radiators for the year 2013-14. Alupuram Extrusions team earned third place in the Productivity Competition conducted by the Indian Institution of Industrial Engineering, Kerala Chapter, held in April 2013. Muri Alumina Plant wins Greentech Environment Gold Award for environmental excellence, in recognition of its achieving a major target to reduce water and energy consumption.
Belgaum Alumina Plant wins the Government of Karnataka State Export Excellence Gold Awards, under the product category Chemicals and Plastics for medium/large enterprises for the years 2011-12 and 2012-13. The award was presented on 21st February 2014.
Belgaum Plant - Boilers is awarded “First Prize” in “Best Safe Industrial Boiler”, by the Karnataka State Safety Institute, Department of Factories and Boilers, Government of Karnataka, at the State Level Safety Competition held on the eve of 43rd National Safety Day Celebrations - 2014.
Lohardaga Mines Division wins 1st Prize of Overall performance during Metalliferous Mine Safety Week Celebration-2013 held under the aegis of Directorate General of Mines Safety, Ranchi Region. Lohardaga Mines Division wins 1st and 2nd Prizerespectively of Overall performance under the category of Fully Mechanized mines during Mine Environment and Mineral Conservation Week Celebration 2013-14, held under the aegis of Indian Bureau of Mines, Ranchi Region.
MANAGEMENT
DISCUSSION AND ANALYSIS
BUSINESS OVERVIEW
The global economy faced varied challenges during the last fiscal year.
While the US economy seems to be recovering on the back of fiscal stimulus and
EU slowly emerged out of its crisis, it was the turn of emerging markets,
hitherto the prime drivers of economic growth, to face growth impediments.
BRIC economies along with Indonesia, the fabulous five and the growth
drivers of Global economy for past decade, turned ‘fragile five’. Easy monetary
policy post the global financial crisis, which was meant to revive growth, also
caused macroeconomic imbalances and inflation in some pockets. The ensuing
efforts to control inflation and country-specific structural issues resulted in
economic slowdown in many of the emerging markets.
Commodities continued to languish given the slow growth in China that
hit a 13 year low, and consumption slowed down in many emerging markets. In
India, the challenges were even tougher. Declining GDP growth, slowdown in
manufacturing sector and power sector impacted demand, while the cost pressures
continued, primarily driven by high energy prices. Not only that the prices of
crude and its derivatives continued to remain at elevated levels, depreciating
rupee resulted in an additional burden on the Indian consumers. Coal prices
continued to increase in India, even as the global coal prices cooled off.
Against the backdrop of such challenging macroeconomic environment, the
Company went through a transformational phase. FY14 was a watershed year for
the Company. An investment of over USD 5 Bn, after facing various unforeseen
challenges, got ready for delivery. The three Greenfield projects and three
brown field projects came on stream during the course of the year.
Braving these odds, the Company registered a remarkable performance.
Profit before interest, depreciation and tax increased by 13% over the previous
year (Standalone). On a consolidated basis, the Company registered a turnover
of US$ 14.5 billion (Rs.876950.000 Million) and an EBITDA of US$ 1.5 billion
(Rs.93030.000 Million).
Novelis, the Company’s 100% subsidiary also faced several headwinds in
the form of extended winter in the North American markets that led to sharp
deterioration in the can market, rising physical premium leading to pricing pressures
in the Asian markets, etc. Yet, it managed to deliver a robust adjusted EBITDA
of US$ 885 Million.
BUSINESS
HIGHLIGHTS
The Company delivered a strong operational performance during FY14 in
the face of several adversities. Three Greenfield projects (Mahan, Utkal and
Aditya) became operational and are currently ramping up. These projects, in
their fullness, would redefi ne the Company’s cost competitiveness on the
global compass and significantly enhance the sustainability of its operations.
A unique strategy to catapult Indian aluminium market to the next level
is already in place and soon the Company will develop capability to produce
worldclass products such as canbody stock and ultra-thin gauge foils from its
facilities in Hirakud and Mouda respectively. This would not only enhance the
product portfolio but would also re-define Indian aluminium market.
At Novelis, projects are getting ready to capture the growth in emerging
markets and enhance product portfolio across the globe. These projects will
enable the Company to leverage the growth in nascent product markets such as
automobiles, driven by environmental consciousness, and in beverage demand in
Brazil spurred by the Soccer world cup and the Summer Olympics. Significant
strides have been made to strengthen the recycling capabilities that will help
Novelis improve its cost structure and enhance competitiveness and profi
tability.
The highlights for the fi nancial year were:
• Highest ever Aluminium Metal volumes produced and sold Aluminium Metal production in India is up 13%
• Highest ever Alumina production as Utkal started delivering strong
volumes Alumina production up 23%
• Strong operating performance by Copper business helped yield record
EBIT.
• Three Greenfi eld projects, with an investment of over Rs.300000.000
Million are now ramping up and are on course to achieve desired results,
• In addition, the brownfi eld projects, viz, Hirakud smelter expansion,
Hirakud FRP Plant and Mouda Foils are also on stream and would strengthen the aluminium
VAP portfolio further.
• Novelis too, achieved significant progress on all its strategic
expansions. These include the ramp up of rolling production at the Pinda plant
in Brazil, coupled with the mill expansions in Korea and the start of commercial
production at its US automotive finishing lines.
• Consolidated revenue stood at Rs.876950.000 Million as compared with
Rs.801920.000 Million in FY13.
• Profit before depreciation, interest and taxes stood at Rs.93030.000
Million as against Rs.88490.000 Million in FY13.
• Net profi t was lower at Rs.21750.000 Million as compared with
Rs.30270.000 Million in FY13 on account of higher interest, depreciation and
certain exceptional items.
• Of the total annual revenue of Rs.876950.000 Million, Aluminium Business
contributed Rs.692180.000 Million, vs. Rs.622590.000 Million last year.
Aluminium EBIT for FY14 was Rs.37640.000 Million as compared with Rs.43880.000
Million posted in FY13.
• Copper business delivered a robust performance, generating an EBIT of Rs.10250.000
Million. The copper business’ performance cushioned the pressure on aluminium
margins, vindicating the virtue of a balanced portfolio of the Company.
• During the year, the Company refinanced project loans for all three
Greenfield projects; this would yield significant savings in interest payments.
BUSINESS
PERFORMANCE REVIEW
ALUMINIUM BUSINESS
INDUSTRY REVIEW
Global Aluminium demand grew at around 5% in 2013 to around 50 Mn
tonnes. The demand growth rate moderated primarily as Chinese demand growth
moderated to 10% after clocking a growth rate of 19% and 16% in the earlier
years. Elsewhere, aluminium consumption increased in the OECD markets notably
in the US and Europe. North American consumption grew at around 2% after 6%
growth in the previous year, while EU registered a turnaround with 1.1% growth
as compared with de-growth in the previous year. Apart from Asia, which grew at
7%, demand growth from Africa was strong at about 5%.
In China, visible slowdown in the construction sector after government
enforced restrictions and decline in demand from packaging sector resulted in
slowing of demand growth. However, the demand from automobile sector and
consumer goods sectors remained strong. In the US, though demand growth was
secular across all industries; the primary drivers were automobile and
aerospace sectors.
In India, with a slowdown in power sector (that consumes over 40% of
aluminium) and auto sector, Indian consumption declined for the first time in
over a decade.
Globally, aluminium production increased by around 4.5% to more than 50
Mn tonnes. Chinese production increased by almost 10% to 24.4 Mn tonnes which
was around 47% of global production. In the rest of the world, there was a
marginal decline in production, which was lower by around 0.3%. Barring Middle
East, there were production curtailments in most global geographies. In
Australia, South America and Europe, production declined by around 5%.
Chinese capacities increased by over 14% as new capacities continued to
come on stream, especially in Western China, while the closure of old
capacities lagged behind.
The industry continued to be plagued with high inventories and the
global aluminium inventory, including the off-exchange stocks, has been
estimated at over 12 million tonnes, which had a huge overhang on the prices.
Strong contango and low financing cost ensured that more and more stocks
got diverted to the warehouses under financial contracts. This, coupled with
strong demand and low load out rates due to various reasons
including logistic challenges, ensured high regional premiums, which
reached historic high levels. Across the globe, local premiums were higher than
$220/ tonne.
Sluggish global economic conditions, surplus production, rising
inventories and periodic bouts of risk averseness leading to bearish sentiments
resulted in low aluminium prices.
Cost of production for most aluminium players continued to remain high
due to challenges pertaining to energy inputs and resources.
In the western world, rising grid tariffs with increasing energy demand
continued to impact power costs that account for almost 30-40% of aluminium
cost of production. South Africa too continued to struggle with energy
inflation. In China, smelters on the eastern side continued to suffer as energy
prices continued to climb up with the defi cit widening in the east coast
region.
China now is in the process of building new capacities in the
Western/North Western region, endowed with abundant coal reserves and this is
expected to bring down the power cost substantially. Indian smelters continued
to bear the brunt of rising coal prices and rising diesel prices accentuated by
decontrolling steps in the oil sector.
The other important input cost for the aluminium smelters is alumina
cost. Alumina prices were supported by factors like China’s imports, and export
ban/increased export taxes from some countries like Indonesia, India on
bauxite. Alumina prices have moved up to almost 17-18% of aluminium prices and
are expected to remain firm in the wake of strong demand from Chinese and
middle eastern smelters as also constrained supplies of ore (bauxite) due to
various reasons such as higher costs, declining grades, resource nationalism,
logistic challenges, regulatory road blocks, etc.
Several global producers continued to make losses due to rising costs
and subdued prices. In fact, the recent aluminium pricing scenario is the
longest period wherein aluminium prices are still well below the marginal cost
of production and where over 25% of producers are estimated to be making cash
losses.
OPERATIONAL REVIEW
Against this backdrop, the Company’s aluminium business operational
performance was truly creditable and superior to most global peers.
OUTLOOK
After a slowdown, the Indian recovery is on the mend and the economy is
expected to grow at over 5% in 2014 on stronger consumption and investment, as
per various estimates.
Similarly, the average economic growth in South Asia is projected to
pick up gradually over the next few years, after remaining near a two-decade
low in 2013. The moderate recovery is expected to be underpinned by stronger
consumption and investment in the context of enhanced macroeconomic stability.
The business and consumer confidence is expected to improve with enhanced
external balances and relatively stable currencies.
The external demand is also projected to improve in 2014-15 as economic
activity in developed economies gains momentum. US Fed is not expected to raise
rates until the next year. A possible fallout may be that low rates for too
long could push asset prices too high, or encourage investors to take on too
much risk. The Fed is unwinding its massive bond-buying stimulus this year and
is expected to start raising interest rates next year from the near-zero levels
the central bank has maintained since December 2008. As the Fed normalizes
monetary policy, one may witness a few hiccups. Similarly, at present, certain
geo-political risks also weigh on the demand recovery and growth prospects.
In 2014, the global aluminium demand is expected to grow at around 6-7%.
This demand growth will be led by recovery in the OECD economies. The US and
the EU are both expected to witness a healthy demand pick up. After severe
winter weather affected activity in the USA in Q1 2014, the outlook for the
rest of the year and beyond is positive with primary aluminium demand growing
from 5.0 Mt in 2013 to 5.9 Mt in 2018, a CAGR of 3.4%. Demand from the
construction sector in the USA is also forecast to grow notably by 2018. The
heavy winter storms that affected the USA for much of Q1 2014 had a significant
impact on construction activity but with the weather easing and the traditional
building season about to begin, there is optimism about demand from the sector
in 2014.
Western Europe is expected to grow at over 2% in 2014. Growth in demand
for primary aluminium in the region is expected to rise at a slightly faster
rate than the economic growth rate. Germany is expected to lead growth in the
region this year with an increase of over 3% for primary aluminium demand. The
two major end use sectors in Western Europe; construction and transport, are
set to lead the region’s growth in primary consumption over the forecast
period. An increase in demand in the transport sector, as vehicle production in
Western Europe increases and aluminium content in automobiles rises, will
result in increase in demand.
China, which has been the prime demand driver for aluminium over last
several years, shall witness a decline in demand growth rate and yet the demand
is expected to grow at around 8% (on a higher base). The demand is expected to
be led by investment in infrastructure and also rising urbanisation leading to
consumption led growth. The demand from Japan and Korea is expected to remain
steady particularly in Japan with ‘Abenomics’ showing its impact. The demand
from South East Asia is expected to be strong. Indonesia may witness a strong
surge in demand after the elections, according to some analysts. Middle East
demand too is expected to remain strong with thrust on downstream consumer
centric growth.
In India, demand prospects have changed dramatically after the strong
political mandate and the improvement in investor sentiment. Demand is expected
to witness a significant boost with expectations of reforms, especially in the
power sector. Aluminium consumption growth in 2014 is expected to be in line
with the expected GDP growth of over 5%. In 2013, global aluminium production
was at around 50.2 Mn tonnes, which is expected to increase to 52.7 Mn tonnes
in 2014 as per the available projections.
Consumption is expected to outpace production in 2014 rising to 52.8 Mn
tonnes from 49.9 Mn tonnes in 2013, leading to a modest deficit after many years
and this deficit is expected to increase further in 2015 as consumption is
expected to continue to remain strong, while capacity curtailments in some
regions are expected to keep overall production increase in check. The deficit
excluding China will be significantly higher, as per various projections. In
China though, there will be a surplus as new capacities in Western China come
to the fore. Outside China, several capacity curtailments were announced. These
cuts aggregate to over 2 million tonnes.
Prolonged period of depressed prices and cost inflation has led several
producers to mothball lossmaking facilities and curtail production. In many
cases, the capacity closures are permanent as many of these were dependent on
grid power based on long term contracts. With the resultant higher power
tariffs after these contracts got over, these capacities have become unviable.
Even in China, government has announced several measures to curb
pollution, which are already forcing some of the older smelters to close. A
total of around 3 Mn tonne capacity curtailments are expected in China, while
at the same time over 4 Mn tonne of capacity is expected to come on stream
primarily in the North West China. These capacities though are expected to take
some time for ramp up, especially in view of the subdued prices.
The other major factor that is likely to put a lid on Chinese aluminium
production is Indonesian bauxite export restrictions. Over the last few years,
bulk of Chinese refineries were dependent on bauxite from Indonesia. If these
restrictions continue, China may face bauxite crunch and may try to import
bauxite from other regions which will have significant bearing on costs; this
may result in further production cuts. Outside China, the production is expected
to increase in the Middle East and India, while the Western world, Brazil and
Australia are expected to produce less.
In addition to the robust demand, the inventory financing trade is
likely to continue in view of the low interest rate regime. As a result,
physical availability is expected to remain constrained keeping physical
premium high.
LME prices, in the recent times have moved up after touching $1700
levels. More importantly, physical premiums have moved up sharply and now are
at historic high levels after the proposed changes in LME rules were halted
after a UK court ruling. The rule was due to have started on April 1st, 2014 in
order to reduce queues at affected warehouses. The ruling could maintain
premiums at elevated levels. Industry sources forecast the US Midwest premium
to average 18¢/lb in 2014 before easing to average 11¢/lb in 2018. In 2014, the
premium represented 18% of the delivered price compared to less than 3% in
2007.
BUSINESS
PERFORMANCE:
Copper business got impacted due to planned shutdown in the first
quarter. The production was restored following the revamp of smelter. The
business registered a strong operating performance with production for the year
being 4.5% higher than the previous year.
Operating gains on the back of enhanced efficiencies, aided by various
strategic initiatives for value maximisation and waste to wealth initiatives
enabled the business to register best ever operating performance, with
operating profits surpassing Rs.10000.000 Million mark for the first time in
the history of the business. The TC/RC for the year was better though
co-product prices were significantly lower as industrial growth slowed down.
Better TC/RC and higher proportion of VAP allowed the business to partially
offset the negative impact of lower co-product prices and inflationary
tendencies on the input front.
With improved product and market mix, and better operating efficiencies,
copper business managed to deliver a robust performance. Despite a shutdown in
Q1, the EBIT for the year stood at Rs.9380.000 Million against Rs.7680.000
Million in the previous year, a jump of 22%.
COPPER OUTLOOK
In the short-term, the pace of copper supply growth relative to demand
is expected to keep the market in surplus before 2017. Industry experts
forecast growth in refined copper consumption to be a little shy of 5% in 2014,
driven largely by China and North America. Two key factors are likely to drive
consumption of copper: First, restricted scrap availability globally (global
scrap supply has fallen by 9-10% year-on-year in Q1 CY2014) and secondly,
greater affordability for consumers that the drop in copper prices has
generated.
Current copper prices appear to represent a bargain and an excellent
buying opportunity for China’s State Reserve Bureau and industrial consumers,
according to some analysts.
Copper demand in China is expected to be strong given the thrust on
rural electrification and the grid development. In addition to China, the demand
from South Korea and Japan is also expected to grow firmly. The Korean economy
is expected to register a strong recovery this year, with the Bank of Korea
recently raising its annual growth forecast to 4% - higher than the 3% increase
last year. Overall Asian copper demand is expected to grow at over 8%. Copper
demand from EU region is expected to be growing at around 4% as EU continues to
recover, while the North American demand is likely to grow at around 3%.
Smelter capacity is expected to continue its growth at a CAGR of 5.8% p.a. till
2016. On account of surplus and risk averse macroeconomic environment, copper
prices are unlikely to flare up in the next 1 – 2 years. Overall mine
production capacity is forecast to rise from 18 million tonnes in 2013 to 21
millon tonnes by 2015, an increase of 17%. Beyond 2015, mine production may be
subdued due to reserve depletion. Available forecasts suggest that with new
mine supply
coming on stream, the concentrate availability should be good -
reflecting in improved TC/RC. However, Indonesian export ban and tax issues may
create certain hiccups.
The benchmark TC/RC for 2014 is higher than 2013 benchmarks. With TC/RC
contracts signed at levels 30% higher than 2013 levels, smelters are in a good
spot. Higher TC/RC, coupled with expected revival in the domestic economy
augurs well for the Company’s copper business. Indian refined copper market,
which had a lackluster trend in FY14, is expected to look up in the near-term
on the back of improved investor sentiment. However, rising trend in imports
poses a challenge for the domestic industry.
UNAUDITED FINANCIAL RESULTS FOR THE QUARTER AND NINE MONTHS ENDED 31ST DECEMBER, 2014
(Rs. In Million)
|
Particulars
|
Quarter Ended ( Unaudited) |
Quarter Ended ( Unaudited) |
Nine Months
Ended ( Unaudited) |
|
|
31.12.2014 |
30.09.2014 |
31.12.2014 |
|
|
|
|
|
|
1.
Income from operations |
|
|
|
|
a) Net sales/ Income from operation (net of excise duty) |
84717.100 |
84729.000 |
248751.600 |
|
b) Other operating income |
1313.200 |
814.100 |
2783.200 |
|
Total
income from Operations(net) |
86030.300 |
85543.100 |
251534.800 |
|
2.Expenditure |
|
|
|
|
a) Cost of material consumed |
50553.700 |
56336.600 |
158285.200 |
|
b) Changes in inventories of finished goods,
work-in-progress and stock-in-trade |
(51.900) |
(3243.44) |
(3695.900) |
|
c) Employees benefit expenses |
4214.300 |
3972.500 |
11668.300 |
|
d) Power and Fuel |
13443.300 |
12938.900 |
37750.500 |
|
e) Depreciation and amortization expenses |
2162.600 |
1960.400 |
5993.600 |
|
f) Other expenditure |
9107.600 |
6568.500 |
21839.300 |
|
Total expenses |
28927.800 |
25440.300 |
77251.700 |
|
3. Profit from operations before other income and
financial costs |
7070.700 |
7009.600 |
19693.800 |
|
4. Other income |
2124.800 |
2233.500 |
6521.300 |
|
5. Profit from ordinary activities before finance costs |
9195.500 |
9243.100 |
26215.100 |
|
6. Finance costs |
4474.700 |
3857.200 |
11707.500 |
|
7. Net profit/(loss) from ordinary activities
after finance costs but before exceptional items |
4720.800 |
5385.900 |
14507.600 |
|
8. Exceptional item |
-- |
4312.200 |
4312.200 |
|
9. Profit from ordinary activities before tax
Expense: |
4720.800 |
1073.700 |
10195.400 |
|
10.Tax expenses |
1127.200 |
286.000 |
2539.100 |
|
11.Net
Profit / (Loss) from ordinary activities after tax (9-10) |
3593.600 |
787.700 |
7656.300 |
|
12.Extraordinary Items (net of tax expense) |
-- |
-- |
- |
|
13.Net Profit / (Loss) for the period (11 -12) |
3593.600 |
787.700 |
7656.300 |
|
14.Paid-up equity share capital (Nominal value Rs.10/- per share) |
2065.200 |
2065.100 |
265.200 |
|
15. Reserve excluding
Revaluation Reserves as per balance sheet of previous accounting year |
-- |
-- |
-- |
|
16.i) Earnings per share (before extraordinary
items) of Rs.10/- each) (not annualised): |
-- |
-- |
-- |
|
(a) Basic |
1.74 |
0.38 |
3.71 |
|
(b) Diluted |
1.74 |
0.38 |
3.70 |
|
Particulars
|
Quarter Ended ( Unaudited) |
Quarter Ended ( Unaudited) |
Nine Months
Ended ( Unaudited) |
|
|
31.12.2014 |
30.09.2014 |
31.12.2014 |
|
A. Particulars of shareholding |
|
|
|
|
1. Public Shareholding |
|
|
|
|
- Number of shares |
1139384275 |
1139202066 |
1139384275 |
|
- Percentage of shareholding |
55.18% |
55.17% |
55.17% |
|
2. Promoters and Promoters group Shareholding- |
|
|
|
|
a) Pledged /Encumbered |
|
|
|
|
Number of shares |
- |
- |
- |
|
Percentage of shares (as a % of total shareholding of the
promoter and promoter group) |
- |
- |
- |
|
Percentage of shares (as a % of total share capital of the
company) |
- |
- |
- |
|
|
|
|
|
|
b) Non Encumbered |
|
|
|
|
Number of shares |
763797188 |
763797188 |
763797188 |
|
Percentage of shares (as a % of total shareholding of the
promoter and promoter group) |
100.00% |
100.00% |
100.00% |
|
Percentage of shares (as a % of total share capital of the
company) |
36.99% |
36.99% |
37.00% |
|
|
|
|
|
|
B.
Investor Complaints |
|
|
|
|
Pending at the beginning of the quarter |
|
Nil |
|
|
Receiving during the quarter |
|
6 |
|
|
Disposed of during the quarter |
|
6 |
|
|
Remaining unreserved at the end of the quarter |
|
Nil |
|
UNAUDITED SEGMENT
WIE REVENUE, RESULTS AND CAPITAL EMPLOYED
(Rs. In
Million)
|
Particulars
|
Quarter Ended ( Unaudited) |
Quarter Ended ( Unaudited) |
Nine Months
Ended ( Unaudited) |
|
|
31.12.2014 |
30.09.2014 |
31.12.2014 |
|
1. Segment Revenue |
|
|
|
|
a. Aluminium |
36360.300 |
33158.500 |
99631.800 |
|
b. Copper |
49759.100 |
52470.700 |
152132.700 |
|
Total |
86119.400 |
85629.200 |
251764.500 |
|
Less : Inter Segment Revenue |
(89.100) |
(86.100) |
(229.700) |
|
Net Sales |
86030.300 |
85543.100 |
251534.800 |
|
|
|
|
|
|
2. Segment Result |
|
|
|
|
a. Aluminium |
3842.400 |
3386.500 |
10427.900 |
|
b. Copper |
3960.500 |
4136.700 |
11265.000 |
|
Total |
7802.900 |
7523.200 |
21692.900 |
|
Less : Finance Costs |
(4474.700) |
(3857.200) |
(11707.500) |
|
|
|
|
|
|
Add
: Other unallocated Income of unallocated Expenses |
1392.600 |
1719.900 |
4522.200 |
|
Profit before Exceptional Items and Tax |
4720.800 |
5385.900 |
14507.600 |
|
Exceptional Items |
-- |
(4312.200) |
(4312.200) |
|
Profit before Tax |
4720.800 |
1073.700 |
10195.400 |
|
3. Capital Employed |
|
|
|
|
a. Aluminium |
387004.700 |
370371.000 |
387004.700 |
|
b. Copper |
61239.600 |
59577.700 |
61239.600 |
|
|
|
|
|
|
Unallocated/ Corporate |
221352.000 |
228753.000 |
221352.000 |
|
Total Capital Employed |
669596.300 |
658701.700 |
669596.300 |
STATEMENT OF
ASSETS AND LIABILITIES
|
SOURCES OF
FUNDS |
|
|
31.12.2014 |
|
I.
EQUITY
AND LIABILITIES |
|
|
|
|
(1)Shareholders' Funds |
|
|
|
|
(a) Share Capital |
|
|
2065.200 |
|
(b) Reserves & Surplus |
|
|
369385.100 |
|
(c) Money
received against share warrants |
|
|
0.000 |
|
|
|
|
|
|
(2) Share Application money pending
allotment |
|
|
0.000 |
|
Total
Shareholders’ Funds (1) + (2) |
|
|
371450.300 |
|
|
|
|
|
|
(3)
Non-Current Liabilities |
|
|
|
|
(a) long-term borrowings |
|
|
224490.900 |
|
(b) Deferred tax liabilities (Net) |
|
|
13986.800 |
|
(c) Other long term
liabilities |
|
|
4686.000 |
|
(d) long-term
provisions |
|
|
3804.200 |
|
Total Non-current
Liabilities (3) |
|
|
246967.900 |
|
|
|
|
|
|
(4)
Current Liabilities |
|
|
|
|
(a) Short
term borrowings |
|
|
50643.500 |
|
(b) Trade
payables |
|
|
45873.700 |
|
(c) Other
current liabilities |
|
|
31542.700 |
|
(d) Short-term
provisions |
|
|
5270.700 |
|
Total Current
Liabilities (4) |
|
|
133330.600 |
|
|
|
|
|
|
TOTAL |
|
|
751748.800 |
|
|
|
|
|
|
II.
ASSETS |
|
|
|
|
(1)
Non-current assets |
|
|
|
|
(a) Fixed
Assets |
|
|
|
|
(i)
Tangible assets |
|
|
366103.000 |
|
(ii)
Intangible Assets |
|
|
0.000 |
|
(iii)
Capital work-in-progress |
|
|
0.000 |
|
(iv)
Intangible assets under development |
|
|
0.000 |
|
(b) Non-current Investments |
|
|
147289.800 |
|
(c) Deferred tax assets (net) |
|
|
0.000 |
|
(d) Long-term Loan and Advances |
|
|
9178.900 |
|
(e) Other
Non-current assets |
|
|
722.500 |
|
Total Non-Current
Assets |
|
|
523294.200 |
|
|
|
|
|
|
(2)
Current assets |
|
|
|
|
(a)
Current investments |
|
|
51499.900 |
|
(b)
Inventories |
|
|
99329.300 |
|
(c) Trade
receivables |
|
|
18030.800 |
|
(d) Cash
and cash equivalents |
|
|
13866.000 |
|
(e)
Short-term loans and advances |
|
|
39225.000 |
|
(f) Other current
assets |
|
|
6503.600 |
|
Total
Current Assets |
|
|
228454.600 |
|
|
|
|
|
|
TOTAL |
|
|
751748.800 |
Notes:
- Shareholders of the Company have approved-increase in authorised equity share capital from 210,00,00,000 equity shares of Rs.1/- each to 250,00,00,000 equity shares of Rs. 1/- each in Extra Ordinary General Meeting held on 14th August, 2014.
- The Hon’ble Supreme Court of India, in its judgment dated 25th August, 2014 and order dated 24th September,2014, has declared all allocations of the coal blocks made through Screening Committee route since 1993 as illegal and has quashed the allocation of coal blocks which include:
(a) Mahan, Tubed and Talabira II & III Coal Blocks allocated to the Company
jointly with others. These Coal Blocks were being developed by Joint Venture
Companies viz. Mahan Coal Limited, Tubed Coal Mines Limited and MNH Shakti
Limited in which the Company holds equity of 50%, 60% and 15%, respectively.
The Company’s exposure in these Joint Ventures as on 30th September, 2014,
including application money and corporate guarantees given, stands to
Rs.2120.000 Million, Rs.200.000 Million and Rs.370.000 Million, respectively.
Pursuant to the Order of the Hon’ble Supreme Court, the Government of India has
promulgated the Coal Mines (Special Provisions) Ordinance, 2014 on 21st
October, 2014 which, inter alia, provides for payment of compensation to prior
allottees towards investments made in “land and mine infrastructure”.
In view of this, the Company is of the view that no provision is required to be
made at this moment towards the aforesaid exposure in the three Joint Venture
Companies.
(b) Talabira I Coal Block held and operated by the Company shall stand
cancelled on 31st March, 2015.However, an additional levy of Rs.295 per MT of
coal extracted since beginning till that date will have to be paid.
- Exceptional Items (Net) include the following:
(a) Rs.5630.000 Million towards additional levy of Rs.295/- per MT on extracted
coal for the period up to 30th September, 20 Mas explained in 2 (b) above,
(b) Rs.2580.000 Million towards Provision for diminution in causing value of
investment in Aditya Birla Minerals Limited, Australia, a subsidiary of the
Company, arising on significant decline in value of the Company’s investment
therein as reflected in decline in its quoted share price over a considerable
period of time.
(c) Reversal of Rs.290.000 Million out of the liability provided for in the
previous year on account of UP Tax on Entry of Goods into Local Areas Act, 2007
(UP Entry Tax), following completion of assessment.
(d) Foreign exchange gain of Rs.3610.000 Million in connection with receipt of
Rs.13940.000 Million from A V Minerals (Netherlands) N. V., a wholly owned
subsidiary of the Company, towards return of capital by reducing nominal value
of shares.
- In compliance with Schedule II of the Companies Act, 2013 requiring companies to change manner of calculation of depreciation w.e.f. 1st April, 2014, the Company has revised useful life of its assets to bring it in line with the Schedule. As a result, Depreciation and Amortisation for the quarter and for the six months ended 30th September, 2014 is lower by-Rs.1450.000 Million and Rs.3090.000 Million, respectively. Additionally, Rs.570.000 Million (net of deferred tax of Rs.300.000 Million) has been recognised in the opening balance of retained earnings in respect of assets whose life has got exhausted as on 1st April, 2014 as per the revised useful life.
- Smelting operations at Aditya Aluminium and at Hirakud, Odisha, affected by natural calamity in early part of the current quarter, are substantially restored.
- The above results have-been reviewed by the Audit Committee and approved at the meeting of the Board of Directors held on Thursday, 13th November, 2014. Limited Review has been carried out by the statutory auditors of the Company.
- Figures of previous periods have been regrouped / reclassified wherever necessary.
INDEX OF CHARGE:
|
Sr. No. |
Charge ID |
Date of Charge
Creation/Modification |
Charge amount
secured |
Charge Holder |
Address |
Service Request
Number (SRN) |
|
1 |
10505998 |
19/06/2014 * |
75,000,000,000.00 |
AXIS TRUSTEE SERVICES LIMITED |
AXIS HOUSE, BOMBAY DYEING
MILLS COMPOUND, PANDURA |
C11200052 |
|
2 |
10485778 |
13/03/2014 |
99,000,000,000.00 |
STATE BANK OF INDIA |
STATE BANK BHAVAN, MADAM CAMA ROAD, MUMBAI, MAHARASHTRA - 400021, INDIA |
C00807917 |
|
3 |
10435421 |
25/06/2013 |
15,000,000,000.00 |
SBICAP TRUSTEE COMPANY LIMITED |
202 MAKER TOWER
"E" CUFFE PARADE, COLABA, MUMBAI, |
B79008140 |
|
4 |
10390692 |
07/12/2012 |
5,500,000,000.00 |
SBICAP TRUSTEE COMPANY LIMITED |
202, MAKER TOWER, E
CUFFE PARADE, COLABA, MUMBAI, |
B63619084 |
|
5 |
10376091 |
14/05/2013 * |
15,000,000,000.00 |
IDBI TRUSTEESHIP SERVICES LIMITED |
ASIAN BLDG., GROUND
FLOOR, 17, R.KAMANI MARG,, BA |
B78583887 |
|
6 |
10372704 |
14/05/2013 * |
15,000,000,000.00 |
IDBI TRUSTEESHIP SERVICES LIMITED |
ASIAN BLDG., GROUND FLOOR, 17, R.KAMANI MARG,, BALLARD ESTATE,, MUMBAI, MAHARASHTRA - 400001, INDIA |
B78582681 |
|
7 |
10360308 |
14/05/2013 * |
30,000,000,000.00 |
IDBI TRUSTEESHIP SERVICES LIMITED |
ASIAN BLDG., GROUND FLOOR, 17, R.KAMANI MARG,, BALLARD ESTATE,, MUMBAI, MAHARASHTRA - 400001, INDIA |
B78581881 |
|
8 |
80059220 |
09/12/2004 |
1,000,000,000.00 |
BANK OF MAHARASHTRA |
LOK MANGAL, 1501, SHIVAJI NAGAR, PUNE, MAHARASHTRA - 411005, INDIA |
- |
|
9 |
90218583 |
30/09/2004 |
4,900,000,000.00 |
STATE BANK OF INDIA |
CORPORATE ACCOUNTS
GROUPS BRANCH, VOLTAS HOUSE; 2 |
- |
|
10 |
90218478 |
24/12/2003 * |
1,000,000,000.00 |
STATE BANK OF INDIA |
SECURITIES AND
SERVICES DIVISION; MUMJBAI MAIN BR. |
- |
|
11 |
90216319 |
15/07/2002 |
1,000,000,000.00 |
STATE BANK OF INDIA |
SECURITIES AND SERVICES DIVISION; MUMBAI MAIN BRAN, STATE BANK BUILDING; MUMBAI SAMACHAR MARG, MUMBAI, MAHARASHTRA - 400023, INDIA |
- |
|
12 |
90216315 |
04/05/2002 |
1,000,000,000.00 |
STATE BANK OF INDIA |
SECURITIES AND SERVICES DIVISAION; MUMBAI MAIN BR., STATE BANK BUILDING; MUMBAI SAMACHAR MARG, MUMBAI, MAHARASHTRA - 400023, INDIA |
- |
|
13 |
90216314 |
03/05/2002 |
1,500,000,000.00 |
STATE BANK OF INDIA |
SECURITIES AND SERVICES DIVISAION; MUMBAI MAIN BR., STATE BANK BUILDING; MUMBAI SAMACHAR MARG, MUMBAI, MAHARASHTRA - 400023, INDIA |
- |
|
14 |
90216284 |
22/02/2001 * |
1,000,000,000.00 |
STATE BANK OF INDIA |
SECURITIES AND
SERVICES DIVISION; MUMBAI MAIN BR, |
- |
|
15 |
90216277 |
22/10/1999 |
500,000,000.00 |
STATE BANK OF INDIA |
NEW ISSUES AND SECURITIES SERVICES DIVISION, MUMBAI MAIN BRANCH; BOMBAY SAMACHAR MARG, MUMBAI, MAHARASHTRA - 400023, INDIA |
- |
|
16 |
90218298 |
22/10/1999 |
3,500,000,000.00 |
STATE BANK OF INDIA |
SECURITIES AND
SERVICES DIVISION; MUMBAI MAIN BRAN |
- |
|
17 |
90218220 |
27/12/1999 * |
712,000,000.00 |
INDUSTRAIL DEVELOPMENT BANK OF INDIA |
IDBI TOWER, CUFFE PARADE, BOMBAY, MAHARASHTRA - 400005, INDIA |
- |
|
18 |
90216245 |
06/08/1997 |
10,000,000.00 |
STATE BANK OF INDIA |
SECURITIESA AND SERVICES DEVISION; MUMBAI MAIN BR., STATE BANK BUILDING; MUMBAI SAMACHAR MARG, BOMBAY, MAHARASHTRA - 400020, INDIA |
- |
|
19 |
90218115 |
25/07/1997 |
105,000,000.00 |
ALLAHABAD BANK |
NO. 2 NETAJI
SUBHASH ROAD, CALCUTTA, WEST BENGAL, |
- |
|
20 |
90218103 |
04/07/1997 |
80,000,000.00 |
CITIBANK N.A. |
SAKHAR BHAVAN; 7TH
FLORR, NARIMAN POINT, MUMBAI, |
- |
|
21 |
90216236 |
01/11/1996 |
45,000,000.00 |
HOUSING DEVELOPMENT FINANCE CORPORATION LTD. |
RAMON HOUSE;, 169; BACKBAY RECLAMATION, MUMBAI, MAHARASHTRA - 400020, INDIA |
- |
|
22 |
90218031 |
03/09/1996 |
3,750,000.00 |
UNION BANK OF INDIA |
MORWA BRANCH, DISTRICT: SIDHI, SIDHI, MADHYA PRADESH, INDIA |
- |
|
23 |
90219037 |
21/08/1996 |
60,000,000.00 |
HOUSING DEVELOPMENT FINANCEA CORPORATION LTD |
RAMAN HOUSE; 169; BACKBAY RECLAMATION, MUMBAI, MAHARASHTRA - 400020, INDIA |
- |
|
24 |
90218024 |
07/08/1996 |
742,500,000.00 |
STATE BANK OF INDIA |
RENUKOOT, P. O RENUKOOT, SONABHADRA, UTTAR PRADESH - 231217, INDIA |
- |
|
25 |
90218022 |
22/06/1999 * |
940,000,000.00 |
UCO BANK |
RENUKOOT BRANCH, SONBHADRA, UTTAR PRADESH - 231217, INDIA |
- |
|
26 |
90217983 |
14/10/1996 * |
150,000,000.00 |
EXPORT IMPORT BANK OF INDIA |
CENTRE ONE WORLD TRADE CENTRE, CUFFE PARADE, MUMNBAI, MAHARASHTRA - 400005, INDIA |
- |
|
27 |
90216220 |
22/02/1999 * |
700,000,000.00 |
ANZ GRINDLAYS BANK LTD. |
NETAJI SUBHASH ROAD, CALCUTTA, WEST BENGAL - 700001, INDIA |
- |
|
28 |
90217956 |
14/10/1996 * |
700,000,000.00 |
ANZ GRINDLAYS BANK LTD. |
19 NETAJI SUBHASH ROAD, CALCUTTA, WEST BENGAL - 700001, INDIA |
- |
|
29 |
90217923 |
30/06/1995 |
116,000,000.00 |
BANK OF AMERICA NATIONAL TRUST AND SAVINGS ASSOCIATION |
8; INDIA EXCHANGE PLACE, CALCUTTA, WEST BENGAL - 700001, INDIA |
- |
|
30 |
90217917 |
05/06/1995 |
730,000,000.00 |
UCO BANK |
RENUKOOT BRANCH, P
.O RENUKOOT, SONBHADRA, UTTAR |
- |
FIXED ASSETS:
·
Land
·
Building
·
Plant and Machinery
·
Computer
·
Vehicles
·
Furniture and Fixture
CMT REPORT (Corruption, Money Laundering & Terrorism]
The Public Notice information has been collected from various sources
including but not limited to: The Courts, India Prisons Service,
Interpol, etc.
1] INFORMATION ON
DESIGNATED PARTY
No exist designating subject or any of its
beneficial owners, controlling shareholders or senior officers as terrorist or terrorist
organization or whom notice had been received that all financial transactions
involving their assets have been blocked or convicted, found guilty or against
whom a judgement or order had been entered in a proceedings for violating
money-laundering, anti-corruption or bribery or international economic or
anti-terrorism sanction laws or whose assets were seized, blocked, frozen or
ordered forfeited for violation of money laundering or international
anti-terrorism laws.
2] Court Declaration :
No exist to suggest that subject is or was
the subject of any formal or informal allegations, prosecutions or other
official proceeding for making any prohibited payments or other improper
payments to government officials for engaging in prohibited transactions or
with designated parties.
3] Asset Declaration :
No records exist to suggest that the
property or assets of the subject are derived from criminal conduct or a
prohibited transaction.
4] Record on Financial
Crime :
Charges or conviction registered
against subject: None
5] Records on Violation of
Anti-Corruption Laws :
Charges or
investigation registered against subject: None
6] Records on Int’l
Anti-Money Laundering Laws/Standards :
Charges or
investigation registered against subject: None
7] Criminal Records
No
available information exist that suggest that subject or any of its principals
have been formally charged or convicted by a competent governmental authority
for any financial crime or under any formal investigation by a competent
government authority for any violation of anti-corruption laws or international
anti-money laundering laws or standard.
8] Affiliation with
Government :
No
record exists to suggest that any director or indirect owners, controlling
shareholders, director, officer or employee of the company is a government
official or a family member or close business associate of a Government
official.
9] Compensation Package :
Our
market survey revealed that the amount of compensation sought by the subject is
fair and reasonable and comparable to compensation paid to others for similar
services.
10] Press Report :
No press reports / filings exists on
the subject.
CORPORATE GOVERNANCE
MIRA INFORM as part of its Due Diligence do provide comments on Corporate
Governance to identify management and governance. These factors often have been
predictive and in some cases have created vulnerabilities to credit
deterioration.
Our Governance Assessment focuses principally on the interactions
between a company’s management, its Board of Directors, Shareholders and other
financial stakeholders.
CONTRAVENTION
Subject is not known to have contravened any existing local laws,
regulations or policies that prohibit, restrict or otherwise affect the terms
and conditions that could be included in the agreement with the subject.
FOREIGN EXCHANGE RATES
|
Currency |
Unit
|
Indian Rupees |
|
US Dollar |
1 |
Rs.61.87 |
|
UK Pound |
1 |
Rs.94.07 |
|
Euro |
1 |
Rs.70.19 |
INFORMATION DETAILS
|
Information
Gathered by : |
SVA |
|
|
|
|
Analysis Done by
: |
RAS |
|
|
|
|
Report Prepared
by : |
ART |
SCORE & RATING EXPLANATIONS
|
SCORE FACTORS |
RANGE |
POINTS |
|
HISTORY |
1~10 |
8 |
|
PAID-UP CAPITAL |
1~10 |
8 |
|
OPERATING SCALE |
1~10 |
8 |
|
FINANCIAL
CONDITION |
|
|
|
--BUSINESS SCALE |
1~10 |
8 |
|
--PROFITABILITY |
1~10 |
7 |
|
--LIQUIDITY |
1~10 |
9 |
|
--LEVERAGE |
1~10 |
9 |
|
--RESERVES |
1~10 |
9 |
|
--CREDIT LINES |
1~10 |
8 |
|
--MARGINS |
-5~5 |
-- |
|
DEMERIT POINTS |
|
|
|
--BANK CHARGES |
YES/NO |
YES |
|
--LITIGATION |
YES/NO |
YES |
|
--OTHER ADVERSE INFORMATION |
YES/NO |
NO |
|
MERIT POINTS |
|
|
|
--SOLE DISTRIBUTORSHIP |
YES/NO |
NO |
|
--EXPORT ACTIVITIES |
YES/NO |
NO |
|
--AFFILIATION |
YES/NO |
YES |
|
--LISTED |
YES/NO |
YES |
|
--OTHER MERIT FACTORS |
YES/NO |
YES |
|
DEFAULTER
|
|
|
|
--RBI |
YES/NO |
NO |
|
--EPF |
YES/NO |
NO |
|
|
|
|
|
TOTAL |
|
74 |
This score serves as
a reference to assess SC’s credit risk and to set the amount of credit to be extended.
It is calculated from a composite of weighted scores obtained from each of the
major sections of this report. The assessed factors and their relative weights
(as indicated through %) are as follows:
Financial
condition (40%) Ownership
background (20%) Payment
record (10%)
Credit history
(10%) Market trend (10%) Operational size
(10%)
RATING EXPLANATIONS
|
RATING |
STATUS |
PROPOSED CREDIT LINE |
|
|
>86 |
Aaa |
Possesses an extremely sound financial base with the strongest capability
for timely payment of interest and principal sums |
Unlimited |
|
71-85 |
Aa |
Possesses adequate working capital. No caution needed for credit
transaction. It has above average (strong) capability for payment of interest
and principal sums |
Large |
|
56-70 |
A |
Financial & operational base are regarded healthy. General
unfavourable factors will not cause fatal effect. Satisfactory capability for
payment of interest and principal sums |
Fairly Large |
|
41-55 |
Ba |
Overall operation is considered normal. Capable to meet normal
commitments. |
Satisfactory |
|
26-40 |
B |
Capability to overcome financial difficulties seems comparatively
below average. |
Small |
|
11-25 |
Ca |
Adverse factors are apparent. Repayment of interest and principal sums
in default or expected to be in default upon maturity |
Limited with
full security |
|
<10 |
C |
Absolute credit risk exists. Caution needed to be exercised |
Credit not
recommended |
|
NB |
NEW BUSINESS |
||
This report is issued at your request without any
risk and responsibility on the part of MIRA INFORM PRIVATE LIMITED (MIPL)
or its officials.