MIRA INFORM REPORT
|
Report No. : |
318951 |
|
Report Date : |
27.04.2015 |
IDENTIFICATION DETAILS
|
Name : |
GRASIM INDUSTRIES LIMITED (w.e.f. 22.07.1986) GRASIM CELLULOSIC DIVISION - A UNIT OF GRASIM INDUSTRIES LIMITED |
|
|
|
|
Formerly Known
As : |
|
|
|
|
|
Registered
Office : |
Birlagram, Nagda, ujjain – 456331, Madhya Pradesh |
|
Tel No.: |
91-7366-246760 |
|
|
|
|
Country : |
India |
|
|
|
|
Financials (as
on) : |
31.03.2014 |
|
|
|
|
Date of
Incorporation : |
25.08.1947 |
|
|
|
|
Com. Reg. No.: |
10-000410 |
|
|
|
|
Capital
Investment / Paid-up Capital : |
Rs.918.400 Million |
|
|
|
|
CIN No.: [Company Identification
No.] |
L17124MP1947PLC000410 |
|
|
|
|
IEC No.: |
Not Available |
|
|
|
|
TAN No.: [Tax Deduction &
Collection Account No.] |
BPLG00117F/
BPLG00021A/ BPLG01651G |
|
|
|
|
PAN No.: [Permanent Account No.] |
AAACG4464B |
|
|
|
|
Legal Form : |
A Public Limited Liability Company. The Company’s Shares are Listed on
the Stock Exchanges. |
|
|
|
|
Line of Business
: |
Subject is engaged primarily in two businesses, Viscose
Staple Fibre (VSF) and in Cement. It also produces Rayon Grade Pulp, Caustic
Soda and allied Chemicals, which are used in the manufacture of VSF. |
|
|
|
|
No. of Employees
: |
Not Divulged |
RATING & COMMENTS
|
MIRA’s Rating : |
Aa (75) |
|
RATING |
STATUS |
PROPOSED CREDIT LINE |
|
|
71-85 |
Aa |
Possesses adequate working capital. No caution needed for credit
transaction. It has above average (strong) capability for payment of interest
and principal sums |
Large |
|
Status : |
Excellent |
|
|
|
|
Payment Behaviour : |
Regular |
|
|
|
|
Litigation : |
Exist |
|
|
|
|
Comments : |
Subject is a flagship
company of the Aditya Birla Group. It is a well-established company having
excellent track and ranks among India’s largest private sector companies. The company possesses a strong financial profile marked by
comfortable capital structure and debt coverage indicators along with robust
liquidity position with healthy cash accruals and high financial flexibility. Trade relations are trustworthy. Business is active.
Payment terms are reported as regular and as per commitments. In view of prominent parentage, the subject can be
considered for business dealings at usual trade terms and conditions. |
NOTES :
Any query related to this report can be made on
e-mail : infodept@mirainform.com
while quoting report number, name and date.
ECGC Country Risk Classification List – December 31, 2014
|
Country Name |
Previous Rating (30.09.2014) |
Current Rating (31.12.2014) |
|
India |
A1 |
A1 |
|
Risk Category |
ECGC
Classification |
|
Insignificant |
A1 |
|
Low |
A2 |
|
Moderate |
B1 |
|
High |
B2 |
|
Very High |
C1 |
|
Restricted |
C2 |
|
Off-credit |
D |
EXTERNAL AGENCY RATING
|
Rating Agency Name |
CRISIL |
|
Rating |
Long Term Bank Facilities = AAA |
|
Rating Explanation |
Highest degree of safety and carry lowest
credit risk. |
|
Date |
04.03.2015 |
|
Rating Agency Name |
CRISIL |
|
Rating |
Short Term Rating = A1+ |
|
Rating Explanation |
Very Strong degree of safety and lowest
credit risk. |
|
Date |
04.03.2015 |
RBI DEFAULTER’ LIST STATUS
Subject’s name is not enlisted as a defaulter
in the publicly available RBI Defaulters’ list.
EPF (Employee Provident Fund) DEFAULTER’ LIST STATUS
Subject’s name is not enlisted as a defaulter
in the publicly available EPF (Employee Provident Fund) Defaulters’ list as of
31-03-2014.
INFORMATION PARTED BY (GENERAL DETAILS)
|
Name : |
Mr. Naresh |
|
Designation : |
Treasury Officer |
|
Contact No.: |
91-22-24995378 |
|
Date : |
24.04.2015 |
LOCATIONS
|
Registered Office : |
Birlagram, Nagda, ujjain – 456331, Madhya Pradesh, India |
|
Tel. No.: |
91-7366-246760/ 62/ 64/ 66 / 256556 |
|
Fax No.: |
91-7366-244114/ 246024 |
|
E-Mail : |
|
|
Website : |
|
|
|
|
|
Corporate Office : |
91, Sakhar Bhavan, 230, Nariman Point, Mumbai – 400021, Maharashtra,
India |
|
Tel. No.: |
91-22-22819520 |
|
Fax No.: |
91-22-22284629 |
|
|
|
|
Administrative Office: |
Staple Fiber Division, Century Bhawan, 3rd Floor, |
|
Tel. No.: |
91-22-24210182-86/ 22025012/ 24210182/ 24303169/ 22043451/ 65991600 |
|
Fax No.: |
91-22-24220892 |
|
|
|
|
Branch Office : |
Hub Town Solaris, 5th Floor, 501A and 502, Prof N S Phadke
Marg, Andheri (East), Mumbai, Maharashtra, India |
|
Tel. No.: |
91-22-61957700 |
|
Fax No.: |
91-22-61957702 |
|
|
|
|
Plants : |
FIBRE, PULP
CHEMICAL AND TEXTILES PLANTS Staple Fibre
Division Birlagram, Nagda – 456 331, Madhya Pradesh, India Tel. No. 91-7366-246760-246766 Fax No. 91-7366-244114/246024 Harihar
Polyfibres and Grasilene Division Harihar, District Haveri, Kumarapatnam – 581 123, Karnataka, India Tel. No. 91-8373-232637-39 Fax No. 91-8373-232465/ 232875 91-8192-247555 Birla Cellulosic Birladham, Kharach, Kosamba 394 120, District Bharuch, Gujarat, India Tel. No. 91-2629-270001/5 Fax No. 91-2629-270010/270310 Grasim Cellulsic
Division Plot no.1, GIDC, Vilayat Industrial Estate P. O. Vilayat, Taluka
Vagra, District Bharuch – 392012, Chemical Plants Chemical
Division Birlagram 456 331, Nagda, Madhya Pradesh, India Tel No. : 91-7366 245501 – 03 Fax No. : 91-7366 246767 / 245845 Grasim Chemical
Division / EPOXY Division Plot No.1, GIDC, Vilayat Industrial Estate P. O. Vilayat, Taluka
Vagra, District Bharuch – 392012, Textile Plant Vikram Woollens GH I to IV, Ghironghi Malanpur–477 117, District Bhind, Madhya Pradesh,
India Tel.: 91-7539-283602 / 283603 Fax: 91-7539-283339 |
DIRECTORS
As on. 31.03.2014
|
Name : |
Mr. Kumar Mangalam Birla |
|
Designation : |
Chairman |
|
|
|
|
Name : |
Mrs. Rajashree
Birla |
|
Designation : |
Director |
|
Qualification : |
BA |
|
|
|
|
Name : |
Mr. Madhav L.
Apte |
|
Designation : |
Director |
|
Qualification : |
BA |
|
|
|
|
Name : |
Mr. B. V.
Bhargava |
|
Designation : |
Director |
|
Qualification : |
Commerce Law |
|
|
|
|
Name : |
Mr. R. C.
Bhargava |
|
Designation : |
Director |
|
Qualification : |
Mathematics |
|
|
|
|
Name : |
Mr. Cyril Shroff |
|
Designation : |
Director |
|
|
|
|
Name : |
Dr. Thomas M.
Connelly |
|
Designation : |
Director |
|
Qualification : |
PHD Chemical
Engineering |
|
|
|
|
Name : |
Mr. Shailendra K. Jain |
|
Designation : |
Whole Time Director |
|
|
|
|
Name : |
Mr. N. Mohan Raj (w.e.f. 21st June, 2012) |
|
Designation : |
Director |
|
|
|
|
Name : |
Mr. D. D. Rathi |
|
Designation : |
Director |
|
|
|
|
Name : |
Mr. Mr. Adesh
Gupta |
|
Designation : |
Whole Time
Director |
|
|
|
|
Name : |
Mr. K K
Maheshwari |
|
Designation : |
Managing Director
|
KEY EXECUTIVES
|
Name : |
Mr. Ashok Malu |
|
Designation : |
Company Secretary |
|
|
|
|
Name : |
Mr. Adesh Gupta |
|
Designation : |
Manager and Chief Financial Officer |
|
|
|
|
|
Fibre and Pulp
Business |
|
Name : |
Mr. K.K. Maheshwari |
|
Designation : |
Business Director |
|
|
|
|
Name : |
Mr. S.K. Saboo |
|
Designation : |
Group Advisor, Chairman’s Office |
|
|
|
|
Name : |
Dr. Prakash Maheshwari |
|
Designation : |
Chief Operating Officer (India) and Head (Projects) |
|
|
|
|
Name : |
Mr. Vijay Kaul |
|
Designation : |
Group Executive President (Marketing) and Head-Pulp Operations |
|
|
|
|
Name : |
Mr. Vinod Tiwari |
|
Designation : |
Chief Operating Officer (Pulp Operations) |
|
|
|
|
Name : |
Dr. Aspi Patel |
|
Designation : |
Chief Technology Officer |
|
|
|
|
Name : |
Mr. Rajeev Gopal |
|
Designation : |
Chief Marketing Officer |
|
|
|
|
Name : |
Dr. Raju Mistry |
|
Designation : |
Chief People Officer |
|
|
|
|
Name : |
Mr. Anil Rustogi |
|
Designation : |
Dy.CFO and Sr. President |
|
|
|
|
|
Cement Business |
|
Name : |
Mr. O.P. Puranmalka |
|
Designation : |
Business Head |
|
|
|
|
Name : |
Mr. R.K. Shah |
|
Designation : |
Group Executive President and CMO (Mfg. and Projects) |
|
|
|
|
Name : |
Mr. Vivek Agarwal |
|
Designation : |
Chief Marketing Officer |
|
|
|
|
Name : |
Mr. K.C. Birla |
|
Designation : |
Sr. Executive President (Finance) |
|
|
|
|
|
Chemical Business |
|
Name : |
Mr. Lalit Naik |
|
Designation : |
Business Head |
|
|
|
|
Name : |
Mr. K.C. Jhanwar |
|
Designation : |
Group Executive President |
|
|
|
|
Name : |
Mr. G.K. Tulsian |
|
Designation : |
Executive President |
|
|
|
|
Name : |
Mr.Anil Kumar Sinha |
|
Designation : |
Chief People Officer |
|
|
|
|
|
Textile Business |
|
Name : |
Mr. Thomas Varghese |
|
Designation : |
Chief Executive Officer |
|
|
|
|
Name : |
Mr. S. Krishnamoorthy |
|
Designation : |
President |
|
|
|
|
|
Corporate Finance
Division |
|
Name : |
Mr. Pavan K. Jain |
|
Designation : |
Executive President |
|
|
|
|
Name : |
Mr. Hemant K. Kadel |
|
Designation : |
Executive President |
|
|
|
|
Name : |
Mr. Naresh |
|
Designation : |
Treasury Officer |
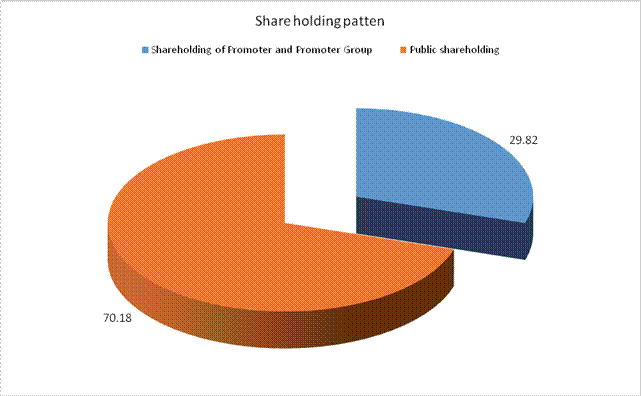
MAJOR SHAREHOLDERS / SHAREHOLDING PATTERN
As on 31.03.2015
|
Category of
Shareholder |
No. of Shares |
Percentage of
Holding |
|
(A) Shareholding of Promoter and Promoter Group |
|
|
|
|
|
|
|
|
133372 |
0.17 |
|
|
23296096 |
29.65 |
|
|
23429468 |
29.82 |
|
|
|
|
|
Total shareholding of Promoter and Promoter Group (A) |
23429468 |
29.82 |
|
(B) Public Shareholding |
|
|
|
|
|
|
|
|
7012141 |
8.93 |
|
|
182354 |
0.23 |
|
|
8364047 |
10.65 |
|
|
20962850 |
26.68 |
|
|
36521392 |
46.49 |
|
|
|
|
|
|
6277852 |
7.99 |
|
|
|
|
|
|
8341422 |
10.62 |
|
|
779330 |
0.99 |
|
|
3213945 |
4.09 |
|
|
2622613 |
3.34 |
|
|
591332 |
0.75 |
|
|
18612549 |
23.69 |
|
Total Public shareholding (B) |
55133941 |
70.18 |
|
Total (A)+(B) |
78563409 |
100.00 |
|
(C) Shares held by Custodians and against which Depository Receipts
have been issued |
0 |
0.00 |
|
|
4802304 |
0.00 |
|
|
8486472 |
0.00 |
|
|
13288776 |
0.00 |
|
Total (A)+(B)+(C) |
91852185 |
0.00 |
BUSINESS DETAILS
|
Line of Business : |
Subject is engaged primarily in two businesses, Viscose
Staple Fibre (VSF) and in Cement. It also produces Rayon Grade Pulp, Caustic
Soda and allied Chemicals, which are used in the manufacture of VSF. |
|
|
|
|
Products : |
-- |
|
|
|
|
Brand Names : |
Not Divulged |
|
|
|
|
Agencies Held : |
Not Divulged |
|
|
|
|
Exports : |
Not Divulged |
|
|
|
|
Imports : |
Not Divulged |
|
|
|
|
Terms : |
|
|
Selling : |
Not Divulged |
|
|
|
|
Purchasing : |
Depend |
PRODUCTION STATUS NOT AVAILABLE
GENERAL INFORMATION
|
Suppliers : |
|
||||||||||||||||||||||||||||||
|
|
|
||||||||||||||||||||||||||||||
|
Customers : |
|
||||||||||||||||||||||||||||||
|
|
|
||||||||||||||||||||||||||||||
|
No. of Employees : |
Not Divulged |
||||||||||||||||||||||||||||||
|
|
|
||||||||||||||||||||||||||||||
|
Bankers : |
·
State Bank of ·
EXIM ·
Hongkong Bank, · IDBI Bank · ICICI Bank Limited ·
Mashreq Bank, ·
Standard Chartered Grindlays Bank, ·
British Bank of Middle East, Dubai |
||||||||||||||||||||||||||||||
|
|
|
||||||||||||||||||||||||||||||
|
Facilities : |
(Rs.
In Million)
|
||||||||||||||||||||||||||||||
|
Auditors : |
|
|
Statutory Auditors 1 : |
|
|
Name : |
G P Kapadia and Company Chartered Accountants |
|
Address : |
Mumbai, Maharashtra, India |
|
|
|
|
Statutory Auditors 2 : |
|
|
Name : |
Deloitte Haskins and Sells Chartered Accountants |
|
Address : |
Mumbai, Maharashtra, India |
|
|
|
|
Branch
Auditors : |
|
|
Name: |
Vidyarthi and Sons Chartered Accountants |
|
Address: |
|
|
|
|
|
Solicitors: |
· Amarchan and Mangaldas and Suresh A Shroff and Company |
|
|
|
|
Wholly Owned
Subsidiary : |
·
Sun God Trading and Investments Limited ·
Samruddhi Swastik Trading and Investments Limited
·
Grasim Bhiwani Textiles Limited ·
Aditya Birla Power Ventures Limited (w.e.f. 29th
July, 2011) |
|
|
|
|
Sub-Subsidiaries : |
·
UltraTech Cement Limited ·
UltraTech Cement Lanka Private Limited, Sri Lanka
·
Dakshin Cement Limited ·
Harish Cement Limited ·
UltraTech Cement Middle East Investment Limited,
Dubai, UAE ·
Star Cement Company LLC, Dubai, UAE ·
Star Cement Company. LLC, RAK, UAE ·
Al Nakhla Crusher LLC, Fujairah, UAE ·
Arabian Cement Industry LLC, Abu Dhabi, UAE ·
Arabian Gulf Cement Company. WLL, Bahrain ·
Emirates Power Company Limited, Bangladesh ·
Emirates Cement Bangladesh Limited, Bangladesh ·
PT UltraTech Mining Indonesia, Indonesia (w.e.f.
12th April, 2011) ·
UltraTech Cement SA (PTY), South Africa (w.e.f. 9th
April, 2011) ·
UltraTech Cement Mozambique Limitada, Mozambique
(w.e.f. 22nd February, 2012) ·
PT UltraTech Investments Indonesia, Indonesia
(w.e.f. 26th March, 2012) · PT UltraTech Cement, Indonesia (w.e.f. 16th July, 2012) ·
Gotan Lime Stone Khanij Udyog Private Limited
(w.e.f. 23rd July, 2012) · Bhagwati Lime Stone Company Private Limited (w.e.f. 3rd April, 2013) |
|
|
|
|
Joint Venture: |
|
|
|
|
|
Associate : |
|
CAPITAL STRUCTURE
As on: 31.03.2014
Authorised Capital :
|
No. of Shares |
Type |
Value |
Amount |
|
95000000 |
Equity Shares |
Rs.10/- each |
Rs.950.000 Million |
|
150000 |
15% “A” Series - Redeemable Cumulative
Preference Shares |
Rs.100/- each |
Rs.15.000 Million |
|
100000 |
8.57% “B” Series
- Redeemable Cumulative Preference Shares |
Rs.100/- each |
Rs.10.000 Million |
|
300000 |
9.30% “C” Series
- Redeemable Cumulative Preference Shares |
Rs.100/- each |
Rs.30.000 Million |
|
|
TOTAL |
|
Rs.1005.000 Million |
Issued, Subscribed & Paid-up Capital :
|
No. of Shares |
Type |
Value |
Amount |
|
|
|
|
|
|
91776533 |
Equity Shares |
Rs.10/- each |
Rs.918.300 Million |
|
|
Share Capital
Suspense 14,879 (14,906) Equity Shares of Rs.10 each to be issued
as fully paid-up pursuant to acquiring of Cement Business of Aditya Birla Nuvo
Limited under the Scheme of Arrangement without payment being received in
cash |
|
Rs.0.100 Million |
|
|
Total |
|
Rs.918.400 Million |
Reconciliation of the
Number of Equity Shares Outstanding (including Share Capital Suspense)
|
Particular |
Number of Shares |
|
Outstanding as at the beginning of the year |
91791412 |
|
Issued during the year under Employee Stock Option Scheme |
50438 |
|
Outstanding as at
the end of the year |
91841850 |
|
Aggregate number of Equity Shares allotted as fully paid-up out of
Share Capital Suspense Account as aforesaid during the period of five years
immediately preceding the reporting date (without payment being received in
cash) |
378 |
List of Shareholders
holding more than 5% shares in the Equity Share Capital of the Company:
|
Particular |
Number of Shares |
|
Turquoise Investment and Finance Private Limited |
5908341 |
|
Trapti Trading and Investments Private Limited |
5477863 |
|
Life Insurance Corporation of India |
7696546 |
|
Equity Shares of Rs.10 each represented by Global Depository Receipts (No voting rights) |
13259243 |
Rights, Preferences
and Restrictions attached to Equity Shares:
The Company has only one class of Equity Shares having a par value of Rs.10 per share. Each holder of Equity Shares is entitled to one vote per share. The Company declares dividend in Indian Rupees. The dividend proposed by the Board of Directors is subject to the approval of the Shareholders in the ensuing Annual General Meeting.
In the event of liquidation of the Company, the holders of Equity Shares will be entitled to receive remaining assets of the Company, after distribution of all preferential amounts. The distribution will be in proportion to the number of Equity Shares held by the Shareholders.
282,502 (Previous
Year 152,406) Equity Shares of Face Value of Rs. 10 each are reserved for issue
under Employee Stock Option Scheme, 2006 (ESOS-2006) (ESOS – 2006) and Employee
Stock Option Scheme – 2013 (ESOS – 2013)
Under the ESOS-2006,
the Company has granted 306,675 Options to its eligible employees in four
tranches, the details of which are given hereunder:
|
|
I |
II |
III |
IV |
|
No. of Options Granted |
201,530 |
16,610 |
71,297 |
6,037 |
|
Grant Date |
23rd Aug, |
25th Jan |
30th Aug, |
2nd June |
|
Grant Price (Rs. Per Share) |
1,928 |
2,885 |
1,440 |
1,594 |
|
Revised Grant Price* |
1,523 |
2,279 |
N.A. |
N.A. |
|
Market Price on the Date of Grant (Rs.) |
2,728 |
2,885 |
2,018 |
2,330 |
|
Method of Accounting |
Intrinsic Value |
|||
|
Graded Vesting Plan |
25% every year, commencing one year from the date of grant |
|||
|
Normal Exercise Period |
5 years from the date of vesting |
|||
* The Grant Price in respect of Tranche I and II was revised in the Financial Year 2010-11 as per the Scheme of Demerger of Cement Business.
FINANCIAL DATA
[all figures are
in Rupees Million]
ABRIDGED BALANCE
SHEET
|
SOURCES OF FUNDS |
31.03.2014 |
31.03.2013 |
31.03.2012 |
|
|
|
|
|
(1)Shareholders' Funds |
|
|
|
|
(a) Share Capital |
918.400 |
917.900 |
917.200 |
|
(b) Reserves & Surplus |
107357.400 |
100300.700 |
90076.700 |
|
(c) Money received against share warrants |
0.000 |
0.000 |
0.000 |
|
|
|
|
|
|
(2) Share Application money pending allotment |
0.000 |
0.000 |
0.000 |
|
Total
Shareholders’ Funds (1) + (2) |
108275.800 |
101218.600 |
90993.900 |
|
|
|
|
|
|
(3) Non-Current Liabilities |
|
|
|
|
(a) long-term borrowings |
10043.800 |
9809.200 |
5673.400 |
|
(b) Deferred tax liabilities (Net) |
4620.000 |
3439.100 |
2392.400 |
|
(c) Other long term liabilities |
146.600 |
129.100 |
121.200 |
|
(d) long-term provisions |
423.100 |
434.400 |
390.400 |
|
Total Non-current
Liabilities (3) |
15233.500 |
13811.800 |
8577.400 |
|
|
|
|
|
|
(4) Current Liabilities |
|
|
|
|
(a) Short term borrowings |
1271.600 |
1795.800 |
630.000 |
|
(b) Trade payables |
4513.900 |
3456.900 |
2950.500 |
|
(c) Other current liabilities |
4819.800 |
5396.500 |
2900.600 |
|
(d) Short-term provisions |
4661.900 |
4981.200 |
4308.300 |
|
Total Current
Liabilities (4) |
15267.200 |
15630.400 |
10789.400 |
|
|
|
|
|
|
TOTAL |
138776.500 |
130660.800 |
110360.700 |
|
|
|
|
|
|
|
|
|
|
(1) Non-current assets |
|
|
|
|
(a) Fixed Assets |
|
|
|
|
(i) Tangible assets |
53551.900 |
20702.500 |
15471.100 |
|
(ii) Intangible Assets |
0.000 |
17.100 |
14.200 |
|
(iii) Capital work-in-progress |
0.000 |
24250.900 |
4769.400 |
|
(iv) Intangible assets under development |
0.000 |
0.000 |
0.000 |
|
(b) Non-current Investments |
44201.000 |
45188.100 |
44744.500 |
|
(c) Deferred tax assets (net) |
0.000 |
0.000 |
0.000 |
|
(d) Long-term Loan and Advances |
4786.000 |
4394.500 |
6142.700 |
|
(e) Other Non-current assets |
0.000 |
0.000 |
0.000 |
|
Total Non-Current
Assets |
102538.900 |
94553.100 |
71141.900 |
|
|
|
|
|
|
(2) Current assets |
|
|
|
|
(a) Current investments |
11835.400 |
17056.200 |
23552.900 |
|
(b) Inventories |
12122.700 |
7893.400 |
6309.100 |
|
(c) Trade receivables |
6137.900 |
5053.900 |
5092.300 |
|
(d) Cash and cash equivalents |
263.000 |
162.700 |
110.200 |
|
(e) Short-term loans and advances |
5514.900 |
5675.600 |
3918.700 |
|
(f) Other current assets |
363.700 |
265.900 |
235.600 |
|
Total
Current Assets |
36237.600 |
36107.700 |
39218.800 |
|
|
|
|
|
|
TOTAL |
138776.500 |
130660.800 |
110360.700 |
PROFIT & LOSS
ACCOUNT
|
|
PARTICULARS |
31.03.2014 |
31.03.2013 |
31.03.2012 |
||
|
|
SALES |
|
|
|
||
|
|
|
Revenue from operations (Net) |
56035.000 |
52550.100 |
49735.600 |
|
|
|
|
Other Income |
3847.900 |
4345.700 |
4634.600 |
|
|
|
|
TOTAL (A) |
59882.900 |
56895.800 |
54370.200 |
|
|
|
|
|
|
|
||
|
Less |
EXPENSES |
|
|
|
||
|
|
|
Cost of Materials Consumed |
29826.100 |
26094.100 |
24053.300 |
|
|
|
|
Purchases of Stock-in-Trade |
68.000 |
48.700 |
157.000 |
|
|
|
|
Changes in Inventories of Finished Goods, Work-in-Progress and Stock-in-Trade |
40.500 |
(265.600) |
(1321.000) |
|
|
|
|
Employee Benefits Expense |
3788.000 |
3717.900 |
3317.600 |
|
|
|
|
Power and Fuel |
8145.800 |
7143.300 |
6756.800 |
|
|
|
|
Freight and Handling Expenses |
943.200 |
829.900 |
679.900 |
|
|
|
|
Other Expenses |
4809.200 |
4398.700 |
3734.100 |
|
|
Less |
|
Captive Consumption |
(199.100) |
(298.700) |
(225.600) |
|
|
|
|
TOTAL (B) |
47421.700 |
41668.300 |
37152.100 |
|
|
|
|
|
|
|
|
|
|
|
PROFIT
BEFORE INTEREST, TAX, DEPRECIATION AND AMORTISATION (A-B) (C) |
12461.200 |
15227.500 |
17218.100 |
||
|
|
|
|
|
|
||
|
Less |
FINANCIAL
EXPENSES (D) |
415.200 |
390.900 |
358.200 |
||
|
|
|
|
|
|
||
|
|
PROFIT
BEFORE TAX, DEPRECIATION AND AMORTISATION (C-D) (E) |
12046.000 |
14836.600 |
16859.900 |
||
|
|
|
|
|
|
||
|
Less |
DEPRECIATION/
AMORTISATION (F) |
2196.100 |
1592.100 |
1442.000 |
||
|
|
|
|
|
|
||
|
Add |
EXCEPTIONAL ITEM |
0.000 |
(2044.300) |
0.000 |
||
|
|
|
|
|
|
||
|
|
PROFIT BEFORE
TAX (E-F) (G) |
9849.900 |
15288.800 |
15417.900 |
||
|
|
|
|
|
|
||
|
Less |
TAX (H) |
890.000 |
3028.900 |
3647.900 |
||
|
|
|
|
|
|
||
|
|
PROFIT AFTER TAX
(G-H) (I) |
8959.900 |
12259.900 |
11770.000 |
||
|
|
|
|
|
|
||
|
Add |
PREVIOUS
YEARS’ BALANCE BROUGHT FORWARD |
15494.000 |
6623.400 |
7037.200 |
||
|
|
|
|
|
|
||
|
Less |
APPROPRIATIONS |
|
|
|
||
|
|
|
Transfer to General Reserve |
7000.000 |
1226.000 |
10000.000 |
|
|
|
|
Corporate Dividend Tax |
74.800 |
98.100 |
120.200 |
|
|
|
|
Proposed Dividend |
1928.700 |
2065.200 |
2063.600 |
|
|
|
|
Transfer to Debenture Redemption Reserve |
0.000 |
0.000 |
0.000 |
|
|
|
BALANCE CARRIED
TO THE B/S |
15450.400 |
15494.000 |
6623.400 |
||
|
|
|
|
|
|
||
|
|
EARNINGS IN
FOREIGN CURRENCY |
|
|
|
||
|
|
|
Export Of Goods On FBO Basis |
15006.300 |
12631.400 |
11187.800 |
|
|
|
|
Technical Know-how and Service Charges |
3.200 |
2.400 |
2.100 |
|
|
|
|
Interest and Dividend |
64.400 |
146.600 |
195.100 |
|
|
|
|
Sale of Fixed Asset |
0.000 |
52.700 |
0.000 |
|
|
|
|
Others |
0.000 |
11.700 |
19.300 |
|
|
|
TOTAL EARNINGS |
15073.900 |
12844.800 |
11404.300 |
||
|
|
|
|
|
|
||
|
|
IMPORTS |
|
|
|
||
|
|
|
Raw Materials |
18026.300 |
11508.300 |
8364.200 |
|
|
|
|
Stores & Spares |
486.200 |
180.100 |
162.700 |
|
|
|
|
Capital Goods |
1759.400 |
6374.900 |
1668.400 |
|
|
|
TOTAL IMPORTS |
20271.900 |
18063.300 |
10195.300 |
||
|
|
|
|
|
|
||
|
|
Earnings Per
Share (Rs.) |
97.58 |
133.62 |
128.33 |
||
QUARTERLY RESULTS
|
PARTICULARS |
30.06.2014 1st Quarter |
30.09.2014 2nd Quarter |
31.12.2014 3rd Quarter |
|
Audited / UnAudited |
UnAudited |
UnAudited |
UnAudited |
|
Net Sales |
14,388.000 |
15,997.900 |
1,552.800 |
|
Total Expenditure |
12,979.700 |
13,858.600 |
13,782.100 |
|
PBIDT (Excl OI) |
1,408.300 |
2,139.300 |
1,810.700 |
|
Other Income |
551.200 |
2,114.400 |
307.800 |
|
Operating Profit |
1,959.500 |
4,253.700 |
2,118.500 |
|
Interest |
56.200 |
90.100 |
116.200 |
|
Exceptional Items |
0.000 |
0.000 |
0.000 |
|
PBDT |
1,903.300 |
4,163.600 |
2,002.300 |
|
Depreciation |
529.100 |
624.400 |
628.600 |
|
Profit Before Tax |
1,374.200 |
3,539.200 |
1,373.700 |
|
Tax |
315.800 |
545.100 |
436.900 |
|
Provisions and contingencies |
0.000 |
0.000 |
0.000 |
|
Profit After Tax |
1,058.400 |
2,994.100 |
936.800 |
|
Extraordinary Items |
0.000 |
0.000 |
0.000 |
|
Prior Period Expenses |
0.000 |
0.000 |
0.000 |
|
Other Adjustments |
0.000 |
0.000 |
0.000 |
|
Net Profit |
1,058.400 |
2,994.100 |
936.800 |
KEY RATIOS
|
PARTICULARS |
|
31.03.2014 |
31.03.2013 |
31.03.2012 |
|
PAT / Sales |
(%) |
15.99 |
23.33 |
23.67 |
|
|
|
|
|
|
|
Net Profit Margin (PBDIT/Sales) |
(%) |
22.24 |
28.98 |
34.62 |
|
|
|
|
|
|
|
Return on Total Assets (PBT/Total Assets} |
(%) |
27.18 |
42.34 |
39.31 |
|
|
|
|
|
|
|
Return on Investment (ROI) (PBT/Networth) |
|
0.09 |
0.15 |
0.17 |
|
|
|
|
|
|
|
Debt Equity Ratio (Total Debt/Networth) |
|
0.10 |
0.11 |
0.07 |
|
|
|
|
|
|
|
Current Ratio (Current Asset/Current Liability) |
|
2.37 |
2.31 |
3.63 |
FINANCIAL ANALYSIS
[all figures are
in Rupees Million]
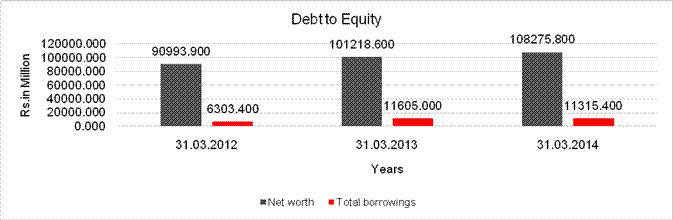
DEBT EQUITY RATIO
|
Particular |
31.03.2012 |
31.03.2013 |
31.03.2014 |
|
|
Rs.
In Million |
Rs.
In Million |
Rs.
In Million |
|
Share Capital |
917.200 |
917.900 |
918.400 |
|
Reserves & Surplus |
90076.700 |
100300.700 |
107357.400 |
|
Net
worth |
90993.900 |
101218.600 |
108275.800 |
|
|
|
|
|
|
long-term borrowings |
5673.400 |
9809.200 |
10043.800 |
|
Short term borrowings |
630.000 |
1908.200 |
1271.600 |
|
Total
borrowings |
6303.400 |
11717.400 |
11315.400 |
|
Debt/Equity
ratio |
0.069 |
0.116 |
0.105 |
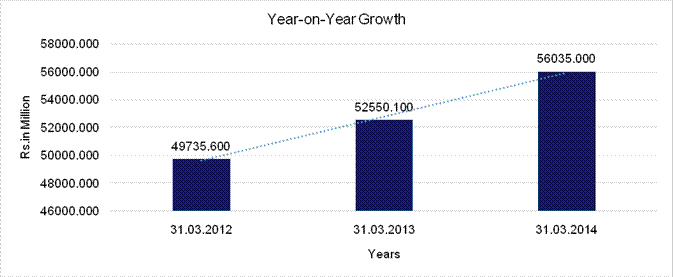
YEAR-ON-YEAR GROWTH
|
Year
on Year Growth |
31.03.2012 |
31.03.2013 |
31.03.2014 |
|
|
Rs.
In Million |
Rs.
In Million |
Rs.
In Million |
|
Revenue From Operation |
49,735.600 |
52,550.100 |
56,035.000 |
|
|
|
5.659 |
6.632 |
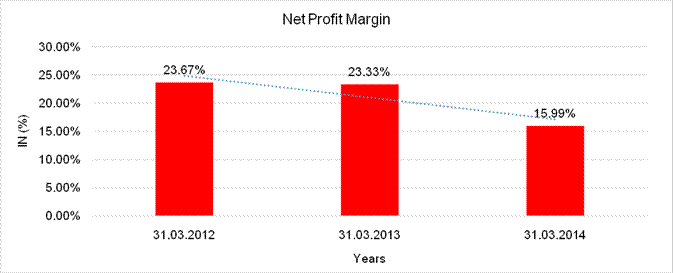
NET PROFIT MARGIN
|
Net
Profit Margin |
31.03.2012 |
31.03.2013 |
31.03.2014 |
|
|
Rs.
In Million |
Rs.
In Million |
Rs.
In Million |
|
Revenue From Operation |
49,735.600 |
52,550.100 |
56,035.000 |
|
Profit |
11,770.000 |
12,259.900 |
8,959.900 |
|
|
23.67% |
23.33% |
15.99% |
LOCAL AGENCY FURTHER INFORMATION
|
Sr. No. |
Check List by Info
Agents |
Available in Report
(Yes / No) |
|
1] |
Year of Establishment |
Yes |
|
2] |
Locality of the firm |
Yes |
|
3] |
Constitutions of the firm |
Yes |
|
4] |
Premises details |
No |
|
5] |
Type of Business |
Yes |
|
6] |
Line of Business |
Yes |
|
7] |
Promoter's background |
Yes |
|
8] |
No. of employees |
No |
|
9] |
Name of person contacted |
Yes |
|
10] |
Designation of contact person |
Yes |
|
11] |
Turnover of firm for last three years |
Yes |
|
12] |
Profitability for last three years |
Yes |
|
13] |
Reasons for variation <> 20% |
-- |
|
14] |
Estimation for coming financial year |
No |
|
15] |
Capital in the business |
Yes |
|
16] |
Details of sister concerns |
Yes |
|
17] |
Major suppliers |
No |
|
18] |
Major customers |
No |
|
19] |
Payments terms |
Yes |
|
20] |
Export / Import details (if applicable) |
No |
|
21] |
Market information |
-- |
|
22] |
Litigations that the firm / promoter involved in |
-- |
|
23] |
Banking Details |
Yes |
|
24] |
Banking facility details |
Yes |
|
25] |
Conduct of the banking account |
-- |
|
26] |
Buyer visit details |
-- |
|
27] |
Financials, if provided |
Yes |
|
28] |
Incorporation details, if applicable |
Yes |
|
29] |
Last accounts filed at ROC |
Yes |
|
30] |
Major Shareholders, if available |
Yes |
|
31] |
Date of Birth of Proprietor/Partner/Director, if available |
No |
|
32] |
PAN of Proprietor/Partner/Director, if available |
No |
|
33] |
Voter ID No of Proprietor/Partner/Director, if available |
No |
|
34] |
External Agency Rating, if available |
Yes |
UNSECURED LOAN
(Rs.
In Million)
|
Particular |
As
on 31.03.2014 |
As
on 31.03.2013 |
|
Long Term
Borrowing |
|
|
|
Deferred Sales Tax Loans |
399.500 |
583.300 |
|
Short Term
Borrowing |
|
|
|
Working Capital Borrowings |
0.000 |
543.900 |
|
Foreign Currency Loans |
310.000 |
250.000 |
|
Rupee Loans |
23.000 |
0.000 |
|
Total |
732.500 |
1377.200 |
|
Note.: Working
Capital Borrowings are secured by hypothecation of stocks and book debts of
the Company |
||
OVERVIEW
During the Financial Year 2013-14 (FY 13-14), advanced economies were gradually recovering while Emerging market economies slowed down. They faced the dual challenge of slowing growth and tighter global financial conditions. Currency depreciation accentuated inflationary pressure and most of the emerging economies’ central banks engaged in monetary tightening. Slower economic growth in China also impacted global economic environment.
The Indian economy further slowed down with GDP growth in FY 13-14 estimated to be less than 5%. Industrial growth rate continued to stay weak at 0.5%. Domestic investments declined due to high interest rates and slowdown in capex cycle. Rupee witnessed sharp depreciation during the first half of the year, though it has stabilized since December 2013. With focus on improving macro stability, fiscal deficit has been contained at 4.6% of GDP, current account deficit has come down to 1.7% of GDP and the inflation trend is moderating. This should help in accelerating growth in Indian economy, going forward.
The economic slowdown has impacted the performance of the Company as well. In Viscose Staple Fibre (VSF) business, though demand continued to grow globally, margins contracted given rising raw material prices coupled with subdued realisation in line with the global scenario due to the large surplus capacities in China. The Cement industry witnessed sluggish demand due to the slowdown in infrastructure projects, real estate sector and capex cycle.
STRATEGIC INITIATIVES
In line with its objective of strengthening its leadership position in both VSF and Cement businesses, the Company made considerable progress with its expansion plans:
VSF BUSINESS
EXPANSION
The capacity expansion from 334K TPA to 498K TPA is in its final stage of becoming operational. Of this, the Brownfield expansion (36K TPA) at Harihar, Karnataka, has been completed with the commissioning of Power plant in Phase-II in May 2013. In respect of Greenfield project (120K TPA) at Vilayat in Gujarat, trial runs for Line 1 have commenced in April 2014, to be followed by trail runs of Line 2 shortly. The remaining two lines focusing on specialty fiber are expected to be commissioned in the 2nd quarter of the current year. Besides increasing volumes, the plant will augment the Company’s presence in speciality fibres such as Modal and Micro-modal.
CEMENT BUSINESS
EXPANSION
Considerable progress has been made in Brownfield expansions under implementation. Clinkerisation plant (3.3 Mn. TPA) along with the grinding capacity (1.45 Mn. TPA) at Malkhed, Karnataka and Jharsuguda, Odisha (1.60 Mn. TPA), was commissioned in FY 13-14. This is in addition to clinkerisation plant at Raipur, Chhattisgarh (3.3 Mn. TPA) and grinding capacity at Hotgi, Maharashtra (1.55 Mn. TPA) already commissioned in FY 12-13. The remaining cement grinding facility of ~4.5 Mn. TPA is slated to goon stream in a phased manner by 2015. Work on the 2.9 Mn. TPA expansion at Aditya Cement in Rajasthan is expected to be commissioned in 2015.
ACQUISITION OF 4.8
MN. TPA CEMENT CAPACITY IN GUJARAT
In September 2013, UltraTech Cement Limited. (UltraTech), the subsidiary of the Company, entered into an agreement to acquire, by way of a demerger, the Gujarat Cement units (4.8 Mn. TPA) comprising of an integrated cement plant at Sewagram and a grinding unit at Wanakbori of Jaypee Cement Corporation Limited (JCCL). The transaction has received the requisite regulatory approvals from Competition Commission of India, shareholders, creditors and Hon’ble High Courts, and is now subject to the approval of Securities and Exchange Board of India.
On completion of the ongoing expansions and the acquisition, UltraTech’s cement capacity will increase to 70 Mn. TPA.
STRENGTHENING OF
BACKWARD INTEGRATION THROUGH EXPANSION IN CHEMICAL BUSINESS
The 182,500 TPA Caustic Soda plant at Vilayat, Gujarat, has been commissioned in May 2013. With this, the Company has the largest capacity of 452,500 TPA in the Chlor-alkali segment in India. To expand its portfolio of downstream Value Added Products, a 51,500 TPA Epoxy plant began operations in December 2013.
PERFORMANCE REVIEW
Total textile fibre consumption has been growing at a steady pace of 4% from 2008 to 2012. The rate of growth, going forward, is expected to remain around this level. Against this, world demand for VSF has grown at 12% CAGR (CY 09-CY 13), primarily driven by VSF industry in China (CAGR of 15% in last 5 years).
Despite good growth, the business environment continues to remain challenging. Over the last few years, all the leading VSF manufacturers have actively pursued capacity expansion. This has led to a large over capacity and pressure on realisations. The capacity addition in China has been much faster than the rest of the world, resulting in a 69% capacity utilisation in 2013 against the global average of 79%. The availability of dissolving grade pulp, which was a constraint until last year, has become surplus in the current year, as several paper grade pulp producers have converted their facilities from paper grade to dissolving grade. This too has supplemented overcapacity in VSF.
With a large surplus capacity, Chinese players are aggressively exporting, leading to a decline in global prices. The demand supply imbalance and liquidity crunch in China impacted VSF prices in global markets. The fall in realisations of the Company were much lower compared to global trends, supported by rupee depreciation.
The Company’s production increased by 7% vis-à-vis FY 12-13, with the enhanced capacity at Harihar plant. Despite difficult market conditions, sales volumes grew by 9%. A sharp depreciation of the rupee and a steep increase in pulp and wood prices resulted in a substantial increase in input costs and decline in EBIDTA margins.
Led by better efficiency and realisations, profitability has improved in Pulp JVs. Losses at AV Terrace Bay amounting to `Rs. 790.000 Million (the Company’s share) has affected the consolidated performance, despite the significant improvement in plant efficiency. The performance of the VSF JV in China was affected due to depressed market conditions.
Capex plans of Rs. 2,7250.000 Million are under implementation, including the Greenfield Vilayat project and the
normal capex, of which Rs.18700.000 Million has already been spent as at 31st March, 2014.
SECTOR OUTLOOK
The world economy continues to pass through an uncertain phase with high volatility. Though the US is showing signs of slow and steady recovery, the challenges in the Euro Zone remain. The slowdown in China will pose additional concerns. Margins are likely to remain under pressure in the near term due to overcapacity in China. However, the slowdown of new capacity additions in China should lead to Improvement in industry utilisation.
In the long term, with limitations for growth of cotton production due to competition with other cash crops, growing population, rising prosperity and increasing consumer awareness about the benefits of cellulosic fibre, VSF is well positioned to achieve a larger share of the global fibre pie.
BUSINESS OUTLOOK
The additional capacity from the ongoing Greenfield expansion at Vilayat will push volume growth. The Company will continue to focus on specialty fibres.
The Business is committed to achieve world benchmark quality besides expanding new product offerings by expediting RandD projects as elaborated in the Directors’ Report. Further, the Business will continue to focus on improving its cost competitive position. These measures will ensure the Company maintaining its leadership position.
PERFORMANCE REVIEW
The Chemical business reported a growth of 16Percent and 17Percent in production and sales volume, respectively. Additional volumes from its Vilayat plant and an uninterrupted production at its Nagda plant were the
key drivers. Production at the Vilayat plant was hampered during the third quarter on account of the unprecedented floods. ECU realisation saw a marginal decline in the first half from the peak level witnessed during FY 12-13, even as it recovered during the second half. The operating profit for the business was lower due to the initial losses after the commissioning of Caustic and Epoxy plant at Vilayat.
SECTOR OUTLOOK
Caustic demand in India will benefit from expected high growth in the aluminium industry in India. Demand growth from paper as well as soaps and the detergents segment would be healthy with rising consumption. Chlorine demand will be linked with growth in agrochemicals, dye intermediates, organic intermediates, etc. However, increase in production volume in Western India may impact its demand supply balance.
BUSINESS OUTLOOK
The full benefit of the Chemical complex at Vilayat (Chloro-Alkali, Epoxy and other value added products) will accrue in FY 14-15 with the gradual ramp up in production.
PERFORMANCE REVIEW
The Cement industry was affected by a sluggish demand on account of lower government spending, prolonged monsoon, a gloomy economic environment leading to low off-take from the infrastructure and housing sectors, coupled with the shortage of construction material like sand in some of the major cement consuming states.
Higher capacity addition compared to incremental demand resulted in sector capacity utilisation declining to below 70Percent. The subdued demand and over-capacity resulted in prices remaining under pressure. UltraTech’s domestic cement realisation was at 4,097 per ton as against 4,253 per ton in FY 12-13.
UltraTech continued its efforts towards cost optimization and operational efficiencies, which to some extent helped in containing costs. The overall energy cost at ` 948 per ton eased by 4Percent over the previous year. The gain in cost was achieved with a continuous focus on improving efficiencies in consumption and increasing the usage of pet coke. Although prices of imported coal softened, the depreciation in rupee negated the benefit. Limestone mining cost and landed cost of all major input material have increased, linked to regular hike in HSD prices. The rise in rail freight and diesel prices (more than 20Percent) impacted the logistics cost substantially.
UltraTech has earmarked a capex of Rs.100000.000 Million to be incurred in setting up the grinding units, Brownfield expansion in Rajasthan, cement terminals and other normal capex. These are likely to be commissioned in a phased manner by 2015.
Outlook for Cement
Business
Industry is likely to face an oversupply situation till FY 16-17 with the utilisation remaining below 75 Percent. As a result pricing may remain under pressure. The pace of capacity addition is slowing down and an additional ~50 Mn. TPA is expected in next three years.
The demand growth should gradually recover to 8 Percent on improved economic environment. Higher infrastructure spending, robust potential in rural housing and the expected decline in interest rates augur well for the cement industry.
TEXTILES - GRASIM
BHIWANI TEXTILES LIMITED (GBTL)
GBTL, the Company’s textile subsidiary, grew on the back of
higher volume in the OTC segment in India and better realisation in export
markets. Its operating profit at Rs. 367.000 Million improved by 17 Percent
with higher margins in export markets. Net profit almost doubled from Rs.91.000
Million in the previous year to ` 181.000 Million.
OUTLOOK
Given the over capacity buildup in China and its consequent impact on prices and margins, the Pulp and Fibre ndustry continues to face a challenging environment in the short term. However, the long-term growth prospects are encouraging. In the Cement Sector, a 6Percent growth with the potential to move to over 8Percent with the economy on a more stable footing, augurs well for the Company.
Having said that, with additional capacities coming on stream in both its Pulp and Fibre business and Cement
business, the Company is well poised to further consolidate its leadership position in these sectors.
CHEMICAL BUSINESS
The Company allied Chemical business has set up a pilot scale plant based on Oxygen Depolarization Cathode (ODC) technology. With this, the energy consumption is lowered by approx. 30Percent as compared to conventional membrane cell technology. It is also planning to set up a pilot lab scale electrolyzer in collaboration with Uhde at ABSTCL, Taloja. This facility will provide it with an opportunity to run the electrolyzer at various current densities with varying electrolyte parameters which will help in optimizing the plant performance. The quality of brine is very critical for optimum performance of Membrane cell plant. It is proposed to install the Pilot brine plant at Nagda to study the conditions/parameters affecting the brine quality and incorporate the same learnings in the main plant to enhance
CONTINGENT
LIABILITIES NOT PROVIDED FOR IN RESPECT OF:
(Rs. In Million)
|
Particular |
31.03.2014 |
|
Claims/Disputed
Liabilities not acknowledged as debt: |
|
|
Custom Duty |
70.600 |
|
Sales Tax/Purchase Tax/VAT |
0.100 |
|
Excise Duty/Cenvat Credit/Service Tax |
831.600 |
|
Water Cess |
176.900 |
|
Income Tax |
1443.600 |
|
Various claims in respect of disputed liabilities of discontinued business in earlier year |
342.600 |
|
Others |
269.500 |
|
Out of the above
matter disputes pending with Revenue and other Government authorities
challenged/appealed by the Company are: |
|
|
a)Income tax demand raised on completion of assessment for the Financial Year 2009-10 |
1443.600 |
|
b)Excise Duty demanded against Cenvat credit availed in respect of electricity not used for manufacturing |
548.200 |
|
c)Transfer of Cenvat credit on merger of excise registration of two units disputed by Excise Department |
194.400 |
|
(d) Custom classification dispute on import of coal |
51.100 |
|
e)Water charges for water not made available as per agreement |
176.900 |
|
f)Penalty for not utilising the land within the time limit prescribed as per the sanction document, utilisation of which is delayed due to non-fulfilment of condition by Gujarat Industrial Development Corporation |
69.600 |
|
Cash outflows for the above are determinable only on receipt of judgements pending at various forums/ authorities. |
|
STATEMENT OF STANDALONE UNAUDITED RESULTS FOR THE QUARTER AND NINE
MONTHS ENDED 31.12.2014
(Rs. In Million)
|
Sr. No |
Particulars |
Three Months Ended |
Nine Months Ended |
||
|
31.12.2014 |
30.09.2014 |
31.12.2014 |
|||
|
Unaudited |
Unaudited |
Unaudited |
|||
|
1 |
Income From
Operations |
|
|
|
|
|
|
a. Net Sales/ Income from Operations (Net of Excise Duty) |
15433.100 |
15822.800 |
45492.200 |
|
|
|
b. Other Operating Income |
159.700 |
175.100 |
486.500 |
|
|
|
Total Income from Operations
(Net) |
15592.800 |
15997.900 |
45978.700 |
|
|
2 |
Expenditure |
|
|
|
|
|
|
a. Cost of material Consumed |
9398.900 |
9028.700 |
26964.000 |
|
|
|
b. Purchase of Stock-in trade |
15.700 |
5.700 |
32.900 |
|
|
|
c. Changes in inventory of finished Goods, work- in-progress and Stock-in-trade |
(824.200) |
(221.300) |
(1311.700) |
|
|
|
d. Employees Benefit Expenses |
1171.300 |
1167.700 |
3421.100 |
|
|
|
Power and Fuel Cost |
2687.100 |
2688.900 |
7805.400 |
|
|
|
Freight and Handling Expenses |
268.200 |
246.600 |
732.900 |
|
|
|
Depreciation and Amortisation Expenses |
628.600 |
624.400 |
1782.100 |
|
|
|
Other Expenses |
1065.100 |
942.300 |
2975.800 |
|
|
|
Total Expenses |
14410.700 |
14483.000 |
42402.500 |
|
|
3 |
Profit from
Operations before Other Income, Interest and Exceptional Items |
1182.100 |
1514.900 |
3576.200 |
|
|
4 |
Other Income |
307.800 |
2114.400 |
2973.400 |
|
|
5 |
Profit from
ordinary activities before finance cost & exceptional items |
1489.900 |
3629.300 |
6549.600 |
|
|
6 |
Finance Costs |
116.200 |
90.100 |
262.500 |
|
|
7 |
Profit from
ordinary activities after finance costs & exceptional items |
1373.700 |
3539.200 |
6287.100 |
|
|
10 |
Tax Expense |
436.900 |
545.100 |
1297.800 |
|
|
13 |
Net Profit After
Tax |
936.800 |
2994.100 |
4989.300 |
|
|
14 |
Paid-up equity share capital (face value of Rs.10 per share) |
918.600 |
918.600 |
918.600 |
|
|
15 |
Reserves excluding Revaluation Reserve as per balance sheet of previous accounting Year |
-- |
--- |
-- |
|
|
16 |
Earning Per Share (of Rs.10 each) (not annualized) |
|
|
|
|
|
|
Basic EPS |
10.20 |
32.60 |
54.32 |
|
|
|
Diluted EPS |
10.19 |
32.57 |
54.26 |
|
|
A |
PARTICULARS OF
SHAREHOLDING |
|
|
|
|
|
17 |
Public Shareholding |
|
|
|
|
|
|
- No. of shares |
55431 |
55381 |
55431 |
|
|
|
- Percentage of shareholding |
60.35 |
60.30 |
60.35 |
|
|
18 |
Promoter &
Promoter Group Shareholding |
|
|
|
|
|
|
a)
Pledged/Encumbered |
|
|
|
|
|
|
- No. of shares |
-- |
-- |
-- |
|
|
|
- Percentage of shareholding (as a % of the total shareholding of promoter and promoter group) |
-- |
-- |
-- |
|
|
|
- Percentage of shareholding (as a % of the total share capital of the company) |
-- |
-- |
-- |
|
|
|
b) Non-encumbered |
|
|
|
|
|
|
- No. of shares |
23429 |
23429 |
23429 |
|
|
|
- Percentage of shareholding (as a % of the total shareholding of promoter and promoter group) |
100.00 |
100.00 |
100.00 |
|
|
|
- Percentage of shareholding (as a % of the total share capital of the company) |
25.51 |
25.51 |
|
|
|
|
INVESTORS COMPLAINTS Pending at the beginning of the Quarter Receved during the quarter Disposed during the Quarter Remaining unresolved at the end of the Quarted |
-- 4 4 -- |
|
|
|
UNAUDITED SEGMENT WIE REVENUE, RESULTS AND
CAPITAL EMPLOYED
(Rs. In Million)
|
Particulars |
Three Months
Ended |
Nine Months
Ended |
|
|
|
31.12.2014 |
30.09.2014 |
31.12.2014 |
|
a.
Information about Primary Business Segments |
Unaudited |
Unaudited |
Unaudited |
|
1.
Segment Revenue |
|
|
|
|
Viscose Staple
Fibre |
12034.500 |
12707.800 |
35682.600 |
|
Chemicals – Caustic
Soda and Alied Chemicals |
4416.300 |
4159.900 |
12711.200 |
|
Others |
188.500 |
218.400 |
669.000 |
|
Total |
16639.300 |
17086.100 |
49062.800 |
|
Less : Inter Segment Revenue |
(1046.500) |
(1088.200) |
(3084.100) |
|
Net
Operating Income |
15592.800 |
15997.900 |
45978.700 |
|
|
|
|
|
|
2.
Segment Result |
|
|
|
|
Viscose Staple
Fibre |
978.900 |
1134.900 |
2655.300 |
|
Chemicals – Caustic
Soda and Alied Chemicals |
443.600 |
549.600 |
1661.500 |
|
Others |
4.000 |
8.600 |
25.200 |
|
Total |
1426.500 |
1693.100 |
4342.200 |
|
|
|
|
|
|
Less : Finance Cost |
(116.200) |
(90.100) |
54434.000 |
|
Net Unallocable Income (Expenditure |
63.400 |
1936.200 |
19379.500 |
|
Profit
From Ordinary Activities Before Tax |
1373.700 |
3539.200 |
393.700 |
|
|
|
|
|
|
3. Capital
Employed (Segment Assets-Segment Liabilities) |
|
|
|
|
Viscose Staple
Fibre |
54434.000 |
52265.700 |
74207.200 |
|
Chemicals – Caustic
Soda and Alied Chemicals |
19379.500 |
19460.700 |
56742.900 |
|
Others |
393.700 |
399.200 |
393.700 |
|
Total |
74207.200 |
72125.600 |
74207.200 |
|
Add: Unallocated
Corporated Capital Employed |
56742.900 |
57187.600 |
56742.900 |
|
TOTAL CAPITAL EMPLOYED |
130950.100 |
129313.200 |
130950.100 |
NOTES:
The Financial Results were reviewed by the Audit Committee and approved
by the Board of Directors today.
In Viscose Staple Fibre (VSF) business, 3rd Line with a capacity of
21,900 MT per annum for producing Speciality Fibre has been commissioned at
Vilayat, Gujarat in January, 2015.With this total VSF capacity of the Company
has increased to 4,76,325 MT per annum.
From 1st April, 2014 as per applicable provisions of the Companies Act,
2013, the depreciation has been provided as per the useful life specified in
the Act or as re-assessed by the Company. Based on the current estimates,
carrying value of the assets whose useful life is already exhausted as on 1st
April, 2014, amounting to Rs.110.900 Million and deferred tax credit of
Rs.37.700 Million thereon has been recognised in the opening balance of
Retained Earnings.
Had there been no change as stated above, depreciation would have been
higher by Rs.120.300 Million and Rs.354.100 Million for the quarter and nine
months ended 31st December, 2014 respectively.
Tax expenses for the quarter and nine months ended 31st December, 2014
are net of provisions written back pertaining to earlier years amounting to
Rs.22.000 Million and Rs.23.800 Million respectively. For the corresponding
quarter and nine months in the previous year, such write back amounted to
Rs.26.800 Million and Rs.218.600 Million respectively. For the year ended 31st
March, 2014 write back was Rs.290.900 Million.
During the quarter, the Company has allotted 3,022 fully paid up equity
shares of Rs.10 each upon exercise of employee stock options.
Previous periods’ figures have been regrouped/rearranged wherever
necessary to conform to the current periods’ classification.
INDEX OF CHARGES
|
S.NO. |
CHARGE ID |
DATE OF CHARGE CREATION/MODIFICATION |
CHARGE AMOUNT SECURED |
CHARGE HOLDER |
ADDRESS |
SERVICE REQUEST NUMBER (SRN) |
|
1 |
10533443 |
02/12/2014 |
363,860,000.00 |
HDFC BANK LIMITED |
BANK HOUSE, 3RD
FLOOR, BRILLIAN AVENUE, BEHIND BOMBAY HOSPITAL, SCHEME 94, INDORE, MADHYA
PRADESH - |
C35089663 |
|
2 |
10326687 |
07/01/2012 |
9,000,000,000.00 |
STATE BANK OF INDIA |
CORPORATE ACCOUNT GROUP BRANCH, NEVILLE HOUS ,JN HEREDIA MARG, MUMBAI, MAHARASHTRA -400001,INDIA |
B29015542 |
|
3 |
10108132 |
18/05/2010 * |
3,000,000,000.00 |
IDBI BANK LIMITED |
IDBI TOWERWTC COMPLEX, CUFFE PARADE, MUMBAI, MAHARASHTRA - 400005, INDIA |
A86805397 |
|
4 |
80024425 |
15/12/2005 |
1,386,000,000.00 |
INDUSTRIAL DEVELOPMENT BANK OF INDIA LIMITED |
IDBI TOWER, WTC COMPLEX, CUFFE PARADE, MUMBAI, MAHARASHTRA - 400005, INDIA |
- |
|
5 |
80024325 |
18/05/2010 * |
8,300,000,000.00 |
STATE BANK OF INDIA |
CORPORATE ACCOUNTS GROUP, VOLTAS HOUSE,, 23, JN HEREDIA MARG,, MUMBAI, MAHARASHTRA - 400001, INDIA |
A87144812 |
* Date of charge modification
FIXED ASSETS
- Freehold Land
- Leasehold Land
- Buildings
- Plant and Equipment
- Furniture and Fixtures
- Vehicles
- Office Equipment
- Railway Sidings
- Computer Software
- Computer and Other Electronic
- Office Equipment
PRESS RELEASES
ADITYA BIRLA CHEMICALS TO MERGE WITH GRASIM INDUSTRIES
FEBRUARY 12, 2015
The swap ratio approved by the board is 1 share of Grasim for every 16 shares of Aditya Birla Chemicals
Mumbai: Grasim Industries Limited, the flagship company of the Aditya Birla Group, has decided to merge Aditya Birla Chemicals (India) Limited, or ABCIL, with the company.
In a filing to stock exchanges, Grasim Industries said its board on Wednesday approved the proposed merger of ABCIL with Grasim. The swap ratio approved by the board is 1 share of Grasim for every 16 shares of ABCIL.
Grasim will issue 1.46 million new shares.
The proposed merger will consolidate Aditya Birla Group’s chlor-alkali business into Grasim and strengthen the existing portfolio of viscose staple fibre, caustic soda and allied chemicals in the stand-alone company, the company said.
“The merger will enable the geographical diversification for Grasim through the addition of ABCIL’s manufacturing facilities spread across the country. It also enables the business to capitalize growth opportunities by bringing in operational and financial synergies, backed by Grasim’s strength,” the statement added.
The consolidation is in line with Aditya Birla Group’s philosophy to unify similar businesses in one company, the statement said.
Grasim is a manufacturer of caustic soda in India, with an installed capacity of 452,500 tonnes per annum. It has plants at Nagda in Madhya Pradesh and a recently-commissioned one at Vilayat in Gujarat.
ABCIL reported a net profit of Rs.34.000 Million in the December ender quarter, against Rs.163.500 Million in the same period a year ago. The company in its statement to BSE said the numbers are not fully comparable due to certain acquisitions made in the last financial year.
The total debt on ABCIL’s books is a little less than Rs.10000.000 Million, which would not be transferred to Grasim’s books. As per Bloomberg data, Grasim Industries Limited consolidated net debt was at Rs.53275.900 Million and standalone was at Rs.390.400 Million as on 30 September 2014.
“ABCIL is held through Hindalco (51%), Renuka Investments (3.31%) and Pilani Investments (1.67%). Grasim does not have a stake currently. At a group level, we see it as a streamlining process and nothing more than that. The move, however, could help improve Hindalco’s books as ABCIL’s debt will be transferred to Grasim,” said an analyst with a domestic brokerage firm. The analyst did not wish to be identified.
Grasim Industries reported a stand-alone net profit of Rs.936.800 Million in the December ended quarter against Rs.1260.900 Million in the same period last year, down by 26%.
Adesh Kumar Gupta, chief financial officer, Grasim Industries, said the merger will raise Grasim’s caustic soda capacity from the current 452,500 tonnes to around 748,000 tonnes. “With certain other capacity addition, the total caustic soda capacity eventually would be around 804,000 tonnes.”
Gupta expects the merger with ABCIL to improve margins for Grasim Industries. “Margins for ABCIL have been in the above 24% range due to a better cost structure, higher than the 18% margins reported by Grasim’s chemicals division,” he said.
Aditya Birla Chemicals India Limited gained 1.59% to close at Rs.223.20 on Wednesday on the BSE, while the benchmark Sensex gained 0.63% to close at 28,533.97 points and shares of Grasim Industries Limited gained 0.48% to close at Rs.2,835.85 per share. The merger was announced after market hours on Wednesday.
GRASIM TO SUSPEND OPERATIONS AT NAGDA PLANT IN MADHYA PRADESH
APRIL 24, 2015
Mumbai: Grasim Industries Limited, a maker of viscose staple fibre, on Friday said it would suspend operations at its staple fibre plant in Madhya Pradesh due to a water shortage.
“Due to water shortage caused by deficient rain last year, the company has started reducing production of staple fibre at its plant located at Nagda (in Madhya Pradesh) in a phased manner,” the company said in a statement to the BSE.
Production at the Nagda plant is likely to be fully suspended by 30 April and would be resumed once water becomes available. Grasim’s Nagda plant can produce 162 kilo tonnes of viscose stable fibre a year.
The company expects its operations at its Chlor Alkali plant in the same location to be affected due to unavailability of water. It plans to continue supply to its customers from its other plants in Gujarat and Karnataka.
On Friday, Grasim Industries closed at Rs3,666.15 a share, flat from its previous close of Rs3,639.10.
CMT REPORT (Corruption, Money Laundering & Terrorism]
The Public Notice information has been collected from various sources
including but not limited to: The Courts,
1] INFORMATION ON
DESIGNATED PARTY
No exist designating subject or any of its beneficial owners,
controlling shareholders or senior officers as terrorist or terrorist organization
or whom notice had been received that all financial transactions involving
their assets have been blocked or convicted, found guilty or against whom a
judgement or order had been entered in a proceedings for violating
money-laundering, anti-corruption or bribery or international economic or
anti-terrorism sanction laws or whose assets were seized, blocked, frozen or
ordered forfeited for violation of money laundering or international
anti-terrorism laws.
2] Court Declaration :
No records exist to suggest that subject is
or was the subject of any formal or informal allegations, prosecutions or other
official proceeding for making any prohibited payments or other improper
payments to government officials for engaging in prohibited transactions or with
designated parties.
3] Asset Declaration :
No records exist to suggest that the property or assets of the subject
are derived from criminal conduct or a prohibited transaction.
4] Record on Financial
Crime :
Charges or conviction registered
against subject: None
5] Records on Violation of
Anti-Corruption Laws :
Charges or
investigation registered against subject: None
6] Records on Int’l
Anti-Money Laundering Laws/Standards :
Charges or
investigation registered against subject: None
7] Criminal Records
No
available information exist that suggest that subject or any of its principals
have been formally charged or convicted by a competent governmental authority
for any financial crime or under any formal investigation by a competent
government authority for any violation of anti-corruption laws or international
anti-money laundering laws or standard.
8] Affiliation with
Government :
No record
exists to suggest that any director or indirect owners, controlling shareholders,
director, officer or employee of the company is a government official or a
family member or close business associate of a Government official.
9] Compensation Package :
Our market
survey revealed that the amount of compensation sought by the subject is fair
and reasonable and comparable to compensation paid to others for similar
services.
10] Press Report :
No press reports / filings exists on
the subject.
CORPORATE GOVERNANCE
MIRA INFORM as part of its Due Diligence do provide comments on Corporate
Governance to identify management and governance. These factors often have been
predictive and in some cases have created vulnerabilities to credit
deterioration.
Our Governance Assessment focuses principally on the interactions
between a company’s management, its Board of Directors, Shareholders and other
financial stakeholders.
CONTRAVENTION
Subject is not known to have contravened any existing local laws,
regulations or policies that prohibit, restrict or otherwise affect the terms
and conditions that could be included in the agreement with the subject.
FOREIGN EXCHANGE RATES
|
Currency |
Unit
|
Indian Rupees |
|
US Dollar |
1 |
Rs.63.40 |
|
|
1 |
Rs.95.42 |
|
Euro |
1 |
Rs.68.49 |
INFORMATION DETAILS
|
Information
Gathered by : |
KAM |
|
|
|
|
Analysis Done by
: |
SUB |
|
|
|
|
Report Prepared
by : |
KVT |
SCORE & RATING EXPLANATIONS
|
SCORE FACTORS |
RANGE |
POINTS |
|
HISTORY |
1~10 |
9 |
|
PAID-UP CAPITAL |
1~10 |
7 |
|
OPERATING SCALE |
1~10 |
9 |
|
FINANCIAL
CONDITION |
|
|
|
--BUSINESS SCALE |
1~10 |
9 |
|
--PROFITABILIRY |
1~10 |
8 |
|
--LIQUIDITY |
1~10 |
8 |
|
--LEVERAGE |
1~10 |
7 |
|
--RESERVES |
1~10 |
9 |
|
--CREDIT LINES |
1~10 |
9 |
|
--MARGINS |
-5~5 |
-- |
|
DEMERIT POINTS |
|
|
|
--BANK CHARGES |
YES/NO |
YES |
|
--LITIGATION |
YES/NO |
NO |
|
--OTHER ADVERSE INFORMATION |
YES/NO |
NO |
|
MERIT POINTS |
|
|
|
--SOLE DISTRIBUTORSHIP |
YES/NO |
NO |
|
--EXPORT ACTIVITIES |
YES/NO |
NO |
|
--AFFILIATION |
YES/NO |
YES |
|
--LISTED |
YES/NO |
YES |
|
--OTHER MERIT FACTORS |
YES/NO |
YES |
|
DEFAULTER
|
|
|
|
RBI |
YES/NO |
NO |
|
EPF |
YES/NO |
NO |
|
TOTAL |
|
75 |
This score serves as a reference to assess
SC’s credit risk and to set the amount of credit to be extended. It is calculated
from a composite of weighted scores obtained from each of the major sections of
this report. The assessed factors and their relative weights (as indicated
through %) are as follows:
Financial
condition (40%) Ownership
background (20%) Payment record
(10%)
Credit history
(10%) Market trend (10%) Operational size
(10%)
RATING EXPLANATIONS
|
RATING |
STATUS |
PROPOSED CREDIT LINE |
|
|
>86 |
Aaa |
Possesses an extremely sound financial base with the strongest capability
for timely payment of interest and principal sums |
Unlimited |
|
71-85 |
Aa |
Possesses adequate working capital. No caution needed for credit
transaction. It has above average (strong) capability for payment of interest
and principal sums |
Large |
|
56-70 |
A |
Financial & operational base are regarded healthy. General
unfavourable factors will not cause fatal effect. Satisfactory capability for
payment of interest and principal sums |
Fairly Large |
|
41-55 |
Ba |
Overall operation is considered normal. Capable to meet normal
commitments. |
Satisfactory |
|
26-40 |
B |
Capability to overcome financial difficulties seems comparatively
below average. |
Small |
|
11-25 |
Ca |
Adverse factors are apparent. Repayment of interest and principal sums
in default or expected to be in default upon maturity |
Limited with
full security |
|
<10 |
C |
Absolute credit risk exists. Caution needed to be exercised |
Credit not
recommended |
|
-- |
NB |
New Business |
-- |
This report is issued at your request without any
risk and responsibility on the part of MIRA INFORM PRIVATE LIMITED (MIPL)
or its officials.