MIRA INFORM REPORT
|
Report No. : |
319928 |
|
Report Date : |
30.04.2015 |
IDENTIFICATION DETAILS
|
Name : |
KPIT TECHNOLOGIES LIMITED (w.e.f 19.09.2013) |
|
|
|
|
Formerly Known
As : |
KPIT CUMMINS INFOSYSTEMS LIMITED |
|
|
|
|
Registered
Office : |
35 and 36, |
|
Tel. No.: |
91-20-66525000 |
|
|
|
|
Country : |
India |
|
|
|
|
Financials (as
on) : |
31.03.2014 |
|
|
|
|
Date of
Incorporation : |
28.12.1990 |
|
|
|
|
Com. Reg. No.: |
11-059594 |
|
|
|
|
Capital
Investment / Paid-up Capital : |
Rs. 370.989 Million |
|
|
|
|
CIN No.: [Company Identification
No.] |
L72200PN1990PLC059594 |
|
|
|
|
IEC No.: |
Not Available |
|
|
|
|
TAN No.: [Tax Deduction &
Collection Account No.] |
Not Available |
|
|
|
|
PAN No.: [Permanent Account No.] |
Not Available |
|
|
|
|
Legal Form : |
A Public Limited Liability Company. The Company’s Shares are Listed on
the Stock Exchanges. |
|
|
|
|
Line of Business
: |
Service provider of IT Solutions. |
|
|
|
|
No. of Employees
: |
1500 (Approximately) |
RATING & COMMENTS
|
MIRA’s Rating : |
A (70) |
|
RATING |
STATUS |
PROPOSED CREDIT LINE |
|
|
56-70 |
A |
Financial & operational base are regarded healthy. General
unfavourable factors will not cause fatal effect. Satisfactory capability for
payment of interest and principal sums |
Fairly Large |
|
Status : |
Good |
|
|
|
|
Payment Behaviour : |
Regular |
|
|
|
|
Litigation : |
Clear |
|
|
|
|
Comments : |
Subject is a well-established company having fine track record. For the financial year ended
2014, company has achieved decent sales turnover growth of 27.46% and
reported profitability margins at 16.21%. Rating also reflects KPIT’s stable business risk profile, marked by
established presence in the automative and manufacturing verticals and a
strong financial risk profie of the company. Trade relations are reported as fair. Business is active. Payment are
reported to be regular and as per commitment. In view of decent business profile of the company, the company can be
considered good for normal business dealings at usual trade terms and
conditions. |
NOTES :
Any query related to this report can be made on
e-mail : infodept@mirainform.com
while quoting report number, name and date.
EXTERNAL AGENCY RATING
|
Rating Agency Name |
CRISIL |
|
Rating |
Long Term Rating = AA- |
|
Rating Explanation |
High degree of safety and very low credit risk. |
|
Date |
August 18, 2014 |
|
Rating Agency Name |
CRISIL |
|
Rating |
Short Term Rating = A1+ |
|
Rating Explanation |
Very strong degree of safety and carry lowest credit risk. |
|
Date |
August 18, 2014 |
RBI DEFAULTERS’ LIST STATUS
Subject’s name is not enlisted as a defaulter
in the publicly available RBI Defaulters’ list.
EPF (Employee Provident Fund) DEFAULTERS’ LIST STATUS
Subject’s name is not enlisted as a defaulter
in the publicly available EPF (Employee Provident Fund) Defaulters’ list as of
31-03-2014.
INFORMATION PARTED BY
|
Name : |
Mr. Mandar |
|
Designation : |
Assistant Manager Finance |
|
Contact No.: |
91-20-6652500 |
|
Date : |
27.04.2015 |
LOCATIONS
|
Registered Office / Head Office
: |
35 and 36, |
|
Tel. No.: |
91-20-66525000 |
|
Fax No.: |
91-20-66525001 |
|
E-Mail : |
|
|
Website : |
|
|
|
|
|
Software
Development Centres: |
Located At
|
|
|
|
|
Overseas Offices : |
Located At
|
DIRECTORS
AS ON 31.03.2014
|
Name : |
Mr. S.B. (Ravi) Pandit |
|
Designation : |
Chairman and Group Chief Executive Officer |
|
|
|
|
Name : |
Mr. Kishor Patil |
|
Designation : |
Chief Executive Officer and Managing Director |
|
Qualification : |
B. Com, FCA, AICWA |
|
Date of Appointment : |
28.12.1982 |
|
Last Employment |
Practising Chartered Accountant |
|
|
|
|
Name : |
Mr. Sachin Tikekar |
|
Designation : |
Whole – time Director |
|
|
|
|
Name : |
Prof. Alberto Sangiovanni Vincentelli |
|
Designation : |
Director |
|
|
|
|
Name : |
Mr. Amit Kalyani |
|
Designation : |
Director |
|
|
|
|
Name : |
Mr. Anant Talaulicar |
|
Date of Birth/Age : |
Director |
|
|
|
|
Name : |
Dr. R.A. Mashelkar |
|
Date of Birth/Age : |
Director |
|
|
|
|
Name : |
Ms. Lila Poonawalla |
|
Date of Birth/Age : |
Director |
|
|
|
|
Name : |
Elizabeth Carey |
|
Date of Birth/Age : |
Director |
|
|
|
|
Name : |
Mr. Sanjay Kukreja |
|
Date of Birth/Age : |
Director |
|
|
|
|
Name : |
Mr. B V R Sbbu |
|
Date of Birth/Age : |
Director |
|
|
|
|
Name : |
Adi Engineer |
|
Date of Birth/Age : |
Director |
|
|
|
|
Name : |
Cariappa Chenanda |
|
Date of Birth/Age : |
Alternate Director |
|
|
|
|
Name : |
Dwayne Allen |
|
Date of Birth/Age : |
Alternate Director |
KEY EXECUTIVES
|
Name : |
Mr. R Swaminathan |
|
Designation : |
Company Secretary |
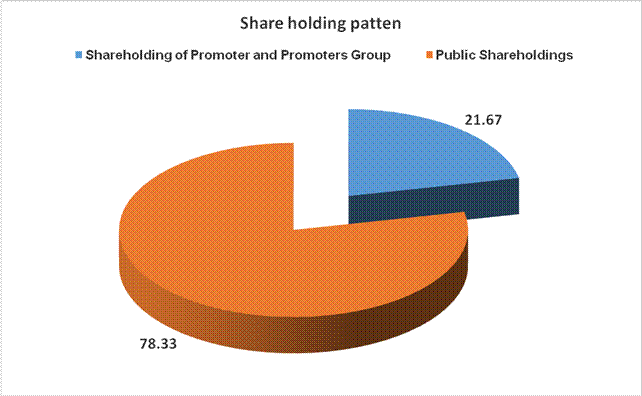
MAJOR SHAREHOLDERS / SHAREHOLDING PATTERN
AS ON 31.03.2015
|
Category of
Shareholder |
No. of Shares |
% of Holdings |
|
(A) Shareholding
of Promoter and Promoter Group |
||
|
|
|
|
|
|
10570930 |
5.38 |
|
|
23410240 |
11.90 |
|
|
8596752 |
4.37 |
|
|
8596752 |
4.37 |
|
|
42577922 |
21.65 |
|
|
|
|
|
|
40000 |
0.02 |
|
|
40000 |
0.02 |
|
Total
shareholding of Promoter and Promoter Group (A) |
42617922 |
21.67 |
|
(B) Public
Shareholding |
||
|
|
|
|
|
|
19759098 |
10.05 |
|
|
873030 |
0.44 |
|
|
1351617 |
0.69 |
|
|
61293443 |
31.17 |
|
|
83277188 |
42.35 |
|
|
|
|
|
|
9500599 |
4.83 |
|
|
|
|
|
|
21849165 |
11.11 |
|
|
6459570 |
3.28 |
|
|
32957669 |
16.76 |
|
|
443233 |
0.23 |
|
|
12857357 |
6.54 |
|
|
21837 |
0.01 |
|
|
1663959 |
0.85 |
|
|
529420 |
0.27 |
|
|
448990 |
0.23 |
|
|
88482 |
0.04 |
|
|
121645 |
0.06 |
|
|
16782746 |
8.53 |
|
|
70767003 |
35.98 |
|
Total Public
shareholding (B) |
154044191 |
78.33 |
|
Total (A)+(B) |
196662113 |
100.00 |
|
(C) Shares held
by Custodians and against which Depository Receipts have been issued |
|
|
|
|
0 |
0.00 |
|
|
0 |
0.00 |
|
|
0 |
0.00 |
|
Total
(A)+(B)+(C) |
196662113 |
0.00 |
Shareholding of securities (including shares, warrants,
convertible securities) of persons belonging to the category Promoter and
Promoter Group
|
Sl.No. |
Name of the
Shareholder |
Details of Shares held |
|
|
No. of Shares held |
As a % of grand total (A)+(B)+(C) |
||
|
1 |
Proficient Finstock LLP |
2,31,09,330 |
11.75 |
|
2 |
Kpit Cummins InfoSystems Limited - Employees Welfare Trust |
85,96,752 |
4.37 |
|
3 |
Shashishekhar B. Pandit |
2,25,000 |
0.11 |
|
4 |
S.B. (Ravi) Pandit Jointy held with Ms Nirmala Pandit |
1,66,000 |
0.08 |
|
5 |
Nirmala Pandit |
2,32,000 |
0.12 |
|
6 |
Hemalata A Shende |
40,000 |
0.02 |
|
7 |
Chinmay Pandit jointly held with Nirmala Pandit |
20,000 |
0.01 |
|
8 |
Chinmay Pandit |
18,620 |
0.01 |
|
9 |
Prachi Pandit |
4,000 |
0.00 |
|
10 |
Kishor P. Patil |
49,56,800 |
2.52 |
|
11 |
Anupama Patil |
90,000 |
0.05 |
|
12 |
Anupama Patil jointly held with Kishor Patil |
32,330 |
0.02 |
|
13 |
Latika Patil |
1,280 |
0.00 |
|
14 |
Kishor Patil jointly held with Anupama Patil |
4,000 |
0.00 |
|
15 |
Shrikrishna Patwardhan |
11,00,000 |
0.56 |
|
16 |
Ajay Shridhar Bhagwat |
26,36,800 |
1.34 |
|
17 |
Ashwini Ajay Bhagwat Jointly held with Mr. Ajay Bhagwat |
43,300 |
0.02 |
|
18 |
Sachin Dattatraya Tikekar |
10,03,800 |
0.51 |
|
19 |
Saroj Dattatray Tikekar jointly with Sachin Dattatraya Tikekar |
37,000 |
0.02 |
|
20 |
K and P Management Services Private Limited |
3,00,910 |
0.15 |
|
|
Total |
4,26,17,922 |
21.67 |
Shareholding of securities (including shares, warrants,
convertible securities) of persons belonging to the category Public and holding
more than 1% of the total number of shares
|
Sl. No. |
Name of the
Shareholder |
No. of Shares held |
Shares as % of Total No. of Shares |
|
|
1 |
Warhol Limited |
19483674 |
9.91 |
|
|
2 |
Van Dyck |
7776000 |
3.95 |
|
|
3 |
Fidelity Puritan Trust-Fidelity Low-Priced Stock Fund |
9000000 |
4.58 |
|
|
4 |
DSP Blackrock Equity Fund |
5198647 |
2.64 |
|
|
5 |
CX Partners Fund 1 Limited |
5081357 |
2.58 |
|
|
6 |
Acacia Partners Lp |
5040000 |
2.56 |
|
|
7 |
Government Pension Fund Global |
4175844 |
2.12 |
|
|
8 |
Apax Partners Europe Managers Limited A/C Pcv Lux Sca |
3508520 |
1.78 |
|
|
9 |
Lazard Emerging Markets Small Cap Equity Trust |
4060428 |
2.06 |
|
|
10 |
Burgundy Asset Management Limited A/C Burgundy Emerging Markets Fund |
3032449 |
1.54 |
|
|
11 |
Birla Sun Life Trustee Company Pvt A/c Birla Sun Life Midcap Fund |
2188791 |
1.11 |
|
|
12 |
Reliance Capital Trustee Company Limited A/c Reliancesmall Cap Fund |
6156738 |
3.13 |
|
|
13 |
Acacia Institutional Partners Lp |
2933900 |
1.49 |
|
|
14 |
Acacia Conservation Fund Lp |
2100000 |
1.07 |
|
|
|
Total |
79736348 |
40.54 |
Shareholding of securities (including shares, warrants,
convertible securities) of persons (together with PAC) belonging to the category
“Public” and holding more than 5% of the total number of shares of the company
|
l. No. |
Name(s) of the
shareholder(s) and the Persons Acting in Concert (PAC) with them |
No. of Shares |
Shares as % of Total No. of Shares |
|
|
1 |
Warhol Limited |
19483674 |
9.91 |
|
|
|
Total |
19483674 |
9.91 |
BUSINESS DETAILS
|
Line of Business : |
Service provider of IT Solutions. |
|
|
|
|
Products : |
Not Available |
|
|
|
|
Brand Names : |
Not Available |
|
|
|
|
Agencies Held : |
Not Available |
|
|
|
|
Exports : |
Not Available |
|
|
|
|
Imports : |
Not Available |
|
|
|
|
Terms : |
|
|
Selling : |
Cash and Credit (30/60/90 days) |
|
|
|
|
Purchasing : |
Cash and Credit (30/60/90 days) |
GENERAL INFORMATION
|
Suppliers : |
|
|||||||||||||||||||||||||||||||||||||||
|
|
|
|||||||||||||||||||||||||||||||||||||||
|
Customers : |
|
|||||||||||||||||||||||||||||||||||||||
|
|
|
|||||||||||||||||||||||||||||||||||||||
|
No. of Employees : |
1500 (Approximately) |
|||||||||||||||||||||||||||||||||||||||
|
|
|
|||||||||||||||||||||||||||||||||||||||
|
Bankers : |
|
|||||||||||||||||||||||||||||||||||||||
|
|
|
|||||||||||||||||||||||||||||||||||||||
|
Facilities : |
|
|||||||||||||||||||||||||||||||||||||||
|
|
|
|
Auditors : |
|
|
Name : |
B S R and Company LLP Chartered Accountants |
|
Address : |
701-703, 7 Floor Godrej Castlemaine Next to Ruby Hall
Clinic Bund Garden Road Pune – 411001, Maharashtra, India |
|
|
|
|
Memberships : |
Not Available |
|
|
|
|
Collaborators : |
Not Available |
|
|
|
|
Associate company : |
GAIA System Solution Inc |
|
|
|
|
Joint venture : |
Impact Automotive Solutions Limited |
|
|
|
|
Subsidiary
Companies (Direct Holding) : |
|
|
|
|
|
Subsidiary Companies
(Indirect Holding) : |
|
|
|
|
|
Enterprise over
which KMP has significant influence : |
|
CAPITAL STRUCTURE
AS ON 25.07.2014
Authorised Capital : Rs. 1250.000 Million
Issued, Subscribed & Paid-up Capital : Rs. 393.324
Million
AS ON 31.03.2014
Authorised Capital :
|
No. of Shares |
Type |
Value |
Amount |
|
|
|
|
|
|
375000000 |
Equity Shares |
Rs.2/- each |
Rs. 750.000 Millions |
|
|
|
|
|
Issued, Subscribed & Paid-up Capital :
|
No. of Shares |
Type |
Value |
Amount |
|
|
|
|
|
|
185494720 |
Equity Shares |
Rs.2/- each |
Rs. 370.989
Millions |
|
|
|
|
|
i) Reconciliation of the number of equity
shares outstanding:
|
|
31.03.2014 |
|
|
Particulars |
Number of Shares |
Rs. In Millions |
|
Number of shares outstanding at the beginning of the year |
192815199 |
385.630 |
|
Add: Shares issued on exercise of employee stock options |
1257008 |
2.514 |
|
Add: Issue of bonus shares |
-- |
-- |
|
Add: Shares issued on preferential basis |
-- |
-- |
|
Less : Shares held by KPIT Technologies Limited Employee Welfare Trust |
8577487 |
17.154 |
|
Number of shares outstanding at the end of the year |
185494720 |
370.989 |
ii) The Company
has only one class of shares referred to as equity shares having a par value of
` 2. Each shareholder of equity shares is entitled to one vote per share
iii) Number of equity
shares held by each shareholder holding more than 5% shares in the Company are
as follows :
|
|
31.03.2014 |
|
|
Particulars |
Number of Shares |
% of shares held |
|
Warhol Limited |
23,109,330 |
11.91% |
|
Proficient Trading and Investment Private Limited |
18,858,440 |
9.72% |
iv) 8,169,543 equity shares (Previous year 10,060,077) of Rs. 2 each are reserved for issuance towards outstanding employee stock options granted.
v) Aggregate number
of equity shares alloted as fully paid up by way of bonus shares for the period
of five years immediately preceding the Balance Sheet date - 88,971,438
(Previous year 88,971,438)
FINANCIAL DATA
[all figures are
in Rupees Million]
ABRIDGED BALANCE
SHEET
|
SOURCES OF FUNDS |
31.03.2014 |
31.03.2013 |
31.03.2012 |
|
I.
EQUITY
AND LIABILITIES |
|
|
|
|
(1)Shareholders' Funds |
|
|
|
|
(a) Share Capital |
370.989 |
385.630 |
355.885 |
|
(b) Reserves & Surplus |
10063.435 |
8486.103 |
5786.070 |
|
(c) Money
received against share warrants |
0.000 |
0.000 |
0.000 |
|
|
|
|
|
|
(2) Share Application money pending
allotment |
14.844 |
0.935 |
1.054 |
|
Total
Shareholders’ Funds (1) + (2) |
10449.268 |
8872.668 |
6143.009 |
|
|
|
|
|
|
(3)
Non-Current Liabilities |
|
|
|
|
(a) long-term borrowings |
909.875 |
996.905 |
3.698 |
|
(b) Deferred tax liabilities (Net) |
30.644 |
0.000 |
7.464 |
|
(c) Other long term
liabilities |
0.000 |
0.000 |
263.983 |
|
(d) long-term provisions |
136.243 |
111.213 |
69.405 |
|
Total Non-current
Liabilities (3) |
1076.762 |
1108.118 |
344.550 |
|
|
|
|
|
|
(4)
Current Liabilities |
|
|
|
|
(a) Short
term borrowings |
2858.575 |
1616.690 |
1400.045 |
|
(b) Trade
payables |
410.443 |
381.551 |
543.160 |
|
(c) Other
current liabilities |
1031.943 |
1024.596 |
595.697 |
|
(d) Short-term
provisions |
507.618 |
310.503 |
261.399 |
|
Total Current
Liabilities (4) |
4808.579 |
3333.340 |
2800.301 |
|
|
|
|
|
|
TOTAL |
16334.609 |
13314.126 |
9287.860 |
|
|
|
|
|
|
II.
ASSETS |
|
|
|
|
(1)
Non-current assets |
|
|
|
|
(a) Fixed
Assets |
|
|
|
|
(i)
Tangible assets |
1290.965 |
1187.479 |
1167.854 |
|
(ii)
Intangible Assets |
510.839 |
240.740 |
276.101 |
|
(iii) Capital
work-in-progress |
22.209 |
16.955 |
73.083 |
|
(iv)
Intangible assets under development |
0.000 |
183.596 |
92.618 |
|
(b) Non-current Investments |
6492.404 |
5364.751 |
3663.193 |
|
(c) Deferred tax assets (net) |
0.000 |
7.077 |
0.000 |
|
(d) Long-term Loan and Advances |
1217.784 |
880.308 |
852.105 |
|
(e) Other
Non-current assets |
15.662 |
31.871 |
30.513 |
|
Total Non-Current
Assets |
9549.863 |
7912.777 |
6155.467 |
|
|
|
|
|
|
(2)
Current assets |
|
|
|
|
(a)
Current investments |
1660.549 |
2034.897 |
363.159 |
|
(b)
Inventories |
23.339 |
0.000 |
0.000 |
|
(c) Trade
receivables |
3568.028 |
2225.093 |
1945.893 |
|
(d) Cash
and cash equivalents |
577.307 |
689.828 |
397.632 |
|
(e)
Short-term loans and advances |
612.472 |
350.216 |
371.999 |
|
(f) Other
current assets |
343.051 |
101.315 |
53.710 |
|
Total
Current Assets |
6784.746 |
5401.349 |
3132.393 |
|
|
|
|
|
|
TOTAL |
16334.609 |
13314.126 |
9287.860 |
PROFIT & LOSS
ACCOUNT
|
|
PARTICULARS |
31.03.2014 |
31.03.2013 |
31.03.2012 |
|
|
|
SALES |
|
|
|
|
|
|
|
Income |
8900.852 |
7152.407 |
6128.918 |
|
|
|
Other Income |
170.659 |
81.577 |
59.217 |
|
|
|
TOTAL |
9071.511 |
7233.984 |
6188.135 |
|
|
|
|
|
|
|
|
Less |
EXPENSES |
|
|
|
|
|
|
|
Cost of Materials Consumed |
25.717 |
0.000 |
0.000 |
|
|
|
Employees benefits expense |
4458.720 |
3746.204 |
3340.063 |
|
|
|
Other expenses |
2136.359 |
1669.130 |
1438.733 |
|
|
|
TOTAL |
6620.796 |
5415.334 |
4778.796 |
|
|
|
|
|
|
|
|
|
PROFIT/
(LOSS) BEFORE INTEREST, TAX,
DEPRECIATION AND AMORTISATION |
2450.715 |
1818.650 |
1409.339 |
|
|
|
|
|
|
|
|
|
Less |
FINANCIAL
EXPENSES |
200.339 |
82.123 |
45.493 |
|
|
|
|
|
|
|
|
|
|
PROFIT
/ (LOSS) BEFORE TAX, DEPRECIATION AND AMORTISATION |
2250.376 |
1736.527 |
1363.846 |
|
|
|
|
|
|
|
|
|
Less/ Add |
DEPRECIATION/
AMORTISATION |
399.619 |
375.140 |
395.677 |
|
|
|
|
|
|
|
|
|
Less/ Add |
EXCEPTIONAL
ITEMS |
122.410 |
(18.481) |
100.451 |
|
|
|
|
|
|
|
|
|
|
PROFIT/
(LOSS) BEFORE TAX |
1973.167 |
1342.906 |
1068.620 |
|
|
|
|
|
|
|
|
|
Less |
TAX |
481.594 |
312.394 |
321.936 |
|
|
|
|
|
|
|
|
|
|
PROFIT/
(LOSS) AFTER TAX |
1491.573 |
1030.512 |
746.684 |
|
|
|
|
|
|
|
|
|
|
EARNINGS IN
FOREIGN CURRENCY |
|
|
|
|
|
|
|
Export of Software Services |
5936.323 |
5873.582 |
5156.094 |
|
|
|
Interest on Fixed Deposits |
0.002 |
0.001 |
0.001 |
|
|
|
Interest from Inter Company loans |
19.353 |
11.923 |
2.079 |
|
|
TOTAL EARNINGS |
5955.678 |
5885.506 |
5158.174 |
|
|
|
|
|
|
|
|
|
|
IMPORTS |
|
|
|
|
|
|
|
Capital Goods |
112.126 |
86.172 |
145.423 |
|
|
TOTAL IMPORTS |
112.126 |
86.172 |
145.423 |
|
|
|
|
|
|
|
|
|
|
Earnings / (Loss)
Per Share (Rs.) |
|
|
|
|
|
|
Basic |
7.97 |
5.63 |
4.21 |
|
|
|
Diluted |
7.76 |
5.47 |
4.15 |
|
QUARTERLY RESULTS
|
Particulars
(Rs.Cr) |
Jun 2014 |
Sep 2014 |
Dec 2014 |
Mar 2015 |
|
Unaudited |
Unaudited |
Unaudited |
Unaudited |
Unaudited |
|
Net Sales |
2273.500 |
3880.200 |
2975.600 |
3212.500 |
|
Total Expenditure |
1756.700 |
2795.400 |
2657.000 |
2747.500 |
|
PBIDT (Excl OI) |
516.800 |
1084.800 |
318.600 |
465.100 |
|
Other Income |
110.200 |
58.800 |
27.300 |
48.300 |
|
Operating Profit |
627.100 |
1143.600 |
345.900 |
513.300 |
|
Interest |
35.500 |
25.100 |
33.900 |
127.000 |
|
Exceptional Items |
0.000 |
0.000 |
0.000 |
0.000 |
|
PBDT |
591.600 |
1118.500 |
311.900 |
386.300 |
|
Depreciation |
126.200 |
213.800 |
182.000 |
172.400 |
|
Profit Before Tax |
465.400 |
904.700 |
130.000 |
214.000 |
|
Tax |
130.400 |
277.600 |
118.200 |
(332.600) |
|
Provisions and contingencies |
0.000 |
0.000 |
0.000 |
0.000 |
|
Profit After Tax |
335.000 |
627.100 |
11.800 |
546.600 |
|
Extraordinary Items |
0.000 |
0.000 |
0.000 |
0.000 |
|
Prior Period Expenses |
0.000 |
0.000 |
0.000 |
0.000 |
|
Other Adjustments |
0.000 |
0.000 |
0.000 |
0.000 |
|
Net Profit |
335.000 |
627.100 |
11.800 |
546.600 |
Expected Sales (2014-15): Rs. 10000.000 Million
The above information has been parted by Mr. Mandar (Assistant Manager
Finance)
KEY RATIOS
|
PARTICULARS |
|
31.03.2014 |
31.03.2013 |
31.03.2012 |
|
|
|
|
|
|
|
Net Profit Margin PAT / Sales |
(%) |
16.75
|
14.41 |
12.18 |
|
|
|
|
|
|
|
Operating Profit Margin (PBDIT/Sales) |
(%) |
27.53
|
25.43 |
22.99 |
|
|
|
|
|
|
|
Return on Total Assets (PBT/Total Assets} |
(%) |
20.09 |
17.35 |
19.58 |
|
|
|
|
|
|
|
Return on Investment (ROI) (PBT/Networth) |
|
0.19 |
0.15 |
0.17 |
|
|
|
|
|
|
|
Debt Equity Ratio (Total Debts/Networth) |
|
0.36 |
0.29 |
0.23 |
|
|
|
|
|
|
|
Current Ratio (Current Asset/Current Liability) |
|
1.41 |
1.62 |
1.12 |
FINANCIAL ANALYSIS
[all figures are
in Rupees Million]
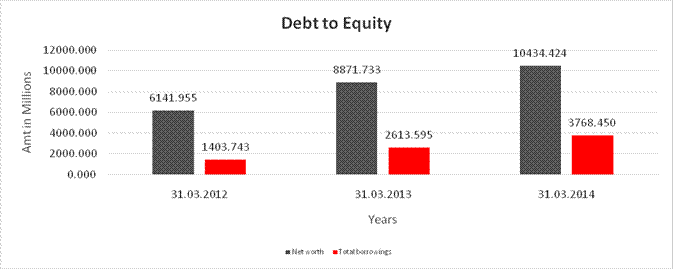
DEBT EQUITY RATIO
|
Particular |
31.03.2012 |
31.03.2013 |
31.03.2014 |
|
|
(Rs.
In Millions) |
(Rs.
In Millions) |
(Rs.
In Millions) |
|
Share Capital |
355.885 |
385.630 |
370.989 |
|
Reserves & Surplus |
5786.070 |
8486.103 |
10063.435 |
|
Share Application money
pending allotment |
1.054 |
0.935 |
14.844 |
|
Net
worth |
6141.955 |
8871.733 |
10434.424 |
|
|
|
|
|
|
long-term borrowings |
3.698 |
996.905 |
909.875 |
|
Short term borrowings |
1400.045 |
1616.690 |
2858.575 |
|
Total
borrowings |
1403.743 |
2613.595 |
3768.450 |
|
Debt/Equity
ratio |
0.229 |
0.295 |
0.361 |
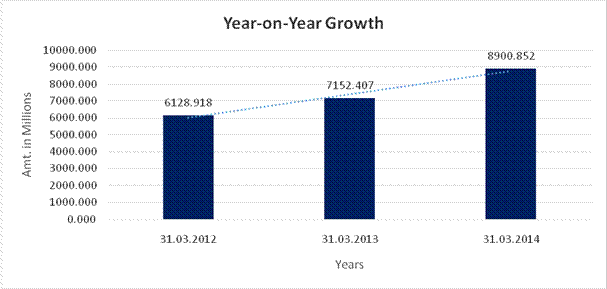
YEAR-ON-YEAR GROWTH
|
Year
on Year Growth |
31.03.2012 |
31.03.2013 |
31.03.2014 |
|
|
(Rs.
In Millions) |
(Rs.
In Millions) |
(Rs.
In Millions) |
|
Sales |
6128.918 |
7152.407 |
8900.852 |
|
|
|
16.699 |
24.446 |
NET PROFIT MARGIN
|
Net
Profit Margin |
31.03.2012 |
31.03.2013 |
31.03.2014 |
|
|
(Rs.
In Millions) |
(Rs.
In Millions) |
(Rs.
In Millions) |
|
Sales |
6128.918 |
7152.407 |
8900.852 |
|
Profit |
746.684 |
1030.512 |
1491.573 |
|
|
12.18% |
14.41% |
16.76% |
LOCAL AGENCY FURTHER INFORMATION
CURRENT MATURITIES
OF LONG-TERM DEBT DETAILS:
|
Particulars |
31.03.2014 |
31.03.2013 |
31.03.2012 |
|
|
(Rs. In Millions) |
||
|
Current maturities of long-term debt |
|
|
|
|
From Banks (Secured by first charge by way of mortgage of certain movable and
immovable current and future fixed assets) |
302.007 |
136.842 |
0.000 |
|
Total |
302.007 |
136.842 |
0.000 |
|
Sr. No. |
Check List by Info Agents |
Available in
Report (Yes / No) |
|
1] |
Year of Establishment |
Yes |
|
2] |
Locality of the firm |
Yes |
|
3] |
Constitutions of the firm |
Yes |
|
4] |
Premises details |
No |
|
5] |
Type of Business |
Yes |
|
6] |
Line of Business |
Yes |
|
7] |
Promoter's background |
Yes |
|
8] |
No. of employees |
Yes |
|
9] |
Name of person contacted |
Yes |
|
10] |
Designation of contact
person |
Yes |
|
11] |
Turnover of firm for last
three years |
Yes |
|
12] |
Profitability for last
three years |
Yes |
|
13] |
Reasons for variation
<> 20% |
--- |
|
14] |
Estimation for coming
financial year |
Yes |
|
15] |
Capital in the business |
Yes |
|
16] |
Details of sister
concerns |
Yes |
|
17] |
Major suppliers |
No |
|
18] |
Major customers |
No |
|
19] |
Payments terms |
Yes |
|
20] |
Export / Import details
(if applicable) |
No |
|
21] |
Market information |
--- |
|
22] |
Litigations that the firm
/ promoter involved in |
--- |
|
23] |
Banking Details |
Yes |
|
24] |
Banking facility details |
Yes |
|
25] |
Conduct of the banking
account |
--- |
|
26] |
Buyer visit details |
--- |
|
27] |
Financials, if provided |
Yes |
|
28] |
Incorporation details, if
applicable |
Yes |
|
29] |
Last accounts filed at
ROC |
Yes |
|
30] |
Major Shareholders, if
available |
Yes |
|
31] |
Date of Birth of
Proprietor/Partner/Director, if available |
No |
|
32] |
PAN of
Proprietor/Partner/Director, if available |
No |
|
33] |
Voter ID No of
Proprietor/Partner/Director, if available |
No |
|
34] |
External Agency Rating,
if available |
Yes |
RESULTS OF OPERATIONS
During the year, the total revenues from operations (consolidated) increased to Rs. 26940.40 Million, a growth of 20% over the previous year. Earnings before interest, tax, depreciation and amortization was Rs. 4232.76 Million on consolidated basis. Net profit after tax (consolidated) grew by 25% to Rs. 2489.50 Million.
In US Dollar terms, revenues from operations for the year on consolidated basis was 444.32 Million as against 410.45 Million during the previous year, a growth of 8%. Average realization rate was Rs. 60.63 per US Dollar.
Standalone sales for the fiscal year 2013-14 grew by 24% to
reach Rs. 8,900.85 Million. Net profit after tax increased by 45 % to Rs.
1,491.57 Million.
INFORMATION ABOUT THE
SUBSIDIARY COMPANIES
As on March 31, 2014, the Company had 15 subsidiaries, including step-down subsidiaries.
During the year, Systime Global Solutions Private Limited was converted into a public limited company and was rechristened as KPIT Global Solutions Limited. Further, the Company increased its shareholding in KPIT Global Solutions Limited to 100%.
The Hon’ble High Court of Delhi has approved the Scheme of Amalgamation of Sparta Infotech India Private Limited (earlier 100% subsidiary of the Company) with the Company, vide Order dated January 30, 2014 and therefore, Sparta Infotech India Private Limited has ceased to exist as a separate company.
With effect from 1st April, 2013, ikv++ Technologies AG became a 100% subsidiary of the Company, consequent to the acquisition of its entire share capital by KPIT Infosystems GmbH.
During the year, name of KPIT Infosystems GmbH has been changed to KPIT Technologies GmbH.
The details of individual financial performance of the subsidiaries have been reported in the statement pursuant to Section 212 of the Companies Act, 1956, which is given elsewhere in the Annual Report.
AWARDS AND
RECOGNITION
- Federation of Indian
Chambers of Commerce and Industry (FICCI) felicitated KPIT’s Chhote
Scientists initiative at the 13th FICCI CSR Award ceremony for integrating
and internalizing Corporate Social Responsibility into the overall
corporate strategy.
- KPIT achieved the
prestigious Verafirm-Certified from BSA, acknowledging KPIT’s effective
governance practices, high level of sophistication and reliability in
Software Asset Management.
- Shrikant Kulkarni, CIO,
KPIT, was awarded the Dataquest Editors Choice CIO Excellence Award 2013,
in recognition of his significant contribution in leading the high end
technology initiatives at KPIT.
- KPIT was awarded the
Microsoft customer spotlight recognition award for Reimaging cloud.
- VMware awarded the
renowned IT excellence - Best Implementation Award to KPIT under Desktop
Virtualization category.
- KPIT won ‘Best Performance
in Service Delivery’ award from SAP India in recognition of more than 20
successful projects executed by the Company using IP based solutions in
SAP India.
- KPIT won the Cummins CMD
(Chairman and Managing Director) Awards 2012, in the CSR category for
Chhote Scientists initiative.
COMPANY OVERVIEW
KPIT Technologies Limited (“the Company”) is a public company incorporated under the Companies Act, 1956 and its shares are listed on the National Stock Exchange and Bombay Stock Exchange. The Company’s registered office is in Pune and it has subsidiaries across the geographies. Most of the revenue is generated from the export of services.
The Company provides Software development, IT consulting and Product Engineering solutions to its clients, predominantly in Automotive and Transportation, Manufacturing and Energy and Utilities verticals. The Company is also engaged in the production of Integrated Systems product engineering solutions.
MANAGEMENT DISCUSSION
AND ANALYSIS
Global Economic
Scenario:
The year FY 2013-14 has been a mixed year for global technology market. While the spending on IT goods and services caught momentum in US, Latin America, Eastern Europe, Middle East, Africa and parts of APAC, the trend was not so encouraging for the Western and Central Europe, Japan, Canada and Australia. The software segment observed good traction, mainly for analytical and collaborative applications and SaaS products. IT consulting and system integration services observed a stronger demand as compared to IT outsourcing and hardware maintenance. In US the demand for new technologies like cloud, mobile and smart computing is pushing the technology market growth ahead of nominal GDP growth. Despite economic worries in some parts of Europe, there is still an uptake in these new technologies. In other markets such as India, China, Latin America, Southern Europe and Eastern Europe/Middle East and Africa, businesses and governments are focused more on established technologies, with a few sections showing interest in newer areas.
As an overall trend, businesses globally are investing in a broader trend of intelligent and connected end products. Attention to end consumers and use of technology to satisfy consumer demand is driving technology investments. Technology budgets within organizations are being owned by a broader spectrum of business heads, who partner with specialists, who can help solve their ongoing and future business issues. Thus, in the years to come, the world will witness more intelligent products backed by technology investments being introduced in the market at a faster pace.
Industry Growth
Estimates:
The world-wide IT spending in 2014:
- Is expected to reach USD
3.8 Trillion, an increase of 3.1% from 2013 spending of USD 3.7 Trillion.
- The enterprise software
related spend is estimated to reach USD 320 Billion compared to USD 300
Billion in 2013, a growth of 6.8%.
- IT services spend is
expected to reach USD 963 Billion, a growth of 4.5% against USD 922
Billion in 2013.
In FY2014 Indian IT-BPM sector is expected to generate:
- Total revenues of USD 118
Billion, growing by 8.8% over FY2013.’
- Exports are estimated to
cross USD 86 Billion, a Y-o-Y growth of 13%.
- Domestic market is likely
to grow by 9.7% to ` 1,910 Billion.
FY2015 outlook for Indian IT BPM industry:
- Domestic revenue to grow
by 9% - 12% to USD 21 Billion – USD 23 Billion.
- Exports are likely to
register 13% - 15% growth to reach USD 97 Billion – USD 100 Billion.
Focus Industry
Trends:
Year 2014 is expected to be a good year for the US manufacturing sector with growth coming back and companies adding capacity and labor. Easing energy costs and inflation in the emerging markets is enabling core manufacturing to bounce back in the US. According to the Manufacturers Alliance for Productivity and Innovation, US’s industrial manufacturing production is expected to grow by 2.4% in 2014 and another 4.1% in 2015. The enterprise IT spending for manufacturing and natural resources sector is expected to reach USD 498 Billion in 2014, up 3.4% from USD 482 Billion in 2013.
Technology is a crucial driver of competitiveness in the manufacturing industry. Today manufacturers are investing in building an IT infrastructure which will help them in reducing production costs, thereby enabling higher productivity, improved product quality, better process management and faster product development. Enterprises have become more agile and well networked by using information and analytics in product design and manufacturing to boost resource efficiency, resulting in greater visibility in supply chains. The 3D printing technology is altering the face of collaborative design and manufacturing process. It is further shrinking lead times and leading to mass personalization. Machine to Machine Communication (M2M) eventually leading to Internet of Things (IoT) is an important investment area for manufacturers across the globe. With implementation of ERP technologies, manufacturers have accumulated vast amounts of data and they are looking at leveraging this data for gaining competitive edge and improve profitability. Enterprises are merging Big Data with cloud platform to get full potential of this data without having to incur any capital investment in infrastructure. There is an increased usage of mobile, social and collaboration technologies by manufacturers to create meaningful connections and ensure faster and more efficient internal business processes.
The automotive industry is getting reshaped by the factors affecting the global economy and in particular by the growing impact of emerging markets. By 2020, IHS forecasts that emerging markets such as China, Brazil, Eastern Europe, Middle East and South America will represent over 50% of global vehicle capacity share while India is expected to emerge as a global center for the development and manufacturing of small cars. As the industry becomes more global, automakers are striving to use flexible, modular platforms to bring in standardization. It is estimated that by 2020, the 10 major OEMs will concentrate mass production across a few core platforms enabling them to reduce the total number by a third. Fuel efficiency and alternate fuel technologies continue to be a priority for automotive companies driven by environmental regulations and rising fuel costs. They are investing in powertrain technology mainly in the area of Internal Combustion Engine (ICE) downsizing and optimization. Plug-in hybrids are becoming a dominant investment area and are expected to take an increasing market share in future. The number of Plug-in Electric Vehicles (PEVs) on US roads are expected to grow from 296,000 in 2014 to more than 2.7 Million in 2023, a growth of more than 800% in a period of less than 10 years.
The connected car is already the third fastest growing technology device after phones and tablets. It is expected that by 2022, there will be 1.8 Billion automotive M2M connections, which will comprise of 700 Million Connected Cars and 1.1 Billion aftermarket devices for services such as navigation, usage-based insurance, stolen vehicle recovery and infotainment. The auto industry is evolving from the connected vehicle to the connected driver and to the connected consumer. With rising urbanization and change in customer behavior, mobility solutions are being considered as viable alternatives to car ownership and Mobility-as-a-Service (MaaS) has started to make inroads particularly in more established automotive markets. OEMs are therefore devising strategies to sell their software brands independent of the car sales. As vehicles become embedded with more software and electronics, self-driving cars are no longer a virtual thing but a near-future possibility. The global utilities industry is in the midst of a paradigm shift as they are bringing in flexibility and innovation in their business models, technology usage and consumer connect. The key investment areas for utilities include analytics, mobility, Cloud, social media and cyber-security. The enterprise IT spending for utilities is expected to reach USD 142 Billion in 2014, up by 3.3% from USD 138 Billion in 2013. Similarly oil & gas companies are also increasing their IT spending with priorities including investments towards clean and sustainable energy, standardization, cost rationalization, simplification and security. The IT spending by oil and gas companies will increase from USD 37.6 Billion in 2011 to USD 49.4 Billion in 2016. With the convergence of IT and operational technologies, CIOs are looking beyond IT operations and business services to business innovation and flexibility.
With the onset of digital transformation, smart grid
technology adoption has helped utility companies respond more effectively to
their business pressures and make their operations more efficient. Today it is
not only restricted to electric utilities but has found its way in water and
gas utility companies as well. However, it is not the only investment area as
utilities are also investing to improve power quality, reliability and distribution,
asset management and customer engagement experience. In February 2013, US
president Barack Obama issued an Executive Order entitled ‘Improving Critical
Infrastructure Cybersecurity’ which requires all critical infrastructures to be
protected against cyber threats. Driven by security concerns, Smart grid
cybersecurity is amongst the top smart solutions that utilities are expected to
invest in over the next two years. Utility companies are gathering a vast
amount of data through smart grid and smart metering investments and are
devising strategies to leverage and use the data through a cost effective
analytics infrastructure. Analytics along with cloud based technologies enable
utilities to gain maximum value from their IT investments. The emergence of new
digital technologies is ensuring utilities to prioritize their business
investments and budget spends in a manner that will enable them to form new
relationships with their existing and future customers. In the Oil & Gas
sector the investments have been in the areas of application and data security.
Now the companies are also spending on analytical tools to extract information
from their vast collection of data. Digital oilfield and integrated operations
will drive the next growth phase in this sector. With increasing usage of
advanced technologies, the concept of smart pipeline is gaining momentum. Cloud
is expected to be adopted by larger number of companies while Big Data,
Analytics and mobility will be the top areas of third platform investments by
Oil & Gas companies.
INDEX OF CHARGES
|
S.No. |
Charge ID |
Date of Charge Creation/Modification |
Charge amount secured |
Charge Holder |
Address |
Service Request Number (SRN) |
|
1 |
10522485 |
16/09/2014 |
2,000,000,000.00 |
THE HONKONG AND SHANGHAI
BANKING CORPORATION LIMIT |
PLOT NO.139,140B,
WESTERN EXPRESS HIGHWAY, SAHAR |
C23017833 |
|
2 |
10527152 |
28/05/2014 |
44,110,108.00 |
SREI EQUIPMENT FINANCE LIMITED |
'VISHWAKARMA', 86C, TOPSIA ROAD, KOLKATA, West Bengal - 700046, INDIA |
C30618797 |
|
3 |
10367459 |
05/07/2012 |
37,098,544.00 |
CISCO SYSTEMS CAPITAL (INDIA) PRIVATE LIMITED |
2nd Floor, Brigade
South Parade, 10, M.G. Road, Karnataka - 560001, INDIA |
B44485464 |
|
4 |
10348266 |
02/04/2012 |
55,095,779.00 |
CISCO SYSTEMS CAPITAL (INDIA) PRIVATE LIMITED |
2nd Floor, Brigade
South Parade, 10, M.G. Road, Karnataka - 560001, INDIA |
B37171485 |
|
5 |
10346280 |
28/02/2012 |
100,000,000.00 |
HDFC BANK LIMITED |
HDFC BANK HOUSESENAPATI BAPAT MARG, LOWER PAREL W, MUMBAI, Maharashtra - 400013, INDIA |
B36569275 |
|
6 |
10278505 |
28/02/2014 * |
200,000,000.00 |
DBS Bank Ltd |
3 Salarpuria Windsor, Ulsoor Road, Bangalore, Karnataka - 560042, INDIA |
C00336628 |
|
7 |
10281271 |
23/05/2013 * |
100,000,000.00 |
KOTAK MAHINDRA BANK LIMITED |
36-38A, NARIMAN
BHAVAN, 227,D, NARIMAN POINT, M Maharashtra - 400021, INDIA |
B77088896 |
|
8 |
10264749 |
29/12/2010 |
50,000,000.00 |
ICICI BANK LIMITED |
LANDMARKRACE COURCE CIRCLE, ALKAPURI, BARODA, Gujarat - 390015, INDIA |
B05080783 |
|
9 |
10184801 |
29/09/2009 |
100,000,000.00 |
AXIS BANK LIMITED |
1262/B, STERLING PLAZA,
DECCAN GYMKHANA, JANGLI |
A72962897 |
|
10 |
10163385 |
24/01/2012 * |
80,000,000.00 |
STANDARD CHARTERED BANK |
90, M.G. ROAD, FORT, MUMBAI, Maharashtra - 400001, INDIA |
B31047202 |
* Date of charge modification
FIXED ASSETS
- Land
- Buildings
- Plant and
Equipments
- Furniture and
Fixture
- Vehicles
- Office
Equipments
CMT REPORT (Corruption, Money Laundering & Terrorism]
The Public Notice information has been collected from various sources
including but not limited to: The Courts,
1] INFORMATION ON
DESIGNATED PARTY
No exist designating subject or any of its beneficial owners, controlling
shareholders or senior officers as terrorist or terrorist organization or whom
notice had been received that all financial transactions involving their assets
have been blocked or convicted, found guilty or against whom a judgement or
order had been entered in a proceedings for violating money-laundering,
anti-corruption or bribery or international economic or anti-terrorism sanction
laws or whose assets were seized, blocked, frozen or ordered forfeited for
violation of money laundering or international anti-terrorism laws.
2] Court Declaration :
No exist to suggest that subject is or was
the subject of any formal or informal allegations, prosecutions or other
official proceeding for making any prohibited payments or other improper payments
to government officials for engaging in prohibited transactions or with
designated parties.
3] Asset Declaration :
No records exist to suggest that the property or assets of the subject
are derived from criminal conduct or a prohibited transaction.
4] Record on Financial
Crime :
Charges or conviction
registered against subject: None
5] Records on Violation of
Anti-Corruption Laws :
Charges or
investigation registered against subject: None
6] Records on Int’l
Anti-Money Laundering Laws/Standards :
Charges or
investigation registered against subject: None
7] Criminal Records
No
available information exist that suggest that subject or any of its principals
have been formally charged or convicted by a competent governmental authority for
any financial crime or under any formal investigation by a competent government
authority for any violation of anti-corruption laws or international anti-money
laundering laws or standard.
8] Affiliation with
Government :
No record
exists to suggest that any director or indirect owners, controlling
shareholders, director, officer or employee of the company is a government
official or a family member or close business associate of a Government
official.
9] Compensation Package :
Our market
survey revealed that the amount of compensation sought by the subject is fair
and reasonable and comparable to compensation paid to others for similar
services.
10] Press Report :
No press reports / filings exists on
the subject.
CORPORATE GOVERNANCE
MIRA INFORM as part of its Due Diligence do provide comments on
Corporate Governance to identify management and governance. These factors often
have been predictive and in some cases have created vulnerabilities to credit
deterioration.
Our Governance Assessment focuses principally on the interactions
between a company’s management, its Board of Directors, Shareholders and other
financial stakeholders.
CONTRAVENTION
Subject is not known to have contravened any existing local laws,
regulations or policies that prohibit, restrict or otherwise affect the terms
and conditions that could be included in the agreement with the subject.
FOREIGN EXCHANGE RATES
|
Currency |
Unit
|
Indian Rupees |
|
US Dollar |
1 |
Rs. 63.20 |
|
|
1 |
Rs. 97.00 |
|
Euro |
1 |
Rs. 69.33 |
INFORMATION DETAILS
|
Information
Gathered by : |
PPT |
|
|
|
|
Analysis Done by
: |
KAR |
|
|
|
|
Report Prepared
by : |
JYO |
SCORE & RATING EXPLANATIONS
|
SCORE FACTORS |
RANGE |
POINTS |
|
HISTORY |
1~10 |
8 |
|
PAID-UP CAPITAL |
1~10 |
7 |
|
OPERATING SCALE |
1~10 |
8 |
|
FINANCIAL
CONDITION |
|
|
|
--BUSINESS SCALE |
1~10 |
8 |
|
--PROFITABILITY |
1~10 |
8 |
|
--LIQUIDITY |
1~10 |
8 |
|
--LEVERAGE |
1~10 |
7 |
|
--RESERVES |
1~10 |
8 |
|
--CREDIT LINES |
1~10 |
8 |
|
--MARGINS |
-5~5 |
-- |
|
DEMERIT POINTS |
|
|
|
--BANK CHARGES |
YES/NO |
YES |
|
--LITIGATION |
YES/NO |
NO |
|
--OTHER ADVERSE INFORMATION |
YES/NO |
NO |
|
MERIT POINTS |
|
|
|
--SOLE DISTRIBUTORSHIP |
YES/NO |
NO |
|
--EXPORT ACTIVITIES |
YES/NO |
NO |
|
--AFFILIATION |
YES/NO |
YES |
|
--LISTED |
YES/NO |
YES |
|
--OTHER MERIT FACTORS |
YES/NO |
YES |
|
DEFAULTER |
|
|
|
--RBI |
YES/NO |
NO |
|
--EPF |
YES/NO |
NO |
|
TOTAL |
|
70 |
This score serves as a reference to assess SC’s
credit risk and to set the amount of credit to be extended. It is calculated
from a composite of weighted scores obtained from each of the major sections of
this report. The assessed factors and their relative weights (as indicated
through %) are as follows:
Financial
condition (40%) Ownership
background (20%) Payment
record (10%)
Credit history
(10%) Market trend (10%) Operational size
(10%)
RATING EXPLANATIONS
|
RATING |
STATUS |
PROPOSED CREDIT LINE |
|
|
>86 |
Aaa |
Possesses an extremely sound financial base with the strongest
capability for timely payment of interest and principal sums |
Unlimited |
|
71-85 |
Aa |
Possesses adequate working capital. No caution needed for credit
transaction. It has above average (strong) capability for payment of interest
and principal sums |
Large |
|
56-70 |
A |
Financial & operational base are regarded healthy. General
unfavourable factors will not cause fatal effect. Satisfactory capability for
payment of interest and principal sums |
Fairly Large |
|
41-55 |
Ba |
Overall operation is considered normal. Capable to meet normal
commitments. |
Satisfactory |
|
26-40 |
B |
Capability to overcome financial difficulties seems comparatively below
average. |
Small |
|
11-25 |
Ca |
Adverse factors are apparent. Repayment of interest and principal sums
in default or expected to be in default upon maturity |
Limited with
full security |
|
<10 |
C |
Absolute credit risk exists. Caution needed to be exercised |
Credit not
recommended |
|
-- |
NB |
New Business |
-- |
This report is issued at your request without any
risk and responsibility on the part of MIRA INFORM PRIVATE LIMITED (MIPL) or
its officials.