MIRA INFORM REPORT
|
Report No. : |
334505 |
|
Report Date : |
04.08.2015 |
IDENTIFICATION DETAILS
|
Name : |
GLOBAL QUIMIA SL |
|
|
|
|
Registered Office : |
Avda Diagonal 519-521 1º-1ª - Barcelona - 08029 - Barcelona |
|
|
|
|
Country : |
Spain |
|
|
|
|
Financials (as on) : |
2013 |
|
|
|
|
Date of Incorporation : |
01.09.1997 |
|
|
|
|
Legal Form : |
Private Company |
|
|
|
|
Line of Business : |
Wholesale of Chemical Products. |
|
|
|
|
No. of Employees : |
5 |
RATING & COMMENTS
|
MIRA’s Rating : |
Ba |
|
RATING |
STATUS |
PROPOSED CREDIT LINE |
|
|
41-55 |
Ba |
Overall operation is considered normal. Capable to meet normal
commitments. |
Satisfactory |
|
Status : |
Satisfactory |
|
Payment Behaviour : |
Slow but correct |
|
Litigation : |
Clear |
NOTES:
Any query related to this report can be made
on e-mail: infodept@mirainform.com
while quoting report number, name and date.
ECGC Country Risk Classification List – March 31, 2015
|
Country Name |
Previous Rating (31.12.2014) |
Current Rating (31.03.2015) |
|
Spain |
A1 |
A1 |
|
Risk Category |
ECGC
Classification |
|
Insignificant |
A1 |
|
Low |
A2 |
|
Moderate |
B1 |
|
High |
B2 |
|
Very High |
C1 |
|
Restricted |
C2 |
|
Off-credit |
D |
SPAIN - ECONOMIC OVERVIEW
After experiencing a prolonged recession in the wake of the global financial crisis, in 2014 Spain marked the first full year of economic growth in seven years, with growth of 1.4%. At the onset of the global financial crisis Spain's GDP contracted by 3.7% in 2009, ending a 16-year growth trend, and continued contracting through most of 2013. Credit contraction in the private sector, fiscal austerity, and high unemployment continue to weigh on domestic consumption and investment. Exports were resilient throughout the economic downturn and helped to bring Spain's current account into surplus in 2013 for the first time since 1986, where it remained in 2014. The unemployment rate rose from a low of about 8% in 2007 to more than 26% in 2013, closing 2014 at 23.7%. This has strained Spain's public finances as spending on social benefits increased while tax revenues fell. Spain’s budget deficit peaked at 11.4% of GDP in 2010. Spain gradually reduced the deficit to just under 7% of GDP in 2013-14, slightly above the 6.5% target negotiated between Spain and the EU. Public debt has increased substantially – from 60.1% of GDP in 2010 to more than 97% in 2014. Rising labor productivity and an internal devaluation resulting from moderating labor costs and lower inflation have helped to improve foreign investor interest in the economy and positive FDI flows have been restored.
The government's efforts to implement labor, pension, health, tax, and education reforms, aimed at supporting investor sentiment, have become overshadowed by political activity in 2015 in anticipation of national parliamentary elections late in the year. In 2013 the government successfully shored up struggling banks - exposed to the collapse of Spain's depressed real estate and construction sectors, completing an EU-funded restructuring and recapitalization program in January 2014. Recently increased private consumption helped bring real GDP growth back into positive territory at 1.4% in 2014, and labor reforms prompted a modest reduction in the unemployment rate, from more than 26% in 2013 to 23.7% in 2014. Despite the uptic in economic activity, inflation dropped sharply, from 1.5% in 2013 to flat in 2014. Spain’s 2015 budget, published in September 2014, rolls back some recently imposed taxes in advance of national elections in November 2015 and leaves untouched the country’s value-added tax (VAT) regime, which continues to generate significantly lower revenue than the EU average. Spain’s borrowing costs are dramatically lower since their peak in mid-2012.
|
Source
: CIA |
EXECUTIVE
SUMMARY
|
|
Name: |
GLOBAL
QUIMIA SL |
|
NIF
/ Fiscal code: |
B61437778 |
|
Status: |
ACTIVE |
|
Incorporation
Date: |
01/09/1997 |
|
Register Data |
Register
Section 8 Sheet 164456 |
|
Last Publication in BORME: |
17/12/2012
[Appointments] |
|
Last
Published Account Deposit: |
2013 |
|
Share
Capital: |
221.400 |
|
|
|
|
Localization: |
Avda
Diagonal 519-521 1º-1ª - Barcelona - 08029 - Barcelona |
|
Telephone
- Fax - Email - Website: |
Telephone.
933223629/ 933222932 Email. globalquimia@globalquimia.com Website.
www.globalquimia.com |
|
|
|
|
Activity: |
|
|
NACE: |
4675
- Wholesale of chemical products |
|
Registered
Trademarks: |
|
|
Audited
/ Opinion: |
Si
/ |
|
Tenders
and Awards: |
1
for a total cost of 31.145,40 |
|
Subsidies: |
0
for a total cost of 0 |
|
Quality
Certificate: |
No |
|
Payment
Behaviour: |
According
to the agreed terms |
|
Prospects: |
Consolidation |
|
Industry
situation: |
Maturity |
|
|
|
|
Defaults, Legal Claims and
Insolvency Proceedings : |
|
|
|
|
|
|
|
Number |
Amount (€) |
Most Recent Entry |
|
Insolvency
Proceedings, Bankruptcy and Suspension of Payments |
|
Unpublished |
--- |
--- |
|
Defaults
on debt with Financial Institutions and Large Companies |
|
None |
--- |
--- |
|
Judicial
Claims (Notices, Executive Proceedings, Attachments, Auctions, Bad Debt) |
|
None |
0 |
--- |
|
Proceedings
heard by the Civil Court |
|
Unpublished |
0 |
--- |
|
Proceedings
heard by the Labour Court |
|
Unpublished |
0 |
--- |
|
|
|
Partners
|
|
MARIAMONTSERRAT
FABREGAS PITARCH |
10
% |
|
|
JOSEANTONIO
LORENTE DIEZ |
10
% |
|
|
JUANMANUEL
PEREZ PALLAS |
10
% |
|
|
JOSE
PEREZ MARQUEZ |
70
% |
|
|
Shares: |
0 |
|
|
Other
Links: |
0 |
|
|
No.
of Active Corporate Bodies: |
JOINT
MANAGER 1 |
|
|
Ratios |
2013 |
2012 |
Change |
|
|
Nº
of employees: |
5 |
|
|
|
|
|
|
|
Guarantees: |
|
|
Properties
Registered: |
Company
NO, Administrator NO |
|
Financing
/ Guarantee Sources : |
Sources
YES, Guarantees YES |
|
|
|
|
INVESTIGATION
SUMMARY |
|
|
This
is a registered firm established in 1997, dedicated to the wholesale trade of
chemical products to different sectors. Its activities are developed
nationally and internationally. In the consulted resources, nothing against
it were found. Based on the above, we consider that it is possible to
maintain relations with the firm in operations of risk, in accordance with
its size. |
|
|
Interviewed
Person: |
|
|
|
|
|
Identification
|
|
|
Social Denomination: |
GLOBAL QUIMIA SL |
|
NIF / Fiscal code: |
B61437778 |
|
Corporate Status: |
ACTIVE |
|
Start of activity: |
1997 |
|
Registered Office: |
AVDA DIAGONAL 519-521
1º-1ª |
|
Locality: |
BARCELONA |
|
Province: |
BARCELONA |
|
Postal Code: |
08029 |
|
Telephone: |
933223629/ 933222932 |
|
Fax: |
934303309 |
|
Website: |
www.globalquimia.com |
|
Email: |
globalquimia@globalquimia.com |
|
Interviewed Person: |
The present information
has been obtained from indirect resources, due to the disapproval of the responsible
holders of presenting any kind of collaboration to prepare the present work. |
|
|
|
|
Branch
Offices
|
|
Activity
|
|
|
NACE: |
4675 |
|
Legal Form: |
WHOLSALE TRADE AND RETIAL SALE.
DISTUBUTION SALE, IMPORTATION, EXPORTATION OF CHEMICAL AND PHARMACEUTICAL
PRODUCTS OF ITS COMPONENTS, RAW MATERIALS AND SUBSTANCES. |
|
Additional Information: |
Wholesale trade of
chemical products in food sector, cosmetics, perfume industry, packaging,
pharmacy and dietetics, industrial and chemical synthesis. |
|
Additional Address: |
AVDA DIAGONAL 519-521
1º-1ª, 08029, Barcelona,Registered office and offices. |
|
Franchise: |
No |
|
Import / export: |
IMPORTS / EXPORTS |
|
Future Perspective: |
Consolidation |
|
Industry situation: |
Maturity |
|
|
|
Number
of Employees
|
|
|
Year |
No. of employees |
Established |
Incidentals |
|
|
|
2013 |
5 |
|
|
|
The data of employees is from
the latest available financial statements in axesor. Failing that, are
estimates data calculated by statistical methods
Chronological
Summary
|
|||
|
|
|
|
|
|
|
Year |
Act |
|
|
|
1997 |
Appointments/ Re-elections (1) Company Formation (1) |
|
|
|
1998 |
Accounts deposit (year 1997) Appointments/ Re-elections (2)
Cessations/ Resignations/ Reversals (1) Change of Social address (2) Increase
of Capital (1) |
|
|
|
1999 |
Accounts deposit (year 1998) |
|
|
|
2000 |
Accounts deposit (year 1999) Increase of Capital (1) Statutory
Modifications (1) |
|
|
|
2001 |
Accounts deposit (year 2000) Appointments/ Re-elections (3)
Cessations/ Resignations/ Reversals (2) |
|
|
|
2002 |
Accounts deposit (year 2001) Appointments/ Re-elections (1) |
|
|
|
2003 |
Accounts deposit (year 2002) |
|
|
|
2004 |
Accounts deposit (year 2003) Change of Social address (1) Increase of
Capital (1) |
|
|
|
2005 |
Accounts deposit (year 2004) |
|
|
|
2006 |
Accounts deposit (year 2005) |
|
|
|
2007 |
Appointments/ Re-elections (1) |
|
|
|
2008 |
Accounts deposit (year 2006, 2007) |
|
|
|
2009 |
Accounts deposit (year 2008) |
|
|
|
2010 |
Accounts deposit (year 2009) Appointments/ Re-elections (1) |
|
|
|
2011 |
Accounts deposit (year 2010) |
|
|
|
2012 |
Accounts deposit (year 2011) Appointments/ Re-elections (2) Increase
of Capital (1) |
|
|
|
2013 |
Accounts deposit (year 2012) |
|
|
|
2014 |
Accounts deposit (year 2013) |
|
Breakdown
of Owners' Equity
|
|
|
Registered Capital: |
221.400 |
|
Paid up capital: |
221.400 |
|
|
|
|
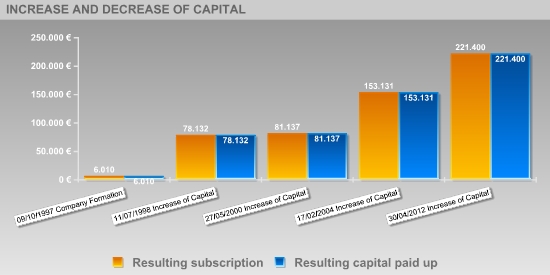
Updated
Evolution of the Subscribed and Paid-in Capital
|
|||||
|
|
|
|
|
|
|
|
|
|||||
|
|
|
|
|
|
|
|
Publishing Date |
Registration Type |
Capital Subscribed |
Paid up capital |
Underwritten result |
Disbursed Result |
|
09/10/1997 |
Company Formation |
6.010 |
6.010 |
6.010 |
6.010 |
|
11/07/1998 |
Increase of Capital |
72.121 |
72.121 |
78.132 |
78.132 |
|
27/05/2000 |
Increase of Capital |
3.005 |
3.005 |
81.137 |
81.137 |
|
17/02/2004 |
Increase of Capital |
71.996 |
71.996 |
153.131 |
153.131 |
|
30/04/2012 |
Increase of Capital |
68.270 |
68.270 |
221.400 |
221.400 |
|
|
|
|
|
|
|
|
Active
Social Bodies
|
|
Post published |
Social Body's Name |
Appointment Date |
Other Positions in this Company |
|
ADMINISTRATOR |
PEREZ MARQUEZ JOSE |
17/05/2001 |
1 |
|
JOINT MANAGER |
RODRIGUEZ DE VERA MARIN PABLO |
30/04/2012 |
1 |
|
PROXY |
FABREGAS PITARCH MARIA MONTSERRAT |
14/05/2002 |
1 |
|
|
LORENTE DIEZ JOSE ANTONIO |
14/07/2001 |
2 |
|
|
PEREZ PALLAS JUAN MANUEL |
25/04/2001 |
1 |
|
ACCOUNTS' AUDITOR / HOLDER |
ACTIVA AUDITORIA & CONSULTORIA SLP |
07/12/2012 |
2 |
|
|
|
|
|
|
|
Social Body's Name |
Post published |
End Date |
Other Positions in this Company |
|
ACTIVA AUDITORIA & CONSULTORIA SLP |
ACCOUNTS' AUDITOR / HOLDER |
07/12/2012 |
2 |
|
ARTECNICA AUDIT SL |
ACCOUNTS' AUDITOR / HOLDER |
13/08/2010 |
1 |
|
GARCIA MOLINA ANA MARIA |
PROXY |
17/05/2001 |
1 |
|
LORENTE DIEZ JOSE ANTONIO |
ADMINISTRATOR |
17/05/2001 |
2 |
|
VELEZ LLORCA JOSE LUIS |
ADMINISTRATOR |
11/07/1998 |
1 |
|
|
|
|
|
|
Executive
board
|
|
Post |
NIF |
Name |
|
ADMINISTRATOR |
|
JOSE PEREZ MARQUEZ |
|
ADMINISTRATOR |
|
PABLO RODRIGUEZ VERA MARIN |
|
FINANCIAL DIRECTOR |
|
JOSE ANTONIO LLORENTE |
|
|
|
|
Defaults,
Legal Claims and Insolvency Proceedings
|
Section enabling assessment of the degree of compliance of the company
queried with its payment obligations. It provides information on the existence
and nature of all stages of Insolvency and Legal Proceedings published with
reference to the Company in the country's various Official Bulletins and
national newspapers, as well Defaults Registered in the main national credit
bureaus (ASNEF Industrial and RAI ).
>
Summary
Chronological
summary
|
|
|
Number of Publications |
Amount (_) |
Start date |
End date |
|
Insolvency
Proceedings, Bankruptcy and Suspension of Payments |
|
Unpublished |
--- |
--- |
--- |
|
Request/Declaration |
|
0 |
--- |
date |
|
|
Proceedings |
|
--- |
--- |
|
--- |
|
Resolution |
|
--- |
--- |
|
--- |
|
Defaults
on debt with Financial Institutions and Large Companies |
Bank
and Commercial Delinquency |
None |
0 |
|
|
|
Status:
Friendly |
|
--- |
|
|
|
|
Status:
Pre-Litigation |
|
--- |
|
|
|
|
Status:
Litigation |
|
--- |
|
|
|
|
Status:
Non-performing |
|
--- |
|
|
|
|
Status:
insolvency proceedings, bankruptcy and suspension of payments |
|
--- |
|
|
|
|
Other
status |
|
--- |
|
|
|
|
Legal
and Administrative Proceedings |
|
Unpublished |
--- |
|
|
|
Notices
of defaults and enforcement |
|
--- |
--- |
|
--- |
|
Seizures |
|
--- |
--- |
|
--- |
|
Auctions |
|
--- |
--- |
|
--- |
|
Declarations
of insolvency and bad debt |
|
--- |
--- |
|
--- |
|
Proceedings
heard by the Civil Court |
|
Unpublished |
--- |
|
|
|
Proceedings
heard by the Labour Court |
|
Unpublished |
--- |
|
|
|
Positive Factors |
Adverse Factors |
|
No judicial claims have been detected in the Official Gazettes, regarding any Entity's outstanding debts with the Tax Bureau or Social Security administrations, as submitted by Courts of the various court jurisdictions. No irregular payment performance has been detected based on information obtained from credit bureaus. GLOBAL QUIMIA SL obtains economic profitability from the necessary investments in the development of its activity in comparison with its assets. It has financial profitability.. GLOBAL QUIMIA SL obtains financial return as a consequence of an investment in its own resources which, a priori, might improve its financial and economic situation. Positive Working CapitalThe Company's Working Capital quality is significant, i.e. much of the Company financing comes from its equity. A structure is considered optimal if its liquidity level is slightly above its debt volume as a result of low idleness levels of its financial resources involved. |
GLOBAL QUIMIA SL it presents an excessive indebtedness that may compromise their balance sheet. The current debt represents a 72.37% of the financial structure. In principle, a decrease in this ratio would indicate an improvement in the short-term financial situation. The company denotes a special dependence short-term financing which, a priori, could cause problems of short-term solvency. No Company's subsidiaries or branches are known. Audit qualifications . The company has submitted the audit with a qualified opinion, indicating that the financial statements may not reflect the true picture because of the existence of circumstances that may be significant. |
Probability of default
|
> Estimated Probability
of Default for the next 12 months: 0.917 %
|
Sector
in which comparison is carried out: 467 Other
specialised wholesale |
|
|
Relative
Position:
|
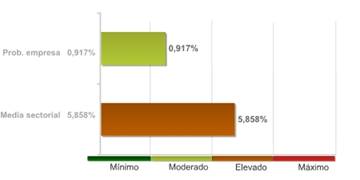
The
company's comparative analysis with the rest of the companies that comprise the
sector, shows the company holds a better position with regard to the
probability of non-compliance.
The
95.00% of the companies of the sector GLOBAL QUIMIA SL belongs to show a higher
probability of non-compliance.
The
probability of the company's non-compliance with its payment obligations within
deadlines estimated by our qualifications models is 0.917%.
In
the event they fail to comply with the payment, the seriousness of the loss
will depend on factors such as the promptness of the commencement of the
charging management, the existence of executive documents which match the
credit or the existence of guarantees and free debt assets under the name of
the debtor. Therefore, the probability of non-compliance should not be solely
interpreted as the total loss of the owed amount.
LEGAL
CLAIMS
|
|
Summary
of Judicial Claims |
|
|
|
|
|
|
|
|
||
|
|
|
No
se han publicado |
|
|
|
|
No
se han publicado |
|
|
|
|
||
|
|
|
No
se han publicado |
|
|
|
|
No
se han publicado |
|
|
|
|
No
se han publicado |
|
|
|
|
No
se han publicado |
|
|
|
|
||
|
|
|
No
se han publicado |
|
|
|
|
No
se han publicado |
|
|
|
|
||
|
|
|
No
se han publicado |
|
|
SHAREHOLDERS : |
4 Entities |
> Shareholders
|
Relationship |
Entity |
Province |
Shareholding stake |
|
SHAREHOLDERS |
MARIAMONTSERRAT FABREGAS
PITARCH |
|
10 |
|
|
JOSEANTONIO LORENTE DIEZ |
|
10 |
|
|
JUANMANUEL PEREZ PALLAS |
|
10 |
|
|
JOSE PEREZ MARQUEZ |
|
70 |
|
|
|
|
|
|
Turnover
|
|
|
Total Sales 2013 |
9.518.993 |
The sales data is from the
latest available financial statements in axesor. Failing that, are estimates
data calculated by statistical methods.
|
Estimated
Balance
|
|
ESTIMATED FIGUERS YEAR
2014 -NON-CURRENT ASSET 169.000 Euro/s -CURRENT ASSET 2.240.000 Euro/s -NET
WORTH 665.000 Euro/s -NON-CURRENT LIABILITIES 0 Euro/s -CURRENT LIABILITIES 1.744.000
Euro/s -TOTAL LIABILITIES AND NET ASSETS 2.409.000 Euro/s -SALES 9.600.000
Euro/s |
|
Financial
Accounts and Balance Sheets
|
|
Ejercicio |
Tipo
de Cuentas Anuales |
Fecha
Presentacion |
|
2013 |
Normales |
August
2014 |
|
2012 |
Normales |
August
2013 |
|
2011 |
Normales |
August
2012 |
|
2010 |
Normales |
September
2011 |
|
2009 |
Normales |
September
2010 |
|
2008 |
Normales |
November
2009 |
|
2007 |
Normales |
September
2008 |
|
2006 |
Normales |
November
2007 |
|
2005 |
Normales |
September
2006 |
|
2004 |
Normales |
September
2005 |
|
2003 |
Normales |
October
2004 |
|
2002 |
Normales |
September
2003 |
|
2001 |
Normales |
September
2002 |
|
2000 |
Normales |
September
2001 |
|
1999 |
Normales |
January
2000 |
|
1998 |
Normales |
July
1999 |
|
1997 |
Normales |
June
1998 |
The
data in the report regarding the last Company Accounts submitted by the company
is taken from the TRADE REGISTER serving the region in which the company's
address is located 31/12/2013
> Balance en formato Abreviado de acuerdo al Nuevo Plan General
Contable 2007
Information corresponding
to the fiscal year 2013 2012 2011 2010 2009 is taken
from information submitted to the TRADE REGISTER. Data corresponding to fiscal
years before 2013 2012 2011 2010 2009 has been
compiled based on the equivalence criteria stipulated in Act JUS/206/2009.
Where the provisions of the Act did not establish relevant equivalence
criteria, such criteria using its own methodology. To view details on the
methodology.
|
|
ORIGINAL |
ORIGINAL |
ORIGINAL |
ORIGINAL |
ORIGINAL |
|
|
Assets |
2013 |
2012 |
2011 |
2010 |
2009 |
|
|
A)
NON-CURRENT ASSETS: 11000 |
168.087,00 |
182.193,00 |
190.610,00 |
200.314,00 |
238.309,00 |
|
|
I. Intangible fixed assets : 11100 |
0,00 |
0,00 |
0,00 |
0,00 |
0,00 |
|
|
II. Tangible fixed assets : 11200 |
9.981,00 |
19.685,00 |
29.389,00 |
39.093,00 |
52.088,00 |
|
|
III. Real estate investment: 11300 |
0,00 |
0,00 |
0,00 |
0,00 |
0,00 |
|
|
IV. Long-term investments in Group companies and associates :
11400 |
0,00 |
0,00 |
0,00 |
0,00 |
0,00 |
|
|
V. Long-term financial investments: 11500 |
158.105,00 |
162.508,00 |
161.221,00 |
161.221,00 |
186.221,00 |
|
|
VI. Assets for deferred tax : 11600 |
0,00 |
0,00 |
0,00 |
0,00 |
0,00 |
|
|
VII. Non-current trade debtors : 11700 |
0,00 |
0,00 |
0,00 |
0,00 |
0,00 |
|
|
B)
CURRENT ASSETS: 12000 |
2.220.919,00 |
2.059.119,00 |
1.804.280,00 |
2.983.934,00 |
1.829.283,00 |
|
|
I. Non-current assets held for sale : 12100 |
0,00 |
0,00 |
0,00 |
0,00 |
0,00 |
|
|
II. Stocks: 12200 |
488.994,00 |
578.144,00 |
415.150,00 |
553.098,00 |
434.745,00 |
|
|
III. Trade debtors and others receivable accounts: 12300 |
1.157.635,00 |
1.324.651,00 |
1.228.995,00 |
2.111.349,00 |
1.215.566,00 |
|
|
1.- Customers for sales and provisions of
services : 12380 |
1.122.060,00 |
1.290.397,00 |
1.196.346,00 |
2.099.058,00 |
1.198.376,00 |
|
|
a) Long-term receivables
from sales and services supplied : 12381 |
0,00 |
0,00 |
0,00 |
0,00 |
0,00 |
|
|
b) Customers for
sales and provisions of services : 12382 |
1.122.060,00 |
1.290.397,00 |
1.196.346,00 |
2.099.058,00 |
1.198.376,00 |
|
|
2.- Called up share capital : 12370 |
0,00 |
0,00 |
0,00 |
0,00 |
0,00 |
|
|
3.- Other accounts receivable :
12390 |
35.574,00 |
34.254,00 |
32.649,00 |
12.292,00 |
17.190,00 |
|
|
IV. Short-term investments in Group companies and associates:
12400 |
0,00 |
0,00 |
0,00 |
0,00 |
0,00 |
|
|
V. Short-term financial investments : 12500 |
0,00 |
5.000,00 |
0,00 |
0,00 |
0,00 |
|
|
VI. Short-term accruals: 12600 |
41.562,00 |
3.353,00 |
3.804,00 |
8.181,00 |
8.760,00 |
|
|
VII. Cash and other equivalent liquid assets : 12700 |
532.729,00 |
147.971,00 |
156.330,00 |
311.306,00 |
170.211,00 |
|
|
TOTAL
ASSETS (A + B) : 10000 |
2.389.006,00 |
2.241.312,00 |
1.994.890,00 |
3.184.248,00 |
2.067.592,00 |
|
|
|
ORIGINAL |
ORIGINAL |
ORIGINAL |
ORIGINAL |
ORIGINAL |
|
|
Liabilities and Net Worth |
2013 |
2012 |
2011 |
2010 |
2009 |
|
|
A)
NET WORTH: 20000 |
660.140,00 |
622.386,00 |
583.075,00 |
552.157,00 |
507.935,00 |
|
|
A1) Shareholders' equity : 21000 |
660.140,00 |
622.386,00 |
583.075,00 |
552.157,00 |
507.935,00 |
|
|
I. Capital: 21100 |
221.400,00 |
221.400,00 |
221.400,00 |
153.131,00 |
153.131,00 |
|
|
1.- Registered
capital: 21110 |
221.400,00 |
221.400,00 |
221.400,00 |
153.131,00 |
153.131,00 |
|
|
2.- (Uncalled
capital) : 21120 |
0,00 |
0,00 |
0,00 |
0,00 |
0,00 |
|
|
II. Share premium: 21200 |
0,00 |
0,00 |
0,00 |
0,00 |
0,00 |
|
|
III. Reserves: 21300 |
400.986,00 |
361.675,00 |
330.757,00 |
354.805,00 |
322.289,00 |
|
|
IV. (Common stock equity): 21400 |
0,00 |
0,00 |
0,00 |
0,00 |
0,00 |
|
|
V. Profit or loss brought forward:
21500 |
0,00 |
0,00 |
0,00 |
0,00 |
0,00 |
|
|
VI. Other shareholders'
contributions: 21600 |
0,00 |
0,00 |
0,00 |
0,00 |
0,00 |
|
|
VII. Result of the period: 21700 |
37.754,00 |
39.311,00 |
30.919,00 |
44.221,00 |
32.516,00 |
|
|
VIII. (Interim dividend): 21800 |
0,00 |
0,00 |
0,00 |
0,00 |
0,00 |
|
|
IX. Other net worth instruments: 21900 |
0,00 |
0,00 |
0,00 |
0,00 |
0,00 |
|
|
A-2) Adjustments due to changes in value: 22000 |
0,00 |
0,00 |
0,00 |
0,00 |
0,00 |
|
|
A-3) Received subsidies, donations and legacies: 23000 |
0,00 |
0,00 |
0,00 |
0,00 |
0,00 |
|
|
B)
NON-CURRENT LIABILITIES: 31000 |
0,00 |
0,00 |
0,00 |
0,00 |
0,00 |
|
|
I. Long-term provisions: 31100 |
0,00 |
0,00 |
0,00 |
0,00 |
0,00 |
|
|
II. Long-term creditors : 31200 |
0,00 |
0,00 |
0,00 |
0,00 |
0,00 |
|
|
1.- Amounts owed to credit institutions:
31220 |
0,00 |
0,00 |
0,00 |
0,00 |
0,00 |
|
|
2.- Creditors from financial leasing :
31230 |
0,00 |
0,00 |
0,00 |
0,00 |
0,00 |
|
|
3.- Other long-term creditors :
31290 |
0,00 |
0,00 |
0,00 |
0,00 |
0,00 |
|
|
III. Long-term debts with Group companies and associates:
31300 |
0,00 |
0,00 |
0,00 |
0,00 |
0,00 |
|
|
IV. Liabilities for deferred tax: 31400 |
0,00 |
0,00 |
0,00 |
0,00 |
0,00 |
|
|
V. Long-term accruals: 31500 |
0,00 |
0,00 |
0,00 |
0,00 |
0,00 |
|
|
VI. Non-current trade creditors : 31600 |
0,00 |
0,00 |
0,00 |
0,00 |
0,00 |
|
|
VII. Special long-term debts : 31700 |
0,00 |
0,00 |
0,00 |
0,00 |
0,00 |
|
|
C)
CURRENT LIABILITIES : 32000 |
1.728.865,00 |
1.618.926,00 |
1.411.815,00 |
2.632.092,00 |
1.559.656,00 |
|
|
I. Liabilities linked to non-current assets held for sale :
32100 |
0,00 |
0,00 |
0,00 |
0,00 |
0,00 |
|
|
II. Short-term provisions: 32200 |
0,00 |
0,00 |
0,00 |
0,00 |
0,00 |
|
|
III. Short-term creditors : 32300 |
1.068.352,00 |
1.282.002,00 |
1.085.423,00 |
1.724.707,00 |
1.028.047,00 |
|
|
1.- Amounts owed to credit institutions:
32320 |
1.068.352,00 |
1.282.002,00 |
1.085.423,00 |
1.724.707,00 |
1.028.047,00 |
|
|
2.- Creditors from financial leasing :
32330 |
0,00 |
0,00 |
0,00 |
0,00 |
0,00 |
|
|
3.- Other short-term creditors :
32390 |
0,00 |
0,00 |
0,00 |
0,00 |
0,00 |
|
|
IV. Short-term debts with Group companies and associates: 32400 |
0,00 |
0,00 |
0,00 |
0,00 |
0,00 |
|
|
V. Trade creditors and other accounts payable: 32500 |
660.513,00 |
336.924,00 |
326.391,00 |
907.385,00 |
531.609,00 |
|
|
1.- Suppliers: 32580 |
416.668,00 |
139.752,00 |
131.457,00 |
513.777,00 |
389.024,00 |
|
|
a) Long-term debts :
32581 |
0,00 |
0,00 |
0,00 |
0,00 |
0,00 |
|
|
b) Short-term debts :
32582 |
416.668,00 |
139.752,00 |
131.457,00 |
513.777,00 |
389.024,00 |
|
|
2.- Other creditors : 32590 |
243.845,00 |
197.172,00 |
191.840,00 |
384.848,00 |
137.532,00 |
|
|
VI. Short-term accruals: 32600 |
0,00 |
0,00 |
0,00 |
0,00 |
0,00 |
|
|
VII. Special short-term debts : 32700 |
0,00 |
0,00 |
0,00 |
0,00 |
0,00 |
|
|
TOTAL
NET WORTH AND LIABILITIES (A + B + C) : 30000 |
2.389.006,00 |
2.241.312,00 |
1.994.890,00 |
3.184.248,00 |
2.067.592,00 |
|
|
|
ORIGINAL |
ORIGINAL |
ORIGINAL |
ORIGINAL |
ORIGINAL |
|
|
Profit and Loss |
2013 |
2012 |
2011 |
2010 |
2009 |
|
|
1. Net turnover: 40100 |
9.518.993,00 |
9.818.782,00 |
6.695.351,00 |
7.390.157,00 |
5.665.980,00 |
|
|
2. Changes in stocks of finished goods and work in progress:
40200 |
0,00 |
0,00 |
0,00 |
0,00 |
0,00 |
|
|
3. Works carried out by the company for its assets: 40300 |
0,00 |
0,00 |
0,00 |
0,00 |
0,00 |
|
|
4. Supplies : 40400 |
-8.700.293,00 |
-8.934.992,00 |
-5.985.001,00 |
-6.476.905,00 |
-4.881.900,00 |
|
|
5. Other operating income: 40500 |
136.988,00 |
101.765,00 |
131.597,00 |
93.397,00 |
122.010,00 |
|
|
6. Personnel costs: 40600 |
-381.588,00 |
-376.177,00 |
-366.315,00 |
-359.490,00 |
-417.259,00 |
|
|
7. Other operating costs: 40700 |
-464.090,00 |
-473.807,00 |
-381.369,00 |
-504.758,00 |
-417.806,00 |
|
|
8. Amortisation of fixed assets: 40800 |
-9.704,00 |
-9.704,00 |
-9.704,00 |
-12.995,00 |
-17.484,00 |
|
|
9. Allocation of subsidies of non-financial fixed assets and
other: 40900 |
0,00 |
0,00 |
0,00 |
0,00 |
0,00 |
|
|
10. Excess provisions : 41000 |
0,00 |
0,00 |
0,00 |
0,00 |
0,00 |
|
|
11. Impairment and result of transfers of fixed assets:
41100 |
0,00 |
0,00 |
0,00 |
0,00 |
6.196,00 |
|
|
12. Negative difference in combined businesses: 41200 |
0,00 |
0,00 |
0,00 |
0,00 |
0,00 |
|
|
13. Other results : 41300 |
0,00 |
3.001,00 |
66,00 |
3,00 |
182,00 |
|
|
A)
OPERATING INCOME (1 + 2 + 3 + 4 + 5 + 6 + 7 + 8 + 9 + 10 + 11 + 12 + 13) :
49100 |
100.307,00 |
128.868,00 |
84.626,00 |
129.408,00 |
59.919,00 |
|
|
14. Financial income : 41400 |
10.031,00 |
10.176,00 |
9.231,00 |
7.737,00 |
17.520,00 |
|
|
a) Allocation of financial subsidies,
donations and legacies: 41430 |
0,00 |
0,00 |
0,00 |
0,00 |
0,00 |
|
|
b) Other financial income: 41490 |
10.031,00 |
10.176,00 |
9.231,00 |
7.737,00 |
17.520,00 |
|
|
15. Financial expenditure: 41500 |
-62.127,00 |
-73.078,00 |
-55.135,00 |
-42.163,00 |
-42.392,00 |
|
|
16. Changes in fair value of financial instruments :
41600 |
0,00 |
0,00 |
0,00 |
0,00 |
0,00 |
|
|
17. Exchange rate differences : 41700 |
2.127,00 |
-13.551,00 |
2.502,00 |
-2.688,00 |
8.307,00 |
|
|
18. Impairment and result for transfers of financial
instruments: 41800 |
0,00 |
0,00 |
0,00 |
-25.000,00 |
0,00 |
|
|
19. Other financial income and expenditure: 42100 |
0,00 |
0,00 |
0,00 |
0,00 |
0,00 |
|
|
a) Incorporation of financial expenditure
to assets: 42110 |
0,00 |
0,00 |
0,00 |
0,00 |
0,00 |
|
|
b) Financial income from arrangement with
creditors: 42120 |
0,00 |
0,00 |
0,00 |
0,00 |
0,00 |
|
|
c) Other income and expenditure:
42130 |
0,00 |
0,00 |
0,00 |
0,00 |
0,00 |
|
|
B)
FINANCIAL REVENUE (14 + 15 + 16 + 17 + 18 + 19) : 49200 |
-49.968,00 |
-76.453,00 |
-43.401,00 |
-62.113,00 |
-16.564,00 |
|
|
C)
NET RESULT BEFORE TAXES (A + B) : 49300 |
50.339,00 |
52.415,00 |
41.225,00 |
67.295,00 |
43.354,00 |
|
|
20. Income taxes: 41900 |
-12.585,00 |
-13.104,00 |
-10.306,00 |
-23.074,00 |
-10.839,00 |
|
|
D)
RESULT OF THE PERIOD (C + 20) : 49500 |
37.754,00 |
39.311,00 |
30.919,00 |
44.221,00 |
32.516,00 |
|
> Normal Balance Sheet under the rules of the 1990 General
Accounting Plan (repealed since 1st January of 2008)
Information corresponding
to the fiscal year 2013 2012 2011 2010 2009 has been
compiled based on the equivalence criteria stipulated in Act JUS/206/2009.
Where the provisions of the Act did not establish relevant equivalence
criteria, such criteria using its own methodology. To view details on the
methodology 2013 2012 2011 2010 2009 is taken from
information submitted to the TRADE REGISTER.
|
|
EQUIVALENCIA |
EQUIVALENCIA |
EQUIVALENCIA |
EQUIVALENCIA |
EQUIVALENCIA |
|
|
ASSETS |
2013 |
2012 |
2011 |
2010 |
2009 |
|
|
A)
SHAREHOLDERS (PARTNERS) BY UNCALLED SUSCRIBED CAPITAL: |
0,00 |
0,00 |
0,00 |
0,00 |
0,00 |
|
|
B)
FIXED ASSETS: |
168.087,00 |
182.193,00 |
190.610,00 |
200.314,00 |
238.309,00 |
|
|
I. Formation expenses: |
0,00 |
0,00 |
0,00 |
0,00 |
0,00 |
|
|
II. Intangible fixed assets: |
0,00 |
0,00 |
0,00 |
0,00 |
0,00 |
|
|
1. Research and development costs: |
0,00 |
0,00 |
0,00 |
0,00 |
0,00 |
|
|
2. Concessions, patents, licences,
trademarks et al.: |
0,00 |
0,00 |
0,00 |
0,00 |
0,00 |
|
|
3. Goodwill: |
0,00 |
0,00 |
0,00 |
0,00 |
0,00 |
|
|
4. Key money paid for premises: |
0,00 |
0,00 |
0,00 |
0,00 |
0,00 |
|
|
5. Software: |
0,00 |
0,00 |
0,00 |
0,00 |
0,00 |
|
|
6. Assets under capital leases: |
0,00 |
0,00 |
0,00 |
0,00 |
0,00 |
|
|
7. Payments on account: |
0,00 |
0,00 |
0,00 |
0,00 |
0,00 |
|
|
8. Provisions: |
0,00 |
0,00 |
0,00 |
0,00 |
0,00 |
|
|
9. Accumulated depreciation: |
0,00 |
0,00 |
0,00 |
0,00 |
0,00 |
|
|
III. Tangible fixed assets: |
9.981,00 |
19.685,00 |
29.389,00 |
39.093,00 |
52.088,00 |
|
|
1. Land and construction: |
0,00 |
0,00 |
0,00 |
0,00 |
0,00 |
|
|
2. Technical installations and machinery:
|
0,00 |
0,00 |
0,00 |
0,00 |
0,00 |
|
|
3. Other installations, tools and
furniture: |
0,00 |
0,00 |
21.525,00 |
28.632,00 |
38.150,00 |
|
|
4. Payments on account and tangible fixed
assets under construction: |
0,00 |
0,00 |
0,00 |
0,00 |
0,00 |
|
|
5. Other tangible assets: |
0,00 |
0,00 |
7.864,00 |
10.461,00 |
13.938,00 |
|
|
6. Provisions: |
0,00 |
0,00 |
0,00 |
0,00 |
0,00 |
|
|
7. Accumulated depreciation: |
0,00 |
0,00 |
0,00 |
0,00 |
0,00 |
|
|
IV. Financial investments: |
158.105,00 |
162.508,00 |
161.221,00 |
161.221,00 |
186.221,00 |
|
|
1. Equity investments in group companies:
|
0,00 |
0,00 |
0,00 |
0,00 |
0,00 |
|
|
2. Receivables from group companies:
|
0,00 |
0,00 |
0,00 |
0,00 |
0,00 |
|
|
3. Equity investment in associated
companies: |
0,00 |
0,00 |
0,00 |
0,00 |
0,00 |
|
|
4. Credits to associated companies: |
0,00 |
0,00 |
0,00 |
0,00 |
0,00 |
|
|
5. Long-term securities portfolio: |
0,00 |
0,00 |
0,00 |
0,00 |
0,00 |
|
|
6. Other receivables: |
149.325,00 |
153.484,00 |
152.268,00 |
152.268,00 |
177.268,00 |
|
|
7. Long term guarantees and deposits:
|
8.780,00 |
9.025,00 |
8.953,00 |
8.953,00 |
8.953,00 |
|
|
8. Provisions: |
0,00 |
0,00 |
0,00 |
0,00 |
0,00 |
|
|
9. Long-term receivables from public
bodies: |
0,00 |
0,00 |
0,00 |
0,00 |
0,00 |
|
|
V. Own shares: |
0,00 |
0,00 |
0,00 |
0,00 |
0,00 |
|
|
VI. Long-term trade receivables: |
0,00 |
0,00 |
0,00 |
0,00 |
0,00 |
|
|
C)
Deferred expenses: |
0,00 |
0,00 |
0,00 |
0,00 |
0,00 |
|
|
D)
CURRENT ASSETS: |
2.220.919,00 |
2.059.119,00 |
1.804.280,00 |
2.983.934,00 |
1.829.283,00 |
|
|
I. Called-up share capital (not paid): |
0,00 |
0,00 |
0,00 |
0,00 |
0,00 |
|
|
II. Stocks: |
488.994,00 |
578.144,00 |
415.150,00 |
553.098,00 |
434.745,00 |
|
|
1. Goods for resale: |
437.955,00 |
517.801,00 |
371.820,00 |
438.291,00 |
383.981,00 |
|
|
2. Raw materials and other consumables:
|
0,00 |
0,00 |
0,00 |
0,00 |
0,00 |
|
|
3. Goods in process and semifinished ones:
|
0,00 |
0,00 |
0,00 |
0,00 |
0,00 |
|
|
4. Finished products: |
0,00 |
0,00 |
0,00 |
0,00 |
0,00 |
|
|
5. Byproducts, scrap and recovered
materials: |
0,00 |
0,00 |
0,00 |
0,00 |
0,00 |
|
|
6. Payments on account: |
51.038,00 |
60.343,00 |
43.331,00 |
114.806,00 |
50.764,00 |
|
|
7. Provisions: |
0,00 |
0,00 |
0,00 |
0,00 |
0,00 |
|
|
III. Debtors: |
1.157.635,00 |
1.324.651,00 |
1.228.995,00 |
2.111.349,00 |
1.215.566,00 |
|
|
1. Trade debtors / accounts receivable:
|
1.126.882,00 |
1.289.461,00 |
1.196.346,00 |
2.099.058,00 |
1.198.376,00 |
|
|
2. Accounts receivable, Group companies:
|
0,00 |
0,00 |
0,00 |
0,00 |
0,00 |
|
|
3. Accounts receivable, associated
companies: |
0,00 |
0,00 |
0,00 |
0,00 |
0,00 |
|
|
4. Other debtors: |
23.297,00 |
26.659,00 |
24.733,00 |
12.292,00 |
6.046,00 |
|
|
5. Staff: |
0,00 |
0,00 |
0,00 |
0,00 |
0,00 |
|
|
6. Public bodies: |
7.456,00 |
8.531,00 |
7.915,00 |
0,00 |
11.145,00 |
|
|
7. Provisions: |
0,00 |
0,00 |
0,00 |
0,00 |
0,00 |
|
|
IV. Short-term investments: |
0,00 |
5.000,00 |
0,00 |
0,00 |
0,00 |
|
|
1. Equity investments in group companies:
|
0,00 |
5.000,00 |
0,00 |
0,00 |
0,00 |
|
|
2. Receivables from group companies:
|
0,00 |
0,00 |
0,00 |
0,00 |
0,00 |
|
|
3. Equity investment in associated
companies: |
0,00 |
0,00 |
0,00 |
0,00 |
0,00 |
|
|
4. Credits to associated companies: |
0,00 |
0,00 |
0,00 |
0,00 |
0,00 |
|
|
5. Short term securities portfolio: |
0,00 |
0,00 |
0,00 |
0,00 |
0,00 |
|
|
6. Other receivables: |
0,00 |
0,00 |
0,00 |
0,00 |
0,00 |
|
|
7. Shor term guarantees and deposits:
|
0,00 |
0,00 |
0,00 |
0,00 |
0,00 |
|
|
8. Provisions: |
0,00 |
0,00 |
0,00 |
0,00 |
0,00 |
|
|
V. Short-term treasury shares: |
0,00 |
0,00 |
0,00 |
0,00 |
0,00 |
|
|
VI. Cash at bank and in hand: |
532.729,00 |
147.971,00 |
156.330,00 |
311.306,00 |
170.211,00 |
|
|
VII. Prepayments and accrued income: |
41.562,00 |
3.353,00 |
3.804,00 |
8.181,00 |
8.760,00 |
|
|
GENERAL
TOTAL (A + B + C + D): |
2.389.006,00 |
2.241.312,00 |
1.994.890,00 |
3.184.248,00 |
2.067.592,00 |
|
MERCANTILE REGISTRY.
|
|
EQUIVALENCIA |
EQUIVALENCIA |
EQUIVALENCIA |
EQUIVALENCIA |
EQUIVALENCIA |
|
|
LIABILITIES |
2013 |
2012 |
2011 |
2010 |
2009 |
|
|
A)
EQUITY: |
660.140,00 |
622.386,00 |
583.075,00 |
552.157,00 |
507.935,00 |
|
|
I. Subscribed capital: |
221.400,00 |
221.400,00 |
221.400,00 |
153.131,00 |
153.131,00 |
|
|
II. Share premium: |
0,00 |
0,00 |
0,00 |
0,00 |
0,00 |
|
|
III. Revaluation reserves: |
0,00 |
0,00 |
0,00 |
0,00 |
0,00 |
|
|
IV. Reserves: |
400.986,00 |
361.675,00 |
330.757,00 |
354.805,00 |
322.289,00 |
|
|
1. Legal reserve: |
37.129,00 |
33.489,00 |
30.626,00 |
30.626,00 |
30.626,00 |
|
|
2. Reserves for own shares: |
0,00 |
0,00 |
0,00 |
0,00 |
0,00 |
|
|
3. Reserves for shares of the controlling
company: |
0,00 |
0,00 |
0,00 |
0,00 |
0,00 |
|
|
4. Statutory reserves: |
0,00 |
0,00 |
0,00 |
0,00 |
0,00 |
|
|
5. Miscellaneous reserves: |
363.854,00 |
328.184,00 |
300.128,00 |
324.176,00 |
291.661,00 |
|
|
Differences due to capital adjustement to
euros: |
3,00 |
3,00 |
3,00 |
3,00 |
2,00 |
|
|
V. Profit or loss brought forward: |
0,00 |
0,00 |
0,00 |
0,00 |
0,00 |
|
|
1. Retained earnings: |
0,00 |
0,00 |
0,00 |
0,00 |
0,00 |
|
|
2. Prior year losses: |
0,00 |
0,00 |
0,00 |
0,00 |
0,00 |
|
|
3. Partners' contributions so as
to compensate losses: |
0,00 |
0,00 |
0,00 |
0,00 |
0,00 |
|
|
VI. Profit or loss for the financial year: |
37.754,00 |
39.311,00 |
30.919,00 |
44.221,00 |
32.516,00 |
|
|
VII. Interim dividend paid: |
0,00 |
0,00 |
0,00 |
0,00 |
0,00 |
|
|
VIII. Own shares for capital reduction: |
0,00 |
0,00 |
0,00 |
0,00 |
0,00 |
|
|
B)
Deferred income: |
0,00 |
0,00 |
0,00 |
0,00 |
0,00 |
|
|
1. Capital grants: |
0,00 |
0,00 |
0,00 |
0,00 |
0,00 |
|
|
2. Unrealised exchange gains: |
0,00 |
0,00 |
0,00 |
0,00 |
0,00 |
|
|
3. Other deferred income: |
0,00 |
0,00 |
0,00 |
0,00 |
0,00 |
|
|
4. Public revenues to distribute in
several financial years: |
0,00 |
0,00 |
0,00 |
0,00 |
0,00 |
|
|
C)
PROVISIONS FOR LIABILITIES AND CHARGES: |
0,00 |
0,00 |
0,00 |
0,00 |
0,00 |
|
|
1. Provisions for pension fund and other similar
obligations: |
0,00 |
0,00 |
0,00 |
0,00 |
0,00 |
|
|
2. Provisions for taxes: |
0,00 |
0,00 |
0,00 |
0,00 |
0,00 |
|
|
3. Other provisions: |
0,00 |
0,00 |
0,00 |
0,00 |
0,00 |
|
|
4. Reversion fund: |
0,00 |
0,00 |
0,00 |
0,00 |
0,00 |
|
|
D)
LONG TERM LIABILITIES: |
0,00 |
0,00 |
0,00 |
0,00 |
0,00 |
|
|
I. Issued debentures and other marketable securities: |
0,00 |
0,00 |
0,00 |
0,00 |
0,00 |
|
|
1. Non-convertible debentures: |
0,00 |
0,00 |
0,00 |
0,00 |
0,00 |
|
|
2. Convertible debentures: |
0,00 |
0,00 |
0,00 |
0,00 |
0,00 |
|
|
3. Other debt securities: |
0,00 |
0,00 |
0,00 |
0,00 |
0,00 |
|
|
II. Amounts owed to credit institutions: |
0,00 |
0,00 |
0,00 |
0,00 |
0,00 |
|
|
1. Loans and other liabilities: |
0,00 |
0,00 |
0,00 |
0,00 |
0,00 |
|
|
2. Long-term liabilities from capital
leases: |
0,00 |
0,00 |
0,00 |
0,00 |
0,00 |
|
|
III. Debts with companies of the group and affiliated ones:
|
0,00 |
0,00 |
0,00 |
0,00 |
0,00 |
|
|
1. Amounts owed to group companies: |
0,00 |
0,00 |
0,00 |
0,00 |
0,00 |
|
|
2. Amounts owed to associated companies:
|
0,00 |
0,00 |
0,00 |
0,00 |
0,00 |
|
|
IV. Other creditors: |
0,00 |
0,00 |
0,00 |
0,00 |
0,00 |
|
|
1. Long-term bills of exchange payable:
|
0,00 |
0,00 |
0,00 |
0,00 |
0,00 |
|
|
2. Other creditors: |
0,00 |
0,00 |
0,00 |
0,00 |
0,00 |
|
|
3. Long term guarantees and deposits
received: |
0,00 |
0,00 |
0,00 |
0,00 |
0,00 |
|
|
4. Long term payables to public bodies:
|
0,00 |
0,00 |
0,00 |
0,00 |
0,00 |
|
|
V. Unpaid portion of equity investment: |
0,00 |
0,00 |
0,00 |
0,00 |
0,00 |
|
|
1. Group companies: |
0,00 |
0,00 |
0,00 |
0,00 |
0,00 |
|
|
2. Associated companies: |
0,00 |
0,00 |
0,00 |
0,00 |
0,00 |
|
|
3. Third parties: |
0,00 |
0,00 |
0,00 |
0,00 |
0,00 |
|
|
VI. Long term trade creditors: |
0,00 |
0,00 |
0,00 |
0,00 |
0,00 |
|
|
E)
SHORT TERM CREDITORS: |
1.728.865,00 |
1.618.926,00 |
1.411.815,00 |
2.632.092,00 |
1.559.656,00 |
|
|
I. Issued debentures and other marketable securities: |
0,00 |
0,00 |
0,00 |
0,00 |
0,00 |
|
|
1. Non-convertible debentures: |
0,00 |
0,00 |
0,00 |
0,00 |
0,00 |
|
|
2. Convertible debentures: |
0,00 |
0,00 |
0,00 |
0,00 |
0,00 |
|
|
3. Other debt securities: |
0,00 |
0,00 |
0,00 |
0,00 |
0,00 |
|
|
4. Accrued interest on debentures and
other debt securities: |
0,00 |
0,00 |
0,00 |
0,00 |
0,00 |
|
|
II. Amounts owed to credit institutions: |
1.068.352,00 |
1.282.002,00 |
1.085.423,00 |
1.724.707,00 |
1.028.047,00 |
|
|
1. Loans and other liabilities: |
1.068.352,00 |
1.282.002,00 |
1.085.423,00 |
1.724.707,00 |
1.028.047,00 |
|
|
2. Accrued interest on liabilities with
credit institutions: |
0,00 |
0,00 |
0,00 |
0,00 |
0,00 |
|
|
3. Short-term liabilities from capital
leases: |
0,00 |
0,00 |
0,00 |
0,00 |
0,00 |
|
|
III. Short-term amounts owed to group and associated companies:
|
0,00 |
0,00 |
0,00 |
0,00 |
0,00 |
|
|
1. Amounts owed to group companies: |
0,00 |
0,00 |
0,00 |
0,00 |
0,00 |
|
|
2. Amounts owed to associated companies:
|
0,00 |
0,00 |
0,00 |
0,00 |
0,00 |
|
|
IV. Trade creditors: |
660.513,00 |
336.924,00 |
232.705,00 |
669.831,00 |
464.854,00 |
|
|
1. Advanced payments from customers:
|
0,00 |
0,00 |
3.095,00 |
8.760,00 |
5.052,00 |
|
|
2. Amounts owed for purchases of goods or
services: |
416.668,00 |
139.752,00 |
229.610,00 |
661.071,00 |
459.802,00 |
|
|
3. Debts represented by notes payable:
|
243.845,00 |
197.172,00 |
0,00 |
0,00 |
0,00 |
|
|
V. Other creditors: |
0,00 |
0,00 |
93.686,00 |
237.554,00 |
66.755,00 |
|
|
1. Public bodies: |
0,00 |
0,00 |
69.555,00 |
214.918,00 |
44.223,00 |
|
|
2. Bills of exchange payable: |
0,00 |
0,00 |
0,00 |
0,00 |
0,00 |
|
|
3. Miscellaneous debts: |
0,00 |
0,00 |
0,00 |
0,00 |
0,00 |
|
|
4. Wages and salaries payable: |
0,00 |
0,00 |
24.131,00 |
22.636,00 |
22.532,00 |
|
|
5. Guarantees and deposits received at
short term: |
0,00 |
0,00 |
0,00 |
0,00 |
0,00 |
|
|
VI. Provisions: |
0,00 |
0,00 |
0,00 |
0,00 |
0,00 |
|
|
VII. Prepayments and accrued income: |
0,00 |
0,00 |
0,00 |
0,00 |
0,00 |
|
|
F)
SHORT-TERM PROVISIONS FOR LIABILITIES AND CHARGES: |
0,00 |
0,00 |
0,00 |
0,00 |
0,00 |
|
|
GENERAL
TOTAL (A + B + C + D + E + F): |
2.389.006,00 |
2.241.312,00 |
1.994.890,00 |
3.184.248,00 |
2.067.592,00 |
|
MERCANTILE REGISTRY.
|
|
EQUIVALENCIA |
EQUIVALENCIA |
EQUIVALENCIA |
EQUIVALENCIA |
EQUIVALENCIA |
|
|
DEBIT |
2013 |
2012 |
2011 |
2010 |
2009 |
|
|
A)
CHARGES (A.1 to A.15): |
9.630.386,00 |
9.894.412,00 |
6.807.829,00 |
7.447.073,00 |
5.781.483,00 |
|
|
A.1. Stock reduction of both manufactured
goods and the ones in process: |
0,00 |
0,00 |
0,00 |
0,00 |
0,00 |
|
|
A.2. Supplies: |
8.700.293,00 |
8.934.992,00 |
5.985.001,00 |
6.476.905,00 |
4.881.900,00 |
|
|
a) Stock consumption:
|
8.343.953,00 |
8.569.039,00 |
5.739.872,00 |
6.211.629,00 |
4.681.951,00 |
|
|
b) Consumption of raw
materials and miscellaneous consumable ones: |
0,00 |
0,00 |
0,00 |
0,00 |
0,00 |
|
|
c) Miscellaneous
external expenditure: |
356.340,00 |
365.953,00 |
245.129,00 |
265.276,00 |
199.949,00 |
|
|
A.3. Staff costs: |
381.588,00 |
376.177,00 |
366.315,00 |
359.490,00 |
417.259,00 |
|
|
a) Wages, salaries et
al.: |
321.712,00 |
317.151,00 |
308.836,00 |
303.082,00 |
351.786,00 |
|
|
b) Social security
costs: |
59.875,00 |
59.026,00 |
57.479,00 |
56.408,00 |
65.473,00 |
|
|
A.4. Depreciation expense: |
9.704,00 |
9.704,00 |
9.704,00 |
12.995,00 |
17.484,00 |
|
|
A.5. Variation of trade provisions and
losses of unrecovered receivables: |
39.432,00 |
40.258,00 |
32.404,00 |
42.888,00 |
35.499,00 |
|
|
a) Stock provision
variation: |
0,00 |
0,00 |
0,00 |
0,00 |
0,00 |
|
|
b) Variation in
provision and bad debt losses: |
39.432,00 |
40.258,00 |
32.404,00 |
42.888,00 |
35.499,00 |
|
|
c) Variation of other
trade provisions: |
0,00 |
0,00 |
0,00 |
0,00 |
0,00 |
|
|
A.6. Other operating charges: |
424.658,00 |
433.550,00 |
348.965,00 |
461.871,00 |
382.307,00 |
|
|
a) External services:
|
406.584,00 |
415.097,00 |
334.113,00 |
442.213,00 |
366.035,00 |
|
|
b) Taxes: |
17.150,00 |
17.509,00 |
14.093,00 |
18.653,00 |
15.440,00 |
|
|
c) Other operating
expenses: |
924,00 |
943,00 |
759,00 |
1.005,00 |
832,00 |
|
|
d) Allocation to
revision fund: |
0,00 |
0,00 |
0,00 |
0,00 |
0,00 |
|
|
A.I. OPERATING BENEFITS
(B.1+B.2+B.3+B.4-A.1-A.2-A.3-A.4-A.5-A.6): |
100.307,00 |
125.866,00 |
84.560,00 |
129.406,00 |
53.541,00 |
|
|
A.7. Financial and similar charges: |
62.127,00 |
73.078,00 |
55.135,00 |
42.163,00 |
42.392,00 |
|
|
a) Due to liabilities
with companies of the group: |
0,00 |
0,00 |
0,00 |
0,00 |
0,00 |
|
|
b) Due to liabilities
with associated companies: |
0,00 |
0,00 |
0,00 |
0,00 |
0,00 |
|
|
c) Due to other
debts.: |
62.127,00 |
73.078,00 |
55.135,00 |
42.163,00 |
42.392,00 |
|
|
d) Losses from
financial investments: |
0,00 |
0,00 |
0,00 |
0,00 |
0,00 |
|
|
A.8. Changes in financial investment
provisions: |
0,00 |
0,00 |
0,00 |
0,00 |
0,00 |
|
|
A.9. Exchange losses: |
0,00 |
13.551,00 |
0,00 |
2.688,00 |
0,00 |
|
|
A.II. NET FINANCIAL INCOME (B.5+B.6+B.7+B.8-A.7-A.8-A.9):
|
0,00 |
0,00 |
0,00 |
0,00 |
0,00 |
|
|
A.III. PROFIT FROM ORDINARY ACTIVITIES (A.I+A.II-B.I-B.II):
|
50.339,00 |
49.413,00 |
41.159,00 |
92.292,00 |
36.976,00 |
|
|
A.10. Changes in provisions for intangible,
tangible and securities portfolio: |
0,00 |
0,00 |
0,00 |
25.000,00 |
-6.196,00 |
|
|
A.11. Losses from tangible and intangible
fixed assets and securities portfolio: |
0,00 |
0,00 |
0,00 |
0,00 |
0,00 |
|
|
A.12. Losses from transactions with own
shares and debentures: |
0,00 |
0,00 |
0,00 |
0,00 |
0,00 |
|
|
A.13. Extraordinary expenses: |
0,00 |
0,00 |
0,00 |
0,00 |
0,00 |
|
|
A.14. Expenses and losses of former financial
years: |
0,00 |
0,00 |
0,00 |
0,00 |
0,00 |
|
|
A.IV. EXTRAORDINARY PROFIT
(B.9+B.10+B.11+B.12+B.13-A.10-A.11-A.12-A.13-A.14): |
0,00 |
3.001,00 |
66,00 |
0,00 |
6.378,00 |
|
|
A.V. PROFIT BEFORE TAXES (A.III+A.IV-B.III-B.IV): |
50.339,00 |
52.415,00 |
41.225,00 |
67.295,00 |
43.354,00 |
|
|
A.15. Corporation tax: |
12.585,00 |
13.104,00 |
10.306,00 |
23.074,00 |
10.839,00 |
|
|
A.16. Miscellaneous taxes: |
0,00 |
0,00 |
0,00 |
0,00 |
0,00 |
|
|
A.VI. FINANCIAL YEAR RESULTS (PROFIT) (A.V-A.15-A.16): |
37.754,00 |
39.311,00 |
30.919,00 |
44.221,00 |
32.516,00 |
|
MERCANTILE REGISTRY.
|
|
EQUIVALENCIA |
EQUIVALENCIA |
EQUIVALENCIA |
EQUIVALENCIA |
EQUIVALENCIA |
|
|
CREDIT |
2013 |
2012 |
2011 |
2010 |
2009 |
|
|
B)
INCOME ( B.1 to B.13): |
9.668.140,00 |
9.933.723,00 |
6.838.748,00 |
7.491.294,00 |
5.813.999,00 |
|
|
B.1. Net total sales: |
9.518.993,00 |
9.818.782,00 |
6.695.351,00 |
7.390.157,00 |
5.665.980,00 |
|
|
a) Sales: |
9.518.993,00 |
9.818.782,00 |
6.695.351,00 |
7.390.157,00 |
5.665.980,00 |
|
|
b) Rendering of
services: |
0,00 |
0,00 |
0,00 |
0,00 |
0,00 |
|
|
Returns and Rappel on
sales: |
0,00 |
0,00 |
0,00 |
0,00 |
0,00 |
|
|
B.2. Stock increase of manufactured goods
and products in process: |
0,00 |
0,00 |
0,00 |
0,00 |
0,00 |
|
|
B.3. Works performed by the company for
fixed assets: |
0,00 |
0,00 |
0,00 |
0,00 |
0,00 |
|
|
B.4. Miscellaneous operating income:
|
136.988,00 |
101.765,00 |
131.597,00 |
93.397,00 |
122.010,00 |
|
|
a) Auxiliary income
and other from current management: |
136.988,00 |
101.765,00 |
131.597,00 |
93.397,00 |
122.010,00 |
|
|
b) Grants: |
0,00 |
0,00 |
0,00 |
0,00 |
0,00 |
|
|
c) Liabilities and
charges provisions surplus: |
0,00 |
0,00 |
0,00 |
0,00 |
0,00 |
|
|
B.I. PÉRDIDAS DE EXPLOTACIÓN
(A.1+A.2+A.3+A.4+A.5-A.6-B.1-B.2-B.3-B.4): |
0,00 |
0,00 |
0,00 |
0,00 |
0,00 |
|
|
B.5. Income from equity investment: |
0,00 |
0,00 |
0,00 |
0,00 |
0,00 |
|
|
a) In companies of
the group: |
0,00 |
0,00 |
0,00 |
0,00 |
0,00 |
|
|
b) In associated
companies: |
0,00 |
0,00 |
0,00 |
0,00 |
0,00 |
|
|
c) Third parties:
|
0,00 |
0,00 |
0,00 |
0,00 |
0,00 |
|
|
B.6. Income from other marketable
securities and long-term receivables: |
0,00 |
0,00 |
0,00 |
0,00 |
0,00 |
|
|
a) From companies of
the group: |
0,00 |
0,00 |
0,00 |
0,00 |
0,00 |
|
|
b) From associated
companies: |
0,00 |
0,00 |
0,00 |
0,00 |
0,00 |
|
|
c) From companies out
of the group: |
0,00 |
0,00 |
0,00 |
0,00 |
0,00 |
|
|
B.7. Miscellaneous interests or similar
income: |
10.031,00 |
10.176,00 |
9.231,00 |
7.737,00 |
17.520,00 |
|
|
a) From companies of
the group: |
0,00 |
0,00 |
0,00 |
0,00 |
0,00 |
|
|
b) From associated
companies: |
0,00 |
0,00 |
0,00 |
0,00 |
0,00 |
|
|
c) Miscellaneous
interests: |
10.031,00 |
10.176,00 |
9.231,00 |
7.737,00 |
17.520,00 |
|
|
d) Profit on financial
investment: |
0,00 |
0,00 |
0,00 |
0,00 |
0,00 |
|
|
B.8. Exchange positive differences: |
2.127,00 |
0,00 |
2.502,00 |
0,00 |
8.307,00 |
|
|
B.II. NEGATIVE FINANCIAL RESULTS (A.7+A.8+A.9-B.5-B.6-B.7-B.8):
|
49.968,00 |
76.453,00 |
43.401,00 |
37.113,00 |
16.564,00 |
|
|
B.III. LOSSES ON ORDINARY ACTIVITIES ( B.I + B.II - A.I - A.II
): |
0,00 |
0,00 |
0,00 |
0,00 |
0,00 |
|
|
B.9.Profit on disposal of both tangible
and intangible fixed assets and securities portfolio: |
0,00 |
0,00 |
0,00 |
0,00 |
0,00 |
|
|
B.10. Profit on transactions with own
shares and debentures: |
0,00 |
0,00 |
0,00 |
0,00 |
0,00 |
|
|
B.11. Capital grants transferred to profit
and loss: |
0,00 |
0,00 |
0,00 |
0,00 |
0,00 |
|
|
B.12. Extraordinary income: |
0,00 |
3.001,00 |
66,00 |
3,00 |
182,00 |
|
|
B.13. Income and profit of former financial
years: |
0,00 |
0,00 |
0,00 |
0,00 |
0,00 |
|
|
B.IV. NEGATIVE EXTRAORDINARY RESULTS
(A.10+A.11+A.12+A.13+A.14-B.9-B.10-B.11-B.12-B.13): |
0,00 |
0,00 |
0,00 |
24.997,00 |
0,00 |
|
|
B.V. LOSSES BEFORE TAXES (B.III+B.IV-A.III-A.IV): |
0,00 |
0,00 |
0,00 |
0,00 |
0,00 |
|
|
B.VI. RESULT OF THE PERIOD (LOSSES) (B.V+A.15+A.16): |
0,00 |
0,00 |
0,00 |
0,00 |
0,00 |
|
MERCANTILE REGISTRY.
CASHFLOW
STATEMENT
|
Model: Normal
>
Source of information: Data contained in this section is taken from the
information declared in the Annual Accounts submitted to the Trade Register.
|
|
2013 |
2012 |
2011 |
2010 |
2009 |
|
|
1.
Fiscal year result before taxes.: 61100 |
50.339,00 |
52.415,00 |
41.225,00 |
67.295,00 |
43.354,00 |
|
|
2.
Results adjustments.: 61200 |
61.799,00 |
72.606,00 |
55.730,00 |
58.975,00 |
7.134,00 |
|
|
a) Fixed Assets Amortization (+).: 61201 |
9.704,00 |
9.704,00 |
9.704,00 |
12.995,00 |
17.484,00 |
|
|
b) Obsolescence Allowances (+/-). : 61202 |
0,00 |
0,00 |
0,00 |
17.047,00 |
-24.239,00 |
|
|
e) Results on disposal of fixed assets (+/-). : 61205 |
0,00 |
0,00 |
0,00 |
0,00 |
-6.196,00 |
|
|
g) Financial income (-).: 61207 |
-10.031,00 |
-10.176,00 |
-9.231,00 |
-7.737,00 |
-17.520,00 |
|
|
h) Financial Expenses (+). : 61208 |
62.127,00 |
73.078,00 |
55.135,00 |
42.163,00 |
42.392,00 |
|
|
i) Exchange differences (+/-). : 61209 |
0,00 |
0,00 |
-2.502,00 |
2.688,00 |
-8.307,00 |
|
|
k) Other income and expense (-/+). : 61211 |
0,00 |
0,00 |
2.625,00 |
-8.181,00 |
3.520,00 |
|
|
3.
Changes in current capital equity.: 61300 |
533.962,00 |
-265.769,00 |
459.401,00 |
-641.676,00 |
-26.253,00 |
|
|
a) Stock (+/-).: 61301 |
89.150,00 |
-162.993,00 |
137.948,00 |
-103.073,00 |
520.209,00 |
|
|
d) Debtors and other accounts receivable (+/-). : 61302 |
167.016,00 |
-95.656,00 |
886.735,00 |
-898.633,00 |
441.870,00 |
|
|
c) Other current assets (+/-). : 61303 |
-33.209,00 |
-4.549,00 |
0,00 |
0,00 |
0,00 |
|
|
d) Creditors and other accounts payable (+/-). : 61304 |
311.004,00 |
-2.571,00 |
-565.282,00 |
360.030,00 |
-20.791,00 |
|
|
e) Other current liabilities (+/-).: 61305 |
0,00 |
0,00 |
0,00 |
0,00 |
-967.541,00 |
|
|
4.
Other cash flows for operating activities.: 61400 |
-52.095,00 |
-62.902,00 |
-74.549,00 |
-37.471,00 |
-47.554,00 |
|
|
a) Interest payments (-). : 61401 |
-62.127,00 |
-73.078,00 |
-55.135,00 |
-42.163,00 |
-42.392,00 |
|
|
c) Interest collection (+). : 61403 |
10.031,00 |
10.176,00 |
9.231,00 |
7.737,00 |
17.520,00 |
|
|
d) Income tax payment collection (payments) (+/-).: 61404 |
0,00 |
0,00 |
-28.646,00 |
-3.045,00 |
-22.682,00 |
|
|
5.
Operating activity cash flows (1 + 2 + 3 + 4) : 61500 |
594.005,00 |
-203.651,00 |
481.806,00 |
-552.877,00 |
-23.319,00 |
|
|
6.
Payments for investment (-).: 62100 |
0,00 |
-1.287,00 |
0,00 |
0,00 |
-4.358,00 |
|
|
e) Other financial assets. : 62105 |
0,00 |
-1.287,00 |
0,00 |
0,00 |
-4.358,00 |
|
|
7.
Divestment payment collection (+). : 62200 |
14.107,00 |
9.704,00 |
0,00 |
0,00 |
7.759,00 |
|
|
c) Fixed assets. : 62203 |
9.704,00 |
9.704,00 |
0,00 |
0,00 |
7.759,00 |
|
|
e) Other financial assets. : 62205 |
4.403,00 |
0,00 |
0,00 |
0,00 |
0,00 |
|
|
8.
Investment activity cash flows (6 + 7) minus Amortization: 62300 |
4.403,00 |
-1.287,00 |
-9.704,00 |
-12.995,00 |
-14.083,00 |
|
|
9.
Payment collection and payments for equity instruments. : 63100 |
0,00 |
0,00 |
0,00 |
0,00 |
0,00 |
|
|
10.
Payment collection and payments for financial liabilities instruments.:
63200 |
-213.650,00 |
196.579,00 |
-639.284,00 |
696.660,00 |
0,00 |
|
|
a) Issuance : 63201 |
0,00 |
196.579,00 |
0,00 |
696.660,00 |
0,00 |
|
|
2. Debts incurred with credit institutions (+). : 63203 |
0,00 |
196.579,00 |
0,00 |
696.660,00 |
0,00 |
|
|
b) Repayment and amortization of : 63207 |
-213.650,00 |
0,00 |
-639.284,00 |
0,00 |
0,00 |
|
|
2. Debts incurred with credit institutions (-).: 63209 |
-213.650,00 |
0,00 |
-639.284,00 |
0,00 |
0,00 |
|
|
11.
Payments from dividends and remunerations from other assets instruments. :
63300 |
0,00 |
0,00 |
0,00 |
0,00 |
0,00 |
|
|
12.
Cash flows for financing activities (9+10+11).: 63400 |
-213.650,00 |
196.579,00 |
-639.284,00 |
696.660,00 |
0,00 |
|
|
D)
EFFECT OF EXCHANGE RATE CHANGES: 64000 |
0,00 |
0,00 |
2.502,00 |
-2.688,00 |
8.307,00 |
|
|
E)
NET INCREASE/DECREASE OF CASH OR EQUIVALENT ASSETS (+/-5+/-8+/12+/-D) :
65000 |
384.757,00 |
-8.359,00 |
-154.976,00 |
141.095,00 |
-11.611,00 |
|
|
Cash or equivalent assets as of beginning of the fiscal year.:
65100 |
147.971,00 |
156.330,00 |
311.306,00 |
170.211,00 |
181.822,00 |
|
|
Cash or equivalent assets as of end of the fiscal year.:
65200 |
532.729,00 |
147.971,00 |
156.330,00 |
311.306,00 |
170.211,00 |
|
FINANCIAL
DIAGNOSIS
|
>
Economic-Financial Comparative Analysis
Data used in the following ratios and indicators is taken from the
Annual Accounts submitted by the company to the TRADE REGISTER.
>
Comparison within the Sector
|
Cash
Flow |
2013 |
2012 |
Variación 2013 - 2012 |
|
|||
|
|
Empresa |
Sector |
Empresa |
Sector |
Empresa |
Sector |
|
|
Cash
Flow over Sales: |
0,04 % |
0,02 % |
0,00 % |
0,17 % |
|
-89,77 % |
|
|
EBITDA
over Sales: |
1,16 % |
-1,56 % |
1,38 % |
7,58 % |
-16,30 % |
-120,55 % |
|
|
Cash
Flow Yield: |
0,16 % |
0,00 % |
0,00 % |
0,04 % |
|
-89,82 % |
|
|
Profitability |
2013 |
2012 |
Variación 2013 - 2012 |
|
|||
|
|
Empresa |
Sector |
Empresa |
Sector |
Empresa |
Sector |
|
|
Operating
economic profitability: |
4,50 % |
-12,64 % |
6,07 % |
0,51 % |
-25,92 % |
-2.560,19 % |
|
|
Total
economic profitability: |
4,71 % |
-3,45 % |
5,60 % |
-0,03 % |
-15,92 % |
-12.451,89 % |
|
|
Financial
profitability: |
5,72 % |
-12,16 % |
6,32 % |
-3,94 % |
-9,45 % |
-208,39 % |
|
|
Margin:
|
1,04 % |
-25,21 % |
1,27 % |
0,94 % |
-18,12 % |
-2.780,63 % |
|
|
Mark-up:
|
0,52 % |
-22,28 % |
0,50 % |
-6,14 % |
4,66 % |
-262,80 % |
|
|
Solvency |
2013 |
2012 |
Variación 2013 - 2012 |
|
|||
|
|
Empresa |
Sector |
Empresa |
Sector |
Empresa |
Sector |
|
|
Liquidity:
|
0,31 |
0,16 |
0,09 |
0,16 |
237,13 |
4,13 |
|
|
Acid
Test: |
0,98 |
1,22 |
0,91 |
0,86 |
7,12 |
41,55 |
|
|
Working
Capital / Investment: |
0,21 |
0,08 |
0,20 |
0,08 |
4,87 |
2,42 |
|
|
Solvency:
|
1,28 |
1,70 |
1,27 |
1,43 |
1,00 |
18,99 |
|
|
Indebtedness |
2013 |
2012 |
Variación 2013 - 2012 |
|
|||
|
|
Empresa |
Sector |
Empresa |
Sector |
Empresa |
Sector |
|
|
Indebtedness
level: |
2,62 |
1,06 |
2,60 |
1,07 |
0,68 |
-0,75 |
|
|
Borrowing
Composition: |
0,00 |
0,96 |
0,00 |
1,22 |
|
-21,07 |
|
|
Repayment
Ability: |
4,49 |
128,19 |
-193,68 |
14,17 |
102,32 |
804,69 |
|
|
Warranty:
|
1,38 |
2,10 |
1,38 |
1,94 |
-0,19 |
8,61 |
|
|
Generated
resources / Total creditors: |
0,03 |
-0,06 |
0,03 |
0,01 |
-9,33 |
-614,83 |
|
|
Efficiency |
2013 |
2012 |
Variación 2013 - 2012 |
|
|||
|
|
Empresa |
Sector |
Empresa |
Sector |
Empresa |
Sector |
|
|
Productivity:
|
1,29 |
0,94 |
1,36 |
1,30 |
-5,30 |
-27,71 |
|
|
Turnover
of Collection Rights : |
8,34 |
2,92 |
7,49 |
3,64 |
11,38 |
-19,74 |
|
|
Turnover
of Payment Entitlements: |
13,87 |
2,36 |
27,93 |
2,35 |
-50,32 |
0,25 |
|
|
Stock
rotation: |
19,54 |
2,57 |
16,94 |
2,20 |
15,35 |
16,72 |
|
|
Assets
turnover: |
4,33 |
0,50 |
4,78 |
0,55 |
-9,52 |
-8,22 |
|
|
Borrowing
Cost: |
3,59 |
3,38 |
4,51 |
2,83 |
-20,39 |
19,72 |
|
>
Trend of indicators under the General Accounting Plan of 2007 (2013, 2012,
2011, 2010, 2009)
|
Cash
Flow |
2013 |
2012 |
2011 |
2010 |
2009 |
|
|
Cash
Flow over Sales: |
0,04 % |
0,00 % |
-0,02 % |
0,02 % |
0,00 % |
|
|
EBITDA
over Sales: |
1,16 % |
1,38 % |
1,41 % |
1,93 % |
1,25 % |
|
|
Cash
Flow Yield: |
0,16 % |
0,00 % |
-0,08 % |
0,04 % |
-0,01 % |
|
|
Profitability |
2013 |
2012 |
2011 |
2010 |
2009 |
|
|
Operating
economic profitability: |
4,50 % |
6,07 % |
4,61 % |
4,28 % |
3,18 % |
|
|
Total
economic profitability: |
4,71 % |
5,60 % |
4,83 % |
3,44 % |
4,15 % |
|
|
Financial
profitability: |
5,72 % |
6,32 % |
5,30 % |
8,01 % |
6,40 % |
|
|
Margin:
|
1,04 % |
1,27 % |
1,24 % |
1,73 % |
1,03 % |
|
|
Mark-up:
|
0,52 % |
0,50 % |
0,60 % |
0,90 % |
0,75 % |
|
|
Solvency |
2013 |
2012 |
2011 |
2010 |
2009 |
|
|
Liquidity:
|
0,31 |
0,09 |
0,11 |
0,12 |
0,11 |
|
|
Acid
Test: |
0,98 |
0,91 |
0,98 |
0,92 |
0,89 |
|
|
Working
Capital / Investment: |
0,21 |
0,20 |
0,20 |
0,11 |
0,13 |
|
|
Solvency:
|
1,28 |
1,27 |
1,28 |
1,13 |
1,17 |
|
|
Indebtedness |
2013 |
2012 |
2011 |
2010 |
2009 |
|
|
Indebtedness
level: |
2,62 |
2,60 |
2,42 |
4,77 |
3,07 |
|
|
Borrowing
Composition: |
0,00 |
0,00 |
0,00 |
0,00 |
0,00 |
|
|
Repayment
Ability: |
4,49 |
-193,68 |
-9,11 |
18,65 |
-134,32 |
|
|
Warranty:
|
1,38 |
1,38 |
1,41 |
1,21 |
1,33 |
|
|
Generated
resources / Total creditors: |
0,03 |
0,03 |
0,03 |
0,03 |
0,03 |
|
|
Efficiency |
2013 |
2012 |
2011 |
2010 |
2009 |
|
|
Productivity:
|
1,29 |
1,36 |
1,26 |
1,40 |
1,17 |
|
|
Turnover
of Collection Rights : |
8,34 |
7,49 |
5,55 |
3,54 |
4,76 |
|
|
Turnover
of Payment Entitlements: |
13,87 |
27,93 |
19,51 |
7,69 |
9,97 |
|
|
Stock
rotation: |
19,54 |
16,94 |
16,24 |
13,30 |
13,19 |
|
|
Assets
turnover: |
4,33 |
4,78 |
3,72 |
2,48 |
3,08 |
|
|
Borrowing
Cost: |
3,59 |
4,51 |
3,91 |
1,60 |
2,72 |
|
COMPARATIVE SECTORIAL BALANCE
|
Sector-based Comparison under the rules
of the New General Accounting Plan.
|
|
Variación - |
|
|
|
Empresa |
Sector |
|
|
Variación - |
|
|
|
Empresa |
Sector |
|
|
Variación - |
|
|
|
Empresa |
Sector |
Public Tenders and Works Won
|
|
Organisation that calls the
tender: |
|
INSPECCION
GENERAL DE SANIDAD DEL MINISTERIO DE DEFENSA |
|
Objective of Tender: |
|
SUMINISTRO
DE 13 000 KGRS DE VASELINA FILANTE |
|
Date Awarded: |
|
13/12/2012 |
|
Cost: |
|
31.145,40
EURO. |
|
|
Research
Summary
|
|
This is a registered firm
established in 1997, dedicated to the wholesale trade of chemical products to
different sectors. Its activities are developed nationally and
internationally. In the consulted resources, nothing against it were found.
Based on the above, we consider that it is possible to maintain relations
with the firm in operations of risk, in accordance with its size. |
Sources
|
|
Registry of Commerce's Official
Gazette. Own and external data bases Company References |
FOREIGN EXCHANGE RATES
|
Currency |
Unit
|
Indian Rupees |
|
US Dollar |
1 |
Rs.63.96 |
|
|
1 |
Rs.99.93 |
|
Euro |
1 |
Rs.70.16 |
INFORMATION DETAILS
|
Analysis Done by
: |
RAS |
|
|
|
|
Report Prepared
by : |
TPT |
RATING EXPLANATIONS
|
RATING |
STATUS |
PROPOSED CREDIT LINE |
|
|
|
>86 |
Aaa |
Possesses an extremely sound financial base with the strongest
capability for timely payment of interest and principal sums |
Unlimited |
|
|
71-85 |
Aa |
Possesses adequate working capital. No caution needed for credit
transaction. It has above average (strong) capability for payment of interest
and principal sums |
Large |
|
|
56-70 |
A |
Financial & operational base are regarded healthy. General
unfavourable factors will not cause fatal effect. Satisfactory capability for
payment of interest and principal sums |
Fairly Large |
|
|
41-55 |
Ba |
Overall operation is considered normal. Capable to meet normal
commitments. |
Satisfactory |
|
|
26-40 |
B |
Capability to overcome financial difficulties seems comparatively
below average. |
Small |
|
|
11-25 |
Ca |
Adverse factors are apparent. Repayment of interest and principal sums
in default or expected to be in default upon maturity |
Limited with
full security |
|
|
<10 |
C |
Absolute credit risk exists. Caution needed to be exercised |
Credit not
recommended |
|
|
-- |
NB |
New Business |
-- |
|
This score serves as a reference to assess
SC’s credit risk and to set the amount of credit to be extended. It is
calculated from a composite of weighted scores obtained from each of the major sections
of this report. The assessed factors and their relative weights (as indicated
through %) are as follows:
Financial
condition (40%) Ownership
background (20%) Payment
record (10%)
Credit history
(10%) Market trend (10%) Operational size
(10%)
This report is issued at your request without any
risk and responsibility on the part of MIRA INFORM PRIVATE LIMITED (MIPL)
or its officials.