MIRA INFORM REPORT
|
Report No. : |
334905 |
|
Report Date : |
05.08.2015 |
IDENTIFICATION DETAILS
|
Name : |
MONSANTO
THAILAND LIMITED |
|
|
|
|
Registered Office : |
22nd Floor, Rasa Tower I, 555 Phaholyothin Road, Chatuchak, Bangkok 10900 |
|
|
|
|
Country : |
Thailand |
|
|
|
|
Financials (as on) : |
31.08.2014 |
|
|
|
|
Date of Incorporation : |
23.02.1968 |
|
|
|
|
Com. Reg. No.: |
0105511001065 |
|
|
|
|
Legal Form : |
Private Limited Company |
|
|
|
|
Line of Business : |
Research & Development
of Corn Seed. |
|
|
|
|
No. of Employees : |
400 |
RATING & COMMENTS
|
MIRA’s Rating : |
Ba |
|
RATING |
STATUS |
PROPOSED CREDIT LINE |
|
|
41-55 |
Ba |
Overall operation is considered normal. Capable to meet normal
commitments. |
Satisfactory |
|
Status : |
Satisfactory |
|
|
|
|
Payment Behaviour : |
Slow but correct |
|
|
|
|
Litigation : |
Clear |
NOTES:
Any query related to this report can be made
on e-mail: infodept@mirainform.com
while quoting report number, name and date.
ECGC Country Risk Classification List – March 31, 2015
|
Country Name |
Previous Rating (31.12.2014) |
Current Rating (31.03.2015) |
|
Thailand |
A2 |
A2 |
|
Risk Category |
ECGC Classification |
|
Insignificant |
A1 |
|
Low |
A2 |
|
Moderate |
B1 |
|
High |
B2 |
|
Very High |
C1 |
|
Restricted |
C2 |
|
Off-credit |
D |
THAILAND - ECONOMIC
OVERVIEW
With a well-developed infrastructure, a free-enterprise economy,
generally pro-investment policies, and strong export industries, Thailand has
historically had a strong economy due in part to industrial and agriculture
exports - mostly electronics, agricultural commodities, automobiles and parts,
and processed foods. The economy experienced slow growth and declining exports
in 2014, in part due to domestic political turmoil and sluggish global demand.
With full employment, Thailand attracts an estimated 4 million migrant workers
from neighboring countries, and faces labor shortages. Following the May 2014
coup d’tat, tourism decreased 6-7% but is beginning to recover. The household
debt to GDP ratio is over 80%. The Thai government in 2013 implemented a
nation-wide 300 baht ($10) per day minimum wage policy and deployed new tax
reforms designed to lower rates on middle-income earners. The Thai baht has
remained stable.
|
Source
: CIA |
Company
Name
MONSANTO THAILAND LIMITED
SUMMARY
BUSINESS ADDRESS : 22nd FLOOR,
RASA TOWER I,
555
PHAHOLYOTHIN ROAD,
CHATUCHAK,
BANGKOK 10900,
THAILAND
TELEPHONE : [66] 2793-4888
FAX :
[66] 2937-0404
E-MAIL : lada.boonjongkiat@monsanto.com
REGISTRATION ADDRESS : SAME AS
BUSINESS ADDRESS
ESTABLISHED : 1968
REGISTRATION NO. : 0105511001065
TAX ID NO. :
3101039955
CAPITAL REGISTERED : BHT. 326,514,500
CAPITAL PAID-UP : BHT. 326,514,500
SHAREHOLDER’S PROPORTION : AMERICAN :
100%
FISCAL YEAR CLOSING DATE : AUGUST 31
LEGAL STATUS : PRIVATE LIMITED
COMPANY
EXECUTIVE : MR.
CRAIG PHILLIP DUNN,
AUSTRALIAN
CHIEF EXECUTIVE
OFFICER
NO. OF STAFF : 400
LINES OF BUSINESS : CORN SEED
RESEARCH
& DEVELOPMENT
CORPORATE
PROFILE
OPERATING TREND : STABLE
PRESENT SITUATION : OPERATING NORMALLY
REPUTATION : GOOD WITH
NORMAL BUSINESS ENGAGEMENT
MANAGEMENT STANDARD : MANAGEMENT WITH
FAIR PERFORMANCE
HISTORY
The subject was
established on February 23,
1968 as a
private limited company
under the name
style MONSANTO THAILAND LIMITED
by American groups,
with the initial
business objective to
engage in manufacturing
of agricultural chemicals
to both local and
overseas markets. The subject
received the promotional privilege from
the Board of Investment.
In 2010, its
business lines had
been diversified to
import corn seed
for research and
development. It currently
employs approximately 400
staff.
The subject is
a wholly owned
subsidiary of Seminis
Vegetable Seeds Inc.,
U.S.A., a member
of Monsanto group
worldwide.
The subject’s registered address
is 22nd Floor, Rasa Tower
I, 555 Phaholyothin Rd., Chatuchak,
Bangkok 10900, and
this is the
subject’s current operation
address.
THE
BOARD OF DIRECTOR
|
Name |
|
Nationality |
Age |
|
|
|
|
|
|
Mr. Sumpun Sittipanuwong |
|
Thai |
55 |
|
Ms. Lada Boonjongkiat |
|
Thai |
46 |
|
Ms.
Chatchaya Suthonrak |
|
Thai |
48 |
|
Mr. Craig Phillip
Dunn |
|
Australian |
48 |
AUTHORIZED
PERSON
Any two of
the above directors
can jointly sign on behalf of
the subject with company’s affixed.
MANAGEMENT
Mr. Craig Phillip
Dunn is
the Chief Executive
Officer.
He is
Australian nationality with
the age of
48 years old.
Ms. Lada Boonjongkiat
is the Managing
Director.
She is
Thai nationality with
the age of 46
years old.
Mr. Sumpun Sittipanuwong
is the Scientific
Affairs Manager.
He is
Thai nationality with
the age of 55
years old.
Mr. Sakorn Tripetchpaisal
is the Business
Manager.
He is
Thai nationality.
Ms.
Nareewan Photikam
is the Sales
Manager.
She is
Thai nationality.
Dr.
Boonyanuch Nakwong
is the Director
of Regulatory Affairs
Department.
She is
Thai nationality.
BUSINESS
OPERATIONS
The subject
is engaged in
importing, researching and
developing of corn
seeds under the
brand “DEKALB” with
various series, e.g. “DEKALB BIG 919”,
“DEKALB 9901”, “DEKALB
979” and “DEKALB
9955”.
PURCHASE
Most of corn seeds
for research and development are
imported from U.S.A., the
remaining is purchased
locally.
MAJOR SUPPLIER
Seminis Vegetable
Seeds Inc. : U.S.A.
SALES [LOCAL]
The products
are sold locally
to dealers nationwide.
EXPORT
The products
are also exported
to Vietnam, Indonesia,
Myanmar, Cambodia, India,
Australia and Laos.
MAJOR CUSTOMER
D.A.T.T. Co.,
Ltd. : Thailand
SUBSIDIARY
AND AFFILIATED COMPANY
The subject
is not found to have
any subsidiary or
affiliated company here
in Thailand.
LITIGATION
Bankruptcy and
Receivership
There are
no litigation on
bankruptcy and receivership
cases filed against
the subject found
at Legal Execution
Department for the
past five years.
Others
There are
no legal suits
filed against the
subject according the
past two years.
CREDIT
Sales are
by cash or
on the credit term
of 30-60 days.
Local bills
are paid by
cash or on
the credits term
of 30-60 days.
Imports are
by L/C at
sight or T/T.
Exports are
against T/T.
BANKING
Bangkok Bank
Public Co., Ltd.
Kasikornbank Public
Co., Ltd.
Krung Thai
Bank Public Co.,
Ltd.
EMPLOYMENT
The subject employs
approximately 400 staff.
LOCATION
DETAILS
The premise is
rented for operating
administrative office at
the heading address.
Premise is located
in commercial/residential area.
Corn seed factories:
-
229 Moo 18,
Mitraphap Rd., T.
Pakchong, A. Pakchong,
Nakornratchasima
-
56 Moo 6,
Wangthong-Kaosai Rd., T.
Dinthong, A. Wangthong, Pisanuloke
Branches and warehouses:
- 622/1 Moo 1,
Nityo Rd., T.
Pangkhon, A. Pangkhon,
Sakolnakorn
- 99 Moo 2,
T. Maekorn, A.
Muang, Chiangrai
- 341 Moo 4,
T. Banped, A.
Muang, Khonkaen
- 134 Moo 4,
T. Thungfair, A.
Muang, Lampang
COMMENT
The only business Monsanto Thailand has involved in is agriculture. This
is why Monsanto invests both time and money in research to help create the best seed
possible for farmers. Whether it’s through breeding or biotechnology, Monsanto is committed to research
in various agricultural crops.
The subject is now
engaged in importing,
researching and developing
of corn seeds. Subject’s business
has grown strongly
in the past years.
It reported a
strong sales in
2014 and expanding
steadily.
FINANCIAL
INFORMATION
The capital was
registered at Bht. 100,000
divided into 1,000
shares of Bht. 100 each.
The capital was
increased later as
following:
Bht. 18,000,000
on December 2,
1985
Bht. 168,514,500
on September 30,
1997
Bht. 326,514,500
on October 12,
2012
The latest registered
capital was increased
to Bht. 326,514,500 divided
into 3,265,145 shares
of Bht. 100
each with fully
paid.
THE
SHAREHOLDERS LISTED WERE
[as at
November 25, 2015]
|
NAME |
HOLDING |
% |
|
|
|
|
|
Seminis Vegetable
Seeds Inc. Nationality: American Address :
800 North Lindbergh
Boulevard, Saint Louis, Missouri, U.S.A.
|
3,265,140 |
100.00 |
|
Olympia Corp. Nationality: American Address :
800 North Lindbergh
Boulevard, Saint Louis, Missouri, U.S.A.
|
3 |
- |
|
Monsanto Caribe
LLC. Nationality: American Address :
800 North Lindbergh
Boulevard, Saint Louis, Missouri, U.S.A.
|
1 |
- |
|
Monsanto Inter-America Co. Nationality: American Address :
800 North Lindbergh
Boulevard, Saint Louis, Missouri, U.S.A.
|
1 |
- |
Total Shareholders
: 4
Share Structure
[as at
November 25, 2015]
|
Nationality |
Shareholders |
No. of
Share |
% Shares |
|
|
|
|
|
|
Thai |
- |
- |
- |
|
Foreign - American |
4 |
3,265,145 |
100.00 |
|
Total |
4 |
3,265,145 |
100.00 |
NAME OF AUDITOR & CERTIFIED PUBLIC
ACCOUNTANT NO.
Ms. Wimonporn Boonyasathien
No. 4067
BALANCE
SHEET [BAHT]
The latest financial
figures published for
August 31, 2014,
2013 & 2012 were:
ASSETS
|
Current Assets |
2014 |
2013 |
2012 |
|
|
|
|
|
|
Cash and Cash
Equivalents |
51,437,519 |
542,032,497 |
23,777,830 |
|
Trade
Accounts & Other Receivable |
683,162,848 |
378,968,931 |
881,994,440 |
|
Inventories |
677,193,609 |
524,741,548 |
213,824,282 |
|
Other Current
Assets |
2,860,883 |
3,215,758 |
10,299,689 |
|
|
|
|
|
|
Total Current
Assets |
1,414,654,859 |
1,448,958,734 |
1,129,896,241 |
|
Fixed Assets |
440,236,812 |
431,487,762 |
480,913,075 |
|
Other Non-current
Assets |
1,226,588 |
2,419,745 |
2,152,126 |
|
Total Assets |
1,856,118,259 |
1,882,866,241 |
1,612,961,442 |
LIABILITIES & SHAREHOLDERS' EQUITY [BAHT]
|
Current Liabilities |
2014 |
2013 |
2012 |
|
|
|
|
|
|
Trade Accounts
& Other Payable |
146,141,226 |
174,880,829 |
261,044,025 |
|
Short-term Loan
from Related
company |
630,000,000 |
577,000,000 |
172,614,139 |
|
Current
Portion of Long-term Loan |
- |
146,000,000 |
599,791,429 |
|
Current
Portion of Financial Leas Contract Liabilities |
1,614,377 |
4,742,710 |
14,168,273 |
|
Accrued Income
Tax |
26,086,806 |
49,247,415 |
57,709,392 |
|
Other Current
Liabilities |
34,565,819 |
21,959,355 |
25,973,543 |
|
|
|
|
|
|
Total Current
Liabilities |
838,408,228 |
973,830,309 |
1,131,300,801 |
|
Long-term
Loan from Related
Company |
- |
150,000,000 |
246,000,000 |
|
Financial Lease
Contract Liabilities |
- |
1,476,272 |
6,360,592 |
|
Employees Benefits
Obligation |
41,095,343 |
47,121,462 |
41,503,710 |
|
Total Liabilities
|
879,503,571 |
1,172,428,043 |
1,425,165,103 |
|
|
|
|
|
|
Shareholders'
Equity |
|
|
|
|
|
|
|
|
|
Share capital : Baht 100
par value authorized,
issued and fully
paid share
capital 3,265,145 shares
in 2014 & 2013 & 1,685,145 shares in
2012 |
326,514,500 |
326,514,500 |
168,514,500 |
|
|
|
|
|
|
Capital Paid |
326,514,500 |
326,514,500 |
168,514,500 |
|
Retained Earning Appropriated for statutory reserve |
16,851,450 |
16,851,450 |
16,851,450 |
|
Unappropriated |
692,546,904 |
426,370,414 |
61,728,555 |
|
Other Components of
Shareholders’ Equity |
[59,298,166] |
[59,298,166] |
[59,298,166] |
|
Total Shareholders' Equity |
976,614,688 |
710,438,198 |
187,796,339 |
|
Total Liabilities
& Shareholders' Equity |
1,856,118,259 |
1,882,866,241 |
1,612,961,442 |
PROFIT
& LOSS ACCOUNT
|
Revenue |
2014 |
2013 |
2012 |
|
|
|
|
|
|
Sales Income |
1,946,192,057 |
1,854,243,762 |
1,797,815,873 |
|
Gain on Exchange
Rate |
- |
33,495,288 |
12,508,364 |
|
Other Income |
12,820,845 |
13,671,087 |
19,133,727 |
|
Total Revenues |
1,959,012,902 |
1,901,410,137 |
1,829,457,964 |
|
Expenses |
|
|
|
|
|
|
|
|
|
Cost of
Goods Sold |
1,264,912,227 |
1,113,680,868 |
1,261,534,232 |
|
Selling Expenses |
80,955,101 |
79,526,283 |
78,193,015 |
|
Administrative Expenses |
233,920,246 |
229,773,152 |
214,925,775 |
|
Loss on Exchange
Rate |
19,300,254 |
- |
- |
|
Total Expenses
|
1,599,087,828 |
1,422,980,303 |
1,554,653,022 |
|
|
|
|
|
|
Profit
/[Loss] before Financial
Cost & Income
Tax |
359,925,074 |
478,429,834 |
274,804,942 |
|
Financial Cost |
[23,848,510] |
[32,227,897] |
[37,278,275] |
|
Profit /[Loss]
before Income Tax |
336,076,564 |
446,201,937 |
237,526,667 |
|
Income Tax |
[69,900,074] |
[81,560,078] |
[68,674,428] |
|
|
|
|
|
|
Net Profit / [Loss] |
266,176,490 |
364,641,859 |
168,852,239 |
FINANCIAL
ANALYSIS
|
ITEM |
UNIT |
2014 |
2013 |
2012 |
|
|
|
|
|
|
|
LIQUIDITY RATIO |
|
|
|
|
|
CURRENT RATIO |
TIMES |
1.69 |
1.49 |
1.00 |
|
QUICK RATIO |
TIMES |
0.88 |
0.95 |
0.80 |
|
|
|
|
|
|
|
ACTIVITY RATIO |
|
|
|
|
|
FIXED ASSETS
TURNOVER |
TIMES |
4.42 |
4.30 |
3.74 |
|
TOTAL ASSETS
TURNOVER |
TIMES |
1.05 |
0.98 |
1.11 |
|
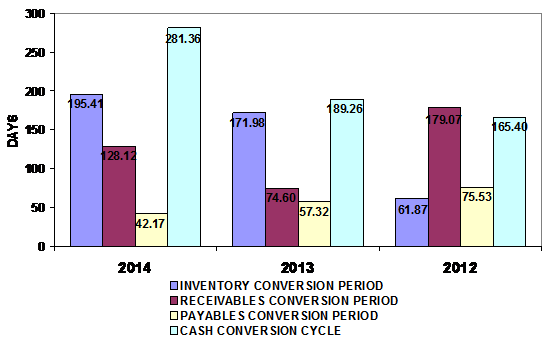
INVENTORY
CONVERSION PERIOD |
DAYS |
195.41 |
171.98 |
61.87 |
|
INVENTORY
TURNOVER |
TIMES |
1.87 |
2.12 |
5.90 |
|
RECEIVABLES
CONVERSION PERIOD |
DAYS |
128.12 |
74.60 |
179.07 |
|
RECEIVABLES
TURNOVER |
TIMES |
2.85 |
4.89 |
2.04 |
|
PAYABLES
CONVERSION PERIOD |
DAYS |
42.17 |
57.32 |
75.53 |
|
CASH CONVERSION
CYCLE |
DAYS |
281.36 |
189.26 |
165.40 |
|
|
|
|
|
|
|
PROFITABILITY RATIO |
|
|
|
|
|
COST OF GOODS
SOLD |
% |
64.99 |
60.06 |
70.17 |
|
SELLING &
ADMINISTRATION |
% |
16.18 |
16.68 |
16.30 |
|
INTEREST |
% |
1.23 |
1.74 |
2.07 |
|
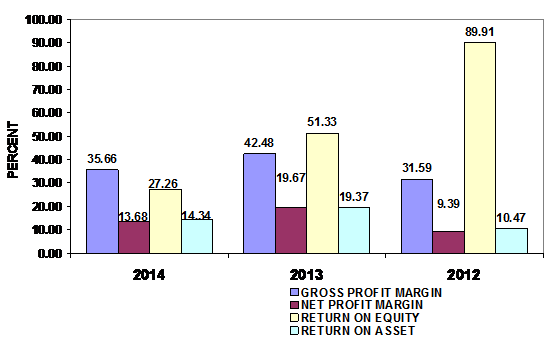
GROSS PROFIT
MARGIN |
% |
35.66 |
42.48 |
31.59 |
|
NET PROFIT MARGIN
BEFORE EX. ITEM |
% |
18.49 |
25.80 |
15.29 |
|
NET PROFIT MARGIN |
% |
13.68 |
19.67 |
9.39 |
|
RETURN ON EQUITY |
% |
27.26 |
51.33 |
89.91 |
|
RETURN ON ASSET |
% |
14.34 |
19.37 |
10.47 |
|
EARNING PER SHARE |
BAHT |
81.52 |
111.68 |
100.20 |
|
|
|
|
|
|
|
LEVERAGE RATIO |
|
|
|
|
|
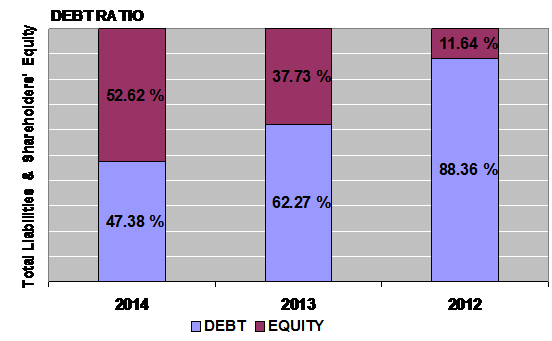
DEBT RATIO |
TIMES |
0.47 |
0.62 |
0.88 |
|
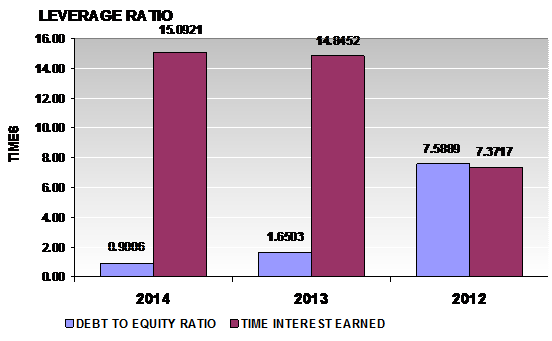
DEBT TO EQUITY
RATIO |
TIMES |
0.90 |
1.65 |
7.59 |
|
TIME INTEREST
EARNED |
TIMES |
15.09 |
14.85 |
7.37 |
|
|
|
|
|
|
|
ANNUAL GROWTH |
|
|
|
|
|
SALES GROWTH |
% |
4.96 |
3.14 |
|
|
OPERATING PROFIT |
% |
(24.77) |
74.10 |
|
|
NET PROFIT |
% |
(27.00) |
115.95 |
|
|
FIXED ASSETS |
% |
2.03 |
(10.28) |
|
|
TOTAL ASSETS |
% |
(1.42) |
16.73 |
|
ANNUAL
GROWTH: ACCEPTABLE
An annual sales
growth is 4.96%. Turnover has increased from THB
PROFITABILITY : EXCELLENT
PROFITABILITY RATIO
|
Gross Profit
Margin |
35.66 |
Impressive |
Industrial Average |
10.13 |
|
Net Profit Margin |
13.68 |
Impressive |
Industrial Average |
0.86 |
|
Return on Assets |
14.34 |
Impressive |
Industrial Average |
2.25 |
|
Return on Equity |
27.26 |
Impressive |
Industrial Average |
6.65 |
Gross Profit Margin
used to assess a firm's financial health by revealing the proportion of money
left over from revenues after accounting for the cost of goods sold. Gross
profit margin serves as the source for paying additional expenses and future
savings. The company’s figure is
35.66%. When compared with the industry average, the ratio of the
company was higher, indicated that company was more profitable than the same
industry.
Net Profit Margin
is the indicator of the company's efficiency in that net profit takes into consideration
all expenses of the company. A low profit margin indicates a low margin of
safety, higher risk that a decline in sales will erase profits and result in a
net loss. The company’s figure is
13.68%, higher figure when compared with those of its average
competitors in the same industry, indicated that business was an efficient
operator in a dominant position within
its industry.
Return on Assets
measures how efficiently profits are being generated from the assets employed
in the business when compared with the ratios of firms in a similar business. A
low ratio in comparison with industry averages indicates an inefficient use of
business assets. Return on Assets ratio is 14.34%, higher figure when compared
with those of its average competitors in the same industry, indicated that
business was an efficient profit in a
dominant position within its industry.
Return on Equity
indicates how profitable a company is by comparing its net income to its
average shareholders' equity, ROE measures how much the shareholders earned for
their investment in the company. Return on Equity ratio is 27.26%, higher
figure when compared with those of its average competitors in the same
industry, indicated that business was an efficient profit in a dominant position within its industry.
Trend of the average competitors in the same
industry for last 5 years
Return on Assets Downtrend
Return on Equity Downtrend
LIQUIDITY : RISKY
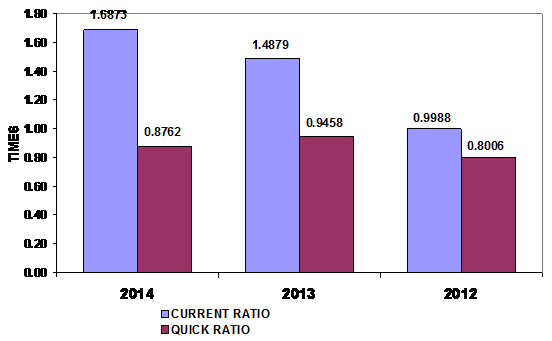
LIQUIDITY RATIO
|
Current Ratio |
1.69 |
Satisfactory |
Industrial Average |
1.73 |
|
Quick Ratio |
0.88 |
|
|
|
|
Cash Conversion
Cycle |
281.36 |
|
|
|
The Current Ratio is
to ascertain whether a company's short-term assets are readily available to pay
off its short-term liabilities. The company's figure is 1.69 times in 2014,
increased from 1.49 times, then it is generally considered to have good
short-term financial strength. When compared with the industry average, the
ratio of the company was lower.
The Quick Ratio is
a liquidity indicator that further refines the current ratio by measuring the
amount of the most liquid current assets there are to cover current liabilities.
The company's figure is 0.88 times in 2014, decreased from 0.95 times, by
excluding inventory, the company may have problems meeting current liabilities.
The Cash Conversion
Cycle measures the number of days a company's cash is tied up in the production
and sales process of its operations and the benefit from payment terms from its
creditors. It meant the company could survive when no cash inflow was received
from sale for 282 days.
Trend of the average competitors in the same
industry for last 5 years
Current Ratio Uptrend
LEVERAGE : EXCELLENT
LEVERAGE RATIO
|
Debt Ratio |
0.47 |
Impressive |
Industrial Average |
0.62 |
|
Debt to Equity
Ratio |
0.90 |
Impressive |
Industrial Average |
1.62 |
|
Times Interest
Earned |
15.09 |
Impressive |
Industrial Average |
- |
Debt to Equity Ratio
a measurement of how much suppliers, lenders, creditors and obligors have
committed to the company versus what the shareholders have committed. A lower
the percentage means that the company is using less leverage and has a stronger
equity position.
Times Interest
Earned measuring a company's ability to meet its debt obligations. Ratio is
15.1 higher than 1, so the company can pay interest expenses on outstanding
debt.
Debt Ratio shows
the proportion of a company's assets which are financed through debt. The
company's figure is 0.47 less than 0.5, most of the company's assets are
financed through equity.
Trend of the average competitors in the same
industry for last 5 years
Debt Ratio Downtrend
Times Interest
Earned Stable
ACTIVITY : ACCEPTABLE
ACTIVITY RATIO
|
Fixed Assets
Turnover |
4.42 |
Impressive |
Industrial Average |
- |
|
Total Assets
Turnover |
1.05 |
Deteriorated |
Industrial Average |
2.63 |
|
Inventory Conversion
Period |
195.41 |
|
|
|
|
Inventory
Turnover |
1.87 |
Acceptable |
Industrial Average |
3.41 |
|
Receivables
Conversion Period |
128.12 |
|
|
|
|
Receivables
Turnover |
2.85 |
Acceptable |
Industrial Average |
5.19 |
|
Payables Conversion
Period |
42.17 |
|
|
|
The company's
Account Receivable Ratio is calculated as 2.85 and
Inventory Turnover
in Days Ratio indicates the liquidity of inventory. It estimates the number of
days that it will take to sell the current inventory. Inventory is particularly
sensitive to change in business activities. The inventory turnover in days has
increased from 172 days at the end of 2013 to 195 days at the end of 2014. This
represents a negative trend. And Inventory turnover has decreased from 2.12
times in year 2013 to 1.87 times in year 2014.
The company's Total
Asset Turnover is calculated as 1.05 times and 0.98 times in 2014 and 2013
respectively. This ratio is determined by dividing total assets into total
sales turnover. The ratio measures the activity of the assets and the ability
of the firm to generate sales through the use of the assets.
Trend of the average competitors in the same
industry for last 5 years
Fixed Assets
Turnover Stable
Total Assets
Turnover Downtrend
Inventory Turnover Downtrend
Receivables Turnover Downtrend
FOREIGN EXCHANGE RATES
|
Currency |
Unit
|
Indian Rupees |
|
US Dollar |
1 |
Rs.63.93 |
|
|
1 |
Rs.99.82 |
|
Euro |
1 |
Rs.70.05 |
INFORMATION DETAILS
|
Analysis Done by
: |
DIV |
|
|
|
|
Report Prepared
by : |
NIT |
RATING EXPLANATIONS
|
RATING |
STATUS |
PROPOSED CREDIT LINE |
|
|
|
>86 |
Aaa |
Possesses an extremely sound financial base with the strongest
capability for timely payment of interest and principal sums |
Unlimited |
|
|
71-85 |
Aa |
Possesses adequate working capital. No caution needed for credit
transaction. It has above average (strong) capability for payment of interest
and principal sums |
Large |
|
|
56-70 |
A |
Financial & operational base are regarded healthy. General unfavourable
factors will not cause fatal effect. Satisfactory capability for payment of
interest and principal sums |
Fairly Large |
|
|
41-55 |
Ba |
Overall operation is considered normal. Capable to meet normal
commitments. |
Satisfactory |
|
|
26-40 |
B |
Capability to overcome financial difficulties seems comparatively
below average. |
Small |
|
|
11-25 |
Ca |
Adverse factors are apparent. Repayment of interest and principal sums
in default or expected to be in default upon maturity |
Limited with
full security |
|
|
<10 |
C |
Absolute credit risk exists. Caution needed to be exercised |
Credit not
recommended |
|
|
-- |
NB |
New Business |
-- |
|
This score serves as a reference to assess SC’s
credit risk and to set the amount of credit to be extended. It is calculated
from a composite of weighted scores obtained from each of the major sections of
this report. The assessed factors and their relative weights (as indicated
through %) are as follows:
Financial
condition (40%) Ownership
background (20%) Payment
record (10%)
Credit history
(10%) Market trend (10%) Operational size
(10%)
This report is issued at your request without any
risk and responsibility on the part of MIRA INFORM PRIVATE LIMITED (MIPL)
or its officials.