MIRA INFORM REPORT
|
Report No. : |
334911 |
|
Report Date : |
07.08.2015 |
IDENTIFICATION DETAILS
|
Name : |
ASERPAL SA |
|
|
|
|
Registered Office : |
Ctra Nacional 634, Km 679,900 , Sesmonde - Vilasantar - 15807 - La Coruña |
|
|
|
|
Country : |
Spain |
|
|
|
|
Financials (as on) : |
2013 |
|
|
|
|
Date of Incorporation : |
02.05.1989 |
|
|
|
|
Legal Form : |
Public Company |
|
|
|
|
Line of Business : |
Manufacture of veneer sheets and wood-based panels |
|
|
|
|
No. of Employees : |
Not Available |
RATING & COMMENTS
|
MIRA’s Rating : |
B |
|
RATING |
STATUS |
PROPOSED CREDIT LINE |
|
|
26-40 |
B |
Capability to overcome financial difficulties seems comparatively
below average. |
Small |
|
Status : |
Moderate |
|
|
|
|
Payment Behaviour : |
Slow |
|
|
|
|
Litigation : |
Clear |
NOTES:
Any query related to this report can be made
on e-mail: infodept@mirainform.com
while quoting report number, name and date.
ECGC Country Risk Classification List – March 31, 2015
|
Country Name |
Previous Rating (31.12.2014) |
Current Rating (31.03.2015) |
|
Spain |
A1 |
A1 |
|
Risk Category |
ECGC
Classification |
|
Insignificant |
A1 |
|
Low |
A2 |
|
Moderate |
B1 |
|
High |
B2 |
|
Very High |
C1 |
|
Restricted |
C2 |
|
Off-credit |
D |
SPAIN - ECONOMIC OVERVIEW
After experiencing a prolonged recession in the wake of the global financial crisis, in 2014 Spain marked the first full year of economic growth in seven years, with growth of 1.4%. At the onset of the global financial crisis Spain's GDP contracted by 3.7% in 2009, ending a 16-year growth trend, and continued contracting through most of 2013. Credit contraction in the private sector, fiscal austerity, and high unemployment continue to weigh on domestic consumption and investment. Exports were resilient throughout the economic downturn and helped to bring Spain's current account into surplus in 2013 for the first time since 1986, where it remained in 2014. The unemployment rate rose from a low of about 8% in 2007 to more than 26% in 2013, closing 2014 at 23.7%. This has strained Spain's public finances as spending on social benefits increased while tax revenues fell. Spain’s budget deficit peaked at 11.4% of GDP in 2010. Spain gradually reduced the deficit to just under 7% of GDP in 2013-14, slightly above the 6.5% target negotiated between Spain and the EU. Public debt has increased substantially – from 60.1% of GDP in 2010 to more than 97% in 2014. Rising labor productivity and an internal devaluation resulting from moderating labor costs and lower inflation have helped to improve foreign investor interest in the economy and positive FDI flows have been restored.
The government's efforts to implement labor, pension, health, tax, and education reforms, aimed at supporting investor sentiment, have become overshadowed by political activity in 2015 in anticipation of national parliamentary elections late in the year. In 2013 the government successfully shored up struggling banks - exposed to the collapse of Spain's depressed real estate and construction sectors, completing an EU-funded restructuring and recapitalization program in January 2014. Recently increased private consumption helped bring real GDP growth back into positive territory at 1.4% in 2014, and labor reforms prompted a modest reduction in the unemployment rate, from more than 26% in 2013 to 23.7% in 2014. Despite the uptic in economic activity, inflation dropped sharply, from 1.5% in 2013 to flat in 2014. Spain’s 2015 budget, published in September 2014, rolls back some recently imposed taxes in advance of national elections in November 2015 and leaves untouched the country’s value-added tax (VAT) regime, which continues to generate significantly lower revenue than the EU average. Spain’s borrowing costs are dramatically lower since their peak in mid-2012.
|
Source
: CIA |
EXECUTIVE
SUMMARY
|
Name: |
ASERPAL
SA |
|
NIF
/ Fiscal code: |
A15166630 |
|
Status: |
ACTIVE |
|
Incorporation
Date: |
02/05/1989 |
|
Register Data |
Register
Section 8 Sheet 8961 |
|
Last Publication in BORME: |
03/06/2015
[Appointments] |
|
Last
Published Account Deposit: |
2013 |
|
Share
Capital: |
2.406.000 |
|
|
|
|
Localization: |
CTRA
NACIONAL 634, KM 679,900 , SESMONDE - VILASANTAR - 15807 - LA CORUÑA |
|
Telephone
- Fax - Email - Website: |
Telephone.
981 786 611 Email. losan@losan.es Website. www.losan.es |
|
|
|
|
Activity: |
|
|
NACE: |
1621
- Manufacture of veneer sheets and wood-based panels |
|
Registered
Trademarks: |
|
|
Audited
/ Opinion: |
Si
/ |
|
Tenders
and Awards: |
|
|
Subsidies: |
28
for a total cost of 1028247.8200000002 |
|
Quality
Certificate: |
No |
|
|
|
|
Scoring and Risk: |
|
|
Payment
Behaviour: |
According
to the agreed terms |
|
Prospects: |
Consolidation |
|
Industry
situation: |
Maturity |
|
|
|
|
Defaults, Legal Claims and
Insolvency Proceedings : |
|
|
|
|
|
|
Number |
Amount
(€) |
Most
Recent Entry |
|
Insolvency
Proceedings, Bankruptcy and Suspension of Payments |
Unpublished |
--- |
--- |
|
Defaults
on debt with Financial Institutions and Large Companies |
None |
--- |
--- |
|
Judicial
Claims (Notices, Executive Proceedings, Attachments, Auctions, Bad Debt) |
None |
0 |
--- |
|
Proceedings
heard by the Civil Court |
Unpublished |
0 |
--- |
|
Proceedings
heard by the Labour Court |
Unpublished |
0 |
--- |
|
|
|
Partners: |
|
|
|
INDUSTRIAS
LOSAN SA |
|
|
|
Shares: |
5 |
|
|
Other
Links: |
6 |
|
|
No.
of Active Corporate Bodies: |
|
|
|
Ratios |
2013 |
2012 |
Change |
|
|
|
|
|
Guarantees: |
|
|
Properties
Registered: |
Company
NO, Administrator NO |
|
Financing
/ Guarantee Sources : |
Sources
YES, Guarantees YES |
|
|
|
|
|
|
|
INVESTIGATION
SUMMARY |
|
|
This
partnership was registered a few years ago, which provides it enough
experience in its sector and whose activity enjoys great prestige among the information
sources checked. The billing increased 9,14% in 2013 as compared to the
previous year. It shows a negative working capital; therefore the partnership
would not meet the short-term payment commitments. |
|
Enquiry
Details
|
Business address regime: |
Propiedad |
Identification
|
Social Denomination: |
ASERPAL SA |
|
NIF / Fiscal code: |
A15166630 |
|
Corporate Status: |
ACTIVE |
|
Start of activity: |
1989 |
|
Registered Office: |
CTRA NACIONAL 634, KM 679,900
, SESMONDE |
|
Locality: |
VILASANTAR |
|
Province: |
LA CORUÑA |
|
Postal Code: |
15807 |
|
Telephone: |
981 786 611 |
|
Fax: |
981 786 600 |
|
Website: |
www.losan.es |
|
Email: |
losan@losan.es |
Branch Offices
Activity
|
NACE: |
1621 |
|
Legal Form: |
REPAIR, MAINTENANCE AND PRESERVATION OF EQUIPMENT AND FACILITIES OF CO-GENERATION, COMBINED CICLE AND BIOMASS POWER PLANTS. |
|
Additional Information: |
Engaged in cutting and joining sheet metal, sheet wood and dyed, is part of Grupo LOSAN |
|
Additional Address: |
CTRA NACIONAL 634, KM 679,900 , SESMONDE 15807 VILASANTAR ( LA CORUÑA ), Registered office and offices |
|
Import / export: |
IMPORTS / EXPORTS |
|
Future Perspective: |
Consolidation |
|
Industry situation: |
Maturity |
Chronological
Summary
|
Year |
Act |
|
1990 |
Accounts deposit (year 1989) |
|
1991 |
Accounts deposit (year 1990) |
|
1992 |
Accounts deposit (year 1991) Appointments/ Re-elections (3) Dividends
Payment (1) Statutory Modifications (1) |
|
1993 |
Accounts deposit (year 1992) Adaptation to Law (1) |
|
1994 |
Accounts deposit (year 1993) Appointments/ Re-elections (2)
Cessations/ Resignations/ Reversals (1) |
|
1995 |
Accounts deposit (year 1994) Appointments/ Re-elections (1) Dividends Payment
(1) Statutory Modifications (1) |
|
1996 |
Accounts deposit (year 1995) |
|
1997 |
Appointments/ Re-elections (3) Cessations/ Resignations/ Reversals (1)
Increase of Capital (1) Statutory Modifications (1) |
|
1998 |
Accounts deposit (year 1996, 1997) Appointments/ Re-elections (1) |
|
1999 |
Accounts deposit (year 1998) Appointments/ Re-elections (2)
Cessations/ Resignations/ Reversals (1) |
|
2000 |
Accounts deposit (year 1999) Increase of Capital (1) Statutory Modifications
(1) |
|
2001 |
Accounts deposit (year 2000) Appointments/ Re-elections (1) Increase
of Capital (2) Statutory Modifications (1) |
|
2002 |
Accounts deposit (year 2001) Appointments/ Re-elections (1) Partial
split (1) |
|
2003 |
Accounts deposit (year 2002) Appointments/ Re-elections (2)
Cessations/ Resignations/ Reversals (2) Other Concepts/ Events (1) Statutory
Modifications (1) |
|
2004 |
Accounts deposit (year 2003) Appointments/ Re-elections (1) |
|
2005 |
Accounts deposit (year 2004) Appointments/ Re-elections (1) |
|
2006 |
Accounts deposit (year 2005) |
|
2007 |
Accounts deposit (year 2006) Appointments/ Re-elections (2)
Cessations/ Resignations/ Reversals (1) Statutory Modifications (1) |
|
2008 |
Accounts deposit (year 2007) Appointments/ Re-elections (2) |
|
2009 |
Accounts deposit (year 2008) Change of Social address (1) Other
Concepts/ Events (1) |
|
2010 |
Accounts deposit (year 2009) |
|
2011 |
Appointments/ Re-elections (1) Change of Social Purpose (1) Statutory
Modifications (1) |
|
2012 |
Accounts deposit (year 2010, 2011) Appointments/ Re-elections (2) |
|
2013 |
Accounts deposit (year 2012) Appointments/ Re-elections (1) |
|
2014 |
Accounts deposit (year 2013) Appointments/ Re-elections (3) |
|
2015 |
Appointments/ Re-elections (1) |
Breakdown
of Owners' Equity
|
Registered Capital: |
2.406.000 |
|
Paid up capital: |
2.406.000 |
Updated
Evolution of the Subscribed and Paid-in Capital
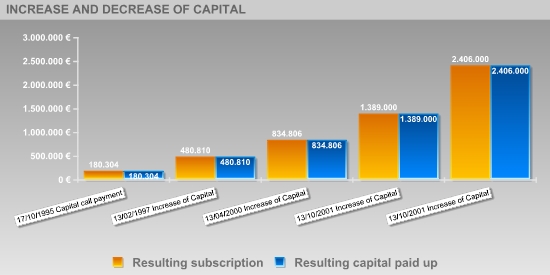
|
Publishing Date |
Registration Type |
Capital Subscribed |
Paid up capital |
Underwritten result |
Disbursed Result |
|
28/04/1992 |
Capital call payment |
--- |
45.076 |
180.304 |
90.152 |
|
17/10/1995 |
Capital call payment |
--- |
90.152 |
180.304 |
180.304 |
|
13/02/1997 |
Increase of Capital |
300.506 |
300.506 |
480.810 |
480.810 |
|
13/04/2000 |
Increase of Capital |
353.996 |
353.996 |
834.806 |
834.806 |
|
13/10/2001 |
Increase of Capital |
554.197 |
554.197 |
1.389.000 |
1.389.000 |
|
13/10/2001 |
Increase of Capital |
1.017.000 |
1.017.000 |
2.406.000 |
2.406.000 |
Active
Social Bodies
|
Post published |
Social Body's Name |
Appointment Date |
Other Positions in this Company |
|
PRESIDENT |
LOPEZ SANCHEZ EMILIO |
29/10/2014 |
10 |
|
VICE CHAIRMAN |
LOPEZ SANCHEZ LUIS |
29/10/2014 |
11 |
|
MEMBER OF THE BOARD |
LOPEZ SANCHEZ EMILIO |
29/10/2014 |
10 |
|
|
LOPEZ SANCHEZ LUIS |
29/10/2014 |
11 |
|
|
LOPEZ FERNANDEZ MANUEL ESTEBAN |
29/10/2014 |
6 |
|
|
LOPEZ FERNANDEZ ESTEBAN |
05/11/2007 |
2 |
|
COMBINED PROXY |
MENDEZ LINARES SANTIAGO |
10/04/2014 |
7 |
|
|
IGLESIAS DIAZ MANUEL |
10/04/2014 |
5 |
|
|
IGLESIAS PEDREIRA MARIA JESUS |
10/04/2014 |
1 |
|
|
VAZQUEZ ESTRAVIZ CELESTINO |
10/04/2014 |
10 |
|
|
DE ARTAZA VARASA ALBERTO |
10/04/2014 |
2 |
|
JOINT ATTORNEY |
LOPEZ PENA ALFONSO MANUEL |
26/05/2015 |
4 |
|
|
LAZARO ALCANTARA JOSE LUIS |
26/05/2015 |
1 |
|
|
VAZQUEZ ESTRAVIZ CELESTINO |
26/05/2015 |
10 |
|
PROXY |
SILVA MUÑIZ IVAN |
04/05/2012 |
1 |
|
|
LOPEZ RICO LUIS |
25/06/2002 |
1 |
|
|
MENDEZ LINARES SANTIAGO |
13/11/1999 |
7 |
|
|
SANCHEZ CASTELO LUIS |
05/11/1992 |
1 |
|
SECRETARY |
PASCUAL DE MIGUEL JULIO |
05/11/2007 |
2 |
|
VICE SECRETARY |
LOPEZ FERNANDEZ MANUEL ESTEBAN |
29/10/2014 |
6 |
|
|
LOPEZ FERNANDEZ ESTEBAN |
05/11/2007 |
2 |
|
ACCOUNTS' AUDITOR / HOLDER |
AUDITORIA Y DIAGNOSTICO EMPRESARIAL SA |
17/06/2014 |
5 |
Historical
Social Bodies
|
Social Body's Name |
Post published |
End Date |
Other Positions in this Company |
|
ARTAZA VARASA ALBERTO |
PROXY |
04/06/2012 |
1 |
|
AUDITORIA DIAGNOSTICO EMPRESARIAL SA |
ACCOUNTS' AUDITOR / HOLDER |
30/07/1997 |
2 |
|
|
ACCOUNTS' AUDITOR / HOLDER |
19/01/1998 |
|
|
AUDITORIA Y DIAGNOSTICO EMPRESARIAL SA |
ACCOUNTS' AUDITOR / HOLDER |
29/09/2008 |
5 |
|
|
ACCOUNTS' AUDITOR / HOLDER |
23/11/2011 |
|
|
|
ACCOUNTS' AUDITOR / HOLDER |
10/08/2004 |
|
|
|
ACCOUNTS' AUDITOR / HOLDER |
17/06/2014 |
|
|
AUREN AUDITORIA Y DIAGNOSTICO EMPRESARIAL SA |
ACCOUNTS' AUDITOR / HOLDER |
14/03/2001 |
2 |
|
|
ACCOUNTS' AUDITOR / HOLDER |
13/08/2003 |
|
|
AUREN AUDITORIA Y DIAGNOSTICO EMPRESARIAL SL |
ACCOUNTS' AUDITOR / HOLDER |
11/08/2005 |
1 |
|
DE ARTAZA VARASA ALBERTO |
JOINT ATTORNEY/COMBINED PROXY |
10/04/2014 |
2 |
|
IGLESIAS DIAZ MANUEL |
JOINT ATTORNEY |
13/11/1999 |
5 |
|
|
COMBINED PROXY |
21/10/1997 |
|
|
|
PROXY |
04/06/2012 |
|
|
|
COMBINED PROXY |
10/04/2014 |
|
|
LOPEZ FERNANDEZ MANUEL ESTEBAN |
VICE SECRETARY |
20/06/2013 |
6 |
|
|
MEMBER OF THE BOARD |
20/06/2013 |
|
|
|
MEMBER OF THE BOARD |
29/10/2014 |
|
|
|
VICE SECRETARY |
29/10/2014 |
|
|
LOPEZ PENA ALFONSO MANUEL |
COMBINED PROXY |
10/04/2014 |
4 |
|
|
COMBINED PROXY |
26/05/2015 |
|
|
|
PROXY |
04/06/2012 |
|
|
LOPEZ SANCHEZ EMILIO |
VICE SECRETARY |
05/11/2007 |
10 |
|
|
JOINT MANAGER |
25/06/1999 |
|
|
|
JOINT MANAGER |
13/08/2003 |
|
|
|
ADMINISTRATOR |
17/08/1994 |
|
|
|
PRESIDENT |
29/10/2014 |
|
|
|
MEMBER OF THE BOARD |
29/10/2014 |
|
|
|
MEMBER OF THE BOARD |
29/09/2008 |
|
|
|
PRESIDENT |
29/09/2008 |
|
|
LOPEZ SANCHEZ LUIS |
MEMBER OF THE BOARD |
29/10/2014 |
11 |
|
|
ADMINISTRATOR |
17/08/1994 |
|
|
|
JOINT MANAGER |
25/06/1999 |
|
|
|
JOINT MANAGER |
13/08/2003 |
|
|
|
VICE CHAIRMAN |
05/11/2007 |
|
|
|
MEMBER OF THE BOARD |
05/11/2007 |
|
|
|
MEMBER OF THE BOARD |
29/09/2008 |
|
|
|
VICE CHAIRMAN |
29/09/2008 |
|
|
|
VICE CHAIRMAN |
29/10/2014 |
|
|
LOPEZ SANCHEZ MANUEL |
JOINT MANAGER |
25/06/1999 |
5 |
|
|
JOINT MANAGER |
13/08/2003 |
|
|
|
ADMINISTRATOR |
17/08/1994 |
|
|
|
MEMBER OF THE BOARD |
05/11/2007 |
|
|
|
PRESIDENT |
05/11/2007 |
|
|
MEIJIDE RICO ANGEL |
COMBINED PROXY |
13/02/1995 |
6 |
|
|
COMBINED PROXY |
21/10/1997 |
|
|
|
JOINT ATTORNEY |
01/07/2003 |
|
|
|
COMBINED PROXY |
01/07/2003 |
|
|
|
JOINT ATTORNEY/COMBINED PROXY |
01/07/2003 |
|
|
|
JOINT ATTORNEY |
13/11/1999 |
|
|
MENDEZ LINARES SANTIAGO |
COMBINED PROXY |
21/10/1997 |
7 |
|
|
COMBINED PROXY |
13/02/1995 |
|
|
|
JOINT ATTORNEY |
13/11/1999 |
|
|
|
COMBINED PROXY |
04/06/2012 |
|
|
|
COMBINED PROXY |
10/04/2014 |
|
|
PASCUAL DE MIGUEL JULIO |
SECRETARY |
05/11/2007 |
2 |
|
VAZQUEZ ESTRAVIZ CELESTINO |
JOINT ATTORNEY |
13/02/1995 |
10 |
|
|
COMBINED PROXY |
13/02/1995 |
|
|
|
COMBINED PROXY |
21/10/1997 |
|
|
|
JOINT ATTORNEY |
21/10/1997 |
|
|
|
JOINT ATTORNEY |
26/05/2015 |
|
|
|
COMBINED PROXY |
10/04/2014 |
|
|
|
PROXY |
04/06/2012 |
|
|
|
COMBINED PROXY |
13/11/1999 |
|
Executive
board
|
Post |
NIF |
Name |
|
FINANCIAL DIRECTOR |
|
DOLORES SANCHEZ |
Defaults,
Legal Claims and Insolvency Proceedings
Section enabling assessment of the degree of compliance of the company queried with its payment obligations. It provides information on the existence and nature of all stages of Insolvency and Legal Proceedings published with reference to the Company in the country's various Official Bulletins and national newspapers, as well Defaults Registered in the main national credit bureaus (ASNEF Industrial and RAI ).
> Summary
Chronological summary
|
|
|
Number
of Publications |
Amount
(_) |
Start
date |
End
date |
|
Insolvency
Proceedings, Bankruptcy and Suspension of Payments |
|
Unpublished |
--- |
--- |
--- |
|
Request/Declaration |
|
0 |
--- |
date |
|
|
Proceedings |
|
--- |
--- |
|
--- |
|
Resolution |
|
--- |
--- |
|
--- |
|
Defaults
on debt with Financial Institutions and Large Companies |
Bank
and Commercial Delinquency |
None |
0 |
|
|
|
Status:
Friendly |
|
--- |
|
|
|
|
Status:
Pre-Litigation |
|
--- |
|
|
|
|
Status:
Litigation |
|
--- |
|
|
|
|
Status:
Non-performing |
|
--- |
|
|
|
|
Status:
insolvency proceedings, bankruptcy and suspension of payments |
|
--- |
|
|
|
|
Other
status |
|
--- |
|
|
|
|
Legal
and Administrative Proceedings |
|
Unpublished |
--- |
|
|
|
Notices
of defaults and enforcement |
|
--- |
--- |
|
--- |
|
Seizures |
|
--- |
--- |
|
--- |
|
Auctions |
|
--- |
--- |
|
--- |
|
Declarations
of insolvency and bad debt |
|
--- |
--- |
|
--- |
|
Proceedings
heard by the Civil Court |
|
Unpublished |
--- |
|
|
|
Proceedings
heard by the Labour Court |
|
Unpublished |
--- |
|
|
>
Details
> Basis for scoring
|
Positive Factors |
Adverse Factors |
|
|
ASERPAL SA it presents an excessive indebtedness that may compromise their balance sheet. It does not have any economic profitability.. It has no return from the necessary investments in the development of its main activity in comparison with its assets. It does not have any financial profitability.. ASERPAL SAIt does not obtain any financial return as a consequence of an investment in its own resources which, a priori, might deteriorate its financial and economic situation. ASERPAL SA 's Working Capital is negative, which means, in principle, that its capacity to pay debts maturing within a year using its resources available in the short run is insufficient. ASERPAL SA presents a low turnover of the current assets , which could indicate an inefficient use of non-current assets due to the lacking of enough operating income capacity based on the dedicated assets available for sale. |
Probability
of default
> Estimated Probability of Default for the next 12 months: 9.005 %
|
Sector in which comparison is carried out: 162 Manufacture of products of wood, cork, straw and plaiting materials |
|
|
Relative Position:
|
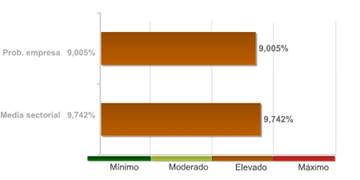
The company's comparative analysis with the rest of the companies that comprise the sector, shows the company holds a better position with regard to the probability of non-compliance.
The probability of the company's non-compliance with its payment obligations within deadlines estimated by our qualifications models is 9.005%.
In the event they fail to comply with the payment, the seriousness of the loss will depend on factors such as the promptness of the commencement of the charging management, the existence of executive documents which match the credit or the existence of guarantees and free debt assets under the name of the debtor. Therefore, the probability of non-compliance should not be solely interpreted as the total loss of the owed amount.
LEGAL
CLAIMS
|
Summary
of Judicial Claims |
|
|
|
|
|
|
|
|
||
|
|
|
No
se han publicado |
|
|
|
|
No
se han publicado |
|
|
|
|
||
|
|
|
No
se han publicado |
|
|
|
|
No
se han publicado |
|
|
|
|
No
se han publicado |
|
|
|
|
No
se han publicado |
|
|
|
|
||
|
|
|
No
se han publicado |
|
|
|
|
No
se han publicado |
|
|
|
|
||
|
|
|
No
se han publicado |
|
References
Link
List
|
IS RELATED WITH: |
6 Entities |
|
PARTICIPATES IN: |
5 Entities |
|
SHAREHOLDERS: |
1 Entities |
> Shareholders
|
Relationship |
Entity |
Province |
Shareholding stake |
|
SHAREHOLDERS |
INDUSTRIAS LOSAN SA |
LA CORUÑA |
|
|
PARTICIPATES IN |
COMPAÑIA ENERGETICA PARA EL
TABLERO SA |
LA CORUÑA |
0.5 |
|
|
LOSAN ROMANIA, SOCIEDAD
LIMITADA, (RUMANIA) |
|
84.34 |
|
|
INVERSIONES LOSAN CHILE
LTDA |
|
99 |
|
|
ASERPAL LAMIANAS FAQUEADAS
LTDA (BRASIL) |
|
99.99 |
|
|
OAK HILL VENEERS INC
(EEUU) |
|
100 |
> Other relationships
|
Relationship |
Entity |
Province |
Shareholding stake |
|
IS RELATED WITH |
| | |
|
|
|
|
COMETA SA |
ZARAGOZA |
|
|
|
AGRONOVA SA |
MADRID |
|
|
|
SOCIEDAD COLECTIVA
AGROHIDROSISTEM |
|
|
|
|
PINA SA |
LA CORUÑA |
|
|
IS RELATED WITH |
INDUSTRIAS LOSAN SA |
LA CORUÑA |
|
|
|
LOSAN GESTION INTEGRAL SL |
LA CORUÑA |
|
Turnover
|
Total Sales 2014 |
12.995.000 |
The sales data is from the latest
available financial statements. Failing that, are estimates data calculated by
statistical methods.
Financial
Accounts and Balance Sheets
Financial Years
Presented
|
Ejercicio |
Tipo
de Cuentas Anuales |
Fecha
Presentacion |
|
2013 |
Normales |
October
2014 |
|
2012 |
Normales |
June
2013 |
|
2011 |
Normales |
November
2012 |
|
2010 |
Normales |
February
2012 |
|
2009 |
Normales |
November
2010 |
|
2008 |
Normales |
October
2009 |
|
2007 |
Normales |
October
2008 |
|
2006 |
Normales |
September
2007 |
|
2005 |
Normales |
September
2006 |
|
2004 |
Normales |
August
2005 |
|
2003 |
Normales |
August
2004 |
|
2002 |
Normales |
August
2003 |
|
2001 |
Normales |
August
2002 |
|
2000 |
Normales |
August
2001 |
|
1999 |
Normales |
July
2000 |
|
1998 |
Normales |
July
1999 |
|
1997 |
Normales |
July
1998 |
|
1996 |
Normales |
July
1997 |
|
1995 |
Normales |
July
1996 |
|
1994 |
Normales |
July
1995 |
|
1993 |
Normales |
September
1994 |
|
1992 |
Normales |
July
1993 |
|
1991 |
Normales |
July
1992 |
|
1990 |
Normales |
July
1991 |
|
1989 |
Normales |
July
1990 |
The data in the report regarding the last Company Accounts submitted by the company is taken from the TRADE REGISTER serving the region in which the company's address is located 31/12/2013
> Normal format Balance in accordance with the New Accounting Plan 2007
Information
corresponding to the fiscal year
2013 2012 2011 2010 2009 is taken from information
submitted to the TRADE REGISTER. Data corresponding to fiscal years before
2013 2012 2011 2010 2009 has been compiled based on
the equivalence criteria stipulated in Act JUS/206/2009. Where the provisions
of the Act did not establish relevant equivalence criteria. To view details on
the methodology.
|
|
ORIGINAL |
ORIGINAL |
ORIGINAL |
ORIGINAL |
ORIGINAL |
|
|
Assets |
2013 |
2012 |
2011 |
2010 |
2009 |
|
|
A)
NON-CURRENT ASSETS: 11000 |
33.498.377,00 |
29.223.100,00 |
29.405.643,00 |
31.446.574,00 |
30.458.732,00 |
|
|
I. Intangible fixed assets : 11100 |
2.513.980,00 |
2.660.834,00 |
3.268.649,00 |
3.219.472,00 |
1.918.905,00 |
|
|
1. Development: 11110 |
2.221.261,00 |
2.347.067,00 |
2.933.834,00 |
2.885.402,00 |
1.816.867,00 |
|
|
2. Concessions: 11120 |
250.038,00 |
250.038,00 |
250.038,00 |
250.038,00 |
0,00 |
|
|
3. Patents, licencing, trade marks and
similar: 11130 |
0,00 |
0,00 |
0,00 |
0,00 |
0,00 |
|
|
4. Goodwill: 11140 |
0,00 |
0,00 |
0,00 |
0,00 |
0,00 |
|
|
5. IT applications: 11150 |
42.681,00 |
63.729,00 |
84.776,00 |
84.032,00 |
102.038,00 |
|
|
6. Investigation: 11160 |
0,00 |
0,00 |
0,00 |
0,00 |
0,00 |
|
|
7. Intellectual property: 11180 |
0,00 |
0,00 |
0,00 |
0,00 |
0,00 |
|
|
8. Greenhouse gas emission allowance:
11190 |
0,00 |
0,00 |
0,00 |
0,00 |
0,00 |
|
|
9. Other intangible fixed assets. :
11170 |
0,00 |
0,00 |
0,00 |
0,00 |
0,00 |
|
|
II. Tangible fixed assets : 11200 |
5.178.075,00 |
5.165.805,00 |
4.861.862,00 |
4.783.571,00 |
5.481.482,00 |
|
|
1. Land and buildings: 11210 |
1.479.886,00 |
1.467.564,00 |
1.518.426,00 |
1.579.861,00 |
1.641.296,00 |
|
|
2. Technical installations and other
tangible fixed assets: 11220 |
3.276.081,00 |
3.658.268,00 |
2.851.151,00 |
3.203.709,00 |
3.025.904,00 |
|
|
3. Tangible asset in progress and
advances: 11230 |
422.109,00 |
39.973,00 |
492.285,00 |
0,00 |
814.282,00 |
|
|
III. Real estate investment: 11300 |
0,00 |
0,00 |
0,00 |
0,00 |
0,00 |
|
|
1. Land: 11310 |
0,00 |
0,00 |
0,00 |
0,00 |
0,00 |
|
|
2. Buildings: 11320 |
0,00 |
0,00 |
0,00 |
0,00 |
0,00 |
|
|
IV. Long-term investments in Group companies and associates :
11400 |
24.551.947,00 |
20.207.189,00 |
20.233.020,00 |
22.498.265,00 |
22.335.375,00 |
|
|
1. Equity instruments: 11410 |
22.932.391,00 |
17.806.398,00 |
17.806.398,00 |
20.113.954,00 |
20.113.954,00 |
|
|
2. Credits to businesses: 11420 |
1.619.555,00 |
2.400.790,00 |
2.426.621,00 |
2.384.311,00 |
2.221.421,00 |
|
|
3. Debt securities: 11430 |
0,00 |
0,00 |
0,00 |
0,00 |
0,00 |
|
|
4. Derivatives : 11440 |
0,00 |
0,00 |
0,00 |
0,00 |
0,00 |
|
|
5. Other financial assets : 11450 |
0,00 |
0,00 |
0,00 |
0,00 |
0,00 |
|
|
6. Other investments: 11460 |
0,00 |
0,00 |
0,00 |
0,00 |
0,00 |
|
|
V. Long-term financial investments: 11500 |
165.349,00 |
161.576,00 |
18.123,00 |
39.149,00 |
39.149,00 |
|
|
1. Equity instruments: 11510 |
10.925,00 |
7.152,00 |
13.699,00 |
34.725,00 |
34.725,00 |
|
|
2. Credits to third parties : 11520 |
0,00 |
0,00 |
0,00 |
0,00 |
0,00 |
|
|
3. Debt securities: 11530 |
0,00 |
0,00 |
0,00 |
0,00 |
0,00 |
|
|
4. Derivatives : 11540 |
0,00 |
0,00 |
0,00 |
0,00 |
0,00 |
|
|
5. Other financial assets : 11550 |
154.424,00 |
154.424,00 |
4.424,00 |
4.424,00 |
4.424,00 |
|
|
6. Other investments: 11560 |
0,00 |
0,00 |
0,00 |
0,00 |
0,00 |
|
|
VI. Assets for deferred tax : 11600 |
1.089.026,00 |
1.027.696,00 |
1.023.990,00 |
906.118,00 |
683.821,00 |
|
|
VII. Non-current trade debts : 11700 |
0,00 |
0,00 |
0,00 |
0,00 |
0,00 |
|
|
B)
CURRENT ASSETS: 12000 |
10.891.649,00 |
18.653.114,00 |
16.724.471,00 |
17.432.371,00 |
10.815.645,00 |
|
|
I. Non-current assets held for sale : 12100 |
0,00 |
0,00 |
0,00 |
0,00 |
0,00 |
|
|
II. Stocks: 12200 |
4.960.595,00 |
4.802.443,00 |
3.030.746,00 |
4.420.758,00 |
4.149.852,00 |
|
|
1. Commercial: 12210 |
0,00 |
0,00 |
0,00 |
0,00 |
0,00 |
|
|
2. Primary material and other supplies:
12220 |
1.741.876,00 |
1.774.061,00 |
892.200,00 |
2.524.360,00 |
2.320.579,00 |
|
|
3. Work in progress: 12230 |
0,00 |
0,00 |
0,00 |
0,00 |
0,00 |
|
|
a) Of long-term production
cycle : 12231 |
0,00 |
0,00 |
0,00 |
0,00 |
0,00 |
|
|
b) Of short-term
production cycle : 12232 |
0,00 |
0,00 |
0,00 |
0,00 |
0,00 |
|
|
4. Finished goods: 12240 |
3.218.718,00 |
3.028.382,00 |
2.138.546,00 |
1.896.398,00 |
1.829.274,00 |
|
|
a) Of long-term
production cycle : 12241 |
0,00 |
0,00 |
0,00 |
0,00 |
0,00 |
|
|
b) Of short-term
production cycle : 12242 |
3.218.718,00 |
3.028.382,00 |
2.138.546,00 |
1.896.398,00 |
1.829.274,00 |
|
|
5. By-products, residues and recycled
materials: 12250 |
0,00 |
0,00 |
0,00 |
0,00 |
0,00 |
|
|
6. Advances to suppliers: 12260 |
0,00 |
0,00 |
0,00 |
0,00 |
0,00 |
|
|
III. Trade debtors and others receivable accounts: 12300 |
2.627.774,00 |
4.063.987,00 |
3.888.869,00 |
5.357.144,00 |
3.838.243,00 |
|
|
1. Trade debtors / accounts receivable:
12310 |
618.340,00 |
356.185,00 |
405.381,00 |
1.120.153,00 |
840.053,00 |
|
|
a) Long-term
receivables from sales and services supplied : 12311 |
0,00 |
0,00 |
0,00 |
0,00 |
0,00 |
|
|
b) Customers for
sales and provisions of services : 12312 |
618.340,00 |
356.185,00 |
405.381,00 |
1.120.153,00 |
840.053,00 |
|
|
2. Customers, Group companies and
associates : 12320 |
2.002.925,00 |
3.634.296,00 |
3.126.966,00 |
4.023.755,00 |
2.522.741,00 |
|
|
3. Other accounts receivable: 12330 |
0,00 |
14.476,00 |
2.529,00 |
6.693,00 |
0,00 |
|
|
4. Personnel: 12340 |
0,00 |
0,00 |
0,00 |
0,00 |
0,00 |
|
|
5. Assets for deferred tax: 12350 |
6.509,00 |
5.666,00 |
5.596,00 |
10.153,00 |
0,00 |
|
|
6. Other debtors, including tax and social
security: 12360 |
0,00 |
53.364,00 |
348.397,00 |
196.391,00 |
475.450,00 |
|
|
7. Called up share capital: 12370 |
0,00 |
0,00 |
0,00 |
0,00 |
0,00 |
|
|
IV. Short-term investments in Group companies and associates:
12400 |
1.760.098,00 |
8.682.024,00 |
8.772.409,00 |
5.962.398,00 |
925.392,00 |
|
|
1. Equity instruments: 12410 |
0,00 |
0,00 |
0,00 |
0,00 |
0,00 |
|
|
2. Credits to businesses: 12420 |
1.760.098,00 |
8.682.024,00 |
8.772.409,00 |
5.962.398,00 |
925.392,00 |
|
|
3. Debt securities: 12430 |
0,00 |
0,00 |
0,00 |
0,00 |
0,00 |
|
|
4. Derivatives : 12440 |
0,00 |
0,00 |
0,00 |
0,00 |
0,00 |
|
|
5. Other financial assets : 12450 |
0,00 |
0,00 |
0,00 |
0,00 |
0,00 |
|
|
6. Other investments: 12460 |
0,00 |
0,00 |
0,00 |
0,00 |
0,00 |
|
|
V. Short-term financial investments : 12500 |
859.542,00 |
882.658,00 |
657.601,00 |
0,00 |
0,00 |
|
|
1. Equity instruments: 12510 |
0,00 |
0,00 |
0,00 |
0,00 |
0,00 |
|
|
2. Credits to businesses: 12520 |
859.542,00 |
832.658,00 |
657.601,00 |
0,00 |
0,00 |
|
|
3. Debt securities: 12530 |
0,00 |
0,00 |
0,00 |
0,00 |
0,00 |
|
|
4. Derivatives : 12540 |
0,00 |
0,00 |
0,00 |
0,00 |
0,00 |
|
|
5. Other financial assets : 12550 |
0,00 |
50.000,00 |
0,00 |
0,00 |
0,00 |
|
|
6. Other investments: 12560 |
0,00 |
0,00 |
0,00 |
0,00 |
0,00 |
|
|
VI. Short-term accruals: 12600 |
10.132,00 |
3.494,00 |
3.741,00 |
3.885,00 |
7.285,00 |
|
|
VII. Cash and other equivalent liquid assets : 12700 |
673.509,00 |
218.508,00 |
371.106,00 |
1.688.186,00 |
1.894.873,00 |
|
|
1. Treasury: 12710 |
673.509,00 |
218.508,00 |
371.106,00 |
1.688.186,00 |
1.894.873,00 |
|
|
2. Other equivalent liquid assets:
12720 |
0,00 |
0,00 |
0,00 |
0,00 |
0,00 |
|
|
TOTAL
ASSETS (A + B) : 10000 |
44.390.026,00 |
47.876.214,00 |
46.130.114,00 |
48.878.946,00 |
41.274.377,00 |
|
|
|
ORIGINAL |
ORIGINAL |
ORIGINAL |
ORIGINAL |
ORIGINAL |
|
|
Liabilities
and Net Worth |
2013 |
2012 |
2011 |
2010 |
2009 |
|
|
A)
NET WORTH: 20000 |
5.642.488,00 |
5.771.237,00 |
6.598.580,00 |
6.819.159,00 |
7.288.886,00 |
|
|
A-1) Shareholders' equity: 21000 |
5.496.116,00 |
5.763.754,00 |
6.408.549,00 |
6.658.261,00 |
7.097.143,00 |
|
|
I. Capital: 21100 |
2.406.000,00 |
2.406.000,00 |
2.406.000,00 |
2.406.000,00 |
2.406.000,00 |
|
|
1. Registered capital : 21110 |
2.406.000,00 |
2.406.000,00 |
2.406.000,00 |
2.406.000,00 |
2.406.000,00 |
|
|
2. (Uncalled capital): 21120 |
0,00 |
0,00 |
0,00 |
0,00 |
0,00 |
|
|
II. Share premium: 21200 |
0,00 |
0,00 |
0,00 |
0,00 |
0,00 |
|
|
III. Reserves: 21300 |
4.691.143,00 |
4.691.143,00 |
4.691.143,00 |
4.691.143,00 |
3.922.463,00 |
|
|
1. Legal and statutory: 21310 |
481.200,00 |
481.200,00 |
481.200,00 |
481.200,00 |
479.628,00 |
|
|
2. Other reserves: 21320 |
4.209.943,00 |
4.209.943,00 |
4.209.943,00 |
4.209.943,00 |
3.442.835,00 |
|
|
3. Revaluation reserves: 21330 |
0,00 |
0,00 |
0,00 |
0,00 |
0,00 |
|
|
IV. (Common stock equity): 21400 |
0,00 |
0,00 |
0,00 |
0,00 |
0,00 |
|
|
V. Results from previous periods: 21500 |
-1.333.390,00 |
-688.594,00 |
-438.883,00 |
0,00 |
0,00 |
|
|
1. Brought forward: 21510 |
0,00 |
0,00 |
0,00 |
0,00 |
0,00 |
|
|
2. (Negative results from previous
periods): 21520 |
-1.333.390,00 |
-688.594,00 |
-438.883,00 |
0,00 |
0,00 |
|
|
VI. Other shareholders' contributions: 21600 |
0,00 |
0,00 |
0,00 |
0,00 |
0,00 |
|
|
VII. Result of the period: 21700 |
-267.638,00 |
-644.796,00 |
-249.712,00 |
-438.883,00 |
768.680,00 |
|
|
VIII. (Interim dividend): 21800 |
0,00 |
0,00 |
0,00 |
0,00 |
0,00 |
|
|
IX. Other net worth instruments: 21900 |
0,00 |
0,00 |
0,00 |
0,00 |
0,00 |
|
|
A-2) Adjustments due to changes in value: 22000 |
-79.327,00 |
-170.714,00 |
-162.066,00 |
-151.609,00 |
-69.803,00 |
|
|
I. Financial assets held for sale: 22100 |
-1.942,00 |
-4.583,00 |
0,00 |
-13.031,00 |
-13.031,00 |
|
|
II. Hedge operations: 22200 |
-77.385,00 |
-166.131,00 |
-162.066,00 |
-138.578,00 |
-56.772,00 |
|
|
III. Linked non-current assets and liabilities held for sale :
22300 |
0,00 |
0,00 |
0,00 |
0,00 |
0,00 |
|
|
IV. Exchange rate difference: 22400 |
0,00 |
0,00 |
0,00 |
0,00 |
0,00 |
|
|
V. Other: 22500 |
0,00 |
0,00 |
0,00 |
0,00 |
0,00 |
|
|
A-3) Received subsidies, donations and legacies: 23000 |
225.699,00 |
178.197,00 |
352.097,00 |
312.507,00 |
261.546,00 |
|
|
B)
NON-CURRENT LIABILITIES: 31000 |
25.716.762,00 |
16.552.807,00 |
19.117.400,00 |
11.627.077,00 |
13.449.347,00 |
|
|
I. Long-term provisions: 31100 |
0,00 |
0,00 |
0,00 |
0,00 |
0,00 |
|
|
1. Long-term employee benefits liability:
31110 |
0,00 |
0,00 |
0,00 |
0,00 |
0,00 |
|
|
2. Environmental actions: 31120 |
0,00 |
0,00 |
0,00 |
0,00 |
0,00 |
|
|
3. Restructuring provisions: 31130 |
0,00 |
0,00 |
0,00 |
0,00 |
0,00 |
|
|
4. Other provisions: 31140 |
0,00 |
0,00 |
0,00 |
0,00 |
0,00 |
|
|
II Long-term creditors: 31200 |
7.720.034,00 |
6.697.142,00 |
8.966.502,00 |
11.493.145,00 |
13.337.256,00 |
|
|
1. Liabilities and other securities:
31210 |
0,00 |
0,00 |
0,00 |
0,00 |
0,00 |
|
|
2. Amounts owed to credit institutions:
31220 |
6.750.634,00 |
5.935.521,00 |
8.734.979,00 |
11.295.176,00 |
13.256.153,00 |
|
|
3. Creditors from financial leasing:
31230 |
0,00 |
0,00 |
0,00 |
0,00 |
0,00 |
|
|
4. Derivatives : 31240 |
110.550,00 |
237.331,00 |
231.523,00 |
197.969,00 |
81.103,00 |
|
|
5. Other financial liabilities :
31250 |
858.850,00 |
524.290,00 |
0,00 |
0,00 |
0,00 |
|
|
III. Long-term debts with Group companies and associates:
31300 |
17.900.000,00 |
9.779.294,00 |
10.000.000,00 |
0,00 |
0,00 |
|
|
IV. Liabilities for deferred tax: 31400 |
96.728,00 |
76.370,00 |
150.899,00 |
133.932,00 |
112.091,00 |
|
|
V. Long-term accruals: 31500 |
0,00 |
0,00 |
0,00 |
0,00 |
0,00 |
|
|
VI. Non-current trade creditors : 31600 |
0,00 |
0,00 |
0,00 |
0,00 |
0,00 |
|
|
VII. Special long-term debts : 31700 |
0,00 |
0,00 |
0,00 |
0,00 |
0,00 |
|
|
C)
CURRENT LIABILITIES : 32000 |
13.030.777,00 |
25.552.170,00 |
20.414.134,00 |
30.432.710,00 |
20.536.143,00 |
|
|
I. Liabilities linked to non-current assets held for sale:
32100 |
0,00 |
0,00 |
0,00 |
0,00 |
0,00 |
|
|
II. Short-term provisions: 32200 |
0,00 |
0,00 |
0,00 |
0,00 |
0,00 |
|
|
1. Provisions from greenhouse gas emission
allowance: 32210 |
0,00 |
0,00 |
0,00 |
0,00 |
0,00 |
|
|
2. Other provisions: 32220 |
0,00 |
0,00 |
0,00 |
0,00 |
0,00 |
|
|
III. Short-term creditors : 32300 |
2.278.187,00 |
4.910.732,00 |
5.721.059,00 |
6.112.865,00 |
3.877.871,00 |
|
|
1. Liabilities and other securities:
32310 |
0,00 |
0,00 |
0,00 |
0,00 |
0,00 |
|
|
2. Amounts owed to credit institutions:
32320 |
2.247.909,00 |
4.711.792,00 |
5.178.697,00 |
6.075.363,00 |
3.436.894,00 |
|
|
3. Creditors from financial leasing:
32330 |
0,00 |
0,00 |
0,00 |
0,00 |
0,00 |
|
|
4. Derivatives : 32340 |
0,00 |
0,00 |
0,00 |
0,00 |
0,00 |
|
|
5. Other financial liabilities :
32350 |
30.278,00 |
198.940,00 |
542.362,00 |
37.502,00 |
440.977,00 |
|
|
IV. Short-term debts with Group companies and associates:
32400 |
8.009.712,00 |
17.336.920,00 |
12.474.909,00 |
19.854.389,00 |
6.641.775,00 |
|
|
V. Trade creditors and other accounts payable: 32500 |
2.742.878,00 |
3.304.517,00 |
2.218.166,00 |
4.465.456,00 |
10.016.497,00 |
|
|
1. Suppliers: 32510 |
1.571.991,00 |
2.270.406,00 |
1.051.981,00 |
1.515.992,00 |
1.146.985,00 |
|
|
a) Long-term debts :
32511 |
0,00 |
0,00 |
0,00 |
0,00 |
0,00 |
|
|
b) Short-term debts :
32512 |
1.571.991,00 |
2.270.406,00 |
1.051.981,00 |
1.515.992,00 |
1.146.985,00 |
|
|
2. Suppliers, Group companies and
associates: 32520 |
260.429,00 |
421.607,00 |
262.529,00 |
1.908.138,00 |
7.884.101,00 |
|
|
3. Other creditors: 32530 |
342.456,00 |
3.775,00 |
703,00 |
2.163,00 |
10.882,00 |
|
|
4. Personnel (remuneration due):
32540 |
167.626,00 |
169.376,00 |
175.869,00 |
209.974,00 |
203.092,00 |
|
|
5. Liabilities for current tax:
32550 |
0,00 |
0,00 |
0,00 |
0,00 |
572,00 |
|
|
6. Other accounts payable to Public
Administrations.: 32560 |
400.376,00 |
439.354,00 |
727.083,00 |
807.928,00 |
764.250,00 |
|
|
7. Advances from clients: 32570 |
0,00 |
0,00 |
0,00 |
21.261,00 |
6.614,00 |
|
|
VI. Short-term accruals: 32600 |
0,00 |
0,00 |
0,00 |
0,00 |
0,00 |
|
|
VII. Special short-term debts : 32700 |
0,00 |
0,00 |
0,00 |
0,00 |
0,00 |
|
|
TOTAL
NET WORTH AND LIABILITIES (A + B + C) : 30000 |
44.390.026,00 |
47.876.214,00 |
46.130.114,00 |
48.878.946,00 |
41.274.377,00 |
|
|
|
ORIGINAL |
ORIGINAL |
ORIGINAL |
ORIGINAL |
ORIGINAL |
|
|
Profit
and Loss |
2013 |
2012 |
2011 |
2010 |
2009 |
|
|
1.
Net turnover: 40100 |
12.837.352,00 |
11.761.835,00 |
9.666.315,00 |
15.427.503,00 |
13.617.061,00 |
|
|
a) Sales: 40110 |
12.113.218,00 |
11.131.066,00 |
8.870.291,00 |
15.427.503,00 |
13.539.857,00 |
|
|
b) Rendering of services: 40120 |
724.134,00 |
630.769,00 |
796.024,00 |
0,00 |
77.204,00 |
|
|
c) Income of financial nature of holding companies: 40130 |
0,00 |
0,00 |
0,00 |
0,00 |
0,00 |
|
|
2.
Changes in stocks of finished goods and work in progress: 40200 |
190.337,00 |
889.836,00 |
242.148,00 |
67.124,00 |
815.274,00 |
|
|
3.
Works carried out by the company for its assets: 40300 |
460.960,00 |
99.655,00 |
48.432,00 |
1.068.535,00 |
1.058.670,00 |
|
|
4.
Supplies : 40400 |
-7.449.116,00 |
-7.044.932,00 |
-8.286.371,00 |
-12.088.015,00 |
-9.732.222,00 |
|
|
a) Stock consumption: 40410 |
-12.952,00 |
-10.199,00 |
0,00 |
-2.888.787,00 |
-1.101.137,00 |
|
|
b) Consumption of raw materials and miscellaneous consumable
ones: 40420 |
-7.105.663,00 |
-6.830.942,00 |
-8.187.874,00 |
-8.770.054,00 |
-8.525.869,00 |
|
|
c) Works carried out by other companies: 40430 |
-330.501,00 |
-203.791,00 |
-98.496,00 |
-429.174,00 |
-105.216,00 |
|
|
d) Impairment of stock, primary material and other supplies:
40440 |
0,00 |
0,00 |
0,00 |
0,00 |
0,00 |
|
|
5.
Other operating income: 40500 |
0,00 |
56.742,00 |
123.371,00 |
426.365,00 |
573.790,00 |
|
|
a) Auxiliary income and other from current management:
40510 |
0,00 |
0,00 |
105.773,00 |
423.644,00 |
0,00 |
|
|
b) Operation subsidies included in the Period's
result: 40520 |
0,00 |
56.742,00 |
17.598,00 |
2.721,00 |
573.790,00 |
|
|
6.
Personnel costs: 40600 |
-2.706.319,00 |
-2.982.478,00 |
-2.595.417,00 |
-3.119.491,00 |
-3.152.372,00 |
|
|
a) Wages, salaries et al.: 40610 |
-2.073.199,00 |
-2.352.280,00 |
-1.914.245,00 |
-2.412.702,00 |
-2.334.683,00 |
|
|
b) Social security costs: 40620 |
-633.119,00 |
-630.199,00 |
-681.172,00 |
-706.789,00 |
-817.689,00 |
|
|
c) Provisions : 40630 |
0,00 |
0,00 |
0,00 |
0,00 |
0,00 |
|
|
7.
Other operating costs: 40700 |
-2.058.664,00 |
-1.729.403,00 |
-1.793.900,00 |
-1.432.743,00 |
-1.535.698,00 |
|
|
a) External services: 40710 |
-2.044.560,00 |
-1.714.355,00 |
-1.773.927,00 |
-1.416.185,00 |
-1.512.430,00 |
|
|
b) Taxes: 40720 |
-14.104,00 |
-15.049,00 |
-19.973,00 |
-16.558,00 |
-23.268,00 |
|
|
c) Losses, impairments and variation in provisions from trade
operations : 40730 |
0,00 |
0,00 |
0,00 |
0,00 |
0,00 |
|
|
d) Other current management expenditure : 40740 |
0,00 |
0,00 |
0,00 |
0,00 |
0,00 |
|
|
e) Expenses due to greenhouse gas emissions: 40750 |
0,00 |
0,00 |
0,00 |
0,00 |
0,00 |
|
|
8.
Amortisation of fixed assets: 40800 |
-1.116.618,00 |
-1.055.356,00 |
-480.427,00 |
-515.439,00 |
-473.733,00 |
|
|
9.
Allocation of subsidies of non-financial fixed assets and other: 40900 |
72.185,00 |
74.944,00 |
15.067,00 |
6.615,00 |
6.615,00 |
|
|
10.
Excess provisions : 41000 |
0,00 |
0,00 |
0,00 |
0,00 |
0,00 |
|
|
11.
Impairment and result of transfers of fixed assets: 41100 |
32.917,00 |
180.831,00 |
29.240,00 |
236.819,00 |
0,00 |
|
|
a) Impairment and losses : 41110 |
0,00 |
0,00 |
0,00 |
0,00 |
0,00 |
|
|
b) Results for transfers and other : 41120 |
32.917,00 |
180.831,00 |
29.240,00 |
236.819,00 |
0,00 |
|
|
c) Impairment and profit due to disposals of assets of holding
companies: 41130 |
0,00 |
0,00 |
0,00 |
0,00 |
0,00 |
|
|
12.
Negative difference in combined businesses: 41200 |
0,00 |
0,00 |
0,00 |
0,00 |
0,00 |
|
|
13.
Other results : 41300 |
2.993,00 |
51.107,00 |
416.619,00 |
-1.160,00 |
600,00 |
|
|
A.1)
OPERATING INCOME (1 + 2 + 3 + 4 + 5 + 6 + 7 + 8 + 9 + 10 + 11 + 12 + 13) :
49100 |
266.027,00 |
302.780,00 |
-2.614.923,00 |
76.113,00 |
1.177.986,00 |
|
|
14.
Financial income : 41400 |
292.872,00 |
368.683,00 |
337.764,00 |
342.450,00 |
185.546,00 |
|
|
a) Of shares in equity instruments : 41410 |
0,00 |
422,00 |
18.476,00 |
0,00 |
0,00 |
|
|
a 1) In Group companies and associates:
41411 |
0,00 |
422,00 |
18.476,00 |
0,00 |
0,00 |
|
|
a 2) In third parties: 41412 |
0,00 |
0,00 |
0,00 |
0,00 |
0,00 |
|
|
b) From negotiable securities and other financial instruments :
41420 |
292.872,00 |
368.261,00 |
319.289,00 |
342.450,00 |
185.546,00 |
|
|
b 1) From Group companies and associates :
41421 |
260.566,00 |
359.504,00 |
301.103,00 |
336.522,00 |
183.832,00 |
|
|
b 2) From third parties : 41422 |
32.306,00 |
8.757,00 |
18.185,00 |
5.928,00 |
1.714,00 |
|
|
c) Allocation of financial subsidies, donations and legacies :
41430 |
0,00 |
0,00 |
0,00 |
0,00 |
0,00 |
|
|
15.
Financial expenditure: 41500 |
-515.439,00 |
-979.846,00 |
-842.306,00 |
-1.171.612,00 |
-1.028.173,00 |
|
|
a) Amounts owed to Group companies and associates : 41510 |
-138.153,00 |
-383.275,00 |
-238.024,00 |
-562.497,00 |
-461.579,00 |
|
|
b) For debts with third parties : 41520 |
-377.285,00 |
-596.571,00 |
-604.283,00 |
-609.115,00 |
-566.594,00 |
|
|
c) Stock renewal : 41530 |
0,00 |
0,00 |
0,00 |
0,00 |
0,00 |
|
|
16.
Changes in fair value of financial instruments : 41600 |
-114.779,00 |
-117.101,00 |
-130.943,00 |
-169.903,00 |
-42.351,00 |
|
|
a) Trading book and other : 41610 |
-114.779,00 |
-117.101,00 |
-130.943,00 |
-169.903,00 |
-42.351,00 |
|
|
b) Allocation of financial assets held for sale to the result
for the period: 41620 |
0,00 |
0,00 |
0,00 |
0,00 |
0,00 |
|
|
17.
Exchange rate differences : 41700 |
-296.815,00 |
-214.838,00 |
367.158,00 |
296.832,00 |
-137.345,00 |
|
|
18.
Impairment and result for transfers of financial instruments: 41800 |
0,00 |
0,00 |
2.520.149,00 |
0,00 |
0,00 |
|
|
a) Impairment and losses : 41810 |
0,00 |
0,00 |
0,00 |
0,00 |
0,00 |
|
|
b) Results for transfers and other : 41820 |
0,00 |
0,00 |
2.520.149,00 |
0,00 |
0,00 |
|
|
19.
Other financial income and expenditure: 42100 |
0,00 |
0,00 |
0,00 |
0,00 |
0,00 |
|
|
a) Incorporation of financial expenditure to assets:
42110 |
0,00 |
0,00 |
0,00 |
0,00 |
0,00 |
|
|
b) Financial income from arrangement with creditors:
42120 |
0,00 |
0,00 |
0,00 |
0,00 |
0,00 |
|
|
c) Other income and expenditure: 42130 |
0,00 |
0,00 |
0,00 |
0,00 |
0,00 |
|
|
A.2)
FINANCIAL REVENUE (14+15+16+17+18+19) : 49200 |
-634.161,00 |
-943.102,00 |
2.251.822,00 |
-702.233,00 |
-1.022.323,00 |
|
|
A.3)
NET RESULT BEFORE TAXES (A.1+A.2) : 49300 |
-368.134,00 |
-640.322,00 |
-363.102,00 |
-626.120,00 |
155.662,00 |
|
|
20.
Income taxes: 41900 |
100.496,00 |
-4.473,00 |
113.390,00 |
187.238,00 |
613.018,00 |
|
|
A.4)
PROFIT AFTER TAXES (A.3+20) : 49400 |
-267.638,00 |
-644.796,00 |
-249.712,00 |
-438.883,00 |
768.680,00 |
|
|
21.
Result of the year coming from interrupted operations : 42000 |
0,00 |
0,00 |
0,00 |
0,00 |
0,00 |
|
|
A.5)
RESULT OF THE PERIOD (A.4+21) : 49500 |
-267.638,00 |
-644.796,00 |
-249.712,00 |
-438.883,00 |
768.680,00 |
|
> Normal Balance Sheet under the rules of the 1990 General Accounting Plan (repealed since 1st January of 2008)
Information corresponding to the fiscal year 2013 2012 2011 2010 2009 has been compiled based on the equivalence criteria stipulated in Act JUS/206/2009. Where the provisions of the Act did not establish relevant equivalence criteria. To view details on the methodology 2013 2012 2011 2010 2009 is taken from information submitted to the TRADE REGISTER.
|
|
EQUIVALENCIA |
EQUIVALENCIA |
EQUIVALENCIA |
EQUIVALENCIA |
EQUIVALENCIA |
|
|
ASSETS |
2013 |
2012 |
2011 |
2010 |
2009 |
|
|
A)
SHAREHOLDERS (PARTNERS) BY UNCALLED SUSCRIBED CAPITAL: |
0,00 |
0,00 |
0,00 |
0,00 |
0,00 |
|
|
B)
FIXED ASSETS: |
32.409.351,00 |
28.195.404,00 |
28.381.653,00 |
30.540.456,00 |
29.774.911,00 |
|
|
I. Formation expenses: |
0,00 |
0,00 |
0,00 |
0,00 |
0,00 |
|
|
II. Intangible fixed assets: |
2.513.980,00 |
2.660.834,00 |
3.268.649,00 |
3.219.472,00 |
1.918.905,00 |
|
|
1. Research and development costs: |
2.221.261,00 |
2.347.067,00 |
2.933.834,00 |
2.885.402,00 |
1.816.867,00 |
|
|
2. Concessions, patents, licences,
trademarks et al.: |
250.038,00 |
250.038,00 |
250.038,00 |
250.038,00 |
0,00 |
|
|
3. Goodwill: |
0,00 |
0,00 |
0,00 |
0,00 |
0,00 |
|
|
4. Key money paid for premises: |
0,00 |
0,00 |
0,00 |
0,00 |
0,00 |
|
|
5. Software: |
42.681,00 |
63.729,00 |
84.776,00 |
84.032,00 |
102.038,00 |
|
|
6. Assets under capital leases: |
0,00 |
0,00 |
0,00 |
0,00 |
0,00 |
|
|
7. Payments on account: |
0,00 |
0,00 |
0,00 |
0,00 |
0,00 |
|
|
8. Provisions: |
0,00 |
0,00 |
0,00 |
0,00 |
0,00 |
|
|
9. Accumulated depreciation: |
0,00 |
0,00 |
0,00 |
0,00 |
0,00 |
|
|
III. Tangible fixed assets: |
5.178.075,00 |
5.165.805,00 |
4.861.862,00 |
4.783.571,00 |
5.481.482,00 |
|
|
1. Land and construction: |
1.479.886,00 |
1.467.564,00 |
1.518.426,00 |
1.579.861,00 |
1.641.296,00 |
|
|
2. Technical installations and machinery:
|
3.193.758,00 |
3.566.341,00 |
2.779.505,00 |
3.123.205,00 |
2.949.867,00 |
|
|
3. Other installations, tools and
furniture: |
11.946,00 |
13.339,00 |
10.396,00 |
11.682,00 |
11.034,00 |
|
|
4. Payments on account and tangible fixed
assets under construction: |
422.109,00 |
39.973,00 |
492.285,00 |
0,00 |
814.282,00 |
|
|
5. Other tangible assets: |
70.378,00 |
78.588,00 |
61.249,00 |
68.823,00 |
65.003,00 |
|
|
6. Provisions: |
0,00 |
0,00 |
0,00 |
0,00 |
0,00 |
|
|
7. Accumulated depreciation: |
0,00 |
0,00 |
0,00 |
0,00 |
0,00 |
|
|
IV. Financial investments: |
24.717.296,00 |
20.368.765,00 |
20.251.142,00 |
22.537.414,00 |
22.374.523,00 |
|
|
1. Equity investments in group companies:
|
22.932.391,00 |
17.806.398,00 |
17.806.398,00 |
20.113.954,00 |
20.113.954,00 |
|
|
2. Receivables from group companies:
|
1.619.555,00 |
2.400.790,00 |
2.426.621,00 |
2.384.311,00 |
2.221.421,00 |
|
|
3. Equity investment in associated
companies: |
0,00 |
0,00 |
0,00 |
0,00 |
0,00 |
|
|
4. Credits to associated companies: |
0,00 |
0,00 |
0,00 |
0,00 |
0,00 |
|
|
5. Long-term securities portfolio: |
10.925,00 |
7.152,00 |
13.699,00 |
34.725,00 |
34.725,00 |
|
|
6. Other receivables: |
0,00 |
0,00 |
0,00 |
0,00 |
0,00 |
|
|
7. Long term guarantees and deposits:
|
154.424,00 |
154.424,00 |
4.424,00 |
4.424,00 |
4.424,00 |
|
|
8. Provisions: |
0,00 |
0,00 |
0,00 |
0,00 |
0,00 |
|
|
9. Long-term receivables from public
bodies: |
0,00 |
0,00 |
0,00 |
0,00 |
0,00 |
|
|
V. Own shares: |
0,00 |
0,00 |
0,00 |
0,00 |
0,00 |
|
|
VI. Long-term trade receivables: |
0,00 |
0,00 |
0,00 |
0,00 |
0,00 |
|
|
C)
Deferred expenses: |
0,00 |
0,00 |
0,00 |
0,00 |
0,00 |
|
|
D)
CURRENT ASSETS: |
11.980.675,00 |
19.680.810,00 |
17.748.461,00 |
18.338.489,00 |
11.499.466,00 |
|
|
I. Called-up share capital (not paid): |
0,00 |
0,00 |
0,00 |
0,00 |
0,00 |
|
|
II. Stocks: |
4.960.595,00 |
4.802.443,00 |
3.030.746,00 |
4.420.758,00 |
4.149.852,00 |
|
|
1. Goods for resale: |
0,00 |
0,00 |
0,00 |
0,00 |
0,00 |
|
|
2. Raw materials and other consumables:
|
1.741.876,00 |
1.774.061,00 |
892.200,00 |
2.524.360,00 |
2.320.579,00 |
|
|
3. Goods in process and semifinished ones:
|
0,00 |
0,00 |
0,00 |
0,00 |
0,00 |
|
|
4. Finished products: |
3.218.718,00 |
3.028.382,00 |
2.138.546,00 |
1.896.398,00 |
1.829.274,00 |
|
|
5. Byproducts, scrap and recovered
materials: |
0,00 |
0,00 |
0,00 |
0,00 |
0,00 |
|
|
6. Payments on account: |
0,00 |
0,00 |
0,00 |
0,00 |
0,00 |
|
|
7. Provisions: |
0,00 |
0,00 |
0,00 |
0,00 |
0,00 |
|
|
III. Debtors: |
3.716.800,00 |
5.091.683,00 |
4.912.859,00 |
6.263.262,00 |
4.522.064,00 |
|
|
1. Trade debtors / accounts receivable:
|
618.340,00 |
356.185,00 |
405.381,00 |
1.120.153,00 |
840.053,00 |
|
|
2. Accounts receivable, Group companies:
|
2.002.925,00 |
3.634.296,00 |
3.126.966,00 |
4.023.755,00 |
2.522.741,00 |
|
|
3. Accounts receivable, associated
companies: |
0,00 |
0,00 |
0,00 |
0,00 |
0,00 |
|
|
4. Other debtors: |
0,00 |
14.476,00 |
2.529,00 |
6.693,00 |
0,00 |
|
|
5. Staff: |
0,00 |
0,00 |
0,00 |
0,00 |
0,00 |
|
|
6. Public bodies: |
1.095.535,00 |
1.086.726,00 |
1.377.983,00 |
1.112.662,00 |
1.159.271,00 |
|
|
7. Provisions: |
0,00 |
0,00 |
0,00 |
0,00 |
0,00 |
|
|
IV. Short-term investments: |
2.619.639,00 |
9.564.681,00 |
9.430.010,00 |
5.962.398,00 |
925.392,00 |
|
|
1. Equity investments in group companies:
|
0,00 |
0,00 |
0,00 |
0,00 |
0,00 |
|
|
2. Receivables from group companies:
|
1.760.098,00 |
8.682.024,00 |
8.772.409,00 |
5.962.398,00 |
925.392,00 |
|
|
3. Equity investment in associated
companies: |
0,00 |
0,00 |
0,00 |
0,00 |
0,00 |
|
|
4. Credits to associated companies: |
0,00 |
0,00 |
0,00 |
0,00 |
0,00 |
|
|
5. Short term securities portfolio: |
0,00 |
0,00 |
0,00 |
0,00 |
0,00 |
|
|
6. Other receivables: |
859.542,00 |
832.658,00 |
657.601,00 |
0,00 |
0,00 |
|
|
7. Shor term guarantees and deposits:
|
0,00 |
50.000,00 |
0,00 |
0,00 |
0,00 |
|
|
8. Provisions: |
0,00 |
0,00 |
0,00 |
0,00 |
0,00 |
|
|
V. Short-term treasury shares: |
0,00 |
0,00 |
0,00 |
0,00 |
0,00 |
|
|
VI. Cash at bank and in hand: |
673.509,00 |
218.508,00 |
371.106,00 |
1.688.186,00 |
1.894.873,00 |
|
|
VII. Prepayments and accrued income: |
10.132,00 |
3.494,00 |
3.741,00 |
3.885,00 |
7.285,00 |
|
|
GENERAL
TOTAL (A + B + C + D): |
44.390.026,00 |
47.876.214,00 |
46.130.114,00 |
48.878.946,00 |
41.274.377,00 |
|
MERCANTILE REGISTRY.
|
|
EQUIVALENCIA |
EQUIVALENCIA |
EQUIVALENCIA |
EQUIVALENCIA |
EQUIVALENCIA |
|
|
LIABILITIES |
2013 |
2012 |
2011 |
2010 |
2009 |
|
|
A)
EQUITY: |
5.595.049,00 |
5.883.830,00 |
6.583.635,00 |
6.798.373,00 |
7.186.907,00 |
|
|
I. Subscribed capital: |
2.406.000,00 |
2.406.000,00 |
2.406.000,00 |
2.406.000,00 |
2.406.000,00 |
|
|
II. Share premium: |
0,00 |
0,00 |
0,00 |
0,00 |
0,00 |
|
|
III. Revaluation reserves: |
0,00 |
0,00 |
0,00 |
0,00 |
0,00 |
|
|
IV. Reserves: |
4.790.076,00 |
4.811.219,00 |
4.866.229,00 |
4.831.255,00 |
4.012.227,00 |
|
|
1. Legal reserve: |
481.200,00 |
481.200,00 |
481.200,00 |
481.200,00 |
479.628,00 |
|
|
2. Reserves for own shares: |
0,00 |
0,00 |
0,00 |
0,00 |
0,00 |
|
|
3. Reserves for shares of the controlling
company: |
0,00 |
0,00 |
0,00 |
0,00 |
0,00 |
|
|
4. Statutory reserves: |
0,00 |
0,00 |
0,00 |
0,00 |
0,00 |
|
|
5. Miscellaneous reserves: |
4.308.876,00 |
4.330.019,00 |
4.385.029,00 |
4.350.055,00 |
3.532.599,00 |
|
|
Differences due to capital adjustement to
euros: |
0,00 |
0,00 |
0,00 |
0,00 |
0,00 |
|
|
V. Profit or loss brought forward: |
-1.333.390,00 |
-688.594,00 |
-438.883,00 |
0,00 |
0,00 |
|
|
1. Retained earnings: |
0,00 |
0,00 |
0,00 |
0,00 |
0,00 |
|
|
2. Prior year losses: |
-1.333.390,00 |
-688.594,00 |
-438.883,00 |
0,00 |
0,00 |
|
|
3. Partners' contributions so as
to compensate losses: |
0,00 |
0,00 |
0,00 |
0,00 |
0,00 |
|
|
VI. Profit or loss for the financial year: |
-267.638,00 |
-644.796,00 |
-249.712,00 |
-438.883,00 |
768.680,00 |
|
|
VII. Interim dividend paid: |
0,00 |
0,00 |
0,00 |
0,00 |
0,00 |
|
|
VIII. Own shares for capital reduction: |
0,00 |
0,00 |
0,00 |
0,00 |
0,00 |
|
|
B)
Deferred income: |
157.989,00 |
124.738,00 |
246.468,00 |
218.755,00 |
183.082,00 |
|
|
1. Capital grants: |
157.989,00 |
124.738,00 |
246.468,00 |
218.755,00 |
183.082,00 |
|
|
2. Unrealised exchange gains: |
0,00 |
0,00 |
0,00 |
0,00 |
0,00 |
|
|
3. Other deferred income: |
0,00 |
0,00 |
0,00 |
0,00 |
0,00 |
|
|
4. Public revenues to distribute in
several financial years: |
0,00 |
0,00 |
0,00 |
0,00 |
0,00 |
|
|
C)
PROVISIONS FOR LIABILITIES AND CHARGES: |
0,00 |
0,00 |
0,00 |
0,00 |
0,00 |
|
|
1. Provisions for pension fund and other
similar obligations: |
0,00 |
0,00 |
0,00 |
0,00 |
0,00 |
|
|
2. Provisions for taxes: |
0,00 |
0,00 |
0,00 |
0,00 |
0,00 |
|
|
3. Other provisions: |
0,00 |
0,00 |
0,00 |
0,00 |
0,00 |
|
|
4. Reversion fund: |
0,00 |
0,00 |
0,00 |
0,00 |
0,00 |
|
|
D)
LONG TERM LIABILITIES: |
25.606.212,00 |
16.315.476,00 |
18.885.878,00 |
11.429.108,00 |
13.368.244,00 |
|
|
I. Issued debentures and other marketable securities: |
0,00 |
0,00 |
0,00 |
0,00 |
0,00 |
|
|
1. Non-convertible debentures: |
0,00 |
0,00 |
0,00 |
0,00 |
0,00 |
|
|
2. Convertible debentures: |
0,00 |
0,00 |
0,00 |
0,00 |
0,00 |
|
|
3. Other debt securities: |
0,00 |
0,00 |
0,00 |
0,00 |
0,00 |
|
|
II. Amounts owed to credit institutions: |
6.750.634,00 |
5.935.521,00 |
8.734.979,00 |
11.295.176,00 |
13.256.153,00 |
|
|
1. Loans and other liabilities: |
6.750.634,00 |
5.935.521,00 |
8.734.979,00 |
11.295.176,00 |
13.256.153,00 |
|
|
2. Long-term liabilities from capital
leases: |
0,00 |
0,00 |
0,00 |
0,00 |
0,00 |
|
|
III. Debts with companies of the group and affiliated ones:
|
17.900.000,00 |
9.779.294,00 |
10.000.000,00 |
0,00 |
0,00 |
|
|
1. Amounts owed to group companies: |
17.900.000,00 |
9.779.294,00 |
10.000.000,00 |
0,00 |
0,00 |
|
|
2. Amounts owed to associated companies:
|
0,00 |
0,00 |
0,00 |
0,00 |
0,00 |
|
|
IV. Other creditors: |
955.578,00 |
600.660,00 |
150.899,00 |
133.932,00 |
112.091,00 |
|
|
1. Long-term bills of exchange payable:
|
0,00 |
0,00 |
0,00 |
0,00 |
0,00 |
|
|
2. Other creditors: |
858.850,00 |
524.290,00 |
0,00 |
0,00 |
0,00 |
|
|
3. Long term guarantees and deposits
received: |
0,00 |
0,00 |
0,00 |
0,00 |
0,00 |
|
|
4. Long term payables to public bodies:
|
96.728,00 |
76.370,00 |
150.899,00 |
133.932,00 |
112.091,00 |
|
|
V. Unpaid portion of equity investment: |
0,00 |
0,00 |
0,00 |
0,00 |
0,00 |
|
|
1. Group companies: |
0,00 |
0,00 |
0,00 |
0,00 |
0,00 |
|
|
2. Associated companies: |
0,00 |
0,00 |
0,00 |
0,00 |
0,00 |
|
|
3. Third parties: |
0,00 |
0,00 |
0,00 |
0,00 |
0,00 |
|
|
VI. Long term trade creditors: |
0,00 |
0,00 |
0,00 |
0,00 |
0,00 |
|
|
E)
SHORT TERM CREDITORS: |
13.030.777,00 |
25.552.170,00 |
20.414.134,00 |
30.432.710,00 |
20.536.143,00 |
|
|
I. Issued debentures and other marketable securities: |
0,00 |
0,00 |
0,00 |
0,00 |
0,00 |
|
|
1. Non-convertible debentures: |
0,00 |
0,00 |
0,00 |
0,00 |
0,00 |
|
|
2. Convertible debentures: |
0,00 |
0,00 |
0,00 |
0,00 |
0,00 |
|
|
3. Other debt securities: |
0,00 |
0,00 |
0,00 |
0,00 |
0,00 |
|
|
4. Accrued interest on debentures and
other debt securities: |
0,00 |
0,00 |
0,00 |
0,00 |
0,00 |
|
|
II. Amounts owed to credit institutions: |
2.247.909,00 |
4.711.792,00 |
5.178.697,00 |
6.075.363,00 |
3.436.894,00 |
|
|
1. Loans and other liabilities: |
2.247.909,00 |
4.711.792,00 |
5.178.697,00 |
6.075.363,00 |
3.436.894,00 |
|
|
2. Accrued interest on liabilities with
credit institutions: |
0,00 |
0,00 |
0,00 |
0,00 |
0,00 |
|
|
3. Short-term liabilities from capital
leases: |
0,00 |
0,00 |
0,00 |
0,00 |
0,00 |
|
|
III. Short-term amounts owed to group and associated companies:
|
8.270.141,00 |
17.758.528,00 |
12.737.438,00 |
21.762.527,00 |
14.525.876,00 |
|
|
1. Amounts owed to group companies: |
8.270.141,00 |
17.758.528,00 |
12.737.438,00 |
21.762.527,00 |
14.525.876,00 |
|
|
2. Amounts owed to associated companies:
|
0,00 |
0,00 |
0,00 |
0,00 |
0,00 |
|
|
IV. Trade creditors: |
1.914.446,00 |
2.274.180,00 |
1.052.685,00 |
1.539.416,00 |
1.164.482,00 |
|
|
1. Advanced payments from customers:
|
0,00 |
0,00 |
0,00 |
21.261,00 |
6.614,00 |
|
|
2. Amounts owed for purchases of goods or
services: |
1.914.446,00 |
2.274.180,00 |
1.052.685,00 |
1.518.155,00 |
1.157.868,00 |
|
|
3. Debts represented by notes payable:
|
0,00 |
0,00 |
0,00 |
0,00 |
0,00 |
|
|
V. Other creditors: |
598.280,00 |
807.670,00 |
1.445.314,00 |
1.055.404,00 |
1.408.891,00 |
|
|
1. Public bodies: |
400.376,00 |
439.354,00 |
727.083,00 |
807.928,00 |
764.822,00 |
|
|
2. Bills of exchange payable: |
0,00 |
0,00 |
0,00 |
0,00 |
0,00 |
|
|
3. Miscellaneous debts: |
30.278,00 |
198.940,00 |
542.362,00 |
37.502,00 |
440.977,00 |
|
|
4. Wages and salaries payable: |
167.626,00 |
169.376,00 |
175.869,00 |
209.974,00 |
203.092,00 |
|
|
5. Guarantees and deposits received at
short term: |
0,00 |
0,00 |
0,00 |
0,00 |
0,00 |
|
|
VI. Provisions: |
0,00 |
0,00 |
0,00 |
0,00 |
0,00 |
|
|
VII. Prepayments and accrued income: |
0,00 |
0,00 |
0,00 |
0,00 |
0,00 |
|
|
F)
SHORT-TERM PROVISIONS FOR LIABILITIES AND CHARGES: |
0,00 |
0,00 |
0,00 |
0,00 |
0,00 |
|
|
GENERAL
TOTAL (A + B + C + D + E + F): |
44.390.026,00 |
47.876.214,00 |
46.130.114,00 |
48.878.946,00 |
41.274.377,00 |
|
MERCANTILE REGISTRY.
|
|
EQUIVALENCIA |
EQUIVALENCIA |
EQUIVALENCIA |
EQUIVALENCIA |
EQUIVALENCIA |
|
|
DEBIT |
2013 |
2012 |
2011 |
2010 |
2009 |
|
|
A)
CHARGES (A.1 to A.15): |
14.157.254,00 |
14.128.428,00 |
14.015.974,00 |
18.311.126,00 |
15.488.876,00 |
|
|
A.1. Stock reduction of both manufactured goods
and the ones in process: |
0,00 |
0,00 |
0,00 |
0,00 |
0,00 |
|
|
A.2. Supplies: |
7.449.116,00 |
7.044.932,00 |
8.286.371,00 |
12.088.015,00 |
9.732.222,00 |
|
|
a) Stock consumption:
|
12.952,00 |
10.199,00 |
0,00 |
2.888.787,00 |
1.101.137,00 |
|
|
b) Consumption of raw
materials and miscellaneous consumable ones: |
7.105.663,00 |
6.830.942,00 |
8.187.874,00 |
8.770.054,00 |
8.525.869,00 |
|
|
c) Miscellaneous
external expenditure: |
330.501,00 |
203.791,00 |
98.496,00 |
429.174,00 |
105.216,00 |
|
|
A.3. Staff costs: |
2.706.319,00 |
2.982.478,00 |
2.595.417,00 |
3.119.491,00 |
3.152.372,00 |
|
|
a) Wages, salaries et
al.: |
2.073.199,00 |
2.352.280,00 |
1.914.245,00 |
2.412.702,00 |
2.334.683,00 |
|
|
b) Social security
costs: |
633.119,00 |
630.199,00 |
681.172,00 |
706.789,00 |
817.689,00 |
|
|
A.4. Depreciation expense: |
1.116.618,00 |
1.055.356,00 |
480.427,00 |
515.439,00 |
473.733,00 |
|
|
A.5. Variation of trade provisions and
losses of unrecovered receivables: |
0,00 |
0,00 |
0,00 |
0,00 |
0,00 |
|
|
a) Stock provision
variation: |
0,00 |
0,00 |
0,00 |
0,00 |
0,00 |
|
|
b) Variation in
provision and bad debt losses: |
0,00 |
0,00 |
0,00 |
0,00 |
0,00 |
|
|
c) Variation of other
trade provisions: |
0,00 |
0,00 |
0,00 |
0,00 |
0,00 |
|
|
A.6. Other operating charges: |
2.058.664,00 |
1.729.403,00 |
1.793.900,00 |
1.432.743,00 |
1.535.698,00 |
|
|
a) External services:
|
2.044.560,00 |
1.714.355,00 |
1.773.927,00 |
1.416.185,00 |
1.512.430,00 |
|
|
b) Taxes: |
14.104,00 |
15.049,00 |
19.973,00 |
16.558,00 |
23.268,00 |
|
|
c) Other operating
expenses: |
0,00 |
0,00 |
0,00 |
0,00 |
0,00 |
|
|
d) Allocation to
revision fund: |
0,00 |
0,00 |
0,00 |
0,00 |
0,00 |
|
|
A.I. OPERATING BENEFITS
(B.1+B.2+B.3+B.4-A.1-A.2-A.3-A.4-A.5-A.6): |
157.932,00 |
0,00 |
0,00 |
0,00 |
1.170.771,00 |
|
|
A.7. Financial and similar charges: |
515.439,00 |
979.846,00 |
842.306,00 |
1.171.612,00 |
1.028.173,00 |
|
|
a) Due to liabilities
with companies of the group: |
138.153,00 |
383.275,00 |
238.024,00 |
562.497,00 |
461.579,00 |
|
|
b) Due to liabilities
with associated companies: |
0,00 |
0,00 |
0,00 |
0,00 |
0,00 |
|
|
c) Due to other
debts.: |
377.285,00 |
596.571,00 |
604.283,00 |
609.115,00 |
566.594,00 |
|
|
d) Losses from
financial investments: |
0,00 |
0,00 |
0,00 |
0,00 |
0,00 |
|
|
A.8. Changes in financial investment
provisions: |
114.779,00 |
117.101,00 |
130.943,00 |
169.903,00 |
42.351,00 |
|
|
A.9. Exchange losses: |
296.815,00 |
214.838,00 |
0,00 |
0,00 |
137.345,00 |
|
|
A.II. NET FINANCIAL INCOME (B.5+B.6+B.7+B.8-A.7-A.8-A.9):
|
0,00 |
0,00 |
2.251.822,00 |
0,00 |
0,00 |
|
|
A.III. PROFIT FROM ORDINARY ACTIVITIES (A.I+A.II-B.I-B.II):
|
0,00 |
0,00 |
0,00 |
0,00 |
148.448,00 |
|
|
A.10. Changes in provisions for
intangible, tangible and securities portfolio: |
0,00 |
0,00 |
0,00 |
0,00 |
0,00 |
|
|
A.11. Losses from tangible and intangible
fixed assets and securities portfolio: |
0,00 |
0,00 |
0,00 |
0,00 |
0,00 |
|
|
A.12. Losses from transactions with own
shares and debentures: |
0,00 |
0,00 |
0,00 |
0,00 |
0,00 |
|
|
A.13. Extraordinary expenses: |
0,00 |
0,00 |
0,00 |
1.160,00 |
0,00 |
|
|
A.14. Expenses and losses of former
financial years: |
0,00 |
0,00 |
0,00 |
0,00 |
0,00 |
|
|
A.IV. EXTRAORDINARY PROFIT
(B.9+B.10+B.11+B.12+B.13-A.10-A.11-A.12-A.13-A.14): |
108.096,00 |
306.882,00 |
460.925,00 |
242.274,00 |
7.215,00 |
|
|
A.V. PROFIT BEFORE TAXES (A.III+A.IV-B.III-B.IV): |
0,00 |
0,00 |
0,00 |
0,00 |
155.662,00 |
|
|
A.15. Corporation tax: |
-100.496,00 |
4.473,00 |
-113.390,00 |
-187.238,00 |
-613.018,00 |
|
|
A.16. Miscellaneous taxes: |
0,00 |
0,00 |
0,00 |
0,00 |
0,00 |
|
|
A.VI. FINANCIAL YEAR RESULTS (PROFIT) (A.V-A.15-A.16): |
0,00 |
0,00 |
0,00 |
0,00 |
768.680,00 |
|
MERCANTILE REGISTRY.
|
|
EQUIVALENCIA |
EQUIVALENCIA |
EQUIVALENCIA |
EQUIVALENCIA |
EQUIVALENCIA |
|
|
CREDIT |
2013 |
2012 |
2011 |
2010 |
2009 |
|
|
B)
INCOME ( B.1 to B.13): |
13.889.616,00 |
13.483.633,00 |
13.766.262,00 |
17.872.243,00 |
16.257.556,00 |
|
|
B.1. Net total sales: |
12.837.352,00 |
11.761.835,00 |
9.666.315,00 |
15.427.503,00 |
13.617.061,00 |
|
|
a) Sales: |
12.113.218,00 |
11.131.066,00 |
8.870.291,00 |
15.427.503,00 |
13.539.857,00 |
|
|
b) Rendering of
services: |
724.134,00 |
630.769,00 |
796.024,00 |
0,00 |
77.204,00 |
|
|
Returns and Rappel on
sales: |
0,00 |
0,00 |
0,00 |
0,00 |
0,00 |
|
|
B.2. Stock increase of manufactured goods
and products in process: |
190.337,00 |
889.836,00 |
242.148,00 |
67.124,00 |
815.274,00 |
|
|
B.3. Works performed by the company for
fixed assets: |
460.960,00 |
99.655,00 |
48.432,00 |
1.068.535,00 |
1.058.670,00 |
|
|
B.4. Miscellaneous operating income:
|
0,00 |
56.742,00 |
123.371,00 |
426.365,00 |
573.790,00 |
|
|
a) Auxiliary income
and other from current management: |
0,00 |
0,00 |
105.773,00 |
423.644,00 |
0,00 |
|
|
b) Grants: |
0,00 |
56.742,00 |
17.598,00 |
2.721,00 |
573.790,00 |
|
|
c) Liabilities and
charges provisions surplus: |
0,00 |
0,00 |
0,00 |
0,00 |
0,00 |
|
|
B.I. PÉRDIDAS DE EXPLOTACIÓN
(A.1+A.2+A.3+A.4+A.5-A.6-B.1-B.2-B.3-B.4): |
0,00 |
4.102,00 |
3.075.849,00 |
166.161,00 |
0,00 |
|
|
B.5. Income from equity investment: |
0,00 |
422,00 |
18.476,00 |
0,00 |
0,00 |
|
|
a) In companies of
the group: |
0,00 |
422,00 |
18.476,00 |
0,00 |
0,00 |
|
|
b) In associated
companies: |
0,00 |
0,00 |
0,00 |
0,00 |
0,00 |
|
|
c) Third parties:
|
0,00 |
0,00 |
0,00 |
0,00 |
0,00 |
|
|
B.6. Income from other marketable
securities and long-term receivables: |
0,00 |
0,00 |
0,00 |
0,00 |
0,00 |
|
|
a) From companies of
the group: |
0,00 |
0,00 |
0,00 |
0,00 |
0,00 |
|
|
b) From associated
companies: |
0,00 |
0,00 |
0,00 |
0,00 |
0,00 |
|
|
c) From companies out
of the group: |
0,00 |
0,00 |
0,00 |
0,00 |
0,00 |
|
|
B.7. Miscellaneous interests or similar
income: |
292.872,00 |
368.261,00 |
2.839.437,00 |
342.450,00 |
185.546,00 |
|
|
a) From companies of
the group: |
260.566,00 |
359.504,00 |
301.103,00 |
336.522,00 |
183.832,00 |
|
|
b) From associated
companies: |
0,00 |
0,00 |
0,00 |
0,00 |
0,00 |
|
|
c) Miscellaneous
interests: |
32.306,00 |
8.757,00 |
18.185,00 |
5.928,00 |
1.714,00 |
|
|
d) Profit on
financial investment: |
0,00 |
0,00 |
2.520.149,00 |
0,00 |
0,00 |
|
|
B.8. Exchange positive differences: |
0,00 |
0,00 |
367.158,00 |
296.832,00 |
0,00 |
|
|
B.II. NEGATIVE FINANCIAL RESULTS (A.7+A.8+A.9-B.5-B.6-B.7-B.8):
|
634.161,00 |
943.102,00 |
0,00 |
702.233,00 |
1.022.323,00 |
|
|
B.III. LOSSES ON ORDINARY ACTIVITIES ( B.I + B.II - A.I - A.II
): |
476.229,00 |
947.204,00 |
824.027,00 |
868.394,00 |
0,00 |
|
|
B.9.Profit on disposal of both tangible
and intangible fixed assets and securities portfolio: |
32.917,00 |
180.831,00 |
29.240,00 |
236.819,00 |
0,00 |
|
|
B.10. Profit on transactions with own
shares and debentures: |
0,00 |
0,00 |
0,00 |
0,00 |
0,00 |
|
|
B.11. Capital grants transferred to profit
and loss: |
72.185,00 |
74.944,00 |
15.067,00 |
6.615,00 |
6.615,00 |
|
|
B.12. Extraordinary income: |
2.993,00 |
51.107,00 |
416.619,00 |
0,00 |
600,00 |
|
|
B.13. Income and profit of former
financial years: |
0,00 |
0,00 |
0,00 |
0,00 |
0,00 |
|
|
B.IV. NEGATIVE EXTRAORDINARY RESULTS (A.10+A.11+A.12+A.13+A.14-B.9-B.10-B.11-B.12-B.13):
|
0,00 |
0,00 |
0,00 |
0,00 |
0,00 |
|
|
B.V. LOSSES BEFORE TAXES (B.III+B.IV-A.III-A.IV): |
368.134,00 |
640.322,00 |
363.102,00 |
626.120,00 |
0,00 |
|
|
B.VI. RESULT OF THE PERIOD (LOSSES) (B.V+A.15+A.16): |
267.638,00 |
644.796,00 |
249.712,00 |
438.883,00 |
0,00 |
|
MERCANTILE REGISTRY.
CASHFLOW
STATEMENT
Model: Normal
>
Source of information: Data contained in this section is taken from the information
declared in the Annual Accounts submitted to the Trade Register.
|
|
2013 |
2012 |
2011 |
2010 |
2009 |
|
|
1.
Fiscal year result before taxes.: 61100 |
-368.134,00 |
-640.322,00 |
-363.102,00 |
-626.120,00 |
155.662,00 |
|
|
2.
Results adjustments.: 61200 |
1.729.639,00 |
1.742.684,00 |
-1.840.800,00 |
974.238,00 |
1.489.442,00 |
|
|
a) Fixed Assets Amortization (+).: 61201 |
1.116.618,00 |
1.055.356,00 |
480.427,00 |
515.439,00 |
473.733,00 |
|
|
d) Allocation of grants (-).: 61204 |
-72.185,00 |
-74.944,00 |
-15.067,00 |
-6.615,00 |
-6.615,00 |
|
|
e) Results on disposal of fixed assets (+/-). : 61205 |
-32.917,00 |
-180.831,00 |
-29.240,00 |
-236.819,00 |
0,00 |
|
|
f) Results on disposal of financial instruments (+/-).:
61206 |
0,00 |
0,00 |
-2.520.149,00 |
0,00 |
0,00 |
|
|
g) Financial income (-).: 61207 |
-292.872,00 |
-368.683,00 |
-337.764,00 |
-342.450,00 |
-185.546,00 |
|
|
h) Financial Expenses (+). : 61208 |
515.439,00 |
979.846,00 |
842.306,00 |
1.171.612,00 |
1.070.525,00 |
|
|
i) Exchange differences (+/-). : 61209 |
296.815,00 |
214.838,00 |
-367.158,00 |
-296.832,00 |
137.345,00 |
|
|
j) Reasonable Value Variation in Financial Instruments (+/-).:
61210 |
114.779,00 |
117.101,00 |
130.943,00 |
169.903,00 |
0,00 |
|
|
k) Other income and expense (-/+). : 61211 |
83.962,00 |
0,00 |
-25.099,00 |
0,00 |
0,00 |
|
|
3.
Changes in current capital equity.: 61300 |
1.943.665,00 |
3.258.669,00 |
3.641.586,00 |
7.530.093,00 |
-7.941.946,00 |
|
|
a) Stock (+/-).: 61301 |
-158.152,00 |
-1.771.697,00 |
1.390.012,00 |
-270.906,00 |
-1.492.006,00 |
|
|
d) Debtors and other accounts receivable (+/-). : 61302 |
766.922,00 |
-32.688,00 |
1.146.858,00 |
-1.002.777,00 |
1.407.642,00 |
|
|
c) Other current assets (+/-). : 61303 |
98.102,00 |
292.450,00 |
-2.313.597,00 |
3.400,00 |
137.271,00 |
|
|
d) Creditors and other accounts payable (+/-). : 61304 |
-1.253.053,00 |
892.083,00 |
3.418.313,00 |
9.180.304,00 |
-8.326.536,00 |
|
|
e) Other current liabilities (+/-).: 61305 |
2.489.845,00 |
3.878.521,00 |
0,00 |
-379.928,00 |
331.683,00 |
|
|
4.
Other cash flows for operating activities.: 61400 |
-513.644,00 |
-733.460,00 |
-445.729,00 |
-925.506,00 |
-826.236,00 |
|
|
a) Interest payments (-). : 61401 |
-367.045,00 |
-614.275,00 |
-496.973,00 |
-750.806,00 |
-976.293,00 |
|
|
b) Dividend payment collection (+). : 61402 |
0,00 |
422,00 |
18.476,00 |
0,00 |
0,00 |
|
|
c) Interest collection (+). : 61403 |
1.621,00 |
8.757,00 |
163.628,00 |
5.928,00 |
109.410,00 |
|
|
d) Income tax payment collection (payments) (+/-).: 61404 |
-6.509,00 |
-11.262,00 |
83,00 |
-10.725,00 |
40.647,00 |
|
|
e) Other payments (payment collection) (-/+) : 61405 |
-141.711,00 |
-117.101,00 |
-130.943,00 |
-169.903,00 |
0,00 |
|
|
5.
Operating activity cash flows (1 + 2 + 3 + 4) : 61500 |
2.791.525,00 |
3.627.570,00 |
991.956,00 |
6.952.705,00 |
-7.123.078,00 |
|
|
6.
Payments for investment (-).: 62100 |
-1.049.553,00 |
-1.411.457,00 |
-131.457,00 |
-6.508.513,00 |
-2.826.409,00 |
|
|
a) Companies of the group and affiliates. : 62101 |
0,00 |
0,00 |
0,00 |
-4.948.153,00 |
0,00 |
|
|
b) Intangible fixed assets. : 62102 |
-460.960,00 |
0,00 |
-68.704,00 |
-1.318.574,00 |
-1.058.671,00 |
|
|
c) Fixed assets. : 62103 |
-588.593,00 |
-1.211.457,00 |
-49.054,00 |
-241.786,00 |
-819.392,00 |
|
|
e) Other financial assets. : 62105 |
0,00 |
-200.000,00 |
-13.699,00 |
0,00 |
-948.347,00 |
|
|
7.
Divestment payment collection (+). : 62200 |
76.000,00 |
251.964,00 |
52.497,00 |
679.085,00 |
1.550,00 |
|
|
a) Companies of the group and affiliates. : 62201 |
0,00 |
0,00 |
1.488,00 |
0,00 |
0,00 |
|
|
c) Fixed assets. : 62203 |
26.000,00 |
251.964,00 |
51.008,00 |
679.085,00 |
900,00 |
|
|
e) Other financial assets. : 62205 |
50.000,00 |
0,00 |
0,00 |
0,00 |
650,00 |
|
|
8.
Investment activity cash flows (6 + 7) minus Amortization: 62300 |
-973.553,00 |
-1.159.493,00 |
-78.960,00 |
-5.829.428,00 |
-2.824.859,00 |
|
|
9.
Payment collection and payments for equity instruments. : 63100 |
140.045,00 |
0,00 |
34.121,00 |
79.417,00 |
0,00 |
|
|
e) Grants, donations and bequests received (+). : 63105 |
140.045,00 |
0,00 |
34.121,00 |
79.417,00 |
0,00 |
|
|
10.
Payment collection and payments for financial liabilities instruments.:
63200 |
-1.503.016,00 |
-2.620.675,00 |
-2.264.197,00 |
-1.409.381,00 |
11.702.389,00 |
|
|
a) Issuance : 63201 |
51.778,00 |
0,00 |
0,00 |
211.289,00 |
21.598.297,00 |
|
|
2. Debts incurred with credit institutions (+). : 63203 |
0,00 |
0,00 |
0,00 |
211.289,00 |
14.956.522,00 |
|
|
3. Debts incurred with companies of the group and affiliates
(+).: 63204 |
0,00 |
0,00 |
0,00 |
0,00 |
6.641.775,00 |
|
|
5. Other debts (+). : 63206 |
51.778,00 |
0,00 |
0,00 |
0,00 |
0,00 |
|
|
b) Repayment and amortization of : 63207 |
-1.554.794,00 |
-2.620.675,00 |
-2.264.197,00 |
-1.620.669,00 |
-9.895.908,00 |
|
|
2. Debts incurred with credit institutions (-).: 63209 |
-1.509.375,00 |
-2.620.675,00 |
-2.264.197,00 |
-1.620.669,00 |
-9.895.908,00 |
|
|
5. Other debts (-). : 63212 |
-45.419,00 |
0,00 |
0,00 |
0,00 |
0,00 |
|
|
11.
Payments from dividends and remunerations from other assets instruments. :
63300 |
0,00 |
0,00 |
0,00 |
0,00 |
0,00 |
|
|
12.
Cash flows for financing activities (9+10+11).: 63400 |
-1.362.972,00 |
-2.620.675,00 |
-2.230.076,00 |
-1.329.964,00 |
11.702.389,00 |
|
|
D)
EFFECT OF EXCHANGE RATE CHANGES: 64000 |
0,00 |
0,00 |
0,00 |
0,00 |
0,00 |
|
|
E)
NET INCREASE/DECREASE OF CASH OR EQUIVALENT ASSETS (+/-5+/-8+/12+/-D) :
65000 |
455.001,00 |
-152.598,00 |
-1.317.080,00 |
-206.687,00 |
1.754.452,00 |
|
|
Cash or equivalent assets as of beginning of the fiscal year.:
65100 |
218.508,00 |
371.106,00 |
1.688.186,00 |
1.894.873,00 |
140.421,00 |
|
|
Cash or equivalent assets as of end of the fiscal year.:
65200 |
673.509,00 |
218.508,00 |
371.106,00 |
1.688.186,00 |
1.894.873,00 |
|
FINANCIAL
DIAGNOSIS
> Economic-Financial Comparative Analysis
Data used in the following ratios and indicators is taken from the Annual Accounts submitted by the company to the TRADE REGISTER.
> Comparison within the Sector
|
Cash
Flow |
2013 |
2012 |
Variación 2013 - 2012 |
|
|||
|
|
Empresa |
Sector |
Empresa |
Sector |
Empresa |
Sector |
|
|
Cash
Flow over Sales: |
0,04 % |
0,01 % |
-0,01 % |
0,01 % |
373,19 % |
109,67 % |
|
|
EBITDA
over Sales: |
9,93 % |
11,36 % |
8,94 % |
9,02 % |
11,08 % |
26,01 % |
|
|
Cash
Flow Yield: |
0,01 % |
0,01 % |
0,00 % |
0,00 % |
|
|
|
|
Profitability |
2013 |
2012 |
Variación 2013 - 2012 |
|
|||
|
|
Empresa |
Sector |
Empresa |
Sector |
Empresa |
Sector |
|
|
Operating
economic profitability: |
1,54 % |
6,91 % |
1,40 % |
4,94 % |
9,97 % |
39,79 % |
|
|
Total
economic profitability: |
0,33 % |
3,76 % |
0,71 % |
2,31 % |
-53,21 % |
62,70 % |
|
|
Financial
profitability: |
-4,87 % |
4,23 % |
-11,19 % |
0,82 % |
56,47 % |
413,12 % |
|
|
Margin:
|
1,98 % |
6,73 % |
2,11 % |
4,62 % |
-6,33 % |
45,51 % |
|
|
Mark-up:
|
-2,79 % |
4,49 % |
-5,80 % |
1,23 % |
51,90 % |
266,03 % |
|
|
Solvency |
2013 |
2012 |
Variación 2013 - 2012 |
|
|||
|
|
Empresa |
Sector |
Empresa |
Sector |
Empresa |
Sector |
|
|
Liquidity:
|
0,05 |
0,13 |
0,01 |
0,12 |
504,44 |
15,14 |
|
|
Acid
Test: |
0,45 |
0,87 |
0,54 |
0,85 |
-16,15 |
1,88 |
|
|
Working
Capital / Investment: |
-0,05 |
0,05 |
-0,14 |
0,03 |
66,56 |
86,68 |
|
|
Solvency:
|
0,92 |
1,18 |
0,77 |
1,17 |
19,37 |
0,47 |
|
|
Indebtedness |
2013 |
2012 |
Variación 2013 - 2012 |
|
|||
|
|
Empresa |
Sector |
Empresa |
Sector |
Empresa |
Sector |
|
|
Indebtedness
level: |
6,77 |
1,37 |
7,09 |
1,62 |
-4,43 |
-15,35 |
|
|
Borrowing
Composition: |
1,97 |
1,00 |
0,65 |
1,02 |
204,65 |
-2,55 |
|
|
Repayment
Ability: |
85,16 |
90,25 |
-275,92 |
197,82 |
130,86 |
-54,38 |
|
|
Warranty:
|
1,15 |
1,74 |
1,14 |
1,62 |
0,75 |
7,03 |
|
|
Generated
resources / Total creditors: |
0,02 |
0,08 |
0,01 |
0,07 |
124,71 |
26,18 |
|
|
Efficiency |
2013 |
2012 |
Variación 2013 - 2012 |
|
|||
|
|
Empresa |
Sector |
Empresa |
Sector |
Empresa |
Sector |
|
|
Productivity:
|
1,47 |
1,85 |
1,35 |
1,70 |
8,76 |
8,71 |
|
|
Turnover
of Collection Rights : |
5,06 |
5,00 |
2,93 |
4,78 |
72,56 |
4,60 |
|
|
Turnover
of Payment Entitlements: |
3,54 |
3,64 |
2,92 |
3,51 |
20,90 |
3,56 |
|
|
Stock
rotation: |
2,65 |
7,34 |
2,48 |
6,47 |
6,70 |
13,41 |
|
|
Assets
turnover: |
0,78 |
1,03 |
0,66 |
1,07 |
17,40 |
-3,93 |
|
|
Borrowing
Cost: |
1,33 |
2,86 |
2,33 |
2,95 |
-42,84 |
-3,04 |
|
>
Trend of indicators under the General Accounting Plan of 2007 (2013, 2012,
2011, 2010, 2009)
|
Cash
Flow |
2013 |
2012 |
2011 |
2010 |
2009 |
|
|
Cash
Flow over Sales: |
0,04 % |
-0,01 % |
-0,14 % |
-0,01 % |
0,13 % |
|
|
EBITDA
over Sales: |
9,93 % |
8,94 % |
-26,85 % |
2,26 % |
12,08 % |
|
|
Cash
Flow Yield: |
0,01 % |
0,00 % |
-0,03 % |
0,00 % |
0,04 % |
|
|
Profitability |
2013 |
2012 |
2011 |
2010 |
2009 |
|
|
Operating
economic profitability: |
1,54 % |
1,40 % |
-18,43 % |
0,38 % |
6,55 % |
|
|
Total
economic profitability: |
0,33 % |
0,71 % |
1,04 % |
1,12 % |
2,87 % |
|
|
Financial
profitability: |
-4,87 % |
-11,19 % |
-3,90 % |
-6,59 % |
10,83 % |
|
|
Margin:
|
1,98 % |
2,11 % |
-30,81 % |
0,46 % |
7,72 % |
|
|
Mark-up:
|
-2,79 % |
-5,80 % |
-7,93 % |
-3,69 % |
1,02 % |
|
|
Solvency |
2013 |
2012 |
2011 |
2010 |
2009 |
|
|
Liquidity:
|
0,05 |
0,01 |
0,02 |
0,06 |
0,09 |
|
|
Acid
Test: |
0,45 |
0,54 |
0,67 |
0,43 |
0,32 |
|
|
Working
Capital / Investment: |
-0,05 |
-0,14 |
-0,08 |
-0,27 |
-0,24 |
|
|
Solvency:
|
0,92 |
0,77 |
0,87 |
0,60 |
0,56 |
|
|
Indebtedness |
2013 |
2012 |
2011 |
2010 |
2009 |
|
|
Indebtedness
level: |
6,77 |
7,09 |
5,85 |
6,03 |
4,62 |
|
|
Borrowing
Composition: |
1,97 |
0,65 |
0,94 |
0,38 |
0,65 |
|
|
Repayment
Ability: |
85,16 |
-275,92 |
-30,01 |
-203,49 |
19,37 |
|
|
Warranty:
|
1,15 |
1,14 |
1,17 |
1,16 |
1,21 |
|
|
Generated
resources / Total creditors: |
0,02 |
0,01 |
-0,06 |
0,00 |
0,04 |
|
|
Efficiency |
2013 |
2012 |
2011 |
2010 |
2009 |
|
|
Productivity:
|
1,47 |
1,35 |
0,00 |
1,11 |
1,52 |
|
|
Turnover
of Collection Rights : |
5,06 |
2,93 |
2,53 |
3,16 |
3,97 |
|
|
Turnover
of Payment Entitlements: |
3,54 |
2,92 |
4,65 |
3,04 |
1,21 |
|
|
Stock
rotation: |
2,65 |
2,48 |
4,26 |
3,87 |
3,39 |
|
|
Assets
turnover: |
0,78 |
0,66 |
0,60 |
0,83 |
0,85 |
|
|
Borrowing
Cost: |
1,33 |
2,33 |
2,13 |
2,79 |
3,03 |
|
COMPARATIVE
SECTORIAL BALANCE
Sector-based Comparison under the rules
of the New General Accounting Plan.
|
|
Variación - |
|
|
|
Empresa |
Sector |
|
|
Variación - |
|
|
|
Empresa |
Sector |
|
|
Variación - |
|
|
|
Empresa |
Sector |
News
--
Public
Tenders and Works Won
No Public Tenders
assigned to the name of the company.
Detail of Subsidies appearing in Balances Memories
|
Entity |
ORGANISMO NO ESPECIFICADO |
|
Subsidy Concept |
Subvención de capital |
|
Status |
CONCEDIDA |
|
Amount Granted |
79.391,20 |
|
Notes |
saldo al 31/12/2013 |
|
Entity |
ORGANISMO NO ESPECIFICADO |
|
Subsidy Concept |
Subvención de explotación |
|
Status |
CONCEDIDA |
|
Amount Granted |
72.185,22 |
|
Notes |
El importe corresponde al imputado a resultados
del ejercicio. |
|
Entity |
CONSELLERIA DE INNOVACION E INDUSTRIA |
|
Subsidy Concept |
Subvención de capital |
|
Status |
CONCEDIDA |
|
Amount Granted |
28.840,00 |
|
Notes |
El importe corresponde al imputado a resultados
del ejercicio. |
|
Entity |
CONSELLERIA DE INNOVACION E INDUSTRIA |
|
Subsidy Concept |
Subvención de capital |
|
Status |
CONCEDIDA |
|
Amount Granted |
12.149,86 |
|
Notes |
El importe corresponde al imputado a resultados
del ejercicio. |
|
Entity |
CONSELLERIA DE INNOVACION E INDUSTRIA |
|
Subsidy Concept |
Subvención de capital |
|
Status |
CONCEDIDA |
|
Amount Granted |
9.290,85 |
|
Notes |
El importe corresponde al imputado a resultados
del ejercicio. |
|
Entity |
CONSELLERIA DE INNOVACION E INDUSTRIA |
|
Subsidy Concept |
Subvención de capital |
|
Status |
CONCEDIDA |
|
Amount Granted |
9.258,69 |
|
Notes |
El importe corresponde al imputado a resultados
del ejercicio. |
|
Entity |
CENTRO PARA EL DESARROLLO TECNOLOGICO INDUSTRIAL |
|
Subsidy Concept |
Subvención de capital |
|
Status |
CONCEDIDA |
|
Amount Granted |
8.235,82 |
|
Notes |
El importe corresponde al imputado a resultados
del ejercicio. |
|
Entity |
CONSELLERIA DE INNOVACION E INDUSTRIA |
|
Subsidy Concept |
no especificSubvención de capital |
|
Status |
CONCEDIDA |
|
Amount Granted |
4.410,00 |
|
Notes |
El importe corresponde al imputado a resultados
del ejercicio. |
|
Entity |
CONSELLERIA DE ECONOMIA E INDUSTRIA |
|
Subsidy Concept |
Subvención de explotación |
|
Status |
CONCEDIDA |
|
Amount Granted |
49.504,00 |
|
Notes |
El importe corresponde al imputado a resultados
del ejercicio. |
|
Entity |
CONSELLERIA DE ECONOMIA E INDUSTRIA |
|
Subsidy Concept |
Subvención de explotación. |
|
Status |
CONCEDIDA |
|
Amount Granted |
7.237,50 |
|
Notes |
El importe corresponde al imputado a resultados
del ejercicio. |
|
Entity |
CONSELLERIA DE INNOVACION E INDUSTRIA |
|
Subsidy Concept |
no especificSubvención de capital |
|
Status |
CONCEDIDA |
|
Amount Granted |
6.615,00 |
|
Notes |
El importe corresponde al imputado a resultados
del ejercicio. |
|
Entity |
INSTITUTO GALLEGO DE PROMOCION ECONOMICA |
|
Subsidy Concept |
Subvención de capital |
|
Status |
CONCEDIDA |
|
Amount Granted |
111.222,30 |
|
Notes |
El importe es el saldo al 31/12/2011. |
|
Entity |
CONSELLERIA DE INNOVACION E INDUSTRIA |
|
Subsidy Concept |
Subvención de capital |
|
Status |
CONCEDIDA |
|
Amount Granted |
100.940,00 |
|
Notes |
El importe es el saldo al 31/12/2011 |
|
Entity |
CONSELLERIA DE INNOVACION E INDUSTRIA |
|
Subsidy Concept |
Subvención de capital |
|
Status |
CONCEDIDA |
|
Amount Granted |
42.734,18 |
|
Notes |
El importe es el saldo al 31/12/2011 |
|
Entity |
CONSELLERIA DE INNOVACION E INDUSTRIA |
|
Subsidy Concept |
Subvención de capital |
|
Status |
CONCEDIDA |
|
Amount Granted |
32.405,39 |
|
Notes |
El importe es el saldo al 31/12/2011. |
|
Entity |
CONSELLERIA DE INNOVACION E INDUSTRIA |
|
Subsidy Concept |
Subvención de capital. |
|
Status |
CONCEDIDA |
|
Amount Granted |
23.884,55 |
|
Notes |
El importe corresponde al saldo al 31/12/2011. |
|
Entity |
CONSELLERIA DE INNOVACION E INDUSTRIA |
|
Subsidy Concept |
Subvención de explotación. |
|
Status |
CONCEDIDA |
|
Amount Granted |
17.598,00 |
|
Notes |
El importe corresponde al imputado a resultados
del ejercicio. |
|
Entity |
CENTRO PARA EL DESARROLLO TECNOLOGICO INDUSTRIAL |
|
Subsidy Concept |
Subvención de capital |
|
Status |
CONCEDIDA |
|
Amount Granted |
8.451,54 |
|
Notes |
El importe corresponde al imputado a resultados
del ejercicio. |
|
Entity |
CONSELLERIA DE INNOVACION E INDUSTRIA |
|
Subsidy Concept |
Subvención de capital |
|
Status |
CONCEDIDA |
|
Amount Granted |
6.615,00 |
|
Notes |
El importe corresponde al imputado a resultados
del ejercicio. |
|
Entity |
CENTRO PARA EL DESARROLLO TECNOLOGICO INDUSTRIAL |
|
Subsidy Concept |
Subvención de capital |
|
Status |
CONCEDIDA |
|
Amount Granted |
39.108,79 |
|
Notes |
El importe es el saldo al 31-12-2010 |
|
Entity |
CONSELLERIA DE INNOVACION E INDUSTRIA |
|
Subsidy Concept |
Subvención de capital |
|
Status |
CONCEDIDA |
|
Amount Granted |
16.482,84 |
|
Notes |
El importe es el saldo al 31-12-2010 |
|
Entity |
CONSELLERIA DE INNOVACION E INDUSTRIA |
|
Subsidy Concept |
Subvención de explotación. |
|
Status |
CONCEDIDA |
|
Amount Granted |
192.986,79 |
|
Entity |
MINISTERIO DE INDUSTRIA |
|
Subsidy Concept |
Subvención de explotación. |
|
Status |
CONCEDIDA |
|
Amount Granted |
6.615,00 |
|
Notes |
El importe es el traspaso a resultados. |
|
Entity |
MINISTERIO DE INDUSTRIA |
|
Subsidy Concept |
Subvención de explotación. |
|
Status |
CONCEDIDA |
|
Amount Granted |
96.258,00 |
|
Entity |
CONSELLERIA DE INNOVACION E INDUSTRIA |
|
Subsidy Concept |
Subvención de explotación. |
|
Status |
CONCEDIDA |
|
Amount Granted |
44.100,00 |
|
Entity |
ORGANISMO NO ESPECIFICADO |
|
Subsidy Concept |
Subvención de explotación. |
|
Status |
CONCEDIDA |
|
Amount Granted |
26,91 |
|
Entity |
ORGANISMO NO ESPECIFICADO |
|
Subsidy Concept |
Subvención de explotación. |
|
Status |
CONCEDIDA |
|
Amount Granted |
1.190,42 |
|
Entity |
ORGANISMO NO ESPECIFICADO |
|
Subsidy Concept |
SUBVENCION A LA EXPLOTACION |
|
Status |
CONCEDIDA |
|
Amount Granted |
509,97 |
Research
Summary
This partnership was registered a few years ago, which provides it enough experience in its sector and whose activity enjoys great prestige among the information sources checked. The billing increased 9,14% in 2013 as compared to the previous year. It shows a negative working capital; therefore the partnership would not meet the short-term payment commitments.
Sources
Registry of Commerce's
Official Gazette. Own and external data bases Company References
FOREIGN EXCHANGE RATES
|
Currency |
Unit
|
Indian Rupees |
|
US Dollar |
1 |
Rs.63.76 |
|
UK Pound |
1 |
Rs.99.60 |
|
Euro |
1 |
Rs.69.71 |
INFORMATION DETAILS
|
Analysis Done by
: |
DIV |
|
|
|
|
Report Prepared
by : |
VNT |
RATING EXPLANATIONS
|
RATING |
STATUS |
PROPOSED CREDIT LINE |
|
|
|
>86 |
Aaa |
Possesses an extremely sound financial base with the strongest capability
for timely payment of interest and principal sums |
Unlimited |
|
|
71-85 |
Aa |
Possesses adequate working capital. No caution needed for credit
transaction. It has above average (strong) capability for payment of interest
and principal sums |
Large |
|
|
56-70 |
A |
Financial & operational base are regarded healthy. General
unfavourable factors will not cause fatal effect. Satisfactory capability for
payment of interest and principal sums |
Fairly Large |
|
|
41-55 |
Ba |
Overall operation is considered normal. Capable to meet normal
commitments. |
Satisfactory |
|
|
26-40 |
B |
Capability to overcome financial difficulties seems comparatively
below average. |
Small |
|
|
11-25 |
Ca |
Adverse factors are apparent. Repayment of interest and principal sums
in default or expected to be in default upon maturity |
Limited with
full security |
|
|
<10 |
C |
Absolute credit risk exists. Caution needed to be exercised |
Credit not
recommended |
|
|
-- |
NB |
New Business |
-- |
|
This score serves as a reference to assess
SC’s credit risk and to set the amount of credit to be extended. It is
calculated from a composite of weighted scores obtained from each of the major sections
of this report. The assessed factors and their relative weights (as indicated
through %) are as follows:
Financial
condition (40%) Ownership
background (20%) Payment
record (10%)
Credit history
(10%) Market trend (10%) Operational size
(10%)
This report is issued at your request without any risk
and responsibility on the part of MIRA INFORM PRIVATE LIMITED (MIPL) or its
officials.