MIRA INFORM REPORT
|
Report No. : |
335662 |
|
Report Date : |
08.08.2015 |
IDENTIFICATION DETAILS
|
Name : |
WE EUROPE B.V. |
|
|
|
|
Registered Office : |
Reactorweg 101 3542AD Utrecht |
|
|
|
|
Country : |
Netherlands |
|
|
|
|
Financials (as on) : |
31.01.2014 |
|
|
|
|
Date of Incorporation : |
08.12.1977 |
|
|
|
|
Com. Reg. No.: |
KvK-nummer: 30089877 |
|
|
|
|
Legal Form : |
Private Company |
|
|
|
|
Line of Business : |
Holding Companies [We tried to confirm / obtain the detailed activity but the same is
not available from any sources] |
|
|
|
|
No. of Employees : |
Not Available |
RATING & COMMENTS
|
MIRA’s Rating : |
Ba |
|
RATING |
STATUS |
PROPOSED CREDIT LINE |
|
|
41-55 |
Ba |
Overall operation is considered normal. Capable to meet normal
commitments. |
Satisfactory |
|
Status : |
Satisfactory |
|
|
|
|
Payment Behaviour : |
Slow but correct |
|
|
|
|
Litigation : |
Clear |
NOTES:
Any query related to this report can be made
on e-mail: infodept@mirainform.com
while quoting report number, name and date.
ECGC Country Risk Classification List – March 31, 2015
|
Country Name |
Previous Rating (31.12.2014) |
Current Rating (31.03.2015) |
|
Netherlands |
A1 |
A1 |
|
Risk Category |
ECGC
Classification |
|
Insignificant |
A1 |
|
Low |
A2 |
|
Moderate |
B1 |
|
High |
B2 |
|
Very High |
C1 |
|
Restricted |
C2 |
|
Off-credit |
D |
NETHERLANDS - ECONOMIC OVERVIEW
The Netherlands, the sixth-largest economy in the European Union, plays an important role as a European transportation hub, with a persistently high trade surplus, stable industrial relations, and moderate unemployment. Industry focuses on food processing, chemicals, petroleum refining, and electrical machinery. A highly mechanized agricultural sector employs only 2% of the labor force but provides large surpluses for food-processing and underpins the country’s status as the world’s second largest agricultural exporter. The Netherlands is part of the Eurozone, and as such, its monetary policy is controlled by the European Central Bank. The Dutch financial sector is highly concentrated, with four commercial banks possessing over 90% of banking assets. The sector suffered as a result of the global financial crisis and required billions of dollars of government support, but the European Banking Authority completed stringent reviews in 2014 and deemed Dutch banks to be well-capitalized. To address the 2009 and 2010 economic downturns, the government sought to stimulate the domestic economy by accelerating infrastructure programs, offering corporate tax breaks for employers to retain workers, and expanding export credits. The stimulus programs and bank bailouts, however, resulted in a government budget deficit of 5.3% of GDP in 2010 that contrasted sharply with a surplus of 0.7% in 2008. The government of Prime Minister Mark RUTTE has since implemented significant austerity measures to improve public finances and has instituted broad structural reforms in key policy areas, including the labor market, the housing sector, the energy market, and the pension system. As a result, the government budget deficit at the end of 2014 dropped to 1.8% of GDP. Following a protracted recession during which unemployment doubled to 7.4% and household consumption contracted for nearly three consecutive years, the year 2014 saw fragile GDP growth of 0.8 percent and a rise in most economic indicators. Drivers of growth included increased exports and business investments, as well as newly invigorated household consumption.
|
Source
: CIA |
Company
summary
Company name WE
Europe B.V.
Operative address Reactorweg 101
3542AD Utrecht
Netherlands
Legal form Private Company
Registration number KvK-nummer:
30089877
VAT-number 004221254
|
Year |
2014 |
Mutation |
2013 |
Mutation |
2012 |
|
Fixed assets |
398.988.000 |
-14,21 |
465.093.000 |
-8,36 |
507.547.000 |
|
Total receivables |
13.358.000 |
-63,78 |
36.877.000 |
-33,41 |
55.379.000 |
|
Total equity |
87.315.000 |
-15,96 |
103.891.000 |
-6,91 |
111.607.000 |
|
Short term liabilities |
97.779.000 |
-28,54 |
136.825.000 |
-48,92 |
267.862.000 |
|
Net result |
7.317.000 |
49,82 |
4.884.000 |
106,52 |
-74.941.000 |
|
Working capital |
-33.678.000 |
-6,03 |
-31.764.000 |
75,99 |
-132.292.000 |
|
Quick ratio |
0,37 |
|
0,37 |
37,04 |
0,27 |
Contact
information
Company name WE Europe B.V.
Trade names WE Fashion
WE Europe B.V.
Operative address Reactorweg 101
3542AD Utrecht
Netherlands
Correspondence address Postbus 30200
3503AD Utrecht
Netherlands
Telephone number 0302479479
Email address youri.hijlarides@we.nl
Registration
Registration number KvK-nummer:
30089877
Branch number 000018922651
VAT-number 004221254
Status Active
First registration company register 1977-12-08
Memorandum 1977-12-08
Establishment date 1977-12-08
Legal form Private Company
Last proposed admendment 2014-01-23
Issued placed capital EUR 2.268.900
Paid up share capital EUR 2.268.900
Activities
SBI Holding companies
(not financial) (70102)
Exporter No
Importer No
Goal Houdstermaatschappij
Relations
Shareholders Logo
International B.V.
Minervum 7032
4817ZL BREDA
Netherlands
Registration number: 302198020000
Percentage: 100%
Liability statements WE
International B.V.
Reactorweg 101
3542AD UTRECHT
Netherlands
Registration number: 300912610000
date of issue: 1995-02-13
Starting date: 1986-01-01
Bank
details
Accounts ABN
Amro Bank NV
Account number: NL43ABNA0243109237
BIC: ABNANL2A
Management
Active management Logo International
B.V.
Minervum 7032
4817ZL BREDA
Netherlands
Registration number: 302198020000
Competence: Jointly authorized
Function: Manager
Starting date: 2007-05-01
G.A.T. Aperghis (George Alexander Theodore)
Netherlands
Competence: Jointly authorized
Function: Manager
Starting date: 2015-01-15
Date of birth: 1968-04-14, Middlesborough,
GB
A.M. Andersson (Anders Mikael)
Netherlands
Competence: Jointly authorized
Function: Manager
Starting date: 2015-01-15
Date of birth: 1970-04-10, Nikolai, SE
R. de Waal (Ronald)
Netherlands
Function: Commissaris
Starting date: 1997-09-03
Date of birth: 1952-02-13, Bussum, NL
Involved with the following companies
• WE International B.V.
Reactorweg 101
3542AD UTRECHT
Netherlands
Registration number: 300912610000
Function: Commissaris
• Boardco B.V.
Oosteinde 32
2361HE WARMOND
Netherlands
Registration number: 201316240000
Function: Commissaris
J.F. Balkema (Jan Fokko)
Netherlands
Function: Commissaris
Starting date: 1998-09-28
Date of birth: 1947-09-01, Amsterdam, NL
Involved with the following companies
• WE International B.V.
Reactorweg 101
3542AD UTRECHT
Netherlands
Registration number: 300912610000
Function: Commissaris
• Boardco B.V.
Oosteinde 32
2361HE WARMOND
Netherlands
Registration number: 201316240000
Function: Commissaris
M.R. Borletti (Maurizio Romualdo)
Netherlands
Function: Commissaris
Starting date: 2008-09-23
Date of birth: 1967-06-06, Milaan, IT
Involved with the following companies
• Boardco B.V.
Oosteinde 32
2361HE WARMOND
Netherlands
Registration number: 201316240000
Function: Commissaris
D.Y.J.F. du Monceau de Bergendal (Diego Yves
Jean Francois)
Netherlands
Function: Commissaris
Starting date: 2001-10-09
Date of birth: 1949-09-13, Brussel, BE
Involved with the following companies
• WE International B.V.
Reactorweg 101
3542AD UTRECHT
Netherlands
Registration number: 300912610000
Function: Commissaris
• Boardco B.V.
Oosteinde 32
2361HE WARMOND
Netherlands
Registration number: 201316240000
Function: Commissaris
G.A.T. Aperghis (George Alexander Theodore)
Netherlands
Competence: Limited authorization
Function: Proxy
Starting date: 2015-01-15
Date of birth: 1968-04-14, Middlesborough,
GB
A.M. Andersson (Anders Mikael)
Netherlands
Competence: Limited authorization
Function: Proxy
Starting date: 2015-01-15
Date of birth: 1970-04-10, Nikolai, SE
Employees
Total according to the Chamber of Commerce 0
|
Year |
2015 |
2014 |
2012 |
|
Total |
0 |
0 |
1 |

Payments
Description Payments are made
regularly with some delay
Key
figures
|
Year |
2014 |
2013 |
2012 |
2011 |
2010 |
|
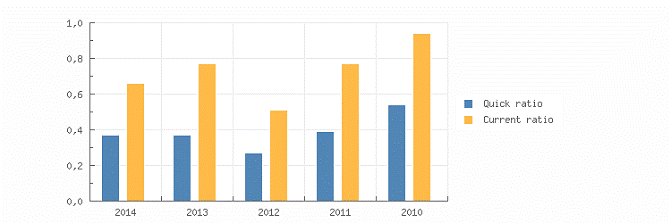
Quick ratio |
0,37 |
0,37 |
0,27 |
0,39 |
0,54 |
|
Current ratio |
0,66 |
0,77 |
0,51 |
0,77 |
0,94 |
|
|
|||||
|
Working capital/
balance total |
-0,07 |
-0,06 |
-0,21 |
-0,06 |
-0,01 |
|
Equity / balance
total |
0,19 |
0,18 |
0,17 |
0,26 |
0,30 |
|
Equity / Fixed
assets |
0,22 |
0,22 |
0,22 |
0,32 |
0,38 |
|
Equity /
liabilities |
0,23 |
0,22 |
0,21 |
0,35 |
0,42 |
|
Balance total /
liabilities |
1,23 |
1,22 |
1,21 |
1,35 |
1,42 |
|
|
|||||
|
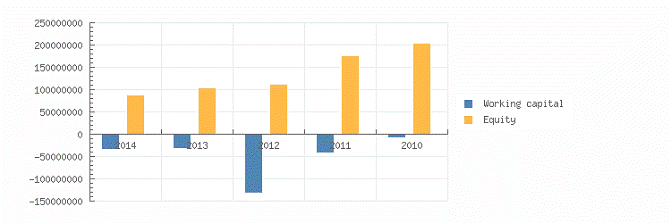
Working capital |
-33.678.000 |
-31.764.000 |
-132.292.000 |
-41.355.000 |
-8.933.000 |
|
Equity |
87.315.000 |
103.891.000 |
111.607.000 |
176.804.000 |
204.235.000 |
|
Mutation equity |
-15,96 |
-6,91 |
-36,88 |
-13,43 |
4,73 |
|
Mutation short
term liabilities |
-28,54 |
-48,92 |
49,31 |
12,35 |
-11,64 |
|
|
|||||
|
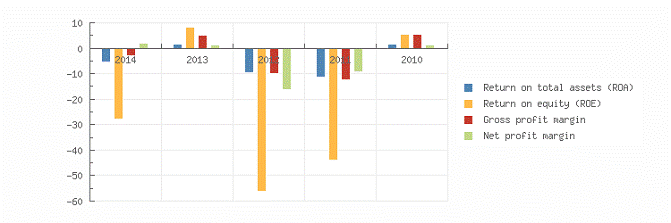
Return on total
assets (ROA) |
-5,25 |
1,53 |
-9,75 |
-11,32 |
1,57 |
|
Return on equity
(ROE) |
-27,83 |
8,41 |
-56,16 |
-43,74 |
5,29 |
|
Gross profit
margin |
-2,94 |
5,17 |
-9,81 |
-12,38 |
5,35 |
|
Net profit margin |
1,87 |
1,14 |
-16,31 |
-9,22 |
1,34 |
|
|
|||||
|
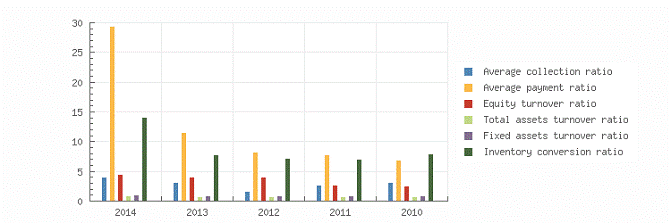
Average
collection ratio |
4,01 |
3,12 |
1,72 |
2,65 |
3,19 |
|
Average payment
ratio |
29,36 |
11,58 |
8,30 |
7,80 |
6,85 |
|
Equity turnover
ratio |
4,49 |
4,11 |
4,12 |
2,68 |
2,49 |
|
Total assets
turnover ratio |
0,85 |
0,75 |
0,71 |
0,69 |
0,74 |
|
Fixed assets
turnover ratio |
0,98 |
0,92 |
0,91 |
0,87 |
0,95 |
|
Inventory
conversion ratio |
14,04 |
7,80 |
7,26 |
7,04 |
7,88 |
|
Year |
2014 |
2013 |
2012 |
2011 |
2010 |
|
Gross margin |
173.299.000 |
185.070.000 |
187.902.000 |
187.551.000 |
216.041.000 |
|
Operating result |
-11.541.000 |
22.081.000 |
-45.064.000 |
-58.778.000 |
27.221.000 |
|
Net result after taxes |
7.317.000 |
4.884.000 |
-74.941.000 |
-43.768.000 |
6.817.000 |
|
|
|||||
|
Gross profit |
|
426.886.000 |
|
|
509.076.000 |
|
EBIT |
-11.541.000 |
22.081.000 |
-45.064.000 |
-58.778.000 |
27.221.000 |
Summary
The 2014 financial result structure is a negative working captial of -33.678.000 euro, which is in agreement with -7 % of the total assets of the company.
The working capital has diminished with -6.03 % compared to previous year. The ratio, with respect to the total assets of the company has however, declined.
The deterioration between 2013 and 2014 has mainly been caused by an increase of the current liabilities.
The current ratio of the company in 2014 was 0.66. When the current ratio is below 1.5, the company may have problems meeting its short-term obligations.
The quick ratio in 2014 of the company was 0.37. A company with a Quick Ratio of less than 1 cannot currently pay back its current liabilities.
The 2013 financial result structure is a negative working captial of -31.764.000 euro, which is in agreement with -6 % of the total assets of the company.
The working capital has increased with 75.99 % compared to previous year. The ratio, with respect to the total assets of the company has however, increased.
The improvement between 2012 and 2013 has mainly been caused by an increase of the current assets.
The current ratio of the company in 2013 was 0.77. When the current ratio is below 1.5, the company may have problems meeting its short-term obligations.
The quick ratio in 2013 of the company was 0.37. A company with a Quick Ratio of less than 1 cannot currently pay back its current liabilities.
Financial
statement
Last annual account 2014
Remark annual
account The financial statements
shown in the report relate to the consolidated financial statements of the
group.
Type of annual account Consolidated
Annual account WE
International B.V.
Reactorweg 101
3542AD UTRECHT
Netherlands
Registration number: 300912610000
Balance
|
Year |
2014 |
2013 |
2012 |
2011 |
2010 |
|
End date |
2014-01-31 |
2013-01-31 |
2012-01-31 |
2011-01-31 |
2010-01-31 |
|
Intangible fixed
assets |
6.506.000 |
83.798.000 |
93.184.000 |
124.787.000 |
131.075.000 |
|
Tangible fixed assets |
348.862.000 |
363.751.000 |
395.331.000 |
399.164.000 |
381.863.000 |
|
Financial fixed
assets |
43.620.000 |
17.544.000 |
19.032.000 |
20.972.000 |
23.120.000 |
|
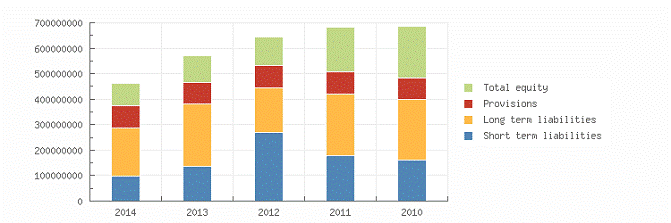
Fixed assets |
398.988.000 |
465.093.000 |
507.547.000 |
544.923.000 |
536.058.000 |
|
Total
stock |
27.935.000 |
54.752.000 |
63.280.000 |
67.417.000 |
64.589.000 |
|
Accounts receivable |
3.129.000 |
14.631.000 |
28.668.000 |
31.158.000 |
34.034.000 |
|
Other receivables |
10.229.000 |
22.246.000 |
26.711.000 |
29.674.000 |
40.300.000 |
|
Total
receivables |
13.358.000 |
36.877.000 |
55.379.000 |
60.832.000 |
74.334.000 |
|
Liquid funds |
22.808.000 |
13.432.000 |
16.911.000 |
9.797.000 |
11.823.000 |
|
Current
assets |
64.101.000 |
105.061.000 |
135.570.000 |
138.046.000 |
150.746.000 |
|
Total
assets |
463.089.000 |
570.154.000 |
643.117.000 |
682.969.000 |
686.804.000 |
|
Minority
interests |
|
|
|
|
-829.000 |
|
Total
equity |
87.315.000 |
103.891.000 |
111.607.000 |
176.804.000 |
204.235.000 |
|
Provisions |
87.618.000 |
85.179.000 |
86.163.000 |
86.519.000 |
84.348.000 |
|
Long term interest yielding debt |
190.377.000 |
244.259.000 |
177.485.000 |
240.245.000 |
239.371.000 |
|
Long
term liabilities |
190.377.000 |
244.259.000 |
177.485.000 |
240.245.000 |
239.371.000 |
|
Accounts payable |
19.161.000 |
40.597.000 |
39.492.000 |
47.996.000 |
42.590.000 |
|
Other short term liabilities |
78.618.000 |
96.228.000 |
228.370.000 |
131.405.000 |
117.089.000 |
|
Short
term liabilities |
97.779.000 |
136.825.000 |
267.862.000 |
179.401.000 |
159.679.000 |
|
Total
short and long term liabilities |
375.774.000 |
466.263.000 |
531.510.000 |
506.165.000 |
483.398.000 |
|
Total
liabilities |
463.089.000 |
570.154.000 |
643.117.000 |
682.969.000 |
686.804.000 |
Summary
The total assets of the company decreased with -18.78 % between 2013 and 2014.
This total assets decrease has been reflected in a reduction of non current assets of -14.21%.
Assets reduction is explained by a Net Worth decrease of -15.96 %, and an indebtedness reduction of -19.41 %.
In 2014 the assets of the company were 86.16 % composed of fixed assets and 13.84 % by current assets. The assets are being financed by an equity of 18.85 %, and total debt of 81.15 %.
The total assets of the company decreased with -11.35 % between 2012 and 2013.
This total assets decrease has been reflected in a reduction of non current assets of -8.36 %.
Assets reduction is explained by a Net Worth decrease of -6.91 %, and an indebtedness reduction of -12.28 %.
In 2013 the assets of the company were 81.57 % composed of fixed assets and 18.43 % by
current assets. The assets are being financed by an equity of 18.22 %, and total debt of 81.78 %.

Profit
and loss
|
Year |
2014 |
2013 |
2012 |
2011 |
2010 |
|
Revenues |
392.131.000 |
485.477.000 |
459.560.000 |
474.604.000 |
561.480.000 |
|
Other operating income |
|
58.591.000 |
|
|
52.404.000 |
|
Net
turnover |
392.131.000 |
426.886.000 |
459.560.000 |
474.604.000 |
509.076.000 |
|
|
|||||
|
Gross
margin |
173.299.000 |
185.070.000 |
187.902.000 |
187.551.000 |
216.041.000 |
|
|
|||||
|
Wages and salaries |
|
92.928.000 |
100.763.000 |
109.305.000 |
114.741.000 |
|
Sales |
184.840.000 |
241.816.000 |
271.658.000 |
287.053.000 |
293.035.000 |
|
other operating costs |
|
128.652.000 |
132.203.000 |
137.024.000 |
126.483.000 |
|
Operating expenses |
403.672.000 |
463.396.000 |
504.624.000 |
533.382.000 |
534.259.000 |
|
Result in subsidiaries |
-808.000 |
19.000 |
15.000 |
2.000 |
-73.000 |
|
Operating
result |
-11.541.000 |
22.081.000 |
-45.064.000 |
-58.778.000 |
27.221.000 |
|
|
|||||
|
Financial income |
225.000 |
1.992.000 |
385.000 |
405.000 |
1.187.000 |
|
Financial expenses |
12.177.000 |
15.357.000 |
18.011.000 |
18.955.000 |
17.534.000 |
|
Financial result |
-11.952.000 |
-13.365.000 |
-17.626.000 |
-18.550.000 |
-16.347.000 |
|
Result
on ordinary operations before taxes |
-24.301.000 |
8.735.000 |
-62.675.000 |
-77.326.000 |
10.801.000 |
|
|
|||||
|
Taxation on the result of ordinary
activities |
3.844.000 |
3.851.000 |
2.382.000 |
1.019.000 |
3.984.000 |
|
Year |
2014 |
2013 |
2012 |
2011 |
2010 |
|
Result
of ordinary activities after taxes |
-28.145.000 |
4.884.000 |
-65.057.000 |
-78.345.000 |
6.817.000 |
|
|
|||||
|
Result subsidiaries after
taxes |
35.462.000 |
|
-9.884.000 |
34.577.000 |
|
|
Net
result |
7.317.000 |
4.884.000 |
-74.941.000 |
-43.768.000 |
6.817.000 |
Summary
The turnover of the company decreased by -8.14 % between 2013 and 2014.
The gross profit of the company decreased by -6.36 % between 2013 and 2014.
The operating result of the company declined with -152.27 % between 2013 and 2014. This evolution implies an decrease of the company's economic profitability.
The result of these changes is a reduction of the company's Economic Profitability of -443.14 % of the analysed period, being equal to 2013 % in the year 2014.
Despite the decline the assets turnover increased by 13.33 % reaching 0.85.
The Net Result of the company decreased by 49.82 % between 2013 and 2014.
The company's Financial Profitability has been negatively affected by the financial activities in comparison to the EBITs behaviour. The result of these variations is a profitability reduction of -430.92 % of the analysed period, being -27.83 % in the year 2014.
The company's financial profitability has been positively affected by its financial structure.
The turnover of the company decreased by -7.11 % between 2012 and 2013.
The gross profit of the company decreased by -1.51 % between 2012 and 2013.
The operating result of the company grew with 149 % between 2012 and 2013. This evolution implies an increase of the company's economic profitability.
The result of these changes is an increase of the company's Economic Profitability of 115.69 % of the analysed period, being equal to 2012 % in the year 2013.
This growth has contributed to the increase in assets turnover, increasing by 5.63 % reaching 0.75.
The Net Result of the company decreased by 106.52 % between 2012 and 2013.
The company's Financial Profitability has been positively affected by the financial activities in comparison to the EBITs behaviour. The result of these variations is a profitability increase of 114.98 % of the analysed period, being 8.41 % in the year 2013.
The company's financial structure has slowed down its financial profitability.
Analysis
Branch (SBI) Holding companies
(not financial) (70)
Region Westelijk Utrecht
In the Netherlands 164954 of the companies are
registered with the SBI code 70
In the region Westelijk Utrecht 12545 of the
companies are registered with the SBI code 70
In the Netherlands 1108 of the bankrupcties
are published within this sector
In the region Westelijk Utrecht 67 of the
bankruptcies are published within this sector
The risk of this specific sector in the
Netherlands is Low
The risk of this specific sector in the
region Westelijk Utrecht is Low
Publications
Consent statements 15-07-2014: Voor
boekjaar 2013 is een instemmingsverklaring gedeponeerd.
05-07-2013: Voor boekjaar 2012 is een
instemmingsverklaring gedeponeerd.
26-10-2012: Voor boekjaar 2011 is een
instemmingsverklaring gedeponeerd.
Functions 04-03-2015: Per
18-02-2015 is bestuurder Remco Henricus Bernardus Vermeij uit functie
getreden.
04-03-2015: Per 18-02-2015 is gevolmachtigde
Remco Henricus Bernardus Vermeij uit
functie getreden.
24-02-2015: Per 15-01-2015 is gevolmachtigde
Anders Mikael Andersson in functie getreden.
24-02-2015: Per 15-01-2015 is bestuurder
Anders Mikael Andersson in functie getreden.
24-02-2015: Per 15-01-2015 is gevolmachtigde
George Alexander Theodore Aperghis in
functie getreden.
19-02-2015: Per 15-01-2015 is bestuurder
George Alexander Theodore Aperghis in functie
getreden.
10-02-2015: Per 15-01-2015 is gevolmachtigde
John David Adam Hind uit functie getreden.
16-01-2015: Per 15-01-2015 is bestuurder
John David Adam Hind uit functie getreden.
28-01-2014: Per 23-01-2014 is gevolmachtigde
Remco Henricus Bernardus Vermeij uit
functie getreden.
28-01-2014: Per 23-01-2014 is gevolmachtigde
John David Adam Hind uit functie getreden.
28-01-2014: Per 23-01-2014 is gevolmachtigde
Remco Henricus Bernardus Vermeij in
functie getreden.
28-01-2014: Per 23-01-2014 is gevolmachtigde
John David Adam Hind in functie getreden.
27-01-2014: Per 23-01-2014 is gevolmachtigde
Remco Henricus Bernardus Vermeij in
functie getreden.
27-01-2014: Per 23-01-2014 is gevolmachtigde
John David Adam Hind in functie getreden.
27-01-2014: Per 02-10-2013 is gevolmachtigde
Patrick Thevenoux uit functie getreden.
02-08-2013: Per 31-05-2013 is bestuurder
Wouter Albert Kolk uit functie getreden.
28-05-2013: Per 01-05-2013 is bestuurder
John David Adam Hind in functie getreden.
02-05-2013: Per 01-05-2013 is bestuurder Remco
Henricus Bernardus Vermeij in functie
getreden.
29-10-2012: Per 26-10-2012 is bestuurder
Rogier Silvester Marie Wijnhoven uit functie
getreden.
03-05-2012: Per 01-05-2012 is gevolmachtigde
Patrick Thevenoux in functie getreden.
03-05-2012: Per 01-05-2012 is gevolmachtigde
Petronella Gerdina Cornelia Maria de Grootvan
Amelsvoort uit functie getreden.
Amendments 27-01-2014: Per
23-1-2014 is de bevoegdheid van Bestuurder John David Adam Hind
gewijzigd.
27-01-2014: Per 23-1-2014 is de bevoegdheid van
Bestuurder Remco Henricus Bernardus
Vermeij gewijzigd.
27-01-2014: Per 23-1-2014 is de bevoegdheid
van Bestuurder 30219802 Logo International
B.V. gewijzigd.
27-01-2014: Per 23-1-2014 statuten
gewijzigd. Per 23-1-2014 naam gewijzigd in: WE Europe
B.V..
Company
structure
Relations 15
• We Finance and Services (Luxembourg) S.A.R.L.
17, rue Beaumont
L-1219 Luxembourg
Luxembourg
• WE International B.V.
Reactorweg 101
3542AD UTRECHT
Netherlands
Registration number: 300912610000
• Logo International B.V.
Minervum 7032
4817ZL BREDA
Netherlands
Registration number: 302198020000
• WE Europe B.V.
Reactorweg 101
3542AD Utrecht
Netherlands
Registration number: 300898770000
• WE Germany B.V.
Reactorweg 101
3542AD UTRECHT
Netherlands
Registration number: 300898740000
• WE Belgium B.V.
Reactorweg 101
3542AD UTRECHT
Netherlands
Registration number: 300898790000
• WE Netherlands B.V.
Reactorweg 101
3542AD UTRECHT
Netherlands
Registration number: 300911810000
• WE Real Estate Management B.V.
Reactorweg 101
3542AD UTRECHT
Netherlands
Registration number: 302101370000
FOREIGN EXCHANGE RATES
|
Currency |
Unit
|
Indian Rupees |
|
US Dollar |
1 |
Rs.63.81 |
|
UK Pound |
1 |
Rs.98.93 |
|
Euro |
1 |
Rs.69.66 |
INFORMATION DETAILS
|
Analysis Done by
: |
DIV |
|
|
|
|
Report Prepared
by : |
VNT |
RATING EXPLANATIONS
|
RATING |
STATUS |
PROPOSED CREDIT LINE |
|
|
|
>86 |
Aaa |
Possesses an extremely sound financial base with the strongest capability
for timely payment of interest and principal sums |
Unlimited |
|
|
71-85 |
Aa |
Possesses adequate working capital. No caution needed for credit
transaction. It has above average (strong) capability for payment of interest
and principal sums |
Large |
|
|
56-70 |
A |
Financial & operational base are regarded healthy. General
unfavourable factors will not cause fatal effect. Satisfactory capability for
payment of interest and principal sums |
Fairly Large |
|
|
41-55 |
Ba |
Overall operation is considered normal. Capable to meet normal
commitments. |
Satisfactory |
|
|
26-40 |
B |
Capability to overcome financial difficulties seems comparatively
below average. |
Small |
|
|
11-25 |
Ca |
Adverse factors are apparent. Repayment of interest and principal sums
in default or expected to be in default upon maturity |
Limited with
full security |
|
|
<10 |
C |
Absolute credit risk exists. Caution needed to be exercised |
Credit not
recommended |
|
|
-- |
NB |
New Business |
-- |
|
This score serves as a reference to assess
SC’s credit risk and to set the amount of credit to be extended. It is
calculated from a composite of weighted scores obtained from each of the major sections
of this report. The assessed factors and their relative weights (as indicated
through %) are as follows:
Financial
condition (40%) Ownership
background (20%) Payment
record (10%)
Credit history
(10%) Market trend (10%) Operational size
(10%)
This report is issued at your request without any
risk and responsibility on the part of MIRA INFORM PRIVATE LIMITED (MIPL)
or its officials.