MIRA INFORM REPORT
|
Report No. : |
335304 |
|
Report Date : |
17.08.2015 |
IDENTIFICATION DETAILS
|
Name : |
INVERTARESA SL |
|
|
|
|
Registered Office : |
Rua Nueva, 2 -6º. - Coruña (A) - 15003 - La Coruña |
|
|
|
|
Country : |
Spain |
|
|
|
|
Financials (as on) : |
2013 |
|
|
|
|
Date of Incorporation : |
12.03.1999 |
|
|
|
|
Legal Form : |
Private Company |
|
|
|
|
Line of Business : |
Subject is engaged in packaging activities. |
|
|
|
|
No. of Employee : |
4 |
RATING & COMMENTS
|
MIRA’s Rating : |
B |
|
RATING |
STATUS |
PROPOSED CREDIT LINE |
||||
|
26-40 |
B |
Capability to overcome financial difficulties seems comparatively
below average. |
Small |
|||
|
Maximum Credit Limit : |
Euro 1.050.000 |
|
|||
|
|
|
|
|||
|
Status : |
Moderate |
|
|||
|
|
|
|
|||
|
Payment Behaviour : |
Unknown |
|
|||
|
|
|
|
|||
|
Litigation : |
Clear |
|
|||
NOTES :
Any query related to this report can be made on
e-mail : infodept@mirainform.com
while quoting report number, name and date.
ECGC Country Risk Classification List – March 31, 2015
|
Country Name |
Previous Rating (31.12.2014) |
Current Rating (31.03.2015) |
|
Spain |
A1 |
A1 |
|
Risk Category |
ECGC
Classification |
|
Insignificant |
A1 |
|
Low |
A2 |
|
Moderate |
B1 |
|
High |
B2 |
|
Very High |
C1 |
|
Restricted |
C2 |
|
Off-credit |
D |
SPAIN - ECONOMIC OVERVIEW
After experiencing a prolonged recession in the wake of the global financial crisis that began in 2008, in 2014 Spain marked the first full year of positive economic growth in seven years, largely due to increased private consumption. At the onset of the global financial crisis Spain's GDP contracted by 3.7% in 2009, ending a 16-year growth trend, and continued contracting through most of 2013. In 2013 the government successfully shored up struggling banks - exposed to the collapse of Spain's depressed real estate and construction sectors - and in January 2014 completed an EU-funded restructuring and recapitalization program.
Until 2014, credit contraction in the private sector, fiscal austerity, and high unemployment weighed on domestic consumption and investment. The unemployment rate rose from a low of about 8% in 2007 to more than 26% in 2013, but labor reforms prompted a modest reduction to 23.7% in 2014. High unemployment strained Spain's public finances, as spending on social benefits increased while tax revenues fell. Spain’s budget deficit peaked at 11.4% of GDP in 2010, but Spain gradually reduced the deficit to just under 7% of GDP in 2013-14, slightly above the 6.5% target negotiated between Spain and the EU. Public debt has increased substantially – from 60.1% of GDP in 2010 to more than 97% in 2014.
Exports were resilient throughout the economic downturn and helped to bring Spain's current account into surplus in 2013 for the first time since 1986, where it remained in 2014. Rising labor productivity and an internal devaluation resulting from moderating labor costs and lower inflation have helped to improve foreign investor interest in the economy and positive FDI flows have been restored.
The government's efforts to implement labor, pension, health, tax, and education reforms - aimed at supporting investor sentiment - have become overshadowed by political activity in 2015 in anticipation of the national parliamentary elections in November. Spain’s 2015 budget, published in September 2014, rolls back some recently imposed taxes in advance of the elections and leaves untouched the country’s value-added tax (VAT) regime, which continues to generate significantly lower revenue than the EU average. Spain’s borrowing costs are dramatically lower since their peak in mid-2012, and despite the recent uptic in economic activity, inflation has dropped sharply, from 1.5% in 2013 to nearly flat in 2014.
|
Source
: CIA |
EXECUTIVE
SUMMARY
|
|
Name: |
INVERTARESA SL |
|
NIF / Fiscal code: |
B15690225 |
|
Status: |
ACTIVE |
|
Incorporation Date: |
12/03/1999 |
|
Register Data |
Register Section 8 Sheet 22790 |
|
Last Publication
in BORME: |
09/03/2015 [Reelections] |
|
Last Published Account Deposit: |
2013 |
|
Share Capital: |
1.500.000 |
|
|
|
|
Localization: |
RUA NUEVA, 2 -6º. - CORUÑA (A) - 15003 - LA CORUÑA |
|
Telephone - Fax - Email - Website: |
Telephone. 981251700 Email. correo@invertaresa.com Website.
www.invertaresa.com |
|
Number of Branches |
1 |
|
|
|
|
Activity: |
|
|
NACE: |
8292 - Packaging activities |
|
Registered Trademarks: |
|
|
Audited / Opinion: |
Si / |
|
Tenders and Awards: |
|
|
Subsidies: |
0 for a total cost of 0 |
|
Quality Certificate: |
No |
|
|
|
|
Scoring and
Risk: |
|
|
Default Risk: |
2.051% |
|
Maximum recommended commercial credit: |
1.050.000 |
|
Payment Behaviour: |
Currently fulfilled |
|
Prospects: |
Consolidation |
|
Industry situation: |
Maturity |
|
|
|
|
Defaults, Legal
Claims and Insolvency Proceedings : |
|
|
|
|
Number |
Amount (€) |
Most Recent Entry |
|
Insolvency Proceedings, Bankruptcy and Suspension of Payments |
|
Unpublished |
--- |
--- |
|
Defaults on debt with Financial Institutions and Large Companies |
|
None |
--- |
--- |
|
Judicial Claims (Notices, Executive Proceedings, Attachments,
Auctions, Bad Debt) |
|
None |
0 |
--- |
|
Proceedings heard by the Civil Court |
|
Unpublished |
0 |
--- |
|
Proceedings heard by the Labour Court |
|
Unpublished |
0 |
--- |
|
Partner |
|
APLICACIONES DEL HORMIGON SA |
68.19 % |
|
|
Shares: |
25 |
|
|
Other Links: |
16 |
|
|
No. of Active Corporate Bodies: |
SINGLE ADMINISTRATOR 1 |
|
|
Ratios |
2013 |
2012 |
Change |
|
|
|
|
|
Guarantees: |
|
|
Properties Registered: |
Company NO, Administrator NO |
|
Financing / Guarantee Sources : |
Sources YES, Guarantees NO |
|
INVESTIGATION
SUMMARY |
|
|
The company was established in March 1999. It is dedicated to all the typical
activities of holding companies. In charge of the owner there are four
employees. In light of the above, we consider it possible to maintain
operational relations of habitual credit. |
|
|
Interviewed Person: |
|
Enquiry
Details
|
|
|
Business address
regime: |
Rent |
Identification
|
|
|
Social
Denomination: |
INVERTARESA SL |
|
NIF / Fiscal
code: |
B15690225 |
|
Corporate
Status: |
ACTIVE |
|
Start of
activity: |
1999 |
|
Registered
Office: |
RUA NUEVA, 2 -6º. |
|
Locality: |
CORUÑA (A) |
|
Province: |
LA CORUÑA |
|
Postal Code: |
15003 |
|
Telephone: |
981251700 |
|
Fax: |
981858568 |
|
Website: |
www.invertaresa.com |
|
Email: |
correo@invertaresa.com |
|
Interviewed
Person: |
Sr. Carlos |
Branch
Offices
|
|
Address |
Postal Code |
City |
Province |
|
Avenida Finisterre, 309 |
15008 |
A Coruña |
A Coruña |
Activity
|
|
|
NACE: |
8292 |
|
Legal Form: |
Direction administrative service. Possession, benefit, administration and
transfer of title of actions, shares and any other title. Purchase and
selling, rent, construction and administration, advertising of estates.
Expanded in: administration and direction activities in Spanish territories
corresponding to organization with material and personal means. |
|
Additional
Information: |
Actividades tipo holding. |
|
Additional
Address: |
Only registered office. It posses offices in Ada. Finisterre, 309 of A
Coruña. |
|
Franchise: |
No |
|
Import / export: |
DOES NOT IMPORT / DOES NOT EXPORT |
|
Future
Perspective: |
Consolidation |
|
Industry
situation: |
Maturity |
Number
of Employees
|
|
|
Year |
No. of employees |
Established |
Incidentals |
|
|
|
2015 |
4 |
|
|
|
The data of employees is from the latest available financial statements
in Failing that, are estimates data calculated by statistical methods
Chronological
Summary
|
|||
|
|
Year |
Act |
|
|
|
1999 |
Appointments/ Re-elections (1) Company Formation (1) |
|
|
|
2000 |
Accounts deposit (year 1999) |
|
|
|
2001 |
Accounts deposit (year 2000) Change of Social address (1) Statutory
Modifications (1) |
|
|
|
2002 |
Accounts deposit (year 2001) Take-over Merger (5) |
|
|
|
2003 |
Accounts deposit (year 2002) Change of Social Purpose (1) Statutory
Modifications (1) |
|
|
|
2004 |
Accounts deposit (year 2003) |
|
|
|
2005 |
Accounts deposit (year 2004) |
|
|
|
2006 |
Accounts deposit (year 2005) |
|
|
|
2007 |
Accounts deposit (year 2006) Appointments/ Re-elections (2) |
|
|
|
2008 |
Accounts deposit (year 2007) Appointments/ Re-elections (1) |
|
|
|
2009 |
Accounts deposit (year 2008 consolidated, 2008) Appointments/
Re-elections (1) |
|
|
|
2010 |
Accounts deposit (year 2009 consolidated, 2009) |
|
|
|
2011 |
Accounts deposit (year 2010 consolidated, 2010) Change of Social Purpose
(1) Statutory Modifications (1) |
|
|
|
2012 |
Accounts deposit (year 2011 consolidated, 2011) Appointments/
Re-elections (1) Cessations/ Resignations/ Reversals (1) |
|
|
|
2013 |
Accounts deposit (year 2012 consolidated) Appointments/ Re-elections
(2) |
|
|
|
2014 |
Accounts deposit (year 2013 consolidated, 2013) Appointments/
Re-elections (1) |
|
|
|
2015 |
Appointments/ Re-elections (1) |
|
Main
Historic Changes
|
|||
|
Concept |
Publication |
Act |
Date |
|
Corporate Purpose Changes: |
SERVICIOS DE GESTION ADMINISTRATIVA. TENENCIA. ADMINISTRACION Y
ENAJENACION DE ACCIONES Y PARTICIPACIONES. COMPRA, VENTA, ARRENDAMIENTO, CONSTRUCCIONY
ADMINISTRACION, Y PROMOCION DE FINCAS |
|
12/11/2003 |
|
|
AESTION ADMINISTRATIVA. TENENCIA, DISFRUTE, ADMINISTRACION Y
ENAJENACION DE ACCIONES, PARTICIPACIONES Y CUALESQUIERA TITULOS |
Company Formation |
13/07/1999 |
Breakdown
of Owners' Equity
|
|
|
Registered
Capital: |
1.500.000 |
|
Paid up capital: |
1.500.000 |
Updated Evolution of the Subscribed and
Paid-in Capital
|
|||||
|
Publishing Date |
Registration Type |
Capital Subscribed |
Paid up capital |
Underwritten result |
Disbursed Result |
|
23/06/1999 |
Company Formation |
1.500.000 |
1.500.000 |
1.500.000 |
1.500.000 |
Active
Social Bodies
|
|||
|
Post published |
Social Body's Name |
Appointment Date |
Other Positions in this Company |
|
SINGLE ADMINISTRATOR |
DIAZ RINCON COTELO ROBERTO MANUEL |
23/06/1999 |
1 |
|
JOINT ATTORNEY/COMBINED PROXY |
BELATEGUI AZPIRI IÑAKI |
31/05/2013 |
1 |
|
|
DOLDAN VAZQUEZ JUAN LORENZO |
10/02/2009 |
2 |
|
|
OTERO REY JOSE ANGEL |
10/02/2009 |
3 |
|
|
COSTAS PINO JOSE LUIS |
10/02/2009 |
1 |
|
ACCOUNTS' AUDITOR / HOLDER |
KPMG AUDITORES SL |
23/02/2015 |
10 |
|
CONSOLIDATED ACCOUNTS' AUDITOR |
KPMG AUDITORES SL |
23/02/2015 |
10 |
Historical
Social Bodies
|
|||
|
Social Body's Name |
Post published |
End Date |
Other Positions in this Company |
|
DOLDAN VAZQUEZ JUAN LORENZO |
JOINT ATTORNEY/COMBINED PROXY |
10/02/2009 |
2 |
|
KPMG AUDITORES SL |
ACCOUNTS' AUDITOR / HOLDER |
30/01/2012 |
10 |
|
|
ACCOUNTS' AUDITOR / HOLDER |
16/01/2013 |
|
|
|
ACCOUNTS' AUDITOR / HOLDER |
28/01/2014 |
|
|
|
ACCOUNTS' AUDITOR / HOLDER |
23/02/2015 |
|
|
|
CONSOLIDATED ACCOUNTS' AUDITOR |
30/01/2012 |
|
|
|
CONSOLIDATED ACCOUNTS' AUDITOR |
16/01/2013 |
|
|
|
CONSOLIDATED ACCOUNTS' AUDITOR |
28/01/2014 |
|
|
|
CONSOLIDATED ACCOUNTS' AUDITOR |
23/02/2015 |
|
|
OTERO REY JOSE ANGEL |
JOINT ATTORNEY/COMBINED PROXY |
17/09/2007 |
3 |
|
|
JOINT ATTORNEY |
10/02/2009 |
|
|
VARELA PIÑEIRO ENRIQUE |
JOINT ATTORNEY |
13/11/2012 |
1 |
Executive
board
|
|
||
|
Post |
NIF |
Name |
|
|
ADMINISTRATOR |
|
ROBERTO MANUEL DIAZ RINCON COTELO |
|
|
DIRECTOR/GENERAL MANAGER |
|
ROBERTO MANUEL DIAZ RINCON COTELO |
|
Defaults, Legal Claims and Insolvency Proceedings
|
Section enabling assessment of the degree of compliance of the company
queried with its payment obligations. It provides information on the existence and
nature of all stages of Insolvency and Legal Proceedings published with
reference to the Company in the country's various Official Bulletins and
national newspapers, as well Defaults Registered in the main national credit
bureaus (ASNEF Industrial and RAI ).
> Summary
Chronological summary
|
|
|
Number of Publications |
Amount (_) |
Start date |
End date |
|
Insolvency Proceedings, Bankruptcy and Suspension of Payments |
|
Unpublished |
--- |
--- |
--- |
|
Request/Declaration |
|
0 |
--- |
date |
|
|
Proceedings |
|
--- |
--- |
|
--- |
|
Resolution |
|
--- |
--- |
|
--- |
|
Defaults on debt with Financial Institutions and Large Companies |
Bank and Commercial Delinquency |
None |
0 |
|
|
|
Status: Friendly |
|
--- |
|
|
|
|
Status: Pre-Litigation |
|
--- |
|
|
|
|
Status: Litigation |
|
--- |
|
|
|
|
Status: Non-performing |
|
--- |
|
|
|
|
Status: insolvency proceedings, bankruptcy and suspension of payments |
|
--- |
|
|
|
|
Other status |
|
--- |
|
|
|
|
Legal and Administrative Proceedings |
|
Unpublished |
--- |
|
|
|
Notices of defaults and enforcement |
|
--- |
--- |
|
--- |
|
Seizures |
|
--- |
--- |
|
--- |
|
Auctions |
|
--- |
--- |
|
--- |
|
Declarations of insolvency and bad debt |
|
--- |
--- |
|
--- |
|
Proceedings heard by the Civil Court |
|
Unpublished |
--- |
|
|
|
Proceedings heard by the Labour Court |
|
Unpublished |
--- |
|
|
> Details
> Basis for scoring
|
Positive Factors |
Adverse Factors |
|
No judicial claims have been detected in the Official Gazettes,
regarding any Entity's outstanding debts with the Tax Bureau or Social
Security administrations, as submitted by Courts of the various court jurisdictions. No irregular payment performance has been detected based on
information obtained from credit bureaus. Adequate level of financial autonomy. The financial autonomy of the
entity represents the 38.91 %. In principle, an increase in this ratio would
indicate an improvement in the corporate's balace sheets. The current debt represents a 21.99of the financial structure. In
principle, a decrease in this ratio would indicate an improvement in the
short-term financial situation. Positive Working CapitalThe Company's Working Capital quality is
significant, i.e. much of the Company financing comes from its equity. A
structure is considered optimal if its liquidity level is slightly above its
debt volume as a result of low idleness levels of its financial resources
involved. |
It does not have any economic profitability.. It has no return from
the necessary investments in the development of its main activity in
comparison with its assets. It does not have any financial profitability.. INVERTARESA SLIt does
not obtain any financial return as a consequence of an investment in its own
resources which, a priori, might deteriorate its financial and economic
situation. Immediate solvency is significantly lower than that of the previous
fiscal year. Debts assumed by the company based on the volume of its own resources
have increased in the previous financial year. INVERTARESA SL presents a low turnover of the current assets , which
could indicate an inefficient use of non-current assets due to the lacking of
enough operating income capacity based on the dedicated assets available for
sale. |
The
information contained in the latest annual statements has led to a Scoring
review for the company.
> Estimated Probability of Default for the next 12 months:
2.051 %
|
Sector in which comparison is carried out: 829 Business support service activities n.e.c. |
|
|
Relative Position:
|
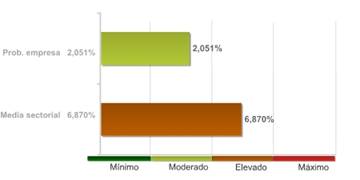
The company's comparative analysis with the rest of the companies that
comprise the sector, shows the company holds a better position with regard to
the probability of non-compliance.
The probability of the company's non-compliance with its payment
obligations within deadlines estimated by our qualifications models is 2.051%.
In the event they fail to comply with the payment, the seriousness of
the loss will depend on factors such as the promptness of the commencement of
the charging management, the existence of executive documents which match the
credit or the existence of guarantees and free debt assets under the name of
the debtor. Therefore, the probability of non-compliance should not be solely
interpreted as the total loss of the owed amount.
Recommended commercial credit
|
Favourable until 1.050.000
€ (Guideline value of outstanding commercial balance that recommends
be awarded to or maintained with the company queried)
LEGAL CLAIMS
|
|
Summary of Judicial Claims |
|
PROCEDURES OF CONTEST, BANKRUPTCY AND BANKRUPTCY PROTECTION |
|
|
|
|
|
No se han publicado |
|
|
|
No se han publicado |
|
|
|
|
|
|
|
No se han publicado |
|
|
|
No se han publicado |
|
|
|
No se han publicado |
|
|
|
No se han publicado |
|
|
|
|
|
|
|
No se han publicado |
|
|
|
No se han publicado |
|
|
|
|
|
|
|
No se han publicado |
Suppliers
|
|
||||
|
|
Name |
NIF |
Telephone |
|
|
|
|
GARRIGUES |
|
|
|
|
|
|
KPMG |
|
|
|
|
Link
List
|
|
|
PARTICIPATES IN: |
25 Entities |
|
SHAREHOLDERS: |
1 Entities |
|
ABSORBS TO: |
1 Entities |
|
BELONGS TO THE ADMINISTRATION BOARD OF: |
12 Entities |
|
IS RELATED WITH: |
3 Entities |
Shareholders
|
Relationship |
Entity |
Province |
Shareholding stake |
|
SHAREHOLDERS |
APLICACIONES DEL HORMIGON SA |
LA CORUÑA |
68.19 |
|
|
MADE TORRES SL |
VALLADOLID |
100 |
|
|
MADE STEEL SL |
LA CORUÑA |
100 |
|
|
CONECTA GAS SL |
LA CORUÑA |
100 |
|
PARTICIPATES IN |
APLICACIONES DEL HORMIGON SA |
LA CORUÑA |
|
|
|
INVEROLICA DE ABELLA SL |
LA CORUÑA |
99.89 |
|
|
INVERTARESA CONSTRUCCIONES S.L |
LA CORUÑA |
100 |
|
|
INVEROLICA SL |
LA CORUÑA |
59.02 |
|
|
FOTOVOLTAICA DE LA HOYA DE LOS VICENTES 114 SL |
MURCIA |
100 |
|
|
ISOWAT MADE S.L. |
LA CORUÑA |
|
|
|
TARESA NORTE SL |
LA CORUÑA |
100 |
|
|
ISOWAT EOLICA SL |
LA CORUÑA |
80 |
|
|
ENTREMA SL |
LA CORUÑA |
99.38 |
|
|
APARCAMIENTOS IC GOMEZ ULLA SL |
MADRID |
50 |
|
|
CASTILLO DE LA PALMA-MUGARDOS SA |
LA CORUÑA |
|
|
|
TALLERES REUNIDOS SA |
LA CORUÑA |
80 |
|
|
TARESA CABLE SL |
LA CORUÑA |
75.01 |
|
|
ISOWAT SL |
LA CORUÑA |
|
|
|
MADE ENGINEERING AND GLOBAL SERVICES SL |
LA CORUÑA |
100 |
|
|
LECOGAL SL |
LA CORUÑA |
100 |
|
|
INVERSIONES MUGARDOS INVERCAST SL |
LA CORUÑA |
100 |
|
|
INVER APARCA SL |
LA CORUÑA |
99.66 |
|
|
ISOWAT ELECTRIC ENGINEERING SL |
LA CORUÑA |
0.34 |
|
|
MADE ELECTRIC ENGINEERING SL |
LA CORUÑA |
0.34 |
|
|
MADE INTERNATIONAL BV (HOLANDA) |
|
|
|
|
MADE INDUSTRIELLE MAROC |
|
|
> Other relationships
|
Relationship |
Entity |
Province |
Shareholding stake |
|
IS RELATED WITH |
TALLERES REUNIDOS SA |
LA CORUÑA |
|
|
|
APLICACIONES DEL HORMIGON SA |
LA CORUÑA |
|
|
|
MADE TORRES SL |
VALLADOLID |
|
|
ABSORBS TO |
PINTURAS ALEMANAS MELDORF SA |
LA CORUÑA |
|
|
BELONGS TO THE ADMINISTRATION BOARD OF |
INVEROLICA SL |
LA CORUÑA |
|
|
|
MADE STEEL SL |
LA CORUÑA |
|
|
|
INVER PIPE SL |
LA CORUÑA |
|
|
|
INVERSIONES MUGARDOS INVERCAST SL |
LA CORUÑA |
|
|
|
INVER APARCA SL |
LA CORUÑA |
|
|
|
TARESA CABLE SL |
LA CORUÑA |
|
|
|
ENTREMA SL |
LA CORUÑA |
|
|
|
TARESA NORTE SL |
LA CORUÑA |
|
|
|
INVEROLICA DE ABELLA SL |
LA CORUÑA |
|
|
|
INVERTARESA CONSTRUCCIONES S.L |
LA CORUÑA |
|
|
|
ISOWAT EOLICA SL |
LA CORUÑA |
|
|
|
TALLERES REUNIDOS SA |
LA CORUÑA |
|
Turnover
|
|
|
Total Sales 2014 |
480.000 |
The sales data is from the latest available financial statements in. Failing
that, are estimates data calculated by statistical methods.
Estimated
Balance
|
|
Prev. 2014 Non-current asset 6.800.000 Current asset 7.000.000 Net
worth 5.200.000 Non-current liabilities 5.600.000 Current liabilities 4.000.000
Total liabilities and net assets 13.800.000 Sales 480.000 |
Financial
Accounts and Balance Sheets
|
Financial Years
Presented
|
Ejercicio |
Tipo de Cuentas Anuales |
Fecha Presentacion |
|
2013 |
Consolidadas |
August 2014 |
|
2013 |
Normales |
September 2014 |
|
2012 |
Consolidadas |
October 2013 |
|
2012 |
Normales |
No publicado en BORME |
|
2011 |
Consolidadas |
October 2012 |
|
2011 |
Normales |
October 2012 |
|
2010 |
Consolidadas |
October 2011 |
|
2010 |
Normales |
August 2011 |
|
2009 |
Consolidadas |
July 2010 |
|
2009 |
Normales |
July 2010 |
|
2008 |
Consolidadas |
September 2009 |
|
2008 |
Normales |
September 2009 |
|
2007 |
Normales |
July 2008 |
|
2006 |
Normales |
September 2007 |
|
2005 |
Normales |
August 2006 |
|
2004 |
Normales |
August 2005 |
|
2003 |
Normales |
August 2004 |
|
2002 |
Normales |
August 2003 |
|
2001 |
Normales |
August 2002 |
|
2000 |
Normales |
August 2001 |
|
1999 |
Normales |
July 2000 |
The data in the
report regarding the last Company Accounts submitted by the company is taken
from the TRADE REGISTER serving the region in which the company's address is
located 31/12/2013
> Balance en formato Abreviado de acuerdo al Nuevo Plan General
Contable 2007
Information
corresponding to the fiscal year
2013 2012 2011 2010 2009 is taken from information
submitted to the TRADE REGISTER. Data corresponding to fiscal years before
2013 2012 2011 2010 2009 has been compiled based on
the equivalence criteria stipulated in Act JUS/206/2009. Where the provisions
of the Act did not establish relevant equivalence criteria, To view details on the methodology.
|
|
ORIGINAL |
ORIGINAL |
ORIGINAL |
ORIGINAL |
ORIGINAL |
|
|
Assets |
2013 |
2012 |
2011 |
2010 |
2009 |
|
|
A) NON-CURRENT ASSETS: 11000 |
6.910.025,00 |
10.347.622,00 |
10.616.122,00 |
11.546.686,00 |
10.415.938,00 |
|
|
I. Intangible fixed assets : 11100 |
84.319,00 |
99.519,00 |
114.720,00 |
129.920,00 |
145.120,00 |
|
|
II. Tangible fixed assets : 11200 |
148.647,00 |
458.871,00 |
461.840,00 |
453.476,00 |
457.580,00 |
|
|
III. Real estate investment: 11300 |
691.998,00 |
4.008.679,00 |
4.086.013,00 |
4.163.347,00 |
3.939.091,00 |
|
|
IV. Long-term investments in Group companies and
associates : 11400 |
5.471.313,00 |
4.635.655,00 |
4.722.533,00 |
6.308.769,00 |
5.308.769,00 |
|
|
V. Long-term financial investments: 11500 |
365.913,00 |
1.001.138,00 |
1.001.118,00 |
181.439,00 |
180.439,00 |
|
|
VI. Assets for deferred tax : 11600 |
147.835,00 |
143.760,00 |
229.898,00 |
309.735,00 |
384.939,00 |
|
|
VII. Non-current trade debtors : 11700 |
0,00 |
0,00 |
0,00 |
0,00 |
0,00 |
|
|
B) CURRENT ASSETS: 12000 |
6.910.255,00 |
2.889.782,00 |
2.563.594,00 |
2.277.452,00 |
1.255.200,00 |
|
|
I. Non-current assets held for sale : 12100 |
3.300.980,00 |
0,00 |
0,00 |
0,00 |
0,00 |
|
|
II. Stocks: 12200 |
0,00 |
0,00 |
0,00 |
0,00 |
0,00 |
|
|
III. Trade debtors and others receivable
accounts: 12300 |
536.675,00 |
525.918,00 |
663.267,00 |
198.002,00 |
210.497,00 |
|
|
1.- Customers for sales and provisions
of services : 12380 |
0,00 |
77.929,00 |
215.600,00 |
170.241,00 |
191.714,00 |
|
|
a)
Long-term receivables from sales and services supplied : 12381 |
0,00 |
0,00 |
0,00 |
0,00 |
0,00 |
|
|
b) Customers
for sales and provisions of services : 12382 |
0,00 |
77.929,00 |
215.600,00 |
170.241,00 |
191.714,00 |
|
|
2.- Called up share capital
: 12370 |
0,00 |
0,00 |
0,00 |
0,00 |
0,00 |
|
|
3.- Other accounts receivable
: 12390 |
536.675,00 |
447.989,00 |
447.667,00 |
27.761,00 |
18.783,00 |
|
|
IV. Short-term investments in Group companies and
associates: 12400 |
1.780.887,00 |
1.034.866,00 |
1.596.473,00 |
1.739.991,00 |
587.499,00 |
|
|
V. Short-term financial investments : 12500 |
1.261.595,00 |
253.242,00 |
251.468,00 |
248.100,00 |
252.840,00 |
|
|
VI. Short-term accruals: 12600 |
0,00 |
6.235,00 |
0,00 |
2.632,00 |
3.021,00 |
|
|
VII. Cash and other equivalent liquid assets :
12700 |
30.118,00 |
1.069.521,00 |
52.386,00 |
88.727,00 |
201.343,00 |
|
|
TOTAL ASSETS (A + B) : 10000 |
13.820.280,00 |
13.237.404,00 |
13.179.716,00 |
13.824.138,00 |
11.671.138,00 |
|
|
|
ORIGINAL |
ORIGINAL |
ORIGINAL |
ORIGINAL |
ORIGINAL |
|
|
Liabilities and Net Worth |
2013 |
2012 |
2011 |
2010 |
2009 |
|
|
A) NET WORTH: 20000 |
5.376.962,00 |
5.946.988,00 |
6.318.192,00 |
6.276.617,00 |
6.220.190,00 |
|
|
A1) Shareholders' equity : 21000 |
5.376.962,00 |
5.946.988,00 |
6.318.192,00 |
6.276.617,00 |
6.220.190,00 |
|
|
I. Capital: 21100 |
1.500.000,00 |
1.500.000,00 |
1.500.000,00 |
1.500.000,00 |
1.500.000,00 |
|
|
1.-
Registered capital: 21110 |
1.500.000,00 |
1.500.000,00 |
1.500.000,00 |
1.500.000,00 |
1.500.000,00 |
|
|
2.-
(Uncalled capital) : 21120 |
0,00 |
0,00 |
0,00 |
0,00 |
0,00 |
|
|
II. Share premium: 21200 |
0,00 |
0,00 |
0,00 |
0,00 |
0,00 |
|
|
III. Reserves: 21300 |
4.007.284,00 |
4.576.618,00 |
4.576.618,00 |
4.673.715,00 |
4.508.939,00 |
|
|
IV. (Common stock equity):
21400 |
0,00 |
0,00 |
0,00 |
0,00 |
0,00 |
|
|
V. Profit or loss brought
forward: 21500 |
0,00 |
0,00 |
0,00 |
0,00 |
0,00 |
|
|
VI. Other
shareholders' contributions: 21600 |
0,00 |
0,00 |
0,00 |
0,00 |
0,00 |
|
|
VII. Result of the period:
21700 |
-130.322,00 |
-129.630,00 |
241.574,00 |
102.902,00 |
211.251,00 |
|
|
VIII. (Interim dividend):
21800 |
0,00 |
0,00 |
0,00 |
0,00 |
0,00 |
|
|
IX. Other net worth
instruments: 21900 |
0,00 |
0,00 |
0,00 |
0,00 |
0,00 |
|
|
A-2) Adjustments due to changes in value:
22000 |
0,00 |
0,00 |
0,00 |
0,00 |
0,00 |
|
|
A-3) Received subsidies, donations and legacies:
23000 |
0,00 |
0,00 |
0,00 |
0,00 |
0,00 |
|
|
B) NON-CURRENT LIABILITIES: 31000 |
5.404.834,00 |
5.282.475,00 |
5.405.127,00 |
6.414.292,00 |
3.310.303,00 |
|
|
I. Long-term provisions: 31100 |
0,00 |
0,00 |
0,00 |
0,00 |
0,00 |
|
|
II. Long-term creditors : 31200 |
1.607.299,00 |
1.755.376,00 |
1.922.419,00 |
2.065.246,00 |
1.336.942,00 |
|
|
1.- Amounts owed to credit
institutions: 31220 |
1.602.296,00 |
1.750.373,00 |
1.920.219,00 |
2.059.593,00 |
1.336.942,00 |
|
|
2.- Creditors from financial
leasing : 31230 |
0,00 |
0,00 |
0,00 |
0,00 |
0,00 |
|
|
3.- Other long-term
creditors : 31290 |
5.003,00 |
5.003,00 |
2.200,00 |
5.653,00 |
52.163,00 |
|
|
III. Long-term debts with Group companies and
associates: 31300 |
3.797.535,00 |
3.527.099,00 |
3.482.708,00 |
4.348.227,00 |
1.972.525,00 |
|
|
IV. Liabilities for deferred tax: 31400 |
0,00 |
0,00 |
0,00 |
819,00 |
836,00 |
|
|
V. Long-term accruals: 31500 |
0,00 |
0,00 |
0,00 |
0,00 |
0,00 |
|
|
VI. Non-current trade creditors : 31600 |
0,00 |
0,00 |
0,00 |
0,00 |
0,00 |
|
|
VII. Special long-term debts : 31700 |
0,00 |
0,00 |
0,00 |
0,00 |
0,00 |
|
|
C) CURRENT LIABILITIES : 32000 |
3.038.484,00 |
2.007.941,00 |
1.456.397,00 |
1.133.229,00 |
2.140.645,00 |
|
|
I. Liabilities linked to non-current assets held
for sale : 32100 |
0,00 |
0,00 |
0,00 |
0,00 |
0,00 |
|
|
II. Short-term provisions: 32200 |
0,00 |
0,00 |
0,00 |
0,00 |
0,00 |
|
|
III. Short-term creditors : 32300 |
342.314,00 |
315.482,00 |
309.777,00 |
97.587,00 |
986.132,00 |
|
|
1.- Amounts owed to credit
institutions: 32320 |
342.314,00 |
315.482,00 |
284.203,00 |
93.342,00 |
51.749,00 |
|
|
2.- Creditors from financial
leasing : 32330 |
0,00 |
0,00 |
0,00 |
0,00 |
0,00 |
|
|
3.- Other short-term
creditors : 32390 |
0,00 |
0,00 |
25.574,00 |
4.245,00 |
934.383,00 |
|
|
IV. Short-term debts with Group companies and
associates: 32400 |
1.939.733,00 |
1.480.227,00 |
383.943,00 |
368.042,00 |
578.328,00 |
|
|
V. Trade creditors and other accounts payable:
32500 |
756.437,00 |
212.232,00 |
762.677,00 |
667.600,00 |
576.185,00 |
|
|
1.- Suppliers: 32580 |
71.976,00 |
90.745,00 |
67.643,00 |
19.106,00 |
1.364,00 |
|
|
a)
Long-term debts : 32581 |
0,00 |
0,00 |
0,00 |
0,00 |
0,00 |
|
|
b)
Short-term debts : 32582 |
71.976,00 |
90.745,00 |
67.643,00 |
19.106,00 |
1.364,00 |
|
|
2.- Other creditors :
32590 |
684.461,00 |
121.487,00 |
695.034,00 |
648.494,00 |
574.821,00 |
|
|
VI. Short-term accruals: 32600 |
0,00 |
0,00 |
0,00 |
0,00 |
0,00 |
|
|
VII. Special short-term debts : 32700 |
0,00 |
0,00 |
0,00 |
0,00 |
0,00 |
|
|
TOTAL NET WORTH AND LIABILITIES (A + B + C) : 30000 |
13.820.280,00 |
13.237.404,00 |
13.179.716,00 |
13.824.138,00 |
11.671.138,00 |
|
|
|
ORIGINAL |
ORIGINAL |
ORIGINAL |
ORIGINAL |
ORIGINAL |
|
|
Profit and Loss |
2013 |
2012 |
2011 |
2010 |
2009 |
|
|
1. Net turnover: 40100 |
422.664,00 |
661.479,00 |
928.994,00 |
819.876,00 |
780.187,00 |
|
|
2. Changes in stocks of finished goods and work
in progress: 40200 |
0,00 |
0,00 |
0,00 |
0,00 |
0,00 |
|
|
3. Works carried out by the company for its
assets: 40300 |
0,00 |
0,00 |
0,00 |
0,00 |
0,00 |
|
|
4. Supplies : 40400 |
-45.371,00 |
-74.526,00 |
-85.688,00 |
-60.925,00 |
-21.986,00 |
|
|
5. Other operating income: 40500 |
58.103,00 |
83.656,00 |
92.181,00 |
93.502,00 |
53.296,00 |
|
|
6. Personnel costs: 40600 |
-278.779,00 |
-277.024,00 |
-274.648,00 |
-449.044,00 |
-448.461,00 |
|
|
7. Other operating costs: 40700 |
-316.824,00 |
-322.911,00 |
-263.284,00 |
-255.534,00 |
-170.648,00 |
|
|
8. Amortisation of fixed assets: 40800 |
-34.458,00 |
-102.401,00 |
-103.515,00 |
-98.487,00 |
-73.121,00 |
|
|
9. Allocation of subsidies of non-financial fixed
assets and other: 40900 |
0,00 |
0,00 |
0,00 |
0,00 |
0,00 |
|
|
10. Excess provisions : 41000 |
0,00 |
0,00 |
0,00 |
0,00 |
0,00 |
|
|
11. Impairment and result of transfers of fixed
assets: 41100 |
49.652,00 |
0,00 |
0,00 |
0,00 |
0,00 |
|
|
12. Negative difference in combined businesses: 41200 |
0,00 |
0,00 |
0,00 |
0,00 |
0,00 |
|
|
13. Other results : 41300 |
0,00 |
-5.936,00 |
-1.578,00 |
68.374,00 |
12.666,00 |
|
|
A) OPERATING INCOME (1 + 2 + 3 + 4 + 5 + 6 + 7 + 8 + 9 + 10 + 11 + 12
+ 13) : 49100 |
-145.013,00 |
-37.663,00 |
292.462,00 |
117.762,00 |
131.933,00 |
|
|
14. Financial income : 41400 |
29.490,00 |
28.988,00 |
4.810,00 |
1.834,00 |
3,00 |
|
|
a) Allocation of financial
subsidies, donations and legacies: 41430 |
0,00 |
0,00 |
0,00 |
0,00 |
0,00 |
|
|
b) Other financial income:
41490 |
29.490,00 |
28.988,00 |
4.810,00 |
1.834,00 |
3,00 |
|
|
15. Financial expenditure: 41500 |
-57.225,00 |
-74.887,00 |
-80.942,00 |
-83.742,00 |
-72.135,00 |
|
|
16. Changes in fair value of financial
instruments : 41600 |
0,00 |
0,00 |
18.539,00 |
33.624,00 |
-15.473,00 |
|
|
17. Exchange rate differences : 41700 |
0,00 |
0,00 |
0,00 |
0,00 |
0,00 |
|
|
18. Impairment and result for transfers of
financial instruments: 41800 |
0,00 |
0,00 |
0,00 |
0,00 |
169,00 |
|
|
19. Other financial income and expenditure:
42100 |
0,00 |
0,00 |
0,00 |
0,00 |
0,00 |
|
|
a) Incorporation of
financial expenditure to assets: 42110 |
0,00 |
0,00 |
0,00 |
0,00 |
0,00 |
|
|
b) Financial income from
arrangement with creditors: 42120 |
0,00 |
0,00 |
0,00 |
0,00 |
0,00 |
|
|
c) Other income and
expenditure: 42130 |
0,00 |
0,00 |
0,00 |
0,00 |
0,00 |
|
|
B) FINANCIAL REVENUE (14 + 15 + 16 + 17 + 18 + 19) : 49200 |
-27.735,00 |
-45.899,00 |
-57.593,00 |
-48.284,00 |
-87.436,00 |
|
|
C) NET RESULT BEFORE TAXES (A + B) : 49300 |
-172.748,00 |
-83.562,00 |
234.869,00 |
69.478,00 |
44.497,00 |
|
|
20. Income taxes: 41900 |
42.426,00 |
-46.068,00 |
6.705,00 |
33.424,00 |
166.754,00 |
|
|
D) RESULT OF THE PERIOD (C + 20) : 49500 |
-130.322,00 |
-129.630,00 |
241.574,00 |
102.902,00 |
211.251,00 |
|
> Normal Balance Sheet under the rules of the 1990 General Accounting
Plan (repealed since 1st January of 2008)
Information corresponding
to the fiscal year 2013 2012 2011 2010 2009 has been
compiled based on the equivalence criteria stipulated in Act JUS/206/2009.
Where the provisions of the Act did not establish relevant equivalence
criteria, To view details on the methodology
2013 2012 2011 2010 2009 is taken from information
submitted to the TRADE REGISTER.
|
|
EQUIVALENCIA |
EQUIVALENCIA |
EQUIVALENCIA |
EQUIVALENCIA |
EQUIVALENCIA |
|
|
ASSETS |
2013 |
2012 |
2011 |
2010 |
2009 |
|
|
A) SHAREHOLDERS (PARTNERS) BY UNCALLED SUSCRIBED CAPITAL: |
0,00 |
0,00 |
0,00 |
0,00 |
0,00 |
|
|
B) FIXED ASSETS: |
10.063.170,00 |
10.203.862,00 |
10.386.224,00 |
11.236.951,00 |
10.030.999,00 |
|
|
I. Formation expenses: |
0,00 |
0,00 |
0,00 |
0,00 |
0,00 |
|
|
II. Intangible fixed assets: |
84.319,00 |
99.519,00 |
114.720,00 |
129.920,00 |
145.120,00 |
|
|
III. Tangible fixed assets: |
4.141.625,00 |
4.467.550,00 |
4.547.853,00 |
4.616.823,00 |
4.396.671,00 |
|
|
IV. Financial investments: |
5.837.226,00 |
5.636.793,00 |
5.723.651,00 |
6.490.208,00 |
5.489.208,00 |
|
|
V. Own shares: |
0,00 |
0,00 |
0,00 |
0,00 |
0,00 |
|
|
VI. Long-term trade receivables: |
0,00 |
0,00 |
0,00 |
0,00 |
0,00 |
|
|
C) Deferred expenses: |
0,00 |
0,00 |
0,00 |
0,00 |
0,00 |
|
|
D) CURRENT ASSETS: |
3.757.110,00 |
3.033.542,00 |
2.793.492,00 |
2.587.187,00 |
1.640.139,00 |
|
|
I. Called-up share capital (not paid): |
0,00 |
0,00 |
0,00 |
0,00 |
0,00 |
|
|
II. Stocks: |
0,00 |
0,00 |
0,00 |
0,00 |
0,00 |
|
|
III. Debtors: |
684.510,00 |
669.678,00 |
893.165,00 |
507.737,00 |
595.436,00 |
|
|
IV. Short-term investments: |
3.042.482,00 |
1.288.108,00 |
1.847.941,00 |
1.988.091,00 |
840.339,00 |
|
|
V. Short-term treasury shares: |
0,00 |
0,00 |
0,00 |
0,00 |
0,00 |
|
|
VI. Cash at bank and in hand: |
30.118,00 |
1.069.521,00 |
52.386,00 |
88.727,00 |
201.343,00 |
|
|
VII. Prepayments and accrued income: |
0,00 |
6.235,00 |
0,00 |
2.632,00 |
3.021,00 |
|
|
GENERAL TOTAL (A + B + C + D): |
13.820.280,00 |
13.237.404,00 |
13.179.716,00 |
13.824.138,00 |
11.671.138,00 |
|
MERCANTILE
REGISTRY.
|
|
EQUIVALENCIA |
EQUIVALENCIA |
EQUIVALENCIA |
EQUIVALENCIA |
EQUIVALENCIA |
|
|
LIABILITIES |
2013 |
2012 |
2011 |
2010 |
2009 |
|
|
A) EQUITY: |
5.376.962,00 |
5.946.988,00 |
6.318.192,00 |
6.276.617,00 |
6.220.190,00 |
|
|
I. Subscribed capital: |
1.500.000,00 |
1.500.000,00 |
1.500.000,00 |
1.500.000,00 |
1.500.000,00 |
|
|
II. Share premium: |
0,00 |
0,00 |
0,00 |
0,00 |
0,00 |
|
|
III. Revaluation reserves: |
0,00 |
0,00 |
0,00 |
0,00 |
0,00 |
|
|
IV. Reserves: |
4.007.284,00 |
4.576.618,00 |
4.576.618,00 |
4.673.715,00 |
4.508.939,00 |
|
|
a) Differences for capital
adjustment to euros: |
0,00 |
0,00 |
0,00 |
0,00 |
0,00 |
|
|
b) Remaining Reserves:
|
4.007.284,00 |
4.576.618,00 |
4.576.618,00 |
4.673.715,00 |
4.508.939,00 |
|
|
V. Profit or loss brought forward: |
0,00 |
0,00 |
0,00 |
0,00 |
0,00 |
|
|
VI. Profit or loss for the financial year: |
-130.322,00 |
-129.630,00 |
241.574,00 |
102.902,00 |
211.251,00 |
|
|
VII. Interim dividend paid: |
0,00 |
0,00 |
0,00 |
0,00 |
0,00 |
|
|
VIII. Own shares for capital reduction: |
0,00 |
0,00 |
0,00 |
0,00 |
0,00 |
|
|
B) Deferred income: |
0,00 |
0,00 |
0,00 |
0,00 |
0,00 |
|
|
C) PROVISIONS FOR LIABILITIES AND CHARGES: |
0,00 |
0,00 |
0,00 |
0,00 |
0,00 |
|
|
D) LONG TERM LIABILITIES: |
5.404.834,00 |
5.282.475,00 |
5.405.127,00 |
6.414.292,00 |
3.310.303,00 |
|
|
E) SHORT TERM CREDITORS: |
3.038.484,00 |
2.007.941,00 |
1.456.397,00 |
1.133.229,00 |
2.140.645,00 |
|
|
F) SHORT-TERM PROVISIONS FOR LIABILITIES AND CHARGES: |
0,00 |
0,00 |
0,00 |
0,00 |
0,00 |
|
|
GENERAL TOTAL (A + B + C + D + E + F): |
13.820.280,00 |
13.237.404,00 |
13.179.716,00 |
13.824.138,00 |
11.671.138,00 |
|
MERCANTILE
REGISTRY.
|
|
EQUIVALENCIA |
EQUIVALENCIA |
EQUIVALENCIA |
EQUIVALENCIA |
EQUIVALENCIA |
|
|
DEBIT |
2013 |
2012 |
2011 |
2010 |
2009 |
|
|
A) CHARGES (A.1 to A.15): |
690.231,00 |
903.753,00 |
802.950,00 |
914.308,00 |
635.070,00 |
|
|
A.1. Operating consumption:
|
45.371,00 |
74.526,00 |
85.688,00 |
60.925,00 |
21.986,00 |
|
|
A.2. Staff Costs: |
278.779,00 |
277.024,00 |
274.648,00 |
449.044,00 |
448.461,00 |
|
|
a)
Wages, salaries et al.: |
271.592,00 |
269.883,00 |
267.568,00 |
437.468,00 |
436.900,00 |
|
|
b)
Social security costs: |
7.187,00 |
7.141,00 |
7.080,00 |
11.576,00 |
11.561,00 |
|
|
A.3. Depreciation expense:
|
34.458,00 |
102.401,00 |
103.515,00 |
98.487,00 |
73.121,00 |
|
|
A.4. Variation of trade
provisions and losses of unrecovered receivables: |
0,00 |
0,00 |
0,00 |
0,00 |
0,00 |
|
|
A.5. Other operating
charges: |
316.824,00 |
322.911,00 |
263.284,00 |
255.534,00 |
170.648,00 |
|
|
A.I. OPERATING BENEFITS
(B.1-A.1-A.2-A.3-A.4-A.5): |
0,00 |
0,00 |
294.040,00 |
49.388,00 |
119.267,00 |
|
|
A.6. Financial and similar
charges: |
57.225,00 |
74.887,00 |
80.942,00 |
83.742,00 |
72.135,00 |
|
|
a) Due
to liabilities with companies of the group: |
9.784,00 |
12.804,00 |
13.839,00 |
14.317,00 |
12.333,00 |
|
|
b) Due
to liabilities with associated companies: |
0,00 |
0,00 |
0,00 |
0,00 |
0,00 |
|
|
c) Due
to other debts: |
47.441,00 |
62.083,00 |
67.103,00 |
69.425,00 |
59.802,00 |
|
|
d)
Losses from financial investments: |
0,00 |
0,00 |
0,00 |
0,00 |
0,00 |
|
|
A.7. Financial investment provision
change: |
0,00 |
0,00 |
0,00 |
0,00 |
15.473,00 |
|
|
A.8. Exchange losses: |
0,00 |
0,00 |
0,00 |
0,00 |
0,00 |
|
|
A.II. POSITIVE FINANCIAL RESULTS
(B.2+B.3-A.6-A.7-A.8): |
0,00 |
0,00 |
0,00 |
0,00 |
0,00 |
|
|
A.III. PROFIT FROM ORDINARY ACTIVITIES
(A.I+A.II-B.I-B.II): |
0,00 |
0,00 |
236.447,00 |
1.104,00 |
31.831,00 |
|
|
A.9. Changes in provisions
for intangible, tangible and securities portfolio: |
0,00 |
0,00 |
0,00 |
0,00 |
0,00 |
|
|
A.10. Losses from tangible
and intangible fixed assets and portfolio: |
0,00 |
0,00 |
0,00 |
0,00 |
0,00 |
|
|
A.11. Losses from
transactions with own shares and debentures: |
0,00 |
0,00 |
0,00 |
0,00 |
0,00 |
|
|
A.12. Extraordinary
expenses: |
0,00 |
5.936,00 |
1.578,00 |
0,00 |
0,00 |
|
|
A.13. Prior year expenses
and losses: |
0,00 |
0,00 |
0,00 |
0,00 |
0,00 |
|
|
A.IV. EXTRAORDINARY PROFIT (B.4+B.5+B.6+B.7+B.8-A.9-A.10-A.11-A.12-A.13):
|
49.652,00 |
0,00 |
0,00 |
68.374,00 |
12.666,00 |
|
|
A.V. PROFIT BEFORE TAXES (A.III+A.IV-B.III-B.IV):
|
0,00 |
0,00 |
234.869,00 |
69.478,00 |
44.497,00 |
|
|
A.14. Corporation Tax:
|
-42.426,00 |
46.068,00 |
-6.705,00 |
-33.424,00 |
-166.754,00 |
|
|
A.15. Miscellaneous taxes:
|
0,00 |
0,00 |
0,00 |
0,00 |
0,00 |
|
|
A.VI. FINANCIAL YEAR RESULT (PROFIT)
(A.V-A.14-A.15): |
0,00 |
0,00 |
241.574,00 |
102.902,00 |
211.251,00 |
|
MERCANTILE
REGISTRY.
|
|
EQUIVALENCIA |
EQUIVALENCIA |
EQUIVALENCIA |
EQUIVALENCIA |
EQUIVALENCIA |
|
|
CREDIT |
2013 |
2012 |
2011 |
2010 |
2009 |
|
|
B) INCOME ( B.1 to B.8): |
559.909,00 |
774.123,00 |
1.044.524,00 |
1.017.210,00 |
846.321,00 |
|
|
B.1. Operating income:
|
480.767,00 |
745.135,00 |
1.021.175,00 |
913.378,00 |
833.483,00 |
|
|
a) Net
total sales: |
422.664,00 |
661.479,00 |
928.994,00 |
819.876,00 |
780.187,00 |
|
|
b)
Miscellaneous operating income: |
58.103,00 |
83.656,00 |
92.181,00 |
93.502,00 |
53.296,00 |
|
|
B.I. PÉRDIDAS DE EXPLOTACIÓN
(A.1+A.2+A.3+A.4+A.5-B.1 ): |
194.665,00 |
31.727,00 |
0,00 |
0,00 |
0,00 |
|
|
B.2. Financial income:
|
29.490,00 |
28.988,00 |
23.349,00 |
35.458,00 |
172,00 |
|
|
a)
Companies of the group: |
303,00 |
298,00 |
240,00 |
1.771,00 |
3,00 |
|
|
b) In
associated companies: |
0,00 |
0,00 |
0,00 |
0,00 |
0,00 |
|
|
c)
Miscellaneous: |
29.187,00 |
28.690,00 |
23.109,00 |
33.687,00 |
0,00 |
|
|
d) Profit
on financial investment: |
0,00 |
0,00 |
0,00 |
0,00 |
169,00 |
|
|
B.3. Exchange gains: |
0,00 |
0,00 |
0,00 |
0,00 |
0,00 |
|
|
B.II. NEGATIVE FINANCIAL RESULTS
(A.6+A.7+A.8-B.2-B.3): |
27.735,00 |
45.899,00 |
57.593,00 |
48.284,00 |
87.436,00 |
|
|
B.III. LOSSES ON ORDINARY ACTIVITIES ( B.I + B.II
- A.I - A.II ): |
222.400,00 |
77.626,00 |
0,00 |
0,00 |
0,00 |
|
|
B.4. Profit on disposal of both
tangible and intangible fixed assets and securities portfolio: |
49.652,00 |
0,00 |
0,00 |
0,00 |
0,00 |
|
|
B.5. Profit on transactions
with own shares and debentures: |
0,00 |
0,00 |
0,00 |
0,00 |
0,00 |
|
|
B.6. Capital grants
transferred to profit and loss: |
0,00 |
0,00 |
0,00 |
0,00 |
0,00 |
|
|
B.7. Extraordinary income:
|
0,00 |
0,00 |
0,00 |
68.374,00 |
12.666,00 |
|
|
B.8. Income and profit of
former financial years: |
0,00 |
0,00 |
0,00 |
0,00 |
0,00 |
|
|
B.IV. NEGATIVE EXTRAORDINARY RESULTS
(A.9+A.10+A.11+A.12+A.13-B.4-B.5-B.6-B.7-B.8): |
0,00 |
5.936,00 |
1.578,00 |
0,00 |
0,00 |
|
|
B.V. LOSSES BEFORE TAXES (B.III+B.IV-A.III-A.IV):
|
172.748,00 |
83.562,00 |
0,00 |
0,00 |
0,00 |
|
|
B.VI. FINANCIAL YEAR RESULTS (LOSSES)
(B.V+A.14+A.15): |
130.322,00 |
129.630,00 |
0,00 |
0,00 |
0,00 |
|
MERCANTILE
REGISTRY.
CASHFLOW
STATEMENT
|
|
|
|
|
Model: Normal
> Source of information: Data contained in this section is taken from
the information declared in the Annual Accounts submitted to the Trade
Register.
|
|
2013 |
2012 |
2011 |
2010 |
2009 |
|
|
1. Fiscal year result before taxes.: 61100 |
-172.748,00 |
-83.562,00 |
234.869,00 |
69.478,00 |
44.497,00 |
|
|
2. Results adjustments.: 61200 |
62.193,00 |
148.300,00 |
179.647,00 |
180.395,00 |
145.253,00 |
|
|
a) Fixed Assets Amortization (+).: 61201 |
34.458,00 |
102.401,00 |
103.515,00 |
98.487,00 |
73.121,00 |
|
|
g) Financial income (-).: 61207 |
-29.490,00 |
-28.988,00 |
-4.810,00 |
-1.834,00 |
-3,00 |
|
|
h) Financial Expenses (+). : 61208 |
57.225,00 |
74.887,00 |
80.942,00 |
83.742,00 |
72.135,00 |
|
|
3. Changes in current capital equity.: 61300 |
-1.172.265,00 |
94.434,00 |
-220.701,00 |
-1.010.029,00 |
-1.022.180,00 |
|
|
d) Debtors and other accounts receivable (+/-). :
61302 |
-10.757,00 |
137.349,00 |
-465.265,00 |
12.495,00 |
6.513,00 |
|
|
c) Other current assets (+/-). : 61303 |
-1.748.139,00 |
553.598,00 |
142.782,00 |
-1.147.363,00 |
65.418,00 |
|
|
d) Creditors and other accounts payable (+/-). :
61304 |
586.631,00 |
-596.513,00 |
101.782,00 |
124.839,00 |
-1.094.111,00 |
|
|
4. Other cash flows for operating activities.: 61400 |
-27.735,00 |
-45.899,00 |
-76.132,00 |
-81.908,00 |
-72.132,00 |
|
|
a) Interest payments (-). : 61401 |
-57.225,00 |
-74.887,00 |
-80.942,00 |
-83.742,00 |
-72.135,00 |
|
|
c) Interest collection (+). : 61403 |
29.490,00 |
28.988,00 |
4.810,00 |
1.834,00 |
3,00 |
|
|
5. Operating activity cash flows (1 + 2 + 3 + 4) : 61500 |
-1.310.555,00 |
113.273,00 |
117.683,00 |
-842.064,00 |
-904.562,00 |
|
|
6. Payments for investment (-).: 62100 |
-4.140.713,00 |
-20,00 |
-828.043,00 |
-1.225.256,00 |
-1.555.030,00 |
|
|
a) Companies of the group and affiliates. :
62101 |
-835.658,00 |
0,00 |
0,00 |
-1.000.000,00 |
-107.565,00 |
|
|
b) Intangible fixed assets. : 62102 |
0,00 |
0,00 |
0,00 |
0,00 |
-145.120,00 |
|
|
c) Fixed assets. : 62103 |
0,00 |
0,00 |
-8.364,00 |
0,00 |
-22.295,00 |
|
|
d) Real estate investment. : 62104 |
0,00 |
0,00 |
0,00 |
-224.256,00 |
-1.156.629,00 |
|
|
e) Other financial assets. : 62105 |
0,00 |
-20,00 |
-819.679,00 |
-1.000,00 |
0,00 |
|
|
f) Non-current assets kept for sale. :
62106 |
-3.300.980,00 |
0,00 |
0,00 |
0,00 |
0,00 |
|
|
h) Other assets. : 62108 |
-4.075,00 |
0,00 |
0,00 |
0,00 |
-123.421,00 |
|
|
7. Divestment payment collection (+). : 62200 |
4.277.330,00 |
268.520,00 |
1.758.607,00 |
94.508,00 |
0,00 |
|
|
a) Companies of the group and affiliates. :
62201 |
0,00 |
86.878,00 |
1.586.236,00 |
0,00 |
0,00 |
|
|
b) Intangible fixed assets. : 62202 |
15.200,00 |
15.201,00 |
15.200,00 |
15.200,00 |
0,00 |
|
|
c) Fixed assets. : 62203 |
310.224,00 |
2.969,00 |
0,00 |
4.104,00 |
0,00 |
|
|
d) Real estate investment. : 62204 |
3.316.681,00 |
77.334,00 |
77.334,00 |
0,00 |
0,00 |
|
|
e) Other financial assets. : 62205 |
635.225,00 |
0,00 |
0,00 |
0,00 |
0,00 |
|
|
h) Other assets. : 62208 |
0,00 |
86.138,00 |
79.837,00 |
75.204,00 |
0,00 |
|
|
8. Investment activity cash flows (6 + 7) minus Amortization:
62300 |
102.159,00 |
166.099,00 |
827.049,00 |
-1.229.235,00 |
-1.628.151,00 |
|
|
9. Payment collection and payments for equity instruments. :
63100 |
-439.704,00 |
-241.574,00 |
-199.999,00 |
-46.475,00 |
-1,00 |
|
|
b) Amortization of assets instruments (-). :
63102 |
-439.704,00 |
-241.574,00 |
-199.999,00 |
-46.475,00 |
-1,00 |
|
|
10. Payment collection and payments for financial liabilities instruments.:
63200 |
608.697,00 |
979.337,00 |
-781.074,00 |
1.952.995,00 |
2.764.602,00 |
|
|
a) Issuance : 63201 |
756.774,00 |
1.174.757,00 |
228.091,00 |
3.139.946,00 |
2.776.230,00 |
|
|
2. Debts incurred with credit institutions (+). :
63203 |
26.832,00 |
31.279,00 |
190.861,00 |
764.244,00 |
0,00 |
|
|
3. Debts incurred with companies of the group and
affiliates (+).: 63204 |
729.942,00 |
1.140.675,00 |
15.901,00 |
2.375.702,00 |
2.094.032,00 |
|
|
5. Other debts (+). : 63206 |
0,00 |
2.803,00 |
21.329,00 |
0,00 |
682.198,00 |
|
|
b) Repayment and amortization of : 63207 |
-148.077,00 |
-195.420,00 |
-1.009.165,00 |
-1.186.951,00 |
-11.628,00 |
|
|
2. Debts incurred with credit institutions (-).:
63209 |
-148.077,00 |
-169.846,00 |
-139.374,00 |
0,00 |
-11.628,00 |
|
|
3. Debts incurred with companies of the group and
affiliates (-). : 63210 |
0,00 |
0,00 |
-865.519,00 |
-210.286,00 |
0,00 |
|
|
5. Other debts (-). : 63212 |
0,00 |
-25.574,00 |
-4.272,00 |
-976.665,00 |
0,00 |
|
|
11. Payments from dividends and remunerations from other assets
instruments. : 63300 |
0,00 |
0,00 |
0,00 |
0,00 |
0,00 |
|
|
12. Cash flows for financing activities (9+10+11).: 63400 |
168.993,00 |
737.763,00 |
-981.073,00 |
1.906.520,00 |
2.764.601,00 |
|
|
D) EFFECT OF EXCHANGE RATE CHANGES: 64000 |
0,00 |
0,00 |
0,00 |
0,00 |
0,00 |
|
|
E) NET INCREASE/DECREASE OF CASH OR EQUIVALENT ASSETS
(+/-5+/-8+/12+/-D) : 65000 |
-1.039.403,00 |
1.017.135,00 |
-36.341,00 |
-164.779,00 |
231.888,00 |
|
|
Cash or equivalent assets as of beginning of the
fiscal year.: 65100 |
1.069.521,00 |
52.386,00 |
88.727,00 |
201.343,00 |
21.618,00 |
|
|
Cash or equivalent assets as of end of the fiscal
year.: 65200 |
30.118,00 |
1.069.521,00 |
52.386,00 |
88.727,00 |
201.343,00 |
|
FINANCIAL
DIAGNOSIS
|
> Economic-Financial Comparative Analysis
Data used in the following ratios and indicators is taken from the
Annual Accounts submitted by the company to the TRADE REGISTER.
> Comparison within the Sector
|
Cash Flow |
2013 |
2012 |
Variación 2013 - 2012 |
|
|||
|
|
Empresa |
Sector |
Empresa |
Sector |
Empresa |
Sector |
|
|
Cash Flow over Sales: |
-2,46 % |
0,02 % |
1,54 % |
0,17 % |
-259,93 % |
-90,21 % |
|
|
EBITDA over Sales: |
-37,90 % |
-1,49 % |
10,68 % |
7,58 % |
-454,77 % |
-119,69 % |
|
|
Cash Flow Yield: |
-0,08 % |
0,00 % |
0,08 % |
0,04 % |
-197,88 % |
-90,28 % |
|
|
Profitability |
2013 |
2012 |
Variación 2013 - 2012 |
|
|||
|
|
Empresa |
Sector |
Empresa |
Sector |
Empresa |
Sector |
|
|
Operating economic profitability: |
-2,94 % |
-12,50 % |
-0,50 % |
0,51 % |
-483,99 % |
-2.532,96 % |
|
|
Total economic profitability: |
-0,84 % |
-3,40 % |
-0,07 % |
-0,03 % |
-1.175,51 % |
-12.263,34 % |
|
|
Financial profitability: |
-2,42 % |
-11,98 % |
-2,18 % |
-3,94 % |
-11,19 % |
-204,00 % |
|
|
Margin: |
-30,16 % |
-25,00 % |
-4,26 % |
0,94 % |
-608,40 % |
-2.758,15 % |
|
|
Mark-up: |
-35,93 % |
-22,08 % |
-10,42 % |
-6,14 % |
-244,91 % |
-259,52 % |
|
|
Solvency |
2013 |
2012 |
Variación 2013 - 2012 |
|
|||
|
|
Empresa |
Sector |
Empresa |
Sector |
Empresa |
Sector |
|
|
Liquidity: |
0,01 |
0,16 |
0,53 |
0,16 |
-98,14 |
4,16 |
|
|
Acid Test: |
1,19 |
1,22 |
1,44 |
0,86 |
-17,28 |
40,95 |
|
|
Working Capital / Investment: |
0,28 |
0,08 |
0,07 |
0,08 |
320,54 |
2,12 |
|
|
Solvency: |
1,24 |
1,70 |
1,51 |
1,43 |
-18,15 |
18,75 |
|
|
Indebtedness |
2013 |
2012 |
Variación 2013 - 2012 |
|
|||
|
|
Empresa |
Sector |
Empresa |
Sector |
Empresa |
Sector |
|
|
Indebtedness level: |
1,57 |
1,06 |
1,23 |
1,07 |
28,09 |
-1,11 |
|
|
Borrowing Composition: |
1,78 |
0,96 |
2,63 |
1,22 |
-32,39 |
-21,17 |
|
|
Repayment Ability: |
-8,12 |
134,06 |
7,17 |
14,17 |
-213,33 |
846,14 |
|
|
Warranty: |
1,64 |
2,11 |
1,82 |
1,94 |
-9,85 |
8,71 |
|
|
Generated resources / Total creditors: |
-0,01 |
-0,06 |
0,00 |
0,01 |
|
-606,90 |
|
|
Efficiency |
2013 |
2012 |
Variación 2013 - 2012 |
|
|||
|
|
Empresa |
Sector |
Empresa |
Sector |
Empresa |
Sector |
|
|
Productivity: |
0,43 |
0,94 |
1,26 |
1,30 |
-66,11 |
-27,52 |
|
|
Turnover of Collection Rights : |
0,90 |
2,93 |
1,42 |
3,64 |
-36,77 |
-19,59 |
|
|
Turnover of Payment Entitlements: |
0,48 |
2,36 |
1,87 |
2,35 |
-74,43 |
0,13 |
|
|
Stock rotation: |
|
2,55 |
|
2,20 |
|
16,00 |
|
|
Assets turnover: |
0,10 |
0,50 |
0,12 |
0,55 |
-17,56 |
-8,47 |
|
|
Borrowing Cost: |
0,68 |
3,37 |
1,03 |
2,83 |
-34,02 |
19,38 |
|
> Trend of indicators under the General Accounting Plan of 2007
(2013, 2012, 2011, 2010, 2009)
|
Cash Flow |
2013 |
2012 |
2011 |
2010 |
2009 |
|
|
Cash Flow over Sales: |
-2,46 % |
1,54 % |
-0,04 % |
-0,14 % |
29,72 % |
|
|
EBITDA over Sales: |
-37,90 % |
10,68 % |
42,79 % |
18,04 % |
24,66 % |
|
|
Cash Flow Yield: |
-0,08 % |
0,08 % |
0,00 % |
-0,01 % |
1,99 % |
|
|
Profitability |
2013 |
2012 |
2011 |
2010 |
2009 |
|
|
Operating economic profitability: |
-2,94 % |
-0,50 % |
5,24 % |
0,92 % |
2,23 % |
|
|
Total economic profitability: |
-0,84 % |
-0,07 % |
2,40 % |
1,11 % |
1,00 % |
|
|
Financial profitability: |
-2,42 % |
-2,18 % |
3,82 % |
1,64 % |
3,40 % |
|
|
Margin: |
-30,16 % |
-4,26 % |
28,79 % |
5,41 % |
14,31 % |
|
|
Mark-up: |
-35,93 % |
-10,42 % |
23,15 % |
0,12 % |
3,82 % |
|
|
Solvency |
2013 |
2012 |
2011 |
2010 |
2009 |
|
|
Liquidity: |
0,01 |
0,53 |
0,04 |
0,08 |
0,09 |
|
|
Acid Test: |
1,19 |
1,44 |
1,76 |
2,01 |
0,58 |
|
|
Working Capital / Investment: |
0,28 |
0,07 |
0,08 |
0,08 |
-0,08 |
|
|
Solvency: |
1,24 |
1,51 |
1,92 |
2,28 |
0,77 |
|
|
Indebtedness |
2013 |
2012 |
2011 |
2010 |
2009 |
|
|
Indebtedness level: |
1,57 |
1,23 |
1,09 |
1,20 |
0,88 |
|
|
Borrowing Composition: |
1,78 |
2,63 |
3,71 |
5,66 |
1,55 |
|
|
Repayment Ability: |
-8,12 |
7,17 |
-188,81 |
-67,02 |
28,73 |
|
|
Warranty: |
1,64 |
1,82 |
1,92 |
1,83 |
2,14 |
|
|
Generated resources / Total creditors: |
-0,01 |
0,00 |
0,05 |
0,03 |
0,05 |
|
|
Efficiency |
2013 |
2012 |
2011 |
2010 |
2009 |
|
|
Productivity: |
0,43 |
1,26 |
2,45 |
1,33 |
1,43 |
|
|
Turnover of Collection Rights : |
0,90 |
1,42 |
1,54 |
4,61 |
3,96 |
|
|
Turnover of Payment Entitlements: |
0,48 |
1,87 |
0,46 |
0,47 |
0,33 |
|
|
Assets turnover: |
0,10 |
0,12 |
0,18 |
0,17 |
0,16 |
|
|
Borrowing Cost: |
0,68 |
1,03 |
1,18 |
1,11 |
1,32 |
|
COMPARATIVE SECTORIAL BALANCE
|
Sector-based Comparison
under the rules of the New General Accounting Plan.
|
|
Variación - |
|
|
|
Empresa |
Sector |
|
|
Variación - |
|
|
|
Empresa |
Sector |
|
|
Variación - |
|
|
|
Empresa |
Sector |
News
|
|
Laopinioncoruña.es |
12/02/2015 |
|
La coruñesa
Invertaresa abre su primera planta de producción en Latinoamérica |
|
|
Companies
related |
|
Public
Tenders and Works Won
|
No Public Tenders assigned
to the name of the company.
Research
Summary
|
|
The company was established
in March 1999. It is dedicated to all the typical activities of holding
companies. In charge of the owner there are four employees. In light of the
above, we consider it possible to maintain operational relations of habitual
credit. |
Sources
|
|
Registry of
Commerce's Official Gazette. Own and external data bases Company References |
FOREIGN EXCHANGE RATES
|
Currency |
Unit
|
Indian Rupees |
|
US Dollar |
1 |
Rs.65.12 |
|
UK Pound |
1 |
Rs.101.62 |
|
Euro |
1 |
Rs.72.56 |
INFORMATION DETAILS
|
Analysis Done by
: |
RAS |
|
|
|
|
Report Prepared
by : |
ASH |
RATING EXPLANATIONS
|
RATING |
STATUS |
PROPOSED CREDIT LINE |
|
|
>86 |
Aaa |
Possesses an extremely sound financial base with the strongest capability
for timely payment of interest and principal sums |
Unlimited |
|
71-85 |
Aa |
Possesses adequate working capital. No caution needed for credit
transaction. It has above average (strong) capability for payment of interest
and principal sums |
Large |
|
56-70 |
A |
Financial & operational base are regarded healthy. General
unfavourable factors will not cause fatal effect. Satisfactory capability for
payment of interest and principal sums |
Fairly Large |
|
41-55 |
Ba |
Overall operation is considered normal. Capable to meet normal
commitments. |
Satisfactory |
|
26-40 |
B |
Capability to overcome financial difficulties seems comparatively
below average. |
Small |
|
11-25 |
Ca |
Adverse factors are apparent. Repayment of interest and principal sums
in default or expected to be in default upon maturity |
Limited with
full security |
|
<10 |
C |
Absolute credit risk exists. Caution needed to be exercised |
Credit not
recommended |
|
-- |
NB |
New Business |
-- |
This score serves as a reference to assess
SC’s credit risk and to set the amount of credit to be extended. It is calculated
from a composite of weighted scores obtained from each of the major sections of
this report. The assessed factors and their relative weights (as indicated
through %) are as follows:
Financial
condition (40%) Ownership
background (20%) Payment record
(10%)
Credit history
(10%) Market trend (10%) Operational size
(10%)
This report is issued at your request without any
risk and responsibility on the part of MIRA INFORM PRIVATE LIMITED (MIPL)
or its officials.