MIRA INFORM REPORT
|
Report No. : |
337092 |
|
Report Date : |
18.08.2015 |
IDENTIFICATION DETAILS
|
Name : |
BRIGADE ENTERPRISES LIMITED |
|
|
|
|
Registered
Office : |
29 and 30th Floor, World Trade Center, 26/1, Brigade Gateway, Dr. Rajkumar Road, Malleswaram – Rajajinagar, Bangalore – 560055, Karnataka |
|
Tel. No.: |
91-80-41379200 |
|
|
|
|
Country : |
India |
|
|
|
|
Financials (as
on) : |
31.03.2015 |
|
|
|
|
Date of
Incorporation : |
08.11.1995 |
|
|
|
|
Com. Reg. No.: |
08-019126 |
|
|
|
|
Capital
Investment / Paid-up Capital : |
Rs.1127.400 Million |
|
|
|
|
IEC No.: |
0799016411 |
|
|
|
|
CIN No.: [Company Identification
No.] |
L85110KA1995PLC019126 |
|
|
|
|
TAN No.: [Tax Deduction &
Collection Account No.] |
BLRB00957F |
|
|
|
|
PAN No.: [Permanent Account No.] |
AAACB7459F |
|
|
|
|
Legal Form : |
A Public Limited Liability company. The company’s Shares are Listed on
the Stock Exchanges. |
|
|
|
|
Line of Business
: |
Construction Activity |
|
|
|
|
No. of Employees
: |
498 (Approximately) |
RATING & COMMENTS
|
MIRA’s Rating : |
Ba (53) |
|
RATING |
STATUS |
PROPOSED CREDIT LINE |
|
|
41-55 |
Ba |
Overall operation is considered normal. Capable to meet normal commitments. |
Satisfactory |
|
Maximum Credit Limit : |
USD 38000000 |
|
|
|
|
Status : |
Good |
|
|
|
|
Payment Behaviour : |
Regular |
|
|
|
|
Litigation : |
Exist |
|
|
|
|
Comments : |
Subject is the flagship company of the Brigade group, it was incorporated
during the year 1995. It has a fine track record. For the financial year 2015, the company has healthy operational
activity marked by impressive top line growth along with decent sales
turnover, achieved a profitability margin of 7.3%. Further, the company has fine financial risk profile marked by
diversified revenue profile along with experienced promoters scale. Trade relations reported as fair. Business is active. Payments terms
are regular. In view of vast experience of the promoters and directors, the company
can be considered for business dealings at usual trade terms and conditions. |
NOTES :
Any query related to this report can be made
on e-mail : infodept@mirainform.com
while quoting report number, name and date.
ECGC Country Risk Classification List – March 31, 2015
|
Country Name |
Previous Rating (31.12.2014) |
Current Rating (31.03.2015) |
|
India |
A1 |
A1 |
|
Risk Category |
ECGC
Classification |
|
Insignificant |
A1 |
|
Low |
A2 |
|
Moderate |
B1 |
|
High |
B2 |
|
Very High |
C1 |
|
Restricted |
C2 |
|
Off-credit |
D |
EXTERNAL AGENCY RATING
|
Rating Agency Name |
CRISIL |
|
Rating |
Long Term Bank Facilities = “A” |
|
Rating Explanation |
Adequate degree of safety and low credit risk. |
|
Date |
September, 2014 |
RBI DEFAULTERS’ LIST STATUS
Subject’s name is not enlisted as a defaulter
in the publicly available RBI Defaulters’ list.
EPF (Employee Provident Fund) DEFAULTERS’ LIST STATUS
Subject’s name is not enlisted as a defaulter
in the publicly available EPF (Employee Provident Fund) Defaulters’ list as of
31-03-2013.
INFORMATION DENIED
Management non-co-operative (Tel No.:91-80-41379200)
LOCATIONS
|
Registered Office : |
29 and 30th Floor,
World Trade Center, 26/1, Brigade Gateway, Dr. Rajkumar Road, Malleswaram –
Rajajinagar, Bangalore – 560055, Karnataka, India |
|
Tel. No.: |
91-80-41379200 |
|
Fax No.: |
91-80-22210784 |
|
E-Mail : |
|
|
Website : |
|
|
|
|
|
Branch Office: |
Located At:
|
DIRECTORS
As on: 31.03.2014
|
Name : |
Mr. M. R. Jaishankar |
|
Designation : |
Chairman & Managing Director |
|
|
|
|
Name : |
Ms. Githa Shankar |
|
Designation : |
Wholetime Director |
|
|
|
|
Name : |
Mr. M. R. Gurumurthy |
|
Designation : |
Director |
|
|
|
|
Name : |
Mr. M. R. Shivram |
|
Designation : |
Director |
|
|
|
|
Name : |
Mr. P.M Thampi |
|
Designation : |
Independent Director |
|
|
|
|
Name : |
Mr. P. V. Maiya |
|
Designation : |
Independent Director |
|
|
|
|
Name : |
Dr. Srinivasa Murthy |
|
Designation : |
Independent Director |
|
|
|
|
Name : |
Mr. Aroon Raman |
|
Designation : |
Independent Director |
|
|
|
|
Name: |
Mr. Pallipuram Mathai Thampi |
|
Designation : |
Director |
|
|
|
|
Name: |
Mr. Shivram Ramachandra Setty Mysore |
|
Designation : |
Director |
|
|
|
|
Name: |
Mr. Bijou Kurien |
|
Designation : |
Additional Director |
KEY EXECUTIVES
|
Name : |
M. R. Jaishankar |
|
Designation : |
Chairman |
|
|
|
|
Name : |
Palanimuthu Omprakash |
|
Designation : |
Secretary |
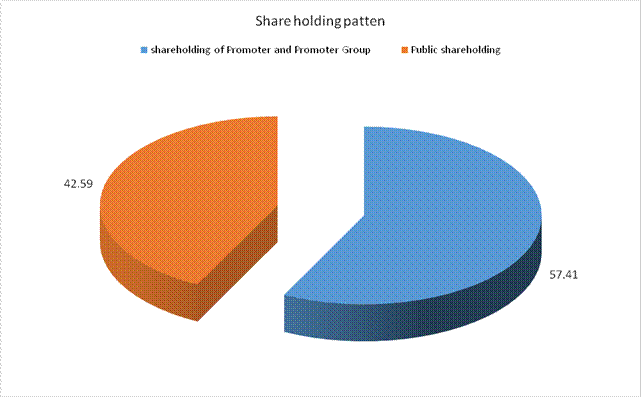
SHAREHOLDING PATTERN
As on 30.06.2015
|
Names of Shareholders |
No. of Shares |
Percentage of
Holding |
|
|
||
|
(A) Shareholding of Promoter and Promoter Group |
||
|
|
|
|
|
|
64602739 |
57.30 |
|
|
131517 |
0.12 |
|
|
64734256 |
57.41 |
|
|
|
|
|
Total shareholding of Promoter and Promoter Group (A) |
64734256 |
57.41 |
|
(B) Public Shareholding |
||
|
|
|
|
|
|
3653987 |
3.24 |
|
|
918936 |
0.82 |
|
|
3593358 |
3.19 |
|
|
8166281 |
7.24 |
|
|
|
|
|
|
3238257 |
2.87 |
|
|
|
|
|
|
5180728 |
4.59 |
|
|
31031631 |
27.52 |
|
|
400487 |
0.36 |
|
|
336061 |
0.30 |
|
|
64005 |
0.06 |
|
|
164 |
0.00 |
|
|
257 |
0.00 |
|
|
39851103 |
35.34 |
|
Total Public shareholding (B) |
48017384 |
42.59 |
|
Total (A)+(B) |
112751640 |
100.00 |
|
(C) Shares held by Custodians and against which Depository
Receipts have been issued |
0 |
0.00 |
|
|
0 |
0.00 |
|
|
0 |
0.00 |
|
|
0 |
0.00 |
|
Total (A)+(B)+(C) |
112751640 |
100.00 |
BUSINESS DETAILS
|
Line of Business : |
Construction Activity |
|
|
|
|
Products : |
Not Available |
|
|
|
|
Brand Names : |
Not Available |
|
|
|
|
Agencies Held : |
Not Available |
|
|
|
|
Exports : |
Not Divulged |
|
|
|
|
Imports : |
Not Divulged |
|
|
|
|
Terms : |
Not Divulged |
PRODUCTION STATUS NOT AVAILABLE
GENERAL INFORMATION
|
Suppliers : |
|
|||||||||||||||||||||||||||
|
|
|
|||||||||||||||||||||||||||
|
Customers : |
|
|||||||||||||||||||||||||||
|
|
|
|||||||||||||||||||||||||||
|
No. of Employees : |
498 (Approximately) |
|||||||||||||||||||||||||||
|
|
|
|||||||||||||||||||||||||||
|
Bankers : |
|
|||||||||||||||||||||||||||
|
|
|
|||||||||||||||||||||||||||
|
Facilities : |
(Rs.
In Million)
|
|
|
|
|
Auditors : |
|
|
Name : |
Narayanan, Patil
and Ramesh Chartered
Accountants |
|
Address : |
54/1, 1st |
|
|
|
|
Internal Auditors : |
Grant Thorton, Wings, First Floor, 16/1, |
|
|
|
|
Subsidiary : (As on 31.03.2014) |
|
|
|
|
|
Associate and Joint Venture : (As on 31.03.2014) |
|
|
|
|
|
Other related
parties where common control exists: (As on 31.03.2014) |
|
CAPITAL STRUCTURE
As On 31.03.2015
Authorised Capital : NA
Issued, Subscribed & Paid-up Capital : Rs.1127.400 Million
As on 31.03.2014
Authorised Capital :
|
No. of Shares |
Type |
Value |
Amount |
|
|
|
|
|
|
150000000 |
Equity Shares |
Rs.10/- each |
Rs.1500.000 Million |
|
|
|
|
|
Issued, Subscribed & Paid-up Capital :
|
No. of Shares |
Type |
Value |
Amount |
|
|
|
|
|
|
112251940 |
Equity Shares |
Rs.10/- each |
Rs.1122.519 Million |
|
|
|
|
|
RECONCILIATION OF THE
SHARES OUTSTANDING AT THE BEGINNING AND AT THE END OF THE REPORTING PERIOD
|
Particular |
No. of Share |
|
Shares outstanding at the beginning of the year |
112,251,940 |
|
Shares outstanding at the end of the year |
112,251,940 |
Details of
shareholders’ holding equity shares more than 5%
|
Name of the
shareholder |
No. of Share |
% holding |
|
M R Jaishankar |
230 |
21.00 |
|
Githa Shankar |
187 |
17.00 |
|
Nirupa Shankar |
93 |
8.00 |
The company has not issued any bonus shares during the period of 5 years immediately preceding the reporting date.
DISCLOSURES PURSUANT
TO GUIDANCE NOTE ON ESOP:
The Company instituted an Employees Stock Option Scheme (‘ESOP 2011’) pursuant to the Compensation Committee and Shareholders’ resolution dated October 29, 2013 and August 11, 2011 respectively. As per ESOP 2011, the Company granted 23, 24,300 options comprising equal number of equity shares in one or more tranches to the eligible employees of the Company and its subsidiaries. The employee will have the option to exercise the right within five years from the date of vesting of options. Under ESOP 2011, a total of 23, 24,300 options have been granted. The options under this grant would vest to the employees equally as 25% of the total grant every year at the end of first, second, third and fourth year from the date of the grant respectively, with an exercise period of five years from the date of respective vesting.
The vesting conditions include completion of one, two, three and four years of service. These options are exercisable at a price of ` 50/- which would be a discount to the market price of Company’s shares on the date of grant. Options under the plan are granted to be vested over a period of four years and are settled by Equity Shares being allotted to the beneficiary, upon exercise. The Company uses the intrinsic value method for determination of the employee stock compensation expense, the impact on the reported given below:
|
Particular |
2013-14 |
|
Net Profit After Tax |
898.000 |
|
Add: Employee Stock compensation under Intrinsic Value |
1.300 |
|
Less: Employee Stock compensation under Fair Value |
5.400 |
|
Proforma Profit |
893.900 |
|
EPS Basic –As Reported |
8.000 |
|
As per Proforma Profit |
7.96 |
|
EPS – Diluted – as Reported |
7.99 |
|
As Per Proforma Profit |
7.96 |
THE FOLLOWING INFORMATION RELATES TO THE EMPLOYEE STOCK OPTIONS AS ON
MARCH 31, 2014:
|
Particular |
Number of Options |
Weighted average Exercise Price |
Weighted average Contractual life of options as on date of Grant |
|
Outstanding at the beginning of the year |
Nil |
|
|
|
Add: Option Granted During the Year |
2324300 |
50 |
7.08 |
|
Less: Lapsed / forfeited / cancelled during the year |
Nil |
|
|
|
Outstanding at the end of the year |
2324300 |
50 |
7.08 |
|
Exercisable at the end of the year |
Nil |
|
|
|
Exercised during the year |
Nil |
|
|
ASSUMPTIONS USED IN
DETERMINATION OF THE FAIR VALUE OF THE STOCK OPTIONS UNDER THE BLACK MODEL AS:
|
Particular |
1st Vesting |
2nd Vesting |
3rd Vesting |
4th Vesting |
|
Weighted Average Remaining Contractual Life in options (Years) |
1 |
2 |
3 |
4 |
|
Weighted Average Exercise Price |
50.00 |
50.00 |
50.00 |
50.00 |
|
Historical Volatility |
51.62 |
49.92 |
46.93 |
44.70 |
|
Life of the options granted (vesting and exercise period) in years |
1 |
2 |
3 |
4 |
|
Expected dividends per share |
1.5 |
1.5 |
1.5 |
1.5 |
|
Average risk-free interest rate |
9.86 |
9.02 |
8.96 |
9.03 |
|
Expected dividend yield |
2.65 |
2.65 |
2.65 |
2.65 |
FINANCIAL DATA
[all figures are
in Rupees Million]
ABRIDGED
BALANCE SHEET
|
SOURCES
OF FUNDS |
31.03.2015 |
31.03.2014 |
31.03.2013 |
|
I.
EQUITY
AND LIABILITIES |
|
|
|
|
(1)Shareholders' Funds |
|
|
|
|
(a) Share Capital |
1127.400 |
1122.500 |
1122.500 |
|
(b) Reserves & Surplus |
12038.100 |
11594.500 |
10958.500 |
|
(c) Money received against
share warrants |
0.000 |
12.800 |
0.000 |
|
|
|
|
|
|
(2) Share Application
money pending allotment |
0.000 |
0.000 |
0.000 |
|
Total Shareholders’ Funds (1) + (2) |
13165.500 |
12729.800 |
12081.000 |
|
|
|
|
|
|
(3) Non-Current
Liabilities |
|
|
|
|
(a) long-term
borrowings |
5566.300 |
6349.100 |
7795.800 |
|
(b) Deferred tax liabilities (Net) |
364.900 |
355.000 |
264.600 |
|
(c) Other long term
liabilities |
418.400 |
1042.900 |
960.800 |
|
(d) long-term
provisions |
4.600 |
22.500 |
4.200 |
|
Total Non-current
Liabilities (3) |
6354.200 |
7769.500 |
9025.400 |
|
|
|
|
|
|
(4) Current Liabilities |
|
|
|
|
(a) Short term
borrowings |
95.900 |
163.900 |
297.400 |
|
(b) Trade payables |
2480.100 |
961.500 |
782.000 |
|
(c) Other current
liabilities |
13208.200 |
7422.300 |
4961.200 |
|
(d) Short-term
provisions |
323.300 |
508.000 |
376.500 |
|
Total Current Liabilities
(4) |
16107.500 |
9055.700 |
6417.100 |
|
|
|
|
|
|
TOTAL |
35627.200 |
29555.000 |
27523.500 |
|
|
|
|
|
|
II.
ASSETS |
|
|
|
|
(1) Non-current assets |
|
|
|
|
(a) Fixed Assets |
|
|
|
|
(i) Tangible assets |
14641.800 |
11605.300 |
9847.500 |
|
(ii) Intangible Assets |
0.000 |
73.700 |
79.100 |
|
(iii) Capital
work-in-progress |
0.000 |
1879.300 |
3562.300 |
|
(iv) Intangible assets under development |
0.000 |
0.000 |
0.000 |
|
(b) Non-current
Investments |
1921.500 |
1330.000 |
922.900 |
|
(c) Deferred tax
assets (net) |
0.000 |
0.000 |
0.000 |
|
(d) Long-term Loan and Advances |
6453.900 |
3073.800 |
3505.100 |
|
(e) Other
Non-current assets |
752.100 |
33.700 |
33.600 |
|
Total Non-Current
Assets |
23769.300 |
17995.800 |
17950.500 |
|
|
|
|
|
|
(2) Current assets |
|
|
|
|
(a) Current investments |
0.000 |
0.000 |
0.000 |
|
(b) Inventories |
9778.900 |
7124.500 |
6029.800 |
|
(c) Trade receivables |
161.500 |
350.100 |
155.700 |
|
(d) Cash and cash
equivalents |
224.100 |
405.300 |
350.700 |
|
(e) Short-term loans
and advances |
866.200 |
3669.600 |
3015.000 |
|
(f) Other current
assets |
827.200 |
9.700 |
21.800 |
|
Total Current Assets |
11857.900 |
11559.200 |
9573.000 |
|
|
|
|
|
|
TOTAL |
35627.200 |
29555.000 |
27523.500 |
PROFIT
& LOSS ACCOUNT
|
|
PARTICULARS |
31.03.2015 |
31.03.2014 |
31.03.2013 |
|
|
SALES |
|
|
|
|
|
Income |
9880.500 |
8952.400 |
7761.100 |
|
|
Other Income |
199.600 |
205.300 |
120.100 |
|
|
TOTAL
(A) |
10080.100 |
9157.700 |
7881.200 |
|
|
|
|
|
|
|
Less |
EXPENSES |
|
|
|
|
|
Sub Contractor Cost |
4601.600 |
0.000 |
0.000 |
|
|
Land Purchase Cost |
656.400 |
0.000 |
0.000 |
|
|
Cost of Raw Material |
1298.700 |
0.000 |
0.000 |
|
|
Project and Direct Expenses |
0.000 |
4343.500 |
2768.200 |
|
|
Changes in inventories of
finished goods, work-in-progress and Stock-in-Trade |
(2361.200) |
826.000 |
1679.300 |
|
|
Employees benefits expense |
886.200 |
658.000 |
660.100 |
|
|
Other expenses |
1845.900 |
606.600 |
622.000 |
|
|
Miscellaneous expenses written
off |
0.000 |
0.000 |
0.000 |
|
|
Exceptional and extraordinary
items |
0.000 |
29.100 |
0.000 |
|
|
TOTAL
(B) |
6927.600 |
6463.200 |
5729.600 |
|
|
|
|
|
|
|
Less |
PROFIT/
(LOSS) BEFORE INTEREST, TAX,
DEPRECIATION AND AMORTISATION (C) |
3152.500 |
2694.500 |
2151.600 |
|
|
|
|
|
|
|
Less |
FINANCIAL
EXPENSES (D) |
1146.000 |
688.000 |
828.800 |
|
|
|
|
|
|
|
|
PROFIT
/ (LOSS) BEFORE TAX, DEPRECIATION AND AMORTISATION (C-D) (E) |
2006.500 |
2006.500 |
1322.800 |
|
|
|
|
|
|
|
Less/
Add |
DEPRECIATION/
AMORTISATION (F) |
919.900 |
776.700 |
722.400 |
|
|
|
|
|
|
|
|
PROFIT/ (LOSS)
BEFORE TAX (E-F) (G) |
1086.600 |
1229.800 |
600.400 |
|
|
|
|
|
|
|
Less |
TAX (H) |
386.600 |
331.800 |
(42.200) |
|
|
|
|
|
|
|
|
PROFIT/ (LOSS)
AFTER TAX (G-H) (I) |
700.000 |
898.000 |
642.600 |
|
|
|
|
|
|
|
Add |
PREVIOUS
YEARS’ BALANCE BROUGHT FORWARD (K) |
3980.400 |
3413.800 |
3028.000 |
|
|
|
|
|
|
|
Less |
|
|
|
|
|
|
Transfer to General Reserve |
|
99.400 |
59.700 |
|
|
Dividend |
|
224.500 |
168.400 |
|
|
Tax on Dividend |
|
37.500 |
28.600 |
|
|
Total
(M) |
NA |
361.400 |
256.700 |
|
|
|
|
|
|
|
|
Balance
Carried to the B/S (J+K+L-M) |
4680.400 |
3950.400 |
3413.900 |
|
|
|
|
|
|
|
|
Earnings
/ (Loss) Per Share (Rs.) |
6.23 |
8.00 |
5.72 |
CURRENT MATURITIES OF LONG TERM DEBT DETAILS
|
Particulars |
31.03.2015 |
31.03.2014 |
31.03.2013 |
|
Current Maturities of Long term debt |
NA |
1919.800 |
1852.900 |
|
Cash generated from operations |
NA |
4162.400 |
1312.200 |
|
Net cash flow from operating activity |
NA |
3926.300 |
1253.000 |
KEY
RATIOS
|
PARTICULARS |
|
31.03.2015 |
31.03.2014 |
31.03.2013 |
|
Net Profit Margin (PAT / Sales) |
(%) |
7.08 |
10.03 |
8.28 |
|
|
|
|
|
|
|
Operating Profit Margin (PBIDT/Sales) |
(%) |
31.91 |
30.10 |
27.72 |
|
|
|
|
|
|
|
Return on Total Assets (PBT/Total Assets} |
(%) |
3.22 |
4.67 |
2.61 |
|
|
|
|
|
|
|
Return on Investment (ROI) (PBT/Networth) |
|
0.08 |
0.10 |
0.05 |
|
|
|
|
|
|
|
Debt Equity Ratio (Total Debt /Networth) |
|
0.43 |
0.66 |
0.82 |
|
|
|
|
|
|
|
Current Ratio (Current Asset/Current Liability) |
|
0.74 |
1.28 |
1.49 |
QUARTERLY RESULTS
|
Particulars |
30.06.2015 |
|
|
Unaudited |
|
Net Sales |
2929.100 |
|
Total Expenditure |
2055.900 |
|
PBIDT (Excl OI) |
873.200 |
|
Other Income |
46.000 |
|
Operating Profit |
919.200 |
|
Interest |
353.600 |
|
Exceptional Items |
0.000 |
|
PBDT |
565.600 |
|
Depreciation |
221.900 |
|
Profit Before Tax |
343.700 |
|
Tax |
122.900 |
|
Provisions and contingencies |
0.000 |
|
Profit After Tax |
122.900 |
|
Extraordinary Items |
0.000 |
|
Prior Period Expenses |
0.000 |
|
Other Adjustments |
0.000 |
|
Net Profit |
220.800 |
|
Equity Capital |
1127.500 |
STOCK
PRICES
|
Face Value |
Rs.10.00 |
|
Market Value |
Rs.149.60 |
FINANCIAL ANALYSIS
[all figures are
in Rupees Million]
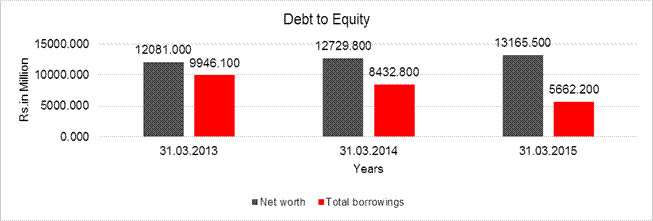
DEBT EQUITY RATIO
|
Particular |
31.03.2013 |
31.03.2014 |
31.03.2015 |
|
|
(Rs.
In Million) |
(Rs.
In Million) |
(Rs.
In Million) |
|
Share Capital |
1122.500 |
1122.500 |
1127.400 |
|
Reserves & Surplus |
10958.500 |
11594.500 |
12038.100 |
|
Money received against share
warrants |
0.000 |
12.800 |
0.000 |
|
Net
worth |
12081.000 |
12729.800 |
13165.500 |
|
long-term borrowings |
7795.800 |
6349.100 |
5566.300 |
|
Short term borrowings |
297.400 |
163.900 |
95.900 |
|
Total
borrowings |
9946.100 |
8432.800 |
5662.200 |
|
Debt/Equity
ratio |
0.823 |
0.662 |
0.430 |
YEAR-ON-YEAR GROWTH
|
Year
on Year Growth |
31.03.2013 |
31.03.2014 |
31.03.2015 |
|
|
(Rs.
In Million) |
(Rs.
In Million) |
(Rs.
In Million) |
|
Sales |
7761.100 |
8952.400 |
9880.500 |
|
|
|
15.350 |
10.367 |
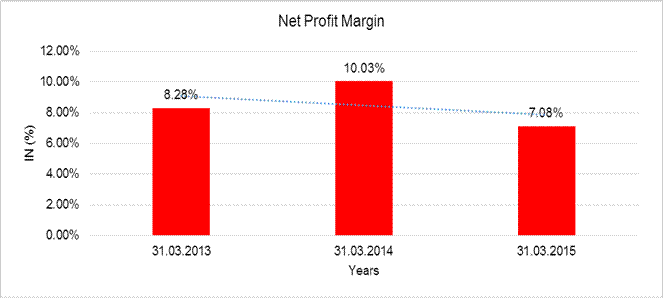
NET PROFIT MARGIN
|
Net
Profit Margin |
31.03.2013 |
31.03.2014 |
31.03.2015 |
|
|
(Rs.
In Million) |
(Rs.
In Million) |
(Rs.
In Million) |
|
Sales |
7761.100 |
8952.400 |
9880.500 |
|
Profit |
642.600 |
898.000 |
700.000 |
|
|
8.28% |
10.03% |
7.08% |
LOCAL AGENCY FURTHER INFORMATION
|
Sr. No. |
Check list by
info agents |
Available in
Report (Yes/No) |
|
1 |
Year of establishment |
Yes |
|
2 |
Constitution of the entity -Incorporation
details |
Yes |
|
3 |
Locality of the entity |
Yes |
|
4 |
Premises details |
No |
|
5 |
Buyer visit details |
-- |
|
6 |
Contact numbers |
Yes |
|
7 |
Name of the person contacted |
No |
|
8 |
Designation of contact person |
No |
|
9 |
Promoter’s background |
Yes |
|
10 |
Date of Birth of Proprietor / Partners /
Directors |
No |
|
11 |
Pan Card No. of Proprietor / Partners |
No |
|
12 |
Voter Id Card No. of Proprietor / Partners |
No |
|
13 |
Type of business |
Yes |
|
14 |
Line of Business |
Yes |
|
15 |
Export/import details (if applicable) |
No |
|
16 |
No. of employees |
Yes |
|
17 |
Details of sister concerns |
Yes |
|
18 |
Major suppliers |
No |
|
19 |
Major customers |
No |
|
20 |
Banking Details |
Yes |
|
21 |
Banking facility details |
Yes |
|
22 |
Conduct of the banking account |
-- |
|
23 |
Financials, if provided |
Yes |
|
24 |
Capital in the business |
Yes |
|
25 |
Last accounts filed at ROC, if applicable |
Yes |
|
26 |
Turnover of firm for last three years |
Yes |
|
27 |
Reasons for variation <> 20% |
-- |
|
28 |
Estimation for coming financial year |
No |
|
29 |
Profitability for last three years |
Yes |
|
30 |
Major shareholders, if available |
Yes |
|
31 |
External Agency Rating, if available |
Yes |
|
32 |
Litigations that the firm/promoter
involved in |
Yes |
|
33 |
Market information |
-- |
|
34 |
Payments terms |
No |
|
35 |
Negative Reporting by Auditors in the
Annual Report |
No |
LITIGATION DETAILS:
|
QUERY ON CASE NUMBER
Lower Court Details [Appeal from below case.]
|
||||||||||||||||||||||||||||||||||||||||||||||||||||||||||||||||
BRIGADE GROUP & IHG TO OPEN 10 HOLIDAY INN EXPRESS HOTELS IN SOUTH
INDIA
The Company has informed BSE regarding a Press Release dated October 29, 2013 titled "Brigade Group & IHG to open 10 Holiday Inn Express Hotels in South India". Brigade Group will be signing a deal with InterContinental Hotels Group (IHG). Under the agreement, 10 Holiday Inn Express 3 Star brand hotels are to be built in South India, owned by Brigade Group and managed by IHG
COMPANY OVERVIEW:
(As on 31.03.2014)
The Company (BEL) was incorporated on 8th November, 1995 and is listed on the National Stock Exchange of India Limited and Bombay Stock Exchange Limited. The Company is carrying on the business of Real Estate and Hospitality and is primarily focused on the development of residential and commercial properties: building and management of hospitality projects and development of commercial properties that yield lease income in south India.
BEL is engaged in residential, commercial, retail and hospitality segments. The residential properties development by BEL include integrated lifestyle enclaves and apartment buildings. The commercial properties developed by BEL include state of the art office spaces, software and IT Parks, SEZs Malls with entertainment facility sector developed by BEL include serviced residences, hotels, spas, recreational clubs and convention centers in Bangalore and other parts of south India.
FINANCIAL OVERVIEW:
(As on 31.03.2014)
PERFORMANCE:
During the financial year 2013-14, the company has on a standalone basis, registered total revenue of Rs. 9157.700 Million as compared to Rs. 7881.200 Million in the previous year, showing a Y-OY increase of 16%, EBITDA has increased from Rs. 5151.500 Million to Rs. 2665.400 Million, as increase of 24 %.
OPERATIONAL OVERVIEW: (As on 31.03.2014)
COMPLETED PROJECTS:
During the year, the Company has completed residential projects measuring 0.49 mn. Sft and commercial projects measuring 0.19 mn Sft.
ONGOING PROJECTS:
The Company currently has 15 ongoing residential projects aggregating to 8.03 million square feet of developable area (Out of which Company’s share is about 6.480 million square feet), 7 commercial/retail projects aggregating to 2.22 million square feet of developable area (Out of which Company’s share is about 1.36 million square feet) and 1 Hospitality project of 0.100 million square feet of developable area (Out of which Company’s share is about 0.10 million square feet). Apart from these, the Company also has 4 ongoing residential projects under SPVs aggregating to 2.16 million square feet of developable area (out of which Company’s share is about 1.09 million square feet) and 1 Hospitality project of 0.23 million square feet of developable area (out of which Company’s share is about 0.11 million square feet).
MANAGEMENT DISCUSSION
AND ANALYSIS: (As on 31.03.2014)
ECONOMIC OVERVIEW:
As per IMF's World Economic Outlook 2014, the global GDP
growth in the year 2013 has slightly moderated to 3.0% from 3.2% last year. The
growth in the first half of the year was sluggish at around 2.67%. However, in
the second half, backed by developed economies in general and US economy in
particular, the global GDP growth
recovered significantly to 3.66%. The developed economy's GDP growth in 2013 has come down to 1.3% vs 1.4% (Y-o-Y), whereas the developing economy's GDP growth moderated to 4.7% from 5.0% in 2012. The world's largest economy, U.S., in the year 2014 is expected to significantly improve post a growth of 2.8% in 2014 as against 1.9% in 2013. This would have a positive impact on global economy, which is expected to grow at 3.6% in 2014 and further inch up to 3.9% in 2015. India's GDP growth is continuously moving in the downward trajectory for over last three years (Exhibit 1: India GDP Growth Y-o-Y, %). With CSO's provisional estimate of 4.7% GDP growth for 2013-14, this would be the second consecutive year of sub 5% GDP growth for India. The constraints for economic growth in India in recent times have shifted from global to more local. The logjam in infrastructure and mining were the two main factors that had taken a toll on the country's total GDP growth. The IIP for the period April 2013 to March 2014 has been (0.1) % as against 0.9% in corresponding period last year. The year FY14 has been one of the worst years for the Indian currency, which hit a new low of 69.225 as against USD (a fall of 27.5% from the start of the year). However, by the end of the year it recovered by 13% and closed the year at 60.125. The main reason for the recovery has been the renewed confidence of FIIs in India's equity market growth and the significant fall in Current Account Deficit. Inflation continues to remain a pain point for India. With significantly high food inflation, the CPI for most part of the year has been sticky near the double digit number (Exhibit 2: CPI & IIP monthly y-o-y growth, Repo rate %). However, with proactive monetary policy by RBI it is showing initial signs of cooling off. But RBI’s measures had led to an increased cost of borrowing in the system with higher repo-rate. With a new and strong government at the Centre, India’s GDP growth is expected to improve from the current levels. As per IMF’s projections, India would grow at 5.4% in 2014, which would further improve to 6.4% in 2015.
REAL ESTATE INDUSTRY
IN INDIA (As on 31.03.2014)
The real estate sector in India is one of the most important sectors for India’s GDP growth. It contributes to around 6.3% to the total GDP. The Indian real estate market is currently one of the fastest growing markets in the world. This has led to increased keenness among many foreign investors that are investing in many big projects. The estimated market size was USD 78 billion in 2012, which is expected to almost double and become USD 140 billion by 2017. Changing demographics, rising income level and rapid urbanization would be the key factors in fueling this significant growth. As per CREDAI estimates, the real estate sector alone would have generated close to 7.6 million jobs during the year 2013. CREDAI has also projected that the real estate sector would generate more than 17 million employment opportunities for India by 2025. The real estate sector in India is largely fragmented and ism highly unorganized. However, with increased foreign investment, entry of international real estate players and a number of corporate entering this sector the industry is getting more organized. The phenomenal growth in India’s real estate sector in the past decade can be credited to factors like opening of the sector for Foreign Direct Investment (FDI), rapid urbanization, and rising income levels of the people. From being a supplier of residential and commercial space; new age concepts like luxury homes, senior citizen homes, student housing and education institute are fast catching pace.
STATEMENT
OF STANDALONE UNAUDITED FINANCIAL RESULTS FOR THE QUARTER ENDED 30.06.2015
|
Particulars
|
Three Month
Ended (Unaudited) |
|
|
30.06.2015 |
|
|
|
|
1.
Income from operations |
|
|
a) Net sales/ Income from operation (net of excise duty) |
2839.500 |
|
b) Other operating income |
89.600 |
|
Total
income from Operations(net) |
2929.100 |
|
2.Expenditure |
|
|
a) Sub Contractor Cost |
1180.400 |
|
b) Land Purchase Cost |
164.300 |
|
c) Cost of Raw Material |
265.000 |
|
d) Changes in inventories of finished goods,
work-in-progress and stock-in-trade |
(204.600) |
|
e) Employees benefit expenses |
239.900 |
|
f) Depreciation and amortization expenses |
221.900 |
|
g) Other expenditure |
410.900 |
|
Total expenses |
2277.800 |
|
3. Profit from operations before other income and
financial costs |
651.300 |
|
4. Other income |
46.000 |
|
5.
Profit from ordinary activities before finance costs and Exceptional Items |
697.300 |
|
6. Finance costs |
353.600 |
|
7. From ordinary activities after finance costs
but before exceptional items |
343.700 |
|
8. Exceptional item |
0.000 |
|
9. Profit from ordinary
activities before tax |
343.700 |
|
10.Tax expenses |
122.900 |
|
11.Net Profit
/ (Loss) from ordinary activities after tax (9-10) |
220.800 |
|
12.Extraordinary Items (net of tax expense) |
0.000 |
|
13.Net Profit / (Loss) for the period (11 -12) |
220.800 |
|
14.Paid-up equity share capital (Nominal value Rs.2/- per share) |
1127.500 |
|
15. Reserve excluding
Revaluation Reserves as per balance sheet of previous accounting year |
|
|
16. Earnings per share (EPS) |
|
|
16.i) Basic and diluted EPS before Extraordinary items
for the period, for the year to date and for the previous year (not
annualized) |
|
|
a) Basic |
1.96 |
|
b) Diluted |
1.94 |
|
16.II) Basic
and diluted EPS before Extraordinary items for the period, for the year to date
and for the previous year (not annualized) |
|
|
c) Basic |
1.96 |
|
d) Diluted |
1.94 |
|
Particulars
|
Three Month
Ended ( Reviewed) |
|
|
30.06.2015 |
|
A. Particulars of shareholding |
|
|
1. Public Shareholding |
|
|
- Number of shares |
4817384 |
|
- Percentage of shareholding |
42.59 |
|
2. Promoters and Promoters group Shareholding- |
|
|
a) Pledged /Encumbered |
|
|
Number of shares |
Nil |
|
Percentage of shares (as a % of total shareholding of the
promoter and promoter group) |
Nil |
|
Percentage of shares (as a % of total share capital of the
company) |
Nil |
|
|
|
|
b) Non Encumbered |
|
|
Number of shares |
64734256 |
|
Percentage of shares (as a % of total shareholding of the
promoter and promoter group) |
100.00 |
|
|
57.41 |
|
Percentage of shares (as a % of total share capital of the
company) |
|
|
|
|
|
B.
Investor Complaints |
|
|
Pending at the beginning of the quarter |
- |
|
Receiving during the quarter |
4 |
|
Disposed of during the quarter |
4 |
|
Remaining unreserved at the end of the quarter |
- |
Note:
- The above financial results of the
company or BEL has been reviewed by the Audit Committee and taken on
record at the meeting of the Board of Director of the company held on
November 4, 2014. The statutory auditor of the company have carried out a
limited on the financial results of the company.
|
Particulars |
Quarter ended |
|
|
30.06.2015 |
||
|
Unaudited |
||
|
1 |
Segment Reserve Real Estate Hospitality Leasing Total Les: Inter segment Revenues Net Income from Operations |
2190800 312.200 426.000 2929.600 (0.500) 2929.100 |
|
2 |
Segment Results Real Estate Hospitality Leasing Profit/loss before
tax and Interest Less: Finance Costs Less: Other Unallowable Expenditure Add: Other Income Profit/loss before
tax |
580.000 45.300 184.400 809.700 (353.600) (236.100) 46.000 343.700 |
|
3 |
Capital Employed (Segment assets – segment Liabilities) Real Estate Hospitality Leasing Unallocated assets (Liabilities)(Net) Total Capital
Employed |
6751.900 2975.800 10807.100 (7146.80) 13388.000 |
Pursuant to notification of the applicability of component approach from the financial year commencing on 01.04.2015, the Company has determined significant components of their assets as at 01.04.2015 and wherever, the useful life of such significant components was different from useful life of such components. Had the Company continued with the previously assessed useful lives for such components, charge for depreciation for the quarter ended 30.06.2015 would have been lower by Rs.41.900 Million and the profit before tax would have been high by such amount (Previous accounting year ended 31.03.215 and quarter ended 30.06.2014. Rs.Nil)
During the quarter ended 30.06.215, the paid-up equity share capital of the Company has increased from Rs.1124.700 Million to Rs.1127.500 Million pursuant to the exercise of stock options by certain employees and allotment of 8000 equity shares thereon.
The figures for the quarter ended 31.03.2015 represent the derived figures between the audited figures in respect of the financial year ended 31.03.2015 and published year to date figures up to 31.12.2014 being the date of the end of the third quarter of the preceding financial year, which were subject were subject to a limited review, as required under Clause 41(l)(d) of the Listing Agreement.
The figures of the quarter ended 30.06.2014 were reviewed by the previous statutory auditors of the Company. The figures of the previous year/ period have been regrouped/ reclassified, wherever necessary to conform to current period’s classification.
INDEX
OF CHARGES
|
S.NO. |
CHARGE ID |
DATE OF
CHARGE CREATION/MODIFICATION |
CHARGE
AMOUNT SECURED |
CHARGE
HOLDER |
ADDRESS |
SERVICE
REQUEST NUMBER (SRN) |
|
1 |
10524509 |
15/09/2014 |
500,000,000.00 |
STATE BANK OF MYSORE |
CORPORATE ACCOUNTS BRANCH, NO.18,, RAMANASHREE ARCADE, MIDFORD
GARDENS, M.G. ROAD, BANGALORE, KARNA |
C27387463 |
|
2 |
10457487 |
27/09/2013 |
450,000,000.00 |
INDIAN OVERSEAS BANK |
RESIDENCY ROAD BRACH, BANGALORE, KARNATAKA - 560025, INDIA |
B88464888 |
|
3 |
10457361 |
27/09/2013 |
740,000,000.00 |
INDIAN OVERSEAS BANK |
RESIDENCY ROAD BRACH`, BANGALORE, KARNATAKA - 560025, INDIA |
B88464193 |
|
4 |
10441022 |
04/07/2013 |
300,000,000.00 |
THE JAMMU & KASHMIR BANK LIMITED |
F-6 F-7, GEM PLAZA, INFANTRY ROAD, SHIVAJINAGAR, |
B81109886 |
|
5 |
10441025 |
04/07/2013 |
400,000,000.00 |
THE JAMMU & KASHMIR BANK LIMITED |
F-6 F-7, GEM PLAZA, INFANTRY ROAD, SHIVAJINAGAR, |
B81110553 |
|
6 |
10421194 |
06/03/2014 * |
4,360,000,000.00 |
STATE BANK OF INDIA |
INDUSTRIAL FINANCE BRANCH, 61, RESIDENCY PLAZA, RESIDENCY ROAD,
BANGALORE, KARNATAKA - 560025, INDIA |
C01141050 |
|
7 |
10419039 |
16/08/2013* |
570,000,000.00 |
ALLAHABAD BANK |
IFB, BANGALORE, #1/32, ULSOOR ROAD CROSS, ULSOOR ROAD, BANGALORE,
KARNATAKA - 560042, INDIA |
B84261213 |
|
8 |
10378439 |
20/03/2013 * |
83,000,000.00 |
UNITED BANK OF INDIA |
INDIRANAGAR BRANCH, NO.680, 9TH'A' MAIN, INDIRANA |
B71358550 |
|
9 |
10366127 |
29/06/2012 |
600,000,000.00 |
KARUR VYSYA BANK |
NO.13, SESHA SADAN, CAMBRIDGE ROAD, HALASURU, BAN |
B43997493 |
|
10 |
10348742 |
29/03/2012 |
2,300,000,000.00 |
ALLAHABAD BANK |
INDUSTRIAL FINANCE BRANCH, N-603, MANIPAL CENTRE, #47,
DICKENSON ROAD,, BANGALORE, KARNATAKA - 560042, INDIA |
B37295714 |
PRESS LEASE:
BRIGADE ENTERPRISES LTD SEES 191% GROWTH IN Q2 OF FY 2014-15
Bangalore, November 5, 2014: Bangalore-based real estate major the company net profit for the second quarter of the financial year 2014-15 has shown a 191% growth to Rs 215.000 million, up from Rs 74.000 million recorded during the immediately preceding quarter of the current fiscal. The Board of Directors of the company met on November 4thand approved the financial results for Q2 FY 2014-15.
Commenting on the company’s performance, Mr. M.R. Jaishankar, Chairman and Managing Director, the company, said that a combination of sales from ongoing projects and new projects that have come for revenue recognition in this quarter contributed to the growth in revenues in the residential segment. “A stable government at the Centre and improving business environment has revived the consumer sentiment in the country. We are pleased to report significant growth during this Quarter. Q2 has been very good for the company and the company is well positioned to leverage its performance with planned launches of about 6 mn sq.ft within the next 2 quarters.”
For the second quarter ended September 30, 2014, the company recorded total revenues of Rs 3292.000 million, up about 100% from the previous Quarter.
Further, Unrecognized Revenue on sold units in the Ongoing Real Estate projects stood at Rs. 17677.000 million, which will get reflected in the coming quarters.
ROBUST RESIDENTIAL SALES
Q2 FY 2014-15 witnessed robust sales. Real Estate Space aggregating to about Rs.0.800 million sq. ft., valued at Rs. 4087.000 million was sold during the second quarter ended 30th September, 2014. The Annual Brigade Showcase event , where customers got to choose from a wide array of projects including ready-to-occupy homes, those nearing completion, ongoing and the ones that have just been launched was very successful. These projects included value homes, luxury apartments, premium residential enclaves, retirement homes and villas.
SIGNIFICANT
DEVELOPMENTS DURING THE QUARTER
- Brigade Orchards – Cedar & Deodar, with aggregate area of 1.5 mn sq. ft. and Holiday Inn Express Hotel with 0.2 mn sq. ft were launched.
- CRISIL has assigned a Long Term Debt Rating of “A” for the company which is amongst the highest in the industry
- CRISIL Independent Equity Research has assigned Brigade Group a fundamental grade of 4 out of 5 and valuation grade of 5 out of 5
- ICRA Equity Research has assigned Brigade Group a fundamental grade of 4 out of 5 and valuation grade of “A”
- Brigade Group and GIC- through its affiliate company (Singapore’s sovereign wealth fund), entered in to an MoU , to jointly invest up to Rs. 15000.000 Millions in residential and mixed-use developments in select cities of South India. The Joint Venture aims to acquire land for residential and mixed-use developments.
- Brigade Group will be
launching 1.100 million. Sq. ft. of Commercial, Residential, Retail and
Hotel projects in GIFT City, Gujarat in the near future.
FINANCIAL HIGHLIGHTS
Quarterly performance on a Q-o-Q basis (Q2 vs Q1 of FY 2014-15)
- Total Revenues stood at Rs. 3292.000 million vis-a-vis Rs. 1682.000 million, an increase of about 100 %.
- EBITDA stood at Rs. 927.000 million vis-a-vis to Rs. 595.000 million, an increase of 56%.
- EBITDA margin stood at 28% vis-a-vis 36%.
- PAT stood at Rs. 215.000 million vis-a-vis Rs. 74.000 million.
- EPS
was Rs. 1.92 /- per share vis-a-vis Rs. 0.66/- per share.
Quarterly performance on a Y-o-Y basis (Q2 of FY 2014-15 vs Q2 of FY 2013-14)
- Total Revenues stood at Rs. 3292.000 million vis-a-vis Rs. 1808.000 million, an increase of 82%.
- EBITDA stood at Rs. 927.000 million vis-a-vis to Rs. 667.000 million, an increase of 39%.
- EBITDA margin stood at 28% vis-a-vis 37%.
- PAT stood at Rs. 215.000 million vis-a-vis Rs. 190.000 million.
- EPS was Rs. 1.92 /- per share vis-a-vis Rs. 1.69/- per share
OPERATIONAL PERFORMANCE AND FUTURE OUTLOOK
- Real Estate Space aggregating to 0.800 million sq. ft., with value of Rs. 4087.000 million, was sold during the second quarter ended 30th September, 2014.
- Lease Rental and Hospitality segments contributed Rs. 434.000 million and Rs.284.000 million respectively to the revenues for the second quarter ended 30th September, 2014.
- Debt equity Ratio of the Company was at 0.68: 1. Over 50% of the debt is towards Office, Retail and Hospitality assets which are income yielding assets to service their debts.
- Launched 1.050 million sq. ft. of Residential space in Bangalore during the second quarter ended 30th September, 2014.
- Launched 0.170 million sq. ft. of Hospitality space in Bangalore during the second quarter ended 30th September, 2014.
- Plan to launch about 6.000 million sq. ft. during Q3 and Q4 of FY 2014-15 across all segments.
AWARDS & RECOGNITION
Brigade Crescent and Brigade Horizon won awards at the 3rd Annual Silicon India Bangalore Real Estate Awards 2014. Brigade Crescent won the ‘Ultra luxury Apartment Project of The Year’ in CBD, Bangalore and Brigade Horizon won the ‘Luxury Apartment Project of The Year’, Mysore.
- Brigade Group won 5 Awards at the 6th REALTY PLUS EXCELLENCE AWARDS 2014 for the following categories:
World Trade Centre Bangalore @ Brigade Gateway- Commercial Property of the Year
Brigade Group for Brigade Magnum-Developer of the Year – Commercial
Brigade Lakefront for ‘WALK’-Innovative Marketing Concept of the Year
Brigade Lakefront for’ WALK’-OOH Marketing campaign of the year
Brigade Lakefront for ‘WALK’- Print campaign of the year
- Brigade Rubix has been awarded the “Best Architectural Design – Commercial” at the National Real Estate Development Council (NAREDCO) Awards 2014.
- Jaishankar was conferred the ‘Construction Week India Hall of Fame’ Award in recognition of his extraordinary work in the real estate sector.
CONTINGENT
LIABILITIES:
(Rs. in million)
|
Particular |
31.03.2014 |
|
Contingent liabilities: |
|
|
Claims from government departments not acknowledged as debts |
437.100 |
|
Capital Commitments: |
|
|
Capital Commitments - estimated amount of contract remaining to be executed on capital account not provided for |
3176.500 |
|
Towards letter of credit and bank guarantees |
354.700 |
FIXED ASSETS
- Land
- Building
- Furniture, fixture and interiors
- Office Equipments
- Plant and machinery
- Computer and hardware
- Software
- Vehicles
- Leasehold improvement
CMT REPORT (Corruption, Money Laundering & Terrorism]
The Public Notice information has been collected from various sources
including but not limited to: The Courts,
1] INFORMATION ON
DESIGNATED PARTY
No exist designating subject or any of its beneficial owners,
controlling shareholders or senior officers as terrorist or terrorist
organization or whom notice had been received that all financial transactions
involving their assets have been blocked or convicted, found guilty or against
whom a judgement or order had been entered in a proceedings for violating
money-laundering, anti-corruption or bribery or international economic or
anti-terrorism sanction laws or whose assets were seized, blocked, frozen or
ordered forfeited for violation of money laundering or international
anti-terrorism laws.
2] Court Declaration :
No exist to suggest that subject is or was
the subject of any formal or informal allegations, prosecutions or other official
proceeding for making any prohibited payments or other improper payments to
government officials for engaging in prohibited transactions or with designated
parties.
3] Asset Declaration :
No records exist to suggest that the property or assets of the subject
are derived from criminal conduct or a prohibited transaction.
4] Record on Financial
Crime :
Charges or conviction
registered against subject: None
5] Records on Violation of
Anti-Corruption Laws :
Charges or
investigation registered against subject: None
6] Records on Int’l
Anti-Money Laundering Laws/Standards :
Charges or
investigation registered against subject: None
7] Criminal Records
No
available information exist that suggest that subject or any of its principals
have been formally charged or convicted by a competent governmental authority
for any financial crime or under any formal investigation by a competent
government authority for any violation of anti-corruption laws or international
anti-money laundering laws or standard.
8] Affiliation with
Government :
No record
exists to suggest that any director or indirect owners, controlling
shareholders, director, officer or employee of the company is a government
official or a family member or close business associate of a Government
official.
9] Compensation Package :
Our market
survey revealed that the amount of compensation sought by the subject is fair
and reasonable and comparable to compensation paid to others for similar
services.
10] Press Report :
No press reports / filings exists on
the subject.
CORPORATE GOVERNANCE
MIRA INFORM as part of its Due Diligence do provide comments on
Corporate Governance to identify management and governance. These factors often
have been predictive and in some cases have created vulnerabilities to credit
deterioration.
Our Governance Assessment focuses principally on the interactions
between a company’s management, its Board of Directors, Shareholders and other
financial stakeholders.
CONTRAVENTION
Subject is not known to have contravened any existing local laws,
regulations or policies that prohibit, restrict or otherwise affect the terms
and conditions that could be included in the agreement with the subject.
FOREIGN EXCHANGE RATES
|
Currency |
Unit
|
Indian Rupees |
|
US Dollar |
1 |
Rs.65.22 |
|
|
1 |
Rs.102.23 |
|
Euro |
1 |
Rs.72.39 |
INFORMATION DETAILS
|
Information
Gathered by : |
PRT |
|
|
|
|
Analysis Done by
: |
TRI |
|
|
|
|
Report Prepared
by : |
SUD |
SCORE & RATING EXPLANATIONS
|
SCORE FACTORS |
RANGE |
POINTS |
|
HISTORY |
1~10 |
6 |
|
PAID-UP CAPITAL |
1~10 |
5 |
|
OPERATING SCALE |
1~10 |
6 |
|
FINANCIAL
CONDITION |
|
|
|
--BUSINESS SCALE |
1~10 |
6 |
|
--PROFITABILITY |
1~10 |
6 |
|
--LIQUIDITY |
1~10 |
6 |
|
--LEVERAGE |
1~10 |
6 |
|
--RESERVES |
1~10 |
6 |
|
--CREDIT LINES |
1~10 |
6 |
|
--MARGINS |
-5~5 |
-- |
|
DEMERIT POINTS |
|
|
|
--BANK CHARGES |
YES/NO |
YES |
|
--LITIGATION |
YES/NO |
YES |
|
--OTHER ADVERSE INFORMATION |
YES/NO |
NO |
|
MERIT POINTS |
|
|
|
--SOLE DISTRIBUTORSHIP |
YES/NO |
NO |
|
--EXPORT ACTIVITIES |
YES/NO |
NO |
|
--AFFILIATION |
YES/NO |
YES |
|
--LISTED |
YES/NO |
YES |
|
--OTHER MERIT FACTORS |
YES/NO |
YES |
|
DEFAULTER |
|
|
|
--RBI |
YES/NO |
NO |
|
--EPF |
YES/NO |
NO |
|
TOTAL |
|
53 |
This score serves as a reference to assess
SC’s credit risk and to set the amount of credit to be extended. It is
calculated from a composite of weighted scores obtained from each of the major
sections of this report. The assessed factors and their relative weights (as
indicated through %) are as follows:
Financial
condition (40%) Ownership
background (20%) Payment
record (10%)
Credit history
(10%) Market trend (10%) Operational size
(10%)
RATING EXPLANATIONS
|
RATING |
STATUS |
PROPOSED CREDIT LINE |
|
|
>86 |
Aaa |
Possesses an extremely sound financial base with the strongest
capability for timely payment of interest and principal sums |
Unlimited |
|
71-85 |
Aa |
Possesses adequate working capital. No caution needed for credit
transaction. It has above average (strong) capability for payment of interest
and principal sums |
Large |
|
56-70 |
A |
Financial & operational base are regarded healthy. General
unfavourable factors will not cause fatal effect. Satisfactory capability for
payment of interest and principal sums |
Fairly Large |
|
41-55 |
Ba |
Overall operation is considered normal. Capable to meet normal
commitments. |
Satisfactory |
|
26-40 |
B |
Capability to overcome financial difficulties seems comparatively
below average. |
Small |
|
11-25 |
Ca |
Adverse factors are apparent. Repayment of interest and principal sums
in default or expected to be in default upon maturity |
Limited with full
security |
|
<10 |
C |
Absolute credit risk exists. Caution needed to be exercised |
Credit not
recommended |
|
-- |
NB |
New Business |
-- |
This report is issued at your request without any
risk and responsibility on the part of MIRA INFORM PRIVATE LIMITED (MIPL) or
its officials.