MIRA INFORM REPORT
|
Report No. : |
336689 |
|
Report Date : |
19.08.2015 |
IDENTIFICATION DETAILS
|
Name : |
FISHERMAN'S CHOICE B.V. |
|
|
|
|
Registered Office : |
Willemstraat 8-10-12 2514HM 's-Gravenhage |
|
|
|
|
Country : |
Netherlands |
|
|
|
|
Financials (as on) : |
31.12.2013 |
|
|
|
|
Date of Incorporation : |
19.04.1989 |
|
|
|
|
Com. Reg. No.: |
KvK-nummer: 27126004 |
|
|
|
|
Legal Form : |
Private company |
|
|
|
|
Line of Business : |
Wholesale of fish |
|
|
|
|
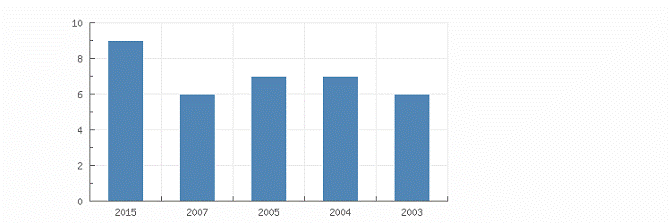
No. of Employees : |
9 |
RATING & COMMENTS
|
MIRA’s Rating : |
Ba |
|
RATING |
STATUS |
PROPOSED CREDIT LINE |
|
|
41-55 |
Ba |
Overall operation is considered normal. Capable to meet normal
commitments. |
Satisfactory |
|
Status : |
Satisfactory |
|
|
|
|
Payment Behaviour : |
No Complaints |
|
|
|
|
Litigation : |
Clear |
NOTES:
Any query related to this report can be made
on e-mail: infodept@mirainform.com
while quoting report number, name and date.
ECGC Country Risk Classification List – March 31, 2015
|
Country Name |
Previous Rating (31.12.2014) |
Current Rating (31.03.2015) |
|
Netherlands |
A1 |
A1 |
|
Risk Category |
ECGC
Classification |
|
Insignificant |
A1 |
|
Low |
A2 |
|
Moderate |
B1 |
|
High |
B2 |
|
Very High |
C1 |
|
Restricted |
C2 |
|
Off-credit |
D |
NETHERLANDS - ECONOMIC
OVERVIEW
The Netherlands, the sixth-largest economy in the European Union, plays an important role as a European transportation hub, with a persistently high trade surplus, stable industrial relations, and moderate unemployment. Industry focuses on food processing, chemicals, petroleum refining, and electrical machinery. A highly mechanized agricultural sector employs only 2% of the labor force but provides large surpluses for food-processing and underpins the country’s status as the world’s second largest agricultural exporter. The Netherlands is part of the Eurozone, and as such, its monetary policy is controlled by the European Central Bank. The Dutch financial sector is highly concentrated, with four commercial banks possessing over 90% of banking assets. The sector suffered as a result of the global financial crisis and required billions of dollars of government support, but the European Banking Authority completed stringent reviews in 2014 and deemed Dutch banks to be well-capitalized. To address the 2009 and 2010 economic downturns, the government sought to stimulate the domestic economy by accelerating infrastructure programs, offering corporate tax breaks for employers to retain workers, and expanding export credits. The stimulus programs and bank bailouts, however, resulted in a government budget deficit of 5.3% of GDP in 2010 that contrasted sharply with a surplus of 0.7% in 2008. The government of Prime Minister Mark RUTTE has since implemented significant austerity measures to improve public finances and has instituted broad structural reforms in key policy areas, including the labor market, the housing sector, the energy market, and the pension system. As a result, the government budget deficit at the end of 2014 dropped to 1.8% of GDP. Following a protracted recession during which unemployment doubled to 7.4% and household consumption contracted for nearly three consecutive years, the year 2014 saw fragile GDP growth of 0.8 percent and a rise in most economic indicators. Drivers of growth included increased exports and business investments, as well as newly invigorated household consumption.
|
Source
: CIA |
Summary
Company name Fisherman's
Choice B.V.
Operative address Willemstraat
8-10-12
2514HM 's-Gravenhage
Netherlands
Legal form Besloten
Vennootschap
Registration number KvK-nummer:
27126004
VAT-number 009297078
|
Year |
2013 |
Mutation |
2012 |
Mutation |
2011 |
|
Fixed assets |
14.060.364 |
-1,49 |
14.272.317 |
-13,37 |
16.475.809 |
|
Total receivables |
13.521.286 |
22,02 |
11.080.790 |
-0,44 |
11.129.908 |
|
Total equity |
14.355.148 |
-38,65 |
23.399.479 |
-12,83 |
26.844.827 |
|
Short term liabilities |
16.861.226 |
28,68 |
13.102.815 |
35,41 |
9.676.268 |
|
Net result |
5.955.678 |
7,22 |
5.554.652 |
8,13 |
5.136.943 |
|
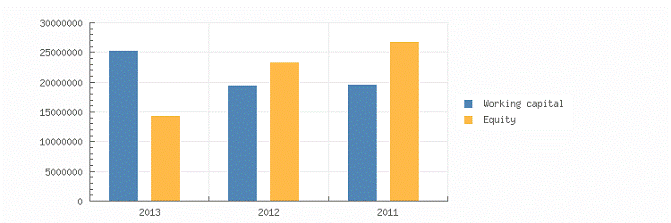
Working capital |
25.328.054 |
30,02 |
19.479.857 |
-0,56 |
19.590.049 |
|
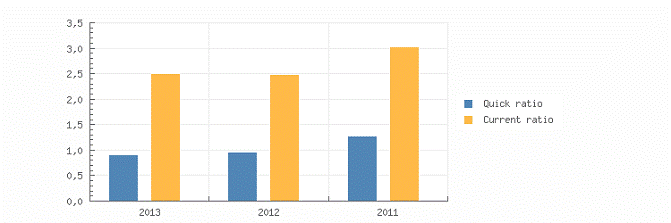
Quick ratio |
0,91 |
-5,21 |
0,96 |
-24,41 |
1,27 |
Contact
information
Company name Fisherman's
Choice B.V.
Trade names Fisherman's
Choice
Fisherman's Choice B.V.
Super Choice
Slothouber Seafood
Asian Choice
Operative address Willemstraat
8-10-12
2514HM 's-Gravenhage
Netherlands
Correspondence address Postbus 85477
2508CD 's-Gravenhage
Netherlands
Telephone number 0703624780
Fax number 0703609345
Email address sales@slothouber.nl
| sales@fishermanschoice.nl
Website www.slothouber.nl
| www.fishermanschoice.nl | www.superchoice.nl
Registration
Registration number KvK-nummer:
27126004
Branch number 000020070063
VAT-number 009297078
Status Active
First registration company register 1989-04-27
Memorandum 1989-04-19
Establishment date 1989-04-19
Legal form Besloten
Vennootschap
Last proposed admendment 2012-03-12
Issued placed capital EUR 18.000
Paid up share capital EUR 18.000
Activities
SBI Wholesale of
fish (46382)
Exporter No
Importer No
Goal Groothandel, waaronder de im- en export, in garnalen, garnalenprodukten en surimi (imitatie krab)
Relations
Shareholders Frans
Brouwer Onroerend Goed B.V.
Kilbystraat 1
8263CJ KAMPEN
Netherlands
Registration number:
050406940000
Percentage: 100%
Liability statements Brouwer
Groothandelsgroep B.V.
Kilbystraat 1
8263CJ KAMPEN
Netherlands
Registration number:
528427110000
date of issue: 2011-11-29
Starting date: 2011-05-31
Management
Active
management F.
Brouwer (Frans)
Netherlands
Competence: Fully authorized
Function: Manager
Starting date: 2004-10-18
Date of birth: 1970-11-14, Kampen, NL
Involved with the following companies
·
Stichting Administratiekantoor Brouwer
Kilbystraat 1
8263CJ KAMPEN
Netherlands
Registration number: 050671220000
Function: Manager
R.J. van Zuidam (Rudolf Jan)
Netherlands
Competence: Limited authorization
Function: Manager
Starting date: 2006-01-01
Date of birth: 1954-10-16, 's-Gravenhage, NL
M.A. Sebök (Michel Antoine)
Netherlands
Competence: Limited authorization
Function: Proxy
Starting date: 2001-01-01
Date of birth: 1978-04-09, 's-Gravenhage, NL
Employees
|
Year |
2015 |
2007 |
2005 |
2004 |
2003 |
|
Total |
9 |
6 |
7 |
7 |
6 |
Payments
Score
7,11
Description
Payments are made regularly
no complaints are known
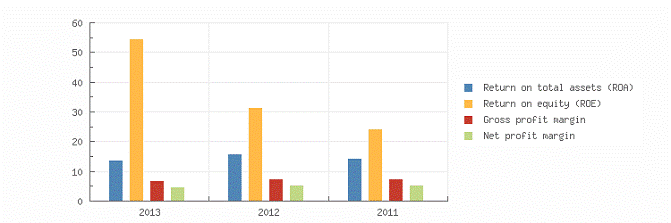
Key
figures
|
Year |
2013 |
2012 |
2011 |
|
Quick ratio |
0,91 |
0,96 |
1,27 |
|
Current ratio |
2,50 |
2,49 |
3,02 |
|
|
|||
|
Working capital/ balance total |
0,45 |
0,42 |
0,43 |
|
Equity / balance total |
0,26 |
0,50 |
0,59 |
|
Equity / Fixed assets |
1,02 |
1,64 |
1,63 |
|
Equity / liabilities |
0,34 |
1,00 |
1,42 |
|
Balance total / liabilities |
1,34 |
2,00 |
2,42 |
|
|
|||
|
Working capital |
25.328.054 |
19.479.857 |
19.590.049 |
|
Equity |
14.355.148 |
23.399.479 |
26.844.827 |
|
Mutation equity |
-38,65 |
-12,83 |
|
|
Mutation short term liabilities |
28,68 |
35,41 |
|
|
|
|||
|
Return on total assets (ROA) |
13,94 |
15,78 |
14,32 |
|
Return on equity (ROE) |
54,61 |
31,61 |
24,39 |
|
Gross profit margin |
6,79 |
7,42 |
7,44 |
|
Net profit margin |
4,87 |
5,31 |
5,52 |
|
|
|||
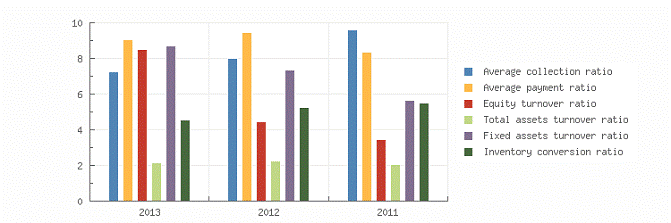
|
Average collection ratio |
7,25 |
7,98 |
9,62 |
|
Average payment ratio |
9,04 |
9,44 |
8,36 |
|
Equity turnover ratio |
8,51 |
4,47 |
3,47 |
|
Total assets turnover ratio |
2,17 |
2,23 |
2,04 |
|
Fixed assets turnover ratio |
8,69 |
7,33 |
5,65 |
|
Inventory conversion ratio |
4,56 |
5,24 |
5,49 |
|
|
|||
|
Turnover |
122.170.191 |
104.549.588 |
93.100.149 |
|
Gross margin |
17.933.456 |
16.710.081 |
15.561.862 |
|
Operating result |
8.296.193 |
7.755.867 |
6.925.231 |
|
Net result after taxes |
5.955.678 |
5.554.652 |
5.136.943 |
|
Cashflow |
6.676.361 |
6.250.977 |
5.728.288 |
|
Gross profit |
122.170.191 |
|
|
|
EBIT |
8.296.193 |
7.755.867 |
6.925.231 |
|
EBITDA |
9.016.876 |
8.452.192 |
7.516.576 |
Summary The 2013 financial result structure
is a postive working captial of 25.328.054 euro, which is in agreement with 45
% of the total assets of the company.
The working capital has increased with 30.02
% compared to previous year. The ratio, with respect to the total assets of the
company has however, increased.
The improvement between 2012 and 2013 has
mainly been caused by an increase of the current assets.
The current ratio of the company in 2013 was
2.5. A company with a current ratio between 1.5 and 3.0 generally indicates
good short-term financial strength.
The quick ratio in 2013 of the company was
0.91. A company with a Quick Ratio of less than 1 cannot currently pay back its
current liabilities.
The 2012 financial result structure is a
postive working captial of 19.479.857 euro, which is in agreement with 42 % of
the total assets of the company.
The working capital remained unchanged
compared to previous year. The ratio with respect to the total assets of the
company has however, declined.
The unchanged capital can be explained by a
decrease in current assets and an increase in current liabilities.
The current ratio of the company in 2012 was
2.49. A company with a current ratio between 1.5 and 3.0 generally indicates
good short-term financial strength.
The quick ratio in 2012 of the company was
0.96. A company with a Quick Ratio of less than 1 cannot currently pay back its
current liabilities.
Financial
statement
Last
annual account 2013
Remark annual account The financial statements
shown in the report relate to the consolidated financial statements of the
group.
Type
of annual account Consolidated
Annual
account Brouwer
Groothandelsgroep B.V.
Kilbystraat 1
8263CJ KAMPEN
Netherlands
Registration number: 528427110000
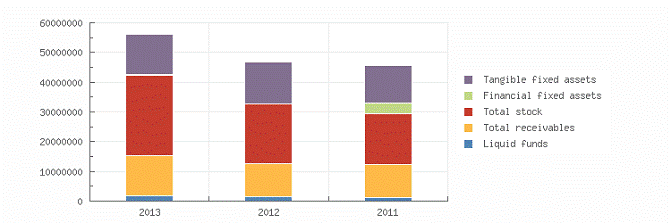
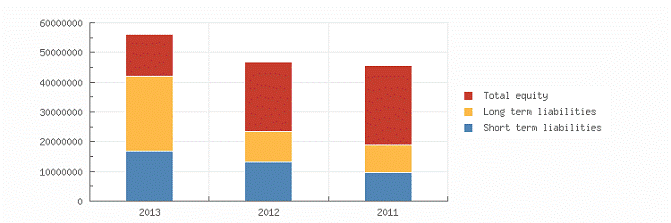
Balance
|
Year |
2013 |
2012 |
2011 |
|
|
End date |
2013-12-31 |
2012-12-31 |
2011-12-31 |
|
|
Tangible
fixed assets |
13.524.793 |
14.110.382 |
12.669.929 |
|
|
Financial
fixed assets |
535.571 |
161.935 |
3.805.880 |
|
|
Fixed
assets |
14.060.364 |
14.272.317 |
16.475.809 |
|
|
|
||||
|
Total
stock |
26.786.633 |
19.965.199 |
16.943.457 |
|
|
Accounts receivable |
12.745.896 |
10.197.408 |
10.343.013 |
|
|
Other receivables |
775.390 |
883.382 |
786.895 |
|
|
Total
receivables |
13.521.286 |
11.080.790 |
11.129.908 |
|
|
Liquid funds |
1.881.361 |
1.536.683 |
1.192.952 |
|
|
Current
assets |
42.189.280 |
32.582.672 |
29.266.317 |
|
|
Total assets |
56.249.644 |
46.854.989 |
45.742.126 |
|
|
Total equity |
14.355.148 |
23.399.479 |
26.844.827 |
|
|
Long term interest yielding debt |
10.033.270 |
10.352.695 |
9.221.031 |
|
|
Financial debts |
15.000.000 |
|
|
|
|
Long
term liabilities |
25.033.270 |
10.352.695 |
9.221.031 |
|
|
Accounts payable |
9.264.771 |
|
|
|
|
Other short term liabilities |
7.596.455 |
|
|
|
|
Short
term liabilities |
16.861.226 |
13.102.815 |
9.676.268 |
|
|
Total
short and long term liabilities |
41.894.496 |
23.455.510 |
18.897.299 |
|
|
Total
liabilities |
56.249.644 |
46.854.989 |
45.742.126 |
|
Summary The total assets of the
company increased with 20.05 % between 2012 and 2013.
Despite the assets growth, the non current
assets decreased with-1.49%.
Asset growth is in contrasts with the net
worth decline of - 38.65%. The company's indebtedness has, therefore, increased
with 78.61 %.
In 2013 the assets of the company were 25 %
composed of fixed assets and 75 % by current assets. The assets are being
financed by an equity of 25.52 %, and total debt of 74.48 %.
The total assets of the company increased
with 2.43 % between 2011 and 2012.
Despite the assets growth, the non current
assets decreased with -13.37%.
Asset growth is in contrasts with the net
worth decline of -12.83 %. The company's indebtedness has, therefore, increased
with 24.12 %.
In 2012 the assets of the company were 30.46
% composed of fixed assets and 69.54 % by current assets. The assets are being
financed by an equity of 49.94 %, and total debt of 50.06 %.
Profit and
loss
|
Year |
2013 |
2012 |
2011 |
||
|
Revenues |
122.170.316 |
104.549.588 |
93.100.149 |
||
|
Other operating income |
125 |
|
|
||
|
Net
turnover |
122.170.191 |
104.549.588 |
93.100.149 |
||
|
|
|||||
|
Gross
margin |
17.933.456 |
16.710.081 |
15.561.862 |
||
|
|
|||||
|
Wages and salaries |
6.150.083 |
5.809.139 |
5.604.251 |
||
|
Amorization and depreciation |
720.683 |
696.325 |
591.345 |
||
|
Sales |
104.236.735 |
87.839.507 |
77.538.287 |
||
|
other operating costs |
2.766.622 |
2.448.750 |
2.441.035 |
||
|
Operating expenses |
113.874.123 |
96.793.721 |
86.174.918 |
||
|
Operating
result |
8.296.193 |
7.755.867 |
6.925.231 |
||
|
Financial income |
8.372 |
1.527 |
10.741 |
||
|
Financial expenses |
465.140 |
361.567 |
387.665 |
||
|
Financial result |
-456.768 |
-360.040 |
-376.924 |
||
|
Result
on ordinary operations before taxes |
7.839.425 |
7.395.827 |
6.548.307 |
||
|
|
|||||
|
Taxation on the result of ordinary activities |
1.965.167 |
1.841.175 |
1.629.368 |
||
|
Result
of ordinary activities after taxes |
5.874.258 |
5.554.652 |
4.918.939 |
||
|
Extraordinary income |
112.140 |
|
|
||
|
Extraordinary expense |
30.720 |
|
|
||
|
Extraordinary result after taxation |
81.420 |
|
218.004 |
||
|
Net
result |
5.955.678 |
5.554.652 |
5.136.943 |
||
Summary The turnover of
the company grew with 16.85 % between 2012 and 2013.
The gross profit of the company
grew with 7.32 % between 2012 and 2013.
The operating result of the
company grew with 6.97 % between 2012 and 2013. This evolution implies an
increase of the company's economic profitability.
The result of these changes
is a reduction of the company's Economic Profitability of -11.66% of the
analysed period, being equal to 2012 % in the year 2013.
This fall has contributed
to a asset turnover decrease, whose index evolved from -2.69 to a level of
2.17.
The Net Result of the
company decreased by 7.22 % between 2012 and 2013.
The company's Financial
Profitability has been negatively affected by the financial activities in
comparison to the EBITs behaviour. The result of these variations is a
profitability reduction of 72.76 % of the analysed period, being 54.61 % in the
year 2013.
The company's financial
structure has slowed down its financial profitability.
The turnover of
the company grew with 12.3 % between 2011 and 2012.
The gross profit of the
company grew with 7.38 % between 2011 and 2012.
The operating result of the
company grew with 11.99 % between 2011 and 2012. This evolution implies an
increase of the company's economic profitability.
The result of these changes
is an increase of the company's Economic Profitability of 10.2 % of the
analysed period, being equal to 2011 % in the year 2012.
This growth has contributed
to the increase in assets turnover, increasing by 9.31 % reaching 2.23.
The Net Result of the
company decreased by 8.13 % between 2011 and 2012.
The company's Financial
Profitability has been positively affected by the financial activities in
comparison to the EBITs behaviour. The result of these variations is a
profitability increase of 29.6 % of the analysed period, being 31.61 % in the
year 2012.
The company's financial
structure has slowed down its financial profitability.
Analysis
Branch (SBI) Wholesale trade
(no motor vehicles and motorcycles) (46)
Region Groot Den Haag
In the Netherlands 109662
of the companies are registered with the SBI code 46
In the region Groot Den
Haag 5671 of the companies are registered with the SBI code 46
In the Netherlands 2387 of
the bankrupcties are published within this sector
In the region Groot Den
Haag 119 of the bankruptcies are published within this sector
The risk of this specific
sector in the Netherlands is normal
The risk of this specific
sector in the region Groot Den Haag is normal
Publications
Consent
statements 21-10-2014:
Voor boekjaar 2013 is een instemmingsverklaring gedeponeerd.
05-06-2013: Voor boekjaar
2012 is een instemmingsverklaring gedeponeerd.
20-07-2012: Voor boekjaar
2011 is een instemmingsverklaring gedeponeerd.
Liability
statements 01-12-2011:
Per 29-11-2011 is een aansprakelijkheidsverklaring door Brouwer
Groothandelsgroep B.V.
gedeponeerd.
01-12-2011: Per 29-11-2011
is een aansprakelijkheidsverklaring door Brouwer
Groothandelsgroep B.V. ingetrokken.
Amendments 14-03-2012:
Geplaatst kapitaal gewijzigd in EUR 18.000,00 Gestort kapitaal gewijzigd in EUR
18.000,00.
14-03-2012: Per 12-3-2012
statuten gewijzigd. Per 12-3-2012 naam gewijzigd in:
Fisherman's Choice B.V..
Company
structure
Relations 8
Stichting Administratiekantoor Brouwer
Kilbystraat 1
8263CJ KAMPEN
Netherlands
Registration number: 050671220000
• Brouwer
Groothandelsgroep B.V.
Kilbystraat 1
8263CJ KAMPEN
Netherlands
Registration number:
528427110000
• Frans Brouwer Onroerend
Goed B.V.
Kilbystraat 1
8263CJ KAMPEN
Netherlands
Registration number:
050406940000
• Fisherman's Choice
B.V.
Willemstraat 8-10-12
2514HM 's-Gravenhage
Netherlands
Registration number: 271260040000
FOREIGN EXCHANGE RATES
|
Currency |
Unit
|
Indian Rupees |
|
US Dollar |
1 |
Rs.65.22 |
|
UK Pound |
1 |
Rs.102.23 |
|
Euro |
1 |
Rs.72.39 |
INFORMATION DETAILS
|
Analysis Done by
: |
RAS |
|
|
|
|
Report Prepared
by : |
TRU |
RATING EXPLANATIONS
|
RATING |
STATUS |
PROPOSED CREDIT LINE |
|
|
|
>86 |
Aaa |
Possesses an extremely sound financial base with the strongest
capability for timely payment of interest and principal sums |
Unlimited |
|
|
71-85 |
Aa |
Possesses adequate working capital. No caution needed for credit transaction.
It has above average (strong) capability for payment of interest and
principal sums |
Large |
|
|
56-70 |
A |
Financial & operational base are regarded healthy. General unfavourable
factors will not cause fatal effect. Satisfactory capability for payment of
interest and principal sums |
Fairly Large |
|
|
41-55 |
Ba |
Overall operation is considered normal. Capable to meet normal
commitments. |
Satisfactory |
|
|
26-40 |
B |
Capability to overcome financial difficulties seems comparatively
below average. |
Small |
|
|
11-25 |
Ca |
Adverse factors are apparent. Repayment of interest and principal sums
in default or expected to be in default upon maturity |
Limited with
full security |
|
|
<10 |
C |
Absolute credit risk exists. Caution needed to be exercised |
Credit not
recommended |
|
|
-- |
NB |
New Business |
-- |
|
This score serves as a reference to assess SC’s
credit risk and to set the amount of credit to be extended. It is calculated
from a composite of weighted scores obtained from each of the major sections of
this report. The assessed factors and their relative weights (as indicated
through %) are as follows:
Financial
condition (40%) Ownership
background (20%) Payment
record (10%)
Credit history
(10%) Market trend (10%) Operational size
(10%)
This report is issued at your request without any
risk and responsibility on the part of MIRA INFORM PRIVATE LIMITED (MIPL) or
its officials.