MIRA INFORM REPORT
|
Report No. : |
336825 |
|
Report Date : |
20.08.2015 |
IDENTIFICATION DETAILS
|
Name : |
JUSTESA IMAGEN SA |
|
|
|
|
Registered Office : |
Avda San Pablo (De) 27, Coslada, Madrid, 28820 |
|
|
|
|
Country : |
Spain |
|
|
|
|
Financials (as on) : |
2013 |
|
|
|
|
Date of Incorporation : |
20.05.1991 |
|
|
|
|
Legal Form : |
Public Company |
|
|
|
|
Line of Business : |
Subject is manufacture of pharmaceutical preparations |
|
|
|
|
No. of Employee : |
74 (2015) |
RATING & COMMENTS
|
MIRA’s Rating : |
Ba |
|
RATING |
STATUS |
PROPOSED CREDIT LINE |
|
|
41-55 |
Ba |
Overall operation is considered normal. Capable to meet normal
commitments. |
Satisfactory |
|
Status : |
Satisfactory |
|
|
|
|
Payment Behaviour : |
No complaints |
|
|
|
|
Litigation : |
Clear |
NOTES :
Any query related to this report can be made on
e-mail : infodept@mirainform.com
while quoting report number, name and date.
ECGC Country Risk Classification List – March 31, 2015
|
Country Name |
Previous Rating (31.12.2014) |
Current Rating (31.03.2015) |
|
Spain |
A1 |
A1 |
|
Risk Category |
ECGC
Classification |
|
Insignificant |
A1 |
|
Low |
A2 |
|
Moderate |
B1 |
|
High |
B2 |
|
Very High |
C1 |
|
Restricted |
C2 |
|
Off-credit |
D |
SPAIN - ECONOMIC OVERVIEW
After experiencing a prolonged recession in the wake of the global financial crisis that began in 2008, in 2014 Spain marked the first full year of positive economic growth in seven years, largely due to increased private consumption. At the onset of the global financial crisis Spain's GDP contracted by 3.7% in 2009, ending a 16-year growth trend, and continued contracting through most of 2013. In 2013 the government successfully shored up struggling banks - exposed to the collapse of Spain's depressed real estate and construction sectors - and in January 2014 completed an EU-funded restructuring and recapitalization program.
Until 2014, credit contraction in the private sector, fiscal austerity, and high unemployment weighed on domestic consumption and investment. The unemployment rate rose from a low of about 8% in 2007 to more than 26% in 2013, but labor reforms prompted a modest reduction to 23.7% in 2014. High unemployment strained Spain's public finances, as spending on social benefits increased while tax revenues fell. Spain’s budget deficit peaked at 11.4% of GDP in 2010, but Spain gradually reduced the deficit to just under 7% of GDP in 2013-14, slightly above the 6.5% target negotiated between Spain and the EU. Public debt has increased substantially – from 60.1% of GDP in 2010 to more than 97% in 2014.
Exports were resilient throughout the economic downturn and helped to bring Spain's current account into surplus in 2013 for the first time since 1986, where it remained in 2014. Rising labor productivity and an internal devaluation resulting from moderating labor costs and lower inflation have helped to improve foreign investor interest in the economy and positive FDI flows have been restored.
The government's efforts to implement labor, pension, health, tax, and education reforms - aimed at supporting investor sentiment - have become overshadowed by political activity in 2015 in anticipation of the national parliamentary elections in November. Spain’s 2015 budget, published in September 2014, rolls back some recently imposed taxes in advance of the elections and leaves untouched the country’s value-added tax (VAT) regime, which continues to generate significantly lower revenue than the EU average. Spain’s borrowing costs are dramatically lower since their peak in mid-2012, and despite the recent uptic in economic activity, inflation has dropped sharply, from 1.5% in 2013 to nearly flat in 2014.
|
Source
: CIA |
|
EXECUTIVE
SUMMARY
|
|
Name: |
JUSTESA IMAGEN SA |
|
NIF
/ Fiscal code: |
A80045271 |
|
Status: |
ACTIVE |
|
Incorporation
Date: |
20/05/1991 |
|
Register Data |
Register
Section 8 Sheet 29951 |
|
Last Publication in BORME: |
05/08/2015
[Dismissal/Resignation] |
|
Last
Published Account Deposit: |
2013 |
|
Share
Capital: |
6.397.344,50 |
|
|
|
|
Localization: |
AVDA
SAN PABLO (DE) 27 - COSLADA - 28820 - MADRID |
|
Telephone
- Fax - Email - Website: |
Telephone.
916 711 500 Email. info@juste.net Website. www.juste.es |
|
|
|
|
Activity: |
|
|
NACE: |
2120
- Manufacture of pharmaceutical preparations |
|
Registered
Trademarks: |
|
|
Audited
/ Opinion: |
Si
/ |
|
Tenders
and Awards: |
|
|
Subsidies: |
3
for a total cost of 450000 |
|
Quality
Certificate: |
No |
|
|
|
|
Payment
Behaviour: |
Currently
fulfilled |
|
Prospects: |
Consolidation |
|
Industry
situation: |
Maturity |
|
|
|
|
Defaults, Legal Claims and
Insolvency Proceedings : |
|
|
|
|
|
|
|
Number |
Amount
(€) |
Most
Recent Entry |
|
Insolvency
Proceedings, Bankruptcy and Suspension of Payments |
|
Unpublished |
--- |
--- |
|
Defaults
on debt with Financial Institutions and Large Companies |
|
None |
--- |
--- |
|
Judicial
Claims (Notices, Executive Proceedings, Attachments, Auctions, Bad Debt) |
|
None |
0 |
--- |
|
Proceedings
heard by the Civil Court |
|
Unpublished |
0 |
--- |
|
Proceedings
heard by the Labour Court |
|
Unpublished |
0 |
--- |
|
|
|
Partners: |
|
|
|
CENTRO
DE INVESTIGACION TERAPEUTICA SA |
100
% |
|
|
JUSTE
SOCIEDAD ANONIMA QUIMICO FARMACEUTICA |
99.99
% |
|
|
Shares: |
3 |
|
|
Other
Links: |
4 |
|
|
No.
of Active Corporate Bodies: |
|
|
|
Ratios |
2013 |
2012 |
Change |
|
|
|
|
|
Guarantees: |
|
|
Properties
Registered: |
Company
NO, Administrator NO |
|
Financing
/ Guarantee Sources : |
Sources
YES, Guarantees YES |
|
INVESTIGATION
SUMMARY |
|
|
The
company was established in the middle of May of 1991. It is dedicated to the
investigation, development, scaling and manufacturing of active
pharmaceutical ingredients, above all those for diagnostic (contrasting
agents for X rays, contrasting agents for RMI, etc.). Apart from that, the
company has experience in other therapeutic areas. In charge of the owner,
there are 74 employees. In light of the above, we consider that it is
possible to maintain relations related to operations of habitual credit. |
|
|
Interviewed
Person: |
|
Enquiry
Details
|
|
|
Business address regime: |
rent |
Identification
|
|
|
Social Denomination: |
JUSTESA IMAGEN SA |
|
NIF / Fiscal code: |
A80045271 |
|
Corporate Status: |
ACTIVE |
|
Start of activity: |
1991 |
|
Registered Office: |
AVDA SAN PABLO (DE) 27 |
|
Locality: |
COSLADA |
|
Province: |
MADRID |
|
Postal Code: |
28820 |
|
Telephone: |
916 711 500 |
|
Fax: |
915 394 236 |
|
Website: |
www.juste.es |
|
Email: |
info@juste.net |
|
Interviewed Person: |
Gestiones diversas, al
encontrarse sus responsables en periodo vacacional. |
|
Activity
|
|
|
NACE: |
2120 |
|
CNAE Obtaining Source: |
2120 |
|
Legal Form: |
INVESTIGATION AND DEVELOPMENT
OF NEW CHEMICAL PHARMACEUTICAL MOLECULES AND TECHNOLOGIES, ACQUISITION,
MANUFACTURING AND SALE OF ALL KINDS OF CHEMICAL AND PHARMACEUTICAL PRODUCTS,
ACQUISITION, EXPLOITATION AND STUDIES OF DEVELOPMENT. |
|
Additional Information: |
It is dedicated to the
investigation, development, scaling and manufacturing of active
pharmaceutical ingredients, above all those for diagnostic (contrasting
agents for X rays, contrasting agents for RMI, etc.). Apart from that, the
company has experience in other therapeutic areas. |
|
Additional Address: |
The property is located in
a 12.578 square meters land. It has a constructed area of 5.112 square meters
that includes offices, production plants, pilot plant, workshops, storehouses
and laboratories (quality controls, I+D+i). |
|
Franchise: |
No |
|
Import / export: |
EXPORTS |
|
Future Perspective: |
Consolidation |
|
Industry situation: |
Maturity |
|
Number
of Employees
|
|
|
|
|
|
|
Year |
No. of employees |
Established |
Incidentals |
|
|
|
2015 |
74 |
|
|
|
The data of employees is from the latest available financial statements in Failing that, are estimates data calculated by statistical methods
Chronological
Summary
|
|||
|
|
|
|
|
|
|
Year |
Act |
|
|
|
1991 |
Appointments/ Re-elections (1) Company Formation (1) |
|
|
|
1993 |
Accounts deposit (year 1991, 1992) Appointments/ Re-elections (3) Statutory Modifications (1) |
|
|
|
1994 |
Accounts deposit (year 1993) |
|
|
|
1995 |
Accounts deposit (year 1994) Appointments/ Re-elections (1) Cessations/ Resignations/ Reversals (1) |
|
|
|
1996 |
Accounts deposit (year 1995) |
|
|
|
1997 |
Accounts deposit (year 1996) Appointments/ Re-elections (1) Cessations/ Resignations/ Reversals (1) |
|
|
|
1998 |
Accounts deposit (year 1997) Appointments/ Re-elections (2) Cessations/ Resignations/ Reversals (3) |
|
|
|
1999 |
Accounts deposit (year 1998) Appointments/ Re-elections (2) Cessations/ Resignations/ Reversals (1) Take-over Merger (1) |
|
|
|
2000 |
Accounts deposit (year 1999) Appointments/ Re-elections (4) Cessations/ Resignations/ Reversals (1) Change of Social Purpose (1) Correction (1) Increase of Capital (1) Statutory Modifications (1) Take-over Merger (4) |
|
|
|
2001 |
Accounts deposit (year 2000) Appointments/ Re-elections (1) |
|
|
|
2002 |
Accounts deposit (year 2001) Appointments/ Re-elections (1) |
|
|
|
2003 |
Accounts deposit (year 2002) Appointments/ Re-elections (1) |
|
|
|
2004 |
Accounts deposit (year 2003) Appointments/ Re-elections (1) Cessations/ Resignations/ Reversals (1) |
|
|
|
2005 |
Accounts deposit (year 2004) Appointments/ Re-elections (2) Cessations/ Resignations/ Reversals (1) |
|
|
|
2006 |
Accounts deposit (year 2005) Appointments/ Re-elections (3) Cessations/ Resignations/ Reversals (2) |
|
|
|
2007 |
Appointments/ Re-elections (2) Cessations/ Resignations/ Reversals (2) |
|
|
|
2008 |
Accounts deposit (year 2006, 2007) Appointments/ Re-elections (1) Cessations/ Resignations/ Reversals (3) |
|
|
|
2009 |
Accounts deposit (year 2008) Appointments/ Re-elections (5) Cessations/ Resignations/ Reversals (2) Declaration of Sole Propietorship (1) Other Concepts/ Events (1) Statutory Modifications (1) |
|
|
|
2010 |
Accounts deposit (year 2009) Appointments/ Re-elections (5) Cessations/ Resignations/ Reversals (1) Declaration of Sole Propietorship (1) Loss of the sole propietorship condition (1) Other Concepts/ Events (2) Statutory Modifications (1) |
|
|
|
2011 |
Accounts deposit (year 2010) Appointments/ Re-elections (1) Cessations/ Resignations/ Reversals (1) |
|
|
|
2012 |
Accounts deposit (year 2011) Appointments/ Re-elections (4) Cessations/ Resignations/ Reversals (3) |
|
|
|
2013 |
Accounts deposit (year 2012) Appointments/ Re-elections (3) Cessations/ Resignations/ Reversals (3) Other Concepts/ Events (1) |
|
|
|
2014 |
Accounts deposit (year 2013) Appointments/ Re-elections (1) Cessations/ Resignations/ Reversals (3) Other Concepts/ Events (1) |
|
|
|
2015 |
Appointments/ Re-elections (3) Cessations/ Resignations/ Reversals (3) Statutory Modifications (1) |
|
Main
Historic Changes
|
|||
|
|
|
|
|
|
Concept |
Publication |
Act |
Date |
|
Corporate Purpose Changes: |
FABRICACION Y VENTA DE TODA CLASE DE PRODUCTOS QUIMICOS Y FARMACEUTICOS, Y LA A QUISICION Y EXPLOTACION DE ESTUDIOS, PATENTES, SERVICIOS Y PROPIEDADES DE PRODUCTOS QUIMICOS Y FARMACEUTICOS. |
Company Formation |
07/11/1991 |
Breakdown
of Owners' Equity
|
|
|
Registered Capital: |
6.397.344,50 |
|
Paid up capital: |
6.397.344,50 |
Updated
Evolution of the Subscribed and Paid-in Capital
|
|||||
|
|
|
|
|
|
|
|
|
|||||
|
|
|
|
|
|
|
|
Publishing Date |
Registration Type |
Capital Subscribed |
Paid up capital |
Underwritten result |
Disbursed Result |
|
22/10/1991 |
Company Formation |
6.010.241 |
6.010.241 |
6.010.241 |
6.010.241 |
|
02/03/2000 |
Increase of Capital |
387.224 |
387.224 |
6.397.345 |
6.397.345 |

Active
Social Bodies
|
|
Post published |
Social Body's Name |
Appointment Date |
Other Positions in this Company |
|
SINGLE PARTNER |
CENTRO DE INVESTIGACION TERAPEUTICA SA |
20/12/2010 |
1 |
|
PRESIDENT |
JUSTE BELLOSILLO INES |
29/03/2012 |
9 |
|
VICE CHAIRMAN |
JUSTE BELLOSILLO FRANCISCO ASIS |
24/03/2011 |
5 |
|
|
OHNESORGE HANS JOACHIN |
13/01/1993 |
3 |
|
MEMBER OF THE BOARD |
JUSTE BELLOSILLO LUIS GONZAGA |
13/01/2015 |
5 |
|
|
JUSTE BELLOSILLO INES |
22/07/2010 |
9 |
|
COMBINED PROXY |
SANTAMARIA MONTEL |
17/02/2005 |
1 |
|
PROXY |
JUSTE BELLOSILLO LUIS GONZAGA |
13/01/2015 |
5 |
|
|
FLORES DELGADO ALVARO |
13/01/2015 |
1 |
|
|
GONZALEZ HERRADA FERNANDO |
13/01/2015 |
1 |
|
NON CONSELLOR SECRETARY |
ROQUE ESCUDE MAGDA |
24/03/2011 |
1 |
|
VICE SECRETARY |
JUSTE BELLOSILLO LUIS GONZAGA |
13/01/2015 |
5 |
|
ACCOUNTS' AUDITOR / HOLDER |
AUREN AUDITORES MAD SLP |
04/02/2015 |
2 |
|
CONSOLIDATED ACCOUNTS' AUDITOR |
AUREN AUDITORES MAD SLP |
04/02/2015 |
2 |
|
|
|
|
|
|
Historical
Social Bodies
|
Social Body's Name |
Post published |
End Date |
Other Positions in this Company |
|
ALZUGARAY BEITIA ANA |
PROXY |
29/11/2013 |
1 |
|
ANGULO GARCIA FRANCISCO JAVIER |
PROXY |
17/02/2005 |
3 |
|
|
PROXY |
01/06/2006 |
|
|
|
PROXY |
22/11/2007 |
|
|
BALDENWEG ANNETTE |
JOINT ATTORNEY/COMBINED PROXY |
01/07/2009 |
1 |
|
BAÑON BERNARD ANTONIO LUIS |
SECRETARY |
24/03/2011 |
1 |
|
BDO AUDIBERIA AUDITORES SL |
ACCOUNTS' AUDITOR / HOLDER |
09/08/2006 |
9 |
|
|
ACCOUNTS' AUDITOR / HOLDER |
22/05/2008 |
|
|
|
ACCOUNTS' AUDITOR / HOLDER |
20/07/2005 |
|
|
|
ACCOUNTS' AUDITOR / HOLDER |
22/09/2004 |
|
|
|
ACCOUNTS' AUDITOR / HOLDER |
22/09/1999 |
|
|
|
ACCOUNTS' AUDITOR / HOLDER |
21/09/2000 |
|
|
|
ACCOUNTS' AUDITOR / HOLDER |
14/09/2001 |
|
|
|
ACCOUNTS' AUDITOR / HOLDER |
09/09/2002 |
|
|
|
ACCOUNTS' AUDITOR / HOLDER |
23/07/2003 |
|
|
BDO BINDER SA |
ACCOUNTS' AUDITOR / HOLDER |
04/12/1998 |
1 |
|
BELLON FERNANDEZ JAVIER |
PROXY |
20/11/2000 |
2 |
|
|
PROXY |
17/02/2005 |
|
|
BERCERUELO GONZALEZ JOSE LUIS |
JOINT ATTORNEY/COMBINED PROXY |
01/07/2009 |
1 |
|
BERTRAM FRANK |
MEMBER OF THE BOARD |
18/06/2009 |
2 |
|
|
VICE CHAIRMAN |
18/06/2009 |
|
|
BOHN MICHAEL GUSTAV |
SECRETARY |
29/10/2007 |
3 |
|
|
MEMBER OF THE BOARD |
29/10/2007 |
|
|
|
PROXY |
22/11/2007 |
|
|
BRAUTIGAM MATTHIAS |
MEMBER OF THE BOARD |
09/08/2006 |
2 |
|
|
MEMBER OF THE BOARD |
20/07/2005 |
|
|
CALVO GARCIA JESUS |
MEMBER OF THE BOARD |
12/12/1995 |
3 |
|
|
MEMBER OF THE BOARD |
07/10/1997 |
|
|
|
MEMBER OF THE BOARD |
01/10/1998 |
|
|
CAMPOY BENEDICTO JAVIER |
JOINT ATTORNEY/COMBINED PROXY |
01/07/2009 |
1 |
|
CAMPOY BENEDICTO JORGE |
JOINT ATTORNEY/COMBINED PROXY |
01/07/2009 |
1 |
|
CASSIDY DENIS |
COMBINED PROXY |
22/09/1999 |
11 |
|
|
MEMBER OF THE BOARD |
22/09/1999 |
|
|
|
MEMBER OF THE BOARD |
27/10/2000 |
|
|
|
PROXY |
20/11/2000 |
|
|
|
PROXY |
22/09/1999 |
|
|
|
PROXY |
17/02/2005 |
|
|
|
MEMBER OF THE BOARD |
20/07/2005 |
|
|
|
JOINT ATTORNEY/COMBINED PROXY |
01/06/2006 |
|
|
|
PROXY |
22/11/2007 |
|
|
|
MEMBER OF THE BOARD |
22/05/2008 |
|
|
|
JOINT ATTORNEY/COMBINED PROXY |
09/06/2008 |
|
|
CODINA NESPLE AGUSTIN |
JOINT ATTORNEY |
01/07/2009 |
1 |
|
COMPANY MONTORY MONTSERRAT |
JOINT ATTORNEY |
01/07/2009 |
1 |
|
COSCULLUELA GIRAL BENJAMIN |
JOINT ATTORNEY |
01/07/2009 |
2 |
|
|
JOINT ATTORNEY/COMBINED PROXY |
01/07/2009 |
|
|
DE HARO NAVARRO ANTONIO |
JOINT ATTORNEY/COMBINED PROXY |
01/07/2009 |
1 |
|
DELGADO FERNANDEZ ELIGIO |
PROXY |
17/02/2005 |
6 |
|
|
PROXY |
20/11/2000 |
|
|
|
JOINT ATTORNEY |
01/06/2006 |
|
|
|
COMBINED PROXY |
01/06/2006 |
|
|
|
PROXY |
22/11/2007 |
|
|
|
JOINT ATTORNEY/COMBINED PROXY |
01/07/2009 |
|
|
DURANTEZ GARCIA MANUEL |
COMBINED PROXY |
01/06/2006 |
3 |
|
|
PROXY |
20/11/2000 |
|
|
|
PROXY |
17/02/2005 |
|
|
FORCEN DEL NUEVO ELENA |
PROXY |
01/07/2009 |
4 |
|
|
PROXY |
13/01/2015 |
|
|
|
PROXY |
22/01/2015 |
|
|
|
PROXY |
18/01/2013 |
|
|
GALDINI BRUNO |
JOINT ATTORNEY |
01/07/2009 |
1 |
|
GARCIA LAHIGUERA CAMBRA FERNANDO |
PROXY |
13/01/2015 |
3 |
|
|
PROXY |
22/01/2015 |
|
|
|
PROXY |
29/05/2013 |
|
|
GARCIA MORENO YOLANDA |
PROXY |
18/01/2013 |
1 |
|
GARCIA REQUENA BEGOÑA |
JOINT ATTORNEY/COMBINED PROXY |
01/07/2009 |
5 |
|
|
PROXY |
01/07/2009 |
|
|
|
PROXY |
18/01/2013 |
|
|
|
PROXY |
13/01/2015 |
|
|
|
PROXY |
22/01/2015 |
|
|
GIERLICHS OLIVER |
JOINT ATTORNEY/COMBINED PROXY |
01/07/2009 |
1 |
|
GOMEZ CARRILLO CARRASCO FRANCISCO JAVIER |
JOINT ATTORNEY/COMBINED PROXY |
01/07/2009 |
3 |
|
|
PROXY |
22/11/2007 |
|
|
|
JOINT ATTORNEY |
01/06/2006 |
|
|
GONZAGA JUSTE BELLOSILLO LUIS |
PROXY |
22/01/2015 |
3 |
|
|
PROXY |
18/01/2013 |
|
|
|
PROXY |
29/05/2013 |
|
|
GONZALEZ HERRADA FERNANDO JOSE |
PROXY |
18/01/2013 |
1 |
|
GONZALEZ SANCHEZ FRANCISCO JAVIER |
PROXY |
20/11/2000 |
1 |
|
GUILLEN JIMENEZ MARIA TERESA |
JOINT ATTORNEY/COMBINED PROXY |
01/07/2009 |
1 |
|
HANS PETER FRIEDRICH GUSTAV BEISSNER |
MEMBER OF THE BOARD |
20/07/2005 |
5 |
|
|
MEMBER OF THE BOARD |
29/10/2007 |
|
|
|
MEMBER OF THE BOARD |
27/10/2000 |
|
|
|
MEMBER OF THE BOARD |
22/09/1999 |
|
|
|
MEMBER OF THE BOARD |
07/10/1997 |
|
|
HAUMESSER WINFRIED |
MEMBER OF THE BOARD |
22/09/1999 |
4 |
|
|
MEMBER OF THE BOARD |
27/10/2000 |
|
|
|
MEMBER OF THE BOARD |
18/06/2009 |
|
|
|
MEMBER OF THE BOARD |
20/07/2005 |
|
|
HERNANDEZ MARTINEZ MARIA ISABEL |
JOINT ATTORNEY |
01/07/2009 |
1 |
|
JIMENEZ FRAILE AGUSTIN |
PROXY |
03/04/1998 |
1 |
|
JUAN MONTEJO ANTONIO |
PROXY |
22/11/2007 |
2 |
|
|
COMBINED PROXY |
01/06/2006 |
|
|
JUSTE BELLOSILLO FRANCISCO |
PROXY |
18/01/2013 |
1 |
|
JUSTE BELLOSILLO FRANCISCO ASIS |
MEMBER OF THE BOARD |
22/07/2010 |
5 |
|
|
PROXY |
29/05/2013 |
|
|
|
MEMBER OF THE BOARD |
24/03/2011 |
|
|
|
PROXY |
22/01/2015 |
|
|
JUSTE BELLOSILLO FRANCISCO DE ASIS |
PROXY |
13/01/2015 |
6 |
|
|
PROXY |
18/01/2013 |
|
|
|
PROXY |
20/11/2000 |
|
|
|
PROXY |
17/02/2005 |
|
|
|
PROXY |
22/11/2007 |
|
|
|
COMBINED PROXY |
01/06/2006 |
|
|
JUSTE BELLOSILLO INES |
MEMBER OF THE BOARD |
22/07/2010 |
9 |
|
|
MEMBER OF THE BOARD |
18/06/2009 |
|
|
|
JOINT ATTORNEY/COMBINED PROXY |
01/07/2009 |
|
|
|
PROXY |
18/01/2013 |
|
|
|
PROXY |
29/05/2013 |
|
|
|
PROXY |
22/01/2015 |
|
|
|
PROXY |
13/01/2015 |
|
|
JUSTE BELLOSILLO LUIS |
PROXY |
18/01/2013 |
1 |
|
JUSTE BELLOSILLO LUIS GONZAGA |
PROXY |
13/01/2015 |
5 |
|
|
NON CONSELLOR ASSISTANT SECRETARY |
13/01/2015 |
|
|
JUSTE SESE RAFAEL |
MEMBER OF THE BOARD |
18/10/1993 |
25 |
|
|
MEMBER OF THE BOARD |
12/12/1995 |
|
|
|
MEMBER OF THE BOARD |
18/06/2009 |
|
|
|
PROXY |
22/09/1999 |
|
|
|
MEMBER OF THE BOARD |
20/07/2005 |
|
|
|
PROXY |
20/11/2000 |
|
|
|
MEMBER OF THE BOARD |
07/10/1997 |
|
|
|
MEMBER OF THE BOARD |
22/09/1999 |
|
|
|
MEMBER OF THE BOARD |
27/10/2000 |
|
|
|
PROXY |
03/04/1998 |
|
|
|
PRESIDENT |
29/03/2012 |
|
|
|
PROXY |
18/01/2013 |
|
|
|
PRESIDENT |
22/07/2010 |
|
|
|
JOINT ATTORNEY/COMBINED PROXY |
01/07/2009 |
|
|
|
JOINT ATTORNEY/COMBINED PROXY |
01/06/2006 |
|
|
|
PROXY |
22/11/2007 |
|
|
|
PRESIDENT |
09/08/2006 |
|
|
|
PRESIDENT |
18/06/2009 |
|
|
|
PROXY |
17/02/2005 |
|
|
|
PRESIDENT |
20/07/2005 |
|
|
|
PRESIDENT |
27/10/2000 |
|
|
|
COMBINED PROXY |
22/09/1999 |
|
|
|
PRESIDENT |
22/09/1999 |
|
|
|
MEMBER OF THE BOARD |
22/07/2010 |
|
|
|
MEMBER OF THE BOARD |
29/03/2012 |
|
|
JUSTE SESE ROSARIO |
MEMBER OF THE BOARD |
18/10/1993 |
7 |
|
|
MEMBER OF THE BOARD |
12/12/1995 |
|
|
|
MEMBER OF THE BOARD |
07/10/1997 |
|
|
|
MEMBER OF THE BOARD |
22/09/1999 |
|
|
|
MEMBER OF THE BOARD |
27/10/2000 |
|
|
|
MEMBER OF THE BOARD |
20/07/2005 |
|
|
|
MEMBER OF THE BOARD |
09/08/2006 |
|
|
JUSTE SOCIEDAD ANONIMA QUIMICO FARMACEUTICA |
SINGLE PARTNER |
20/12/2010 |
1 |
|
KALAU VOM HOFE KIRSTIN |
JOINT ATTORNEY/COMBINED PROXY |
01/07/2009 |
1 |
|
KANTHAK RAIMUND |
PROXY |
22/11/2007 |
1 |
|
LACARRA BAYON CECILIA |
JOINT ATTORNEY/COMBINED PROXY |
01/07/2009 |
2 |
|
|
PROXY |
22/11/2007 |
|
|
MARTIN GARCIA ANTONIO |
MEMBER OF THE BOARD |
22/07/2014 |
1 |
|
MARTIN PRADA ADOLFO |
MEMBER OF THE BOARD |
13/01/1993 |
18 |
|
|
MEMBER OF THE BOARD |
12/12/1995 |
|
|
|
MEMBER OF THE BOARD |
07/10/1997 |
|
|
|
MEMBER OF THE BOARD |
22/09/1999 |
|
|
|
MEMBER OF THE BOARD |
27/10/2000 |
|
|
|
SECRETARY |
22/09/1999 |
|
|
|
PROXY |
20/11/2000 |
|
|
|
PROXY |
03/04/1998 |
|
|
|
PROXY |
22/09/1999 |
|
|
|
COMBINED PROXY |
22/09/1999 |
|
|
|
SECRETARY |
27/10/2000 |
|
|
|
MEMBER OF THE BOARD |
27/10/2000 |
|
|
|
SECRETARY |
20/07/2005 |
|
|
|
MEMBER OF THE BOARD |
20/07/2005 |
|
|
|
JOINT ATTORNEY/COMBINED PROXY |
01/06/2006 |
|
|
|
PROXY |
17/02/2005 |
|
|
|
MEMBER OF THE BOARD |
09/08/2006 |
|
|
|
SECRETARY |
09/08/2006 |
|
|
MARTIN SANCHEZ GREGORIO |
JOINT ATTORNEY/COMBINED PROXY |
01/07/2009 |
1 |
|
MONTANE DIAZ ESTHER |
JOINT ATTORNEY/COMBINED PROXY |
01/07/2009 |
1 |
|
NADAL CUENCA PEDRO |
MEMBER OF THE BOARD |
13/01/1993 |
6 |
|
|
MEMBER OF THE BOARD |
03/04/1998 |
|
|
|
PROXY |
03/04/1998 |
|
|
|
VICE SECRETARY |
03/04/1998 |
|
|
|
MEMBER OF THE BOARD |
07/10/1997 |
|
|
|
MEMBER OF THE BOARD |
12/12/1995 |
|
|
NAVARRO ALVAREZ JUAN IGNACIO |
JOINT ATTORNEY/COMBINED PROXY |
01/07/2009 |
2 |
|
|
PROXY |
22/11/2007 |
|
|
NEBOT ASCASO JUAN CARLOS |
JOINT ATTORNEY/COMBINED PROXY |
01/07/2009 |
1 |
|
NOWAK CHRISTIAN |
MEMBER OF THE BOARD |
22/09/2004 |
1 |
|
OHNESORGE HANS JOACHIM |
MEMBER OF THE BOARD |
18/10/1993 |
16 |
|
|
MEMBER OF THE BOARD |
12/12/1995 |
|
|
|
MEMBER OF THE BOARD |
07/10/1997 |
|
|
|
MEMBER OF THE BOARD |
22/09/1999 |
|
|
|
MEMBER OF THE BOARD |
27/10/2000 |
|
|
|
MEMBER OF THE BOARD |
27/10/2000 |
|
|
|
MEMBER OF THE BOARD |
20/07/2005 |
|
|
|
MEMBER OF THE BOARD |
09/08/2006 |
|
|
|
PROXY |
20/11/2000 |
|
|
|
PROXY |
17/02/2005 |
|
|
|
JOINT ATTORNEY |
22/09/1999 |
|
|
|
COMBINED PROXY |
20/11/2000 |
|
|
|
VICE CHAIRMAN |
27/10/2000 |
|
|
|
VICE CHAIRMAN |
20/07/2005 |
|
|
|
VICE CHAIRMAN |
09/08/2006 |
|
|
|
JOINT ATTORNEY/COMBINED PROXY |
01/06/2006 |
|
|
OHNESORGE HANS JOACHIN |
PROXY |
03/04/1998 |
3 |
|
|
PROXY |
22/09/1999 |
|
|
PRICE WATERHOUSE COOPERS AUDITORES SL |
ACCOUNTS' AUDITOR / HOLDER |
22/12/2010 |
5 |
|
|
CONSOLIDATED ACCOUNTS' AUDITOR |
22/09/2014 |
|
|
|
ACCOUNTS' AUDITOR / HOLDER |
22/03/2012 |
|
|
|
ACCOUNTS' AUDITOR / HOLDER |
05/12/2012 |
|
|
|
CONSOLIDATED ACCOUNTS' AUDITOR |
05/12/2012 |
|
|
PRICEWATERHOUSECOOPERS AUDITORES SL |
ACCOUNTS' AUDITOR / HOLDER |
22/09/2014 |
4 |
|
|
CONSOLIDATED ACCOUNTS' AUDITOR |
22/09/2014 |
|
|
|
CONSOLIDATED ACCOUNTS' AUDITOR |
04/02/2015 |
|
|
|
ACCOUNTS' AUDITOR / HOLDER |
04/02/2015 |
|
|
PUIGBERT RIBES JOSE |
JOINT ATTORNEY/COMBINED PROXY |
01/07/2009 |
1 |
|
RAHMEL WILLI |
MEMBER OF THE BOARD |
12/12/1995 |
2 |
|
|
MEMBER OF THE BOARD |
07/10/1997 |
|
|
RODRIGUEZ CARREIRAS JOAQUIN LUIS ROBERTO |
MEMBER OF THE BOARD |
05/12/2012 |
3 |
|
|
PROXY |
05/12/2012 |
|
|
|
MEMBER OF THE BOARD |
22/07/2010 |
|
|
ROMERO CASTILLO JOSE MIGUEL |
PROXY |
03/04/1998 |
1 |
|
SAEZ CASAS ANTONIO |
MEMBER OF THE BOARD |
18/06/2009 |
3 |
|
|
SECRETARY |
18/06/2009 |
|
|
|
JOINT ATTORNEY/COMBINED PROXY |
01/07/2009 |
|
|
SANTAMARIA MONTEL FRANCISCO JAVIER |
COMBINED PROXY |
01/06/2006 |
8 |
|
|
SECRETARY |
22/07/2010 |
|
|
|
MEMBER OF THE BOARD |
22/07/2010 |
|
|
|
JOINT ATTORNEY/COMBINED PROXY |
01/07/2009 |
|
|
|
PROXY |
22/11/2007 |
|
|
|
PROXY |
18/01/2013 |
|
|
|
PROXY |
09/05/2014 |
|
|
|
MEMBER OF THE BOARD |
09/05/2014 |
|
|
SCHMIDT JURGEN |
JOINT ATTORNEY/COMBINED PROXY |
01/07/2009 |
1 |
|
SEEGER STEFAN |
MEMBER OF THE BOARD |
12/12/1995 |
1 |
|
SILES MARTIN LUIS |
VICE SECRETARY |
16/12/2013 |
1 |
|
SOLER ESTEVE ESPERANZA |
JOINT ATTORNEY/COMBINED PROXY |
01/07/2009 |
1 |
|
SORIANO AROSA FRANCISCO JAVIER |
MEMBER OF THE BOARD |
28/07/2015 |
1 |
|
VALDIVIELSO BUSTO ALBERTO |
MEMBER OF THE BOARD |
18/06/2009 |
1 |
|
VAN DER LOO THEODORUS |
PROXY |
22/11/2007 |
3 |
|
|
MEMBER OF THE BOARD |
29/10/2007 |
|
|
|
VICE CHAIRMAN |
29/10/2007 |
|
|
VIDAL MANGLANO LUIS |
PROXY |
18/01/2013 |
2 |
|
|
PROXY |
22/01/2015 |
|
|
VILALTA DE MIGUEL DANIEL |
JOINT ATTORNEY |
01/07/2009 |
2 |
|
|
JOINT ATTORNEY/COMBINED PROXY |
01/07/2009 |
|
|
WENDELBERGER VERENA |
JOINT ATTORNEY |
01/07/2009 |
1 |
|
ZUMBAUM ARNE |
MEMBER OF THE BOARD |
22/05/2008 |
1 |
|
Executive
board
|
||
|
|
|
|
|
Post |
NIF |
Name |
|
FINANCIAL DIRECTOR |
|
BEGOÑA GARCIA |
|
MANAGING DIRECTOR |
|
JAVIER SANTAMARIA |
|
MANAGING DIRECTOR |
|
JAVIER SANTAMARIA MONTEL |
Defaults, Legal Claims and Insolvency
Proceedings
|
|
|
|
|
Section enabling assessment of the degree of compliance of the company queried
with its payment obligations. It provides information on the existence and
nature of all stages of Insolvency and Legal Proceedings published with
reference to the Company in the country's various Official Bulletins and
national newspapers, as well Defaults Registered in the main national credit
bureaus (ASNEF Industrial and RAI ).
>
Summary
Chronological summary
|
|
|
Number
of Publications |
Amount
(_) |
Start
date |
End
date |
|
Insolvency
Proceedings, Bankruptcy and Suspension of Payments |
|
Unpublished |
--- |
--- |
--- |
|
Request/Declaration |
|
0 |
--- |
date |
|
|
Proceedings |
|
--- |
--- |
|
--- |
|
Resolution |
|
--- |
--- |
|
--- |
|
Defaults
on debt with Financial Institutions and Large Companies |
Bank
and Commercial Delinquency |
None |
0 |
|
|
|
Status:
Friendly |
|
--- |
|
|
|
|
Status:
Pre-Litigation |
|
--- |
|
|
|
|
Status:
Litigation |
|
--- |
|
|
|
|
Status:
Non-performing |
|
--- |
|
|
|
|
Status:
insolvency proceedings, bankruptcy and suspension of payments |
|
--- |
|
|
|
|
Other
status |
|
--- |
|
|
|
|
Legal
and Administrative Proceedings |
|
Unpublished |
--- |
|
|
|
Notices
of defaults and enforcement |
|
--- |
--- |
|
--- |
|
Seizures |
|
--- |
--- |
|
--- |
|
Auctions |
|
--- |
--- |
|
--- |
|
Declarations
of insolvency and bad debt |
|
--- |
--- |
|
--- |
|
Proceedings
heard by the Civil Court |
|
Unpublished |
--- |
|
|
|
Proceedings
heard by the Labour Court |
|
Unpublished |
--- |
|
|
> Details
>
Basis for scoring
|
Positive Factors |
Adverse Factors |
|
No irregular payment performance has been detected based on information obtained from credit bureaus. Significant level of financial autonomy. The asset is financed mostly with equity and financing with maturity exceeding one year, providing a solid financial structure. The current debt represents a 27.79of the financial structure. In principle, a decrease in this ratio would indicate an improvement in the short-term financial situation. JUSTESA IMAGEN SA obtains economic profitability from the necessary investments in the development of its activity in comparison with its assets. High financial profitability. Net return from the company's main activity performed using its own equity is high. This income return has decreased in comparison with the previous financial year. |
|
TREND
OF SCORING
|
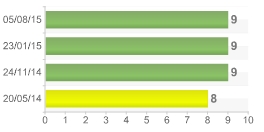
> Latest Scoring Changes :
|
Scoring |
Evolution |
Date |
Event |
|
|
Neutral |
05/08/15 |
Updating of relevant commercial information. |
|
Neutral |
23/01/15 |
Updating of information related to subsidies or other public aid. |
|
|
Positive |
24/11/14 |
Updating of financial statements. |
|
|
Positive |
20/05/14 |
Updating of relevant commercial information. |
Probability of default
|
> Estimated Probability of Default for the next 12 months: 0.212 %
|
Sector
in which comparison is carried out: 212 Manufacture
of pharmaceutical preparations |
|
|
Relative
Position:
|
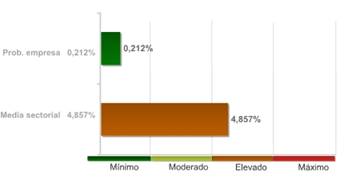
The
company's comparative analysis with the rest of the companies that comprise the
sector, shows the company holds a better position with regard to the
probability of non-compliance.
The
95.00% of the companies of the sector JUSTESA IMAGEN SA belongs to show a
higher probability of non-compliance.
The
probability of the company's non-compliance with its payment obligations within
deadlines estimated by our qualifications models is 0.212%.
In the
event they fail to comply with the payment, the seriousness of the loss will
depend on factors such as the promptness of the commencement of the charging
management, the existence of executive documents which match the credit or the
existence of guarantees and free debt assets under the name of the debtor.
Therefore, the probability of non-compliance should not be solely interpreted
as the total loss of the owed amount.
LEGAL
CLAIMS
|
|
|
|
|
|
Summary
of Judicial Claims |
|
|
|
|
|
|
|
|
||
|
|
|
No
se han publicado |
|
|
|
|
No
se han publicado |
|
|
|
|
||
|
|
|
No
se han publicado |
|
|
|
|
No
se han publicado |
|
|
|
|
No
se han publicado |
|
|
|
|
No
se han publicado |
|
|
|
|
||
|
|
|
No
se han publicado |
|
|
|
|
No
se han publicado |
|
|
|
|
||
|
|
|
No
se han publicado |
|
|
Link
List
|
|
|
|
|
|
ABSORBS TO: |
1 Entities |
|
IS RELATED WITH: |
3 Entities |
|
PARTICIPATES IN: |
3 Entities |
|
SHAREHOLDERS: |
2 Entities |
> Shareholders
|
Relationship |
Entity |
Province |
Shareholding stake |
|
SHAREHOLDERS |
CENTRO DE INVESTIGACION
TERAPEUTICA SA |
MADRID |
100 |
|
|
JUSTE SOCIEDAD ANONIMA
QUIMICO FARMACEUTICA |
MADRID |
99.99 |
|
PARTICIPATES IN |
JUSTESA IMAGEN ARGENTINA,
SOCIEDAD ANONIMA, (ARGENTINA) |
|
99.99 |
|
|
JUSTESA IMAGEM DO BRASIL,
SOCIEDAD ANONIMA, (BRASIL) |
|
99.99 |
|
|
JUSTESA IMAGEN MEXICANA,
SOCIEDAD ANONIMA, DE CV (MEXICO) |
|
99.99 |
> Other relationships
|
Relationship |
Entity |
Province |
Shareholding stake |
|
IS RELATED WITH |
| | |
|
|
|
|
BRACCO IMAGING SPA |
|
|
|
|
JUSTESA IMAGEM DO BRASIL,
SOCIEDAD ANONIMA, (BRASIL) |
|
|
|
|
JUSTESA IMAGEN MEXICANA,
SOCIEDAD ANONIMA, DE CV (MEXICO) |
|
|
|
ABSORBS TO |
CENTRO DE INVESTIGACION
JUSTESA IMAGEN, S.A. |
MADRID |
|
|
Turnover
|
|
|
Total Sales 2014 |
27.600.000 |
The sales data is from the
latest available financial statements in Failing that, are estimates data calculated
by statistical methods.
|
Estimated
Balance
|
|
Prev. 2014 Non-current
asset 12.200.000 Current asset 13.500.000 Net worth 16.800.000 Non-current
liabilities 2.500.000 Current liabilities 6.400.000 Total liabilities and net
assets 25.700.000 Sales 27.600.000 |
|
Financial
Accounts and Balance Sheets
|
|
|
|
|
Financial Years Presented
|
Ejercicio |
Tipo
de Cuentas Anuales |
Fecha
Presentacion |
|
2013 |
Normales |
November
2014 |
|
2012 |
Normales |
September
2013 |
|
2011 |
Normales |
July
2012 |
|
2010 |
Normales |
October
2011 |
|
2009 |
Normales |
April
2010 |
|
2009 |
Normales |
October
2010 |
|
2008 |
Normales |
October
2009 |
|
2007 |
Normales |
October
2008 |
|
2006 |
Normales |
February
2008 |
|
2005 |
Normales |
October
2006 |
|
2004 |
Normales |
September
2005 |
|
2003 |
Normales |
July
2004 |
|
2002 |
Normales |
September
2003 |
|
2001 |
Normales |
November
2002 |
|
2000 |
Normales |
August
2001 |
|
1999 |
Normales |
August
2000 |
|
1998 |
Normales |
September
1999 |
|
1997 |
Normales |
November
1998 |
|
1996 |
Normales |
November
1997 |
|
1995 |
Normales |
August
1996 |
|
1994 |
Normales |
August
1995 |
|
1993 |
Normales |
August
1994 |
|
1992 |
Normales |
August
1993 |
|
1991 |
Normales |
December
1992 |
The data in the report regarding
the last Company Accounts submitted by the company is taken from the TRADE
REGISTER serving the region in which the company's address is located 31/12/2013
> Normal format Balance in accordance with the New Accounting
Plan 2007
Information corresponding
to the fiscal year 2013 2012 2011 2010 2009 is taken
from information submitted to the TRADE REGISTER. Data corresponding to fiscal
years before 2013 2012 2011 2010 2009 has been
compiled based on the equivalence criteria stipulated in Act JUS/206/2009.
Where the provisions of the Act did not establish relevant equivalence
criteria, created such criteria using its own methodology. To view details on
the methodology.
|
|
ORIGINAL |
ORIGINAL |
ORIGINAL |
ORIGINAL |
ORIGINAL |
|
|
Assets |
2013 |
2012 |
2011 |
2010 |
2009 |
|
|
A)
NON-CURRENT ASSETS: 11000 |
12.565.000,00 |
13.886.000,00 |
16.565.000,00 |
16.004.000,00 |
6.459.489,00 |
|
|
I. Intangible fixed assets : 11100 |
543.000,00 |
469.000,00 |
423.000,00 |
204.000,00 |
4.581,00 |
|
|
1. Development: 11110 |
456.000,00 |
383.000,00 |
338.000,00 |
201.000,00 |
0,00 |
|
|
2. Concessions: 11120 |
0,00 |
0,00 |
0,00 |
0,00 |
0,00 |
|
|
3. Patents, licencing, trade marks and
similar: 11130 |
0,00 |
0,00 |
0,00 |
0,00 |
0,00 |
|
|
4. Goodwill: 11140 |
0,00 |
0,00 |
0,00 |
0,00 |
0,00 |
|
|
5. IT applications: 11150 |
8.000,00 |
7.000,00 |
10.000,00 |
3.000,00 |
4.581,00 |
|
|
6. Investigation: 11160 |
0,00 |
0,00 |
0,00 |
0,00 |
0,00 |
|
|
7. Intellectual property: 11180 |
0,00 |
0,00 |
0,00 |
0,00 |
0,00 |
|
|
8. Greenhouse gas emission allowance:
11190 |
0,00 |
0,00 |
0,00 |
0,00 |
0,00 |
|
|
9. Other intangible fixed assets. :
11170 |
79.000,00 |
79.000,00 |
75.000,00 |
0,00 |
0,00 |
|
|
II. Tangible fixed assets : 11200 |
4.236.000,00 |
4.260.000,00 |
3.649.000,00 |
3.119.000,00 |
3.559.969,00 |
|
|
1. Land and buildings: 11210 |
0,00 |
0,00 |
0,00 |
0,00 |
1.114.030,00 |
|
|
2. Technical installations and other
tangible fixed assets: 11220 |
3.713.000,00 |
3.695.000,00 |
3.261.000,00 |
2.170.000,00 |
2.379.256,00 |
|
|
3. Tangible asset in progress and
advances: 11230 |
523.000,00 |
565.000,00 |
388.000,00 |
949.000,00 |
66.684,00 |
|
|
III. Real estate investment: 11300 |
0,00 |
0,00 |
0,00 |
0,00 |
0,00 |
|
|
1. Land: 11310 |
0,00 |
0,00 |
0,00 |
0,00 |
0,00 |
|
|
2. Buildings: 11320 |
0,00 |
0,00 |
0,00 |
0,00 |
0,00 |
|
|
IV. Long-term investments in Group companies and associates :
11400 |
7.468.000,00 |
8.044.000,00 |
12.322.000,00 |
12.583.000,00 |
2.820.837,00 |
|
|
1. Equity instruments: 11410 |
0,00 |
0,00 |
3.664.000,00 |
3.386.000,00 |
2.820.837,00 |
|
|
2. Credits to businesses: 11420 |
7.468.000,00 |
8.044.000,00 |
8.658.000,00 |
9.197.000,00 |
0,00 |
|
|
3. Debt securities: 11430 |
0,00 |
0,00 |
0,00 |
0,00 |
0,00 |
|
|
4. Derivatives : 11440 |
0,00 |
0,00 |
0,00 |
0,00 |
0,00 |
|
|
5. Other financial assets : 11450 |
0,00 |
0,00 |
0,00 |
0,00 |
0,00 |
|
|
6. Other investments: 11460 |
0,00 |
0,00 |
0,00 |
0,00 |
0,00 |
|
|
V. Long-term financial investments: 11500 |
81.000,00 |
79.000,00 |
79.000,00 |
4.000,00 |
3.629,00 |
|
|
1. Equity instruments: 11510 |
0,00 |
0,00 |
0,00 |
0,00 |
0,00 |
|
|
2. Credits to third parties : 11520 |
0,00 |
0,00 |
0,00 |
0,00 |
0,00 |
|
|
3. Debt securities: 11530 |
0,00 |
0,00 |
0,00 |
0,00 |
0,00 |
|
|
4. Derivatives : 11540 |
0,00 |
0,00 |
0,00 |
0,00 |
0,00 |
|
|
5. Other financial assets : 11550 |
81.000,00 |
79.000,00 |
79.000,00 |
4.000,00 |
3.629,00 |
|
|
6. Other investments: 11560 |
0,00 |
0,00 |
0,00 |
0,00 |
0,00 |
|
|
VI. Assets for deferred tax : 11600 |
237.000,00 |
1.034.000,00 |
92.000,00 |
94.000,00 |
70.472,00 |
|
|
VII. Non-current trade debts : 11700 |
0,00 |
0,00 |
0,00 |
0,00 |
0,00 |
|
|
B)
CURRENT ASSETS: 12000 |
12.949.000,00 |
11.547.000,00 |
17.043.000,00 |
18.008.000,00 |
20.453.729,00 |
|
|
I. Non-current assets held for sale : 12100 |
0,00 |
0,00 |
0,00 |
0,00 |
0,00 |
|
|
II. Stocks: 12200 |
4.425.000,00 |
3.784.000,00 |
4.605.000,00 |
4.572.000,00 |
9.036.636,00 |
|
|
1. Commercial: 12210 |
0,00 |
0,00 |
0,00 |
0,00 |
0,00 |
|
|
2. Primary material and other supplies:
12220 |
1.336.000,00 |
1.655.000,00 |
936.000,00 |
1.734.000,00 |
3.833.121,00 |
|
|
3. Work in progress: 12230 |
390.000,00 |
332.000,00 |
313.000,00 |
3.000,00 |
0,00 |
|
|
a) Of long-term
production cycle : 12231 |
0,00 |
0,00 |
0,00 |
0,00 |
0,00 |
|
|
b) Of short-term
production cycle : 12232 |
390.000,00 |
332.000,00 |
313.000,00 |
3.000,00 |
0,00 |
|
|
4. Finished goods: 12240 |
2.699.000,00 |
1.792.000,00 |
3.356.000,00 |
2.835.000,00 |
5.203.515,00 |
|
|
a) Of long-term
production cycle : 12241 |
0,00 |
0,00 |
0,00 |
0,00 |
0,00 |
|
|
b) Of short-term
production cycle : 12242 |
2.699.000,00 |
1.792.000,00 |
3.356.000,00 |
2.835.000,00 |
5.203.515,00 |
|
|
5. By-products, residues and recycled
materials: 12250 |
0,00 |
0,00 |
0,00 |
0,00 |
0,00 |
|
|
6. Advances to suppliers: 12260 |
0,00 |
5.000,00 |
0,00 |
0,00 |
0,00 |
|
|
III. Trade debtors and others receivable accounts: 12300 |
5.052.000,00 |
5.542.000,00 |
8.417.000,00 |
8.547.000,00 |
9.350.295,00 |
|
|
1. Trade debtors / accounts receivable:
12310 |
4.413.000,00 |
4.751.000,00 |
3.080.000,00 |
4.765.000,00 |
4.631.807,00 |
|
|
a) Long-term receivables
from sales and services supplied : 12311 |
0,00 |
0,00 |
0,00 |
0,00 |
0,00 |
|
|
b) Customers for
sales and provisions of services : 12312 |
4.413.000,00 |
4.751.000,00 |
3.080.000,00 |
4.765.000,00 |
4.631.807,00 |
|
|
2. Customers, Group companies and
associates : 12320 |
0,00 |
0,00 |
2.793.000,00 |
2.621.000,00 |
1.843.993,00 |
|
|
3. Other accounts receivable: 12330 |
5.000,00 |
39.000,00 |
5.000,00 |
5.000,00 |
98.801,00 |
|
|
4. Personnel: 12340 |
9.000,00 |
10.000,00 |
19.000,00 |
36.000,00 |
35.906,00 |
|
|
5. Assets for deferred tax: 12350 |
0,00 |
0,00 |
0,00 |
0,00 |
0,00 |
|
|
6. Other debtors, including tax and social
security: 12360 |
625.000,00 |
742.000,00 |
2.520.000,00 |
1.120.000,00 |
2.739.789,00 |
|
|
7. Called up share capital: 12370 |
0,00 |
0,00 |
0,00 |
0,00 |
0,00 |
|
|
IV. Short-term investments in Group companies and associates:
12400 |
1.447.000,00 |
1.422.000,00 |
3.526.000,00 |
4.502.000,00 |
0,00 |
|
|
1. Equity instruments: 12410 |
0,00 |
0,00 |
0,00 |
0,00 |
0,00 |
|
|
2. Credits to businesses: 12420 |
1.447.000,00 |
1.422.000,00 |
3.526.000,00 |
4.502.000,00 |
0,00 |
|
|
3. Debt securities: 12430 |
0,00 |
0,00 |
0,00 |
0,00 |
0,00 |
|
|
4. Derivatives : 12440 |
0,00 |
0,00 |
0,00 |
0,00 |
0,00 |
|
|
5. Other financial assets : 12450 |
0,00 |
0,00 |
0,00 |
0,00 |
0,00 |
|
|
6. Other investments: 12460 |
0,00 |
0,00 |
0,00 |
0,00 |
0,00 |
|
|
V. Short-term financial investments : 12500 |
0,00 |
0,00 |
0,00 |
0,00 |
0,00 |
|
|
1. Equity instruments: 12510 |
0,00 |
0,00 |
0,00 |
0,00 |
0,00 |
|
|
2. Credits to businesses: 12520 |
0,00 |
0,00 |
0,00 |
0,00 |
0,00 |
|
|
3. Debt securities: 12530 |
0,00 |
0,00 |
0,00 |
0,00 |
0,00 |
|
|
4. Derivatives : 12540 |
0,00 |
0,00 |
0,00 |
0,00 |
0,00 |
|
|
5. Other financial assets : 12550 |
0,00 |
0,00 |
0,00 |
0,00 |
0,00 |
|
|
6. Other investments: 12560 |
0,00 |
0,00 |
0,00 |
0,00 |
0,00 |
|
|
VI. Short-term accruals: 12600 |
68.000,00 |
33.000,00 |
37.000,00 |
37.000,00 |
38.388,00 |
|
|
VII. Cash and other equivalent liquid assets : 12700 |
1.957.000,00 |
766.000,00 |
458.000,00 |
350.000,00 |
2.028.410,00 |
|
|
1. Treasury: 12710 |
1.957.000,00 |
766.000,00 |
458.000,00 |
350.000,00 |
2.028.410,00 |
|
|
2. Other equivalent liquid assets:
12720 |
0,00 |
0,00 |
0,00 |
0,00 |
0,00 |
|
|
TOTAL
ASSETS (A + B) : 10000 |
25.514.000,00 |
25.433.000,00 |
33.608.000,00 |
34.012.000,00 |
26.913.218,00 |
|
|
|
ORIGINAL |
ORIGINAL |
ORIGINAL |
ORIGINAL |
ORIGINAL |
|
|
Liabilities
and Net Worth |
2013 |
2012 |
2011 |
2010 |
2009 |
|
|
A)
NET WORTH: 20000 |
16.215.000,00 |
15.573.000,00 |
20.265.000,00 |
23.180.000,00 |
15.947.120,00 |
|
|
A-1) Shareholders' equity: 21000 |
16.035.000,00 |
15.402.000,00 |
20.035.000,00 |
23.180.000,00 |
15.704.557,00 |
|
|
I. Capital: 21100 |
6.397.000,00 |
6.397.000,00 |
6.397.000,00 |
6.397.000,00 |
6.397.345,00 |
|
|
1. Registered capital : 21110 |
6.397.000,00 |
6.397.000,00 |
6.397.000,00 |
6.397.000,00 |
6.397.345,00 |
|
|
2. (Uncalled capital): 21120 |
0,00 |
0,00 |
0,00 |
0,00 |
0,00 |
|
|
II. Share premium: 21200 |
461.000,00 |
461.000,00 |
461.000,00 |
461.000,00 |
460.503,00 |
|
|
III. Reserves: 21300 |
8.544.000,00 |
7.671.000,00 |
13.922.000,00 |
10.048.000,00 |
7.508.986,00 |
|
|
1. Legal and statutory: 21310 |
1.280.000,00 |
1.280.000,00 |
1.280.000,00 |
1.280.000,00 |
1.279.469,00 |
|
|
2. Other reserves: 21320 |
7.264.000,00 |
6.391.000,00 |
12.642.000,00 |
8.768.000,00 |
6.229.517,00 |
|
|
3. Revaluation reserves: 21330 |
0,00 |
0,00 |
0,00 |
0,00 |
0,00 |
|
|
IV. (Common stock equity): 21400 |
0,00 |
0,00 |
0,00 |
0,00 |
0,00 |
|
|
V. Results from previous periods: 21500 |
0,00 |
0,00 |
0,00 |
0,00 |
0,00 |
|
|
1. Brought forward: 21510 |
0,00 |
0,00 |
0,00 |
0,00 |
0,00 |
|
|
2. (Negative results from previous
periods): 21520 |
0,00 |
0,00 |
0,00 |
0,00 |
0,00 |
|
|
VI. Other shareholders' contributions: 21600 |
0,00 |
0,00 |
0,00 |
0,00 |
0,00 |
|
|
VII. Result of the period: 21700 |
2.193.000,00 |
8.873.000,00 |
-745.000,00 |
7.274.000,00 |
1.337.724,00 |
|
|
VIII. (Interim dividend): 21800 |
-1.560.000,00 |
-8.000.000,00 |
0,00 |
-1.000.000,00 |
0,00 |
|
|
IX. Other net worth instruments: 21900 |
0,00 |
0,00 |
0,00 |
0,00 |
0,00 |
|
|
A-2) Adjustments due to changes in value: 22000 |
0,00 |
0,00 |
0,00 |
0,00 |
0,00 |
|
|
I. Financial assets held for sale: 22100 |
0,00 |
0,00 |
0,00 |
0,00 |
0,00 |
|
|
II. Hedge operations: 22200 |
0,00 |
0,00 |
0,00 |
0,00 |
0,00 |
|
|
III. Linked non-current assets and liabilities held for sale :
22300 |
0,00 |
0,00 |
0,00 |
0,00 |
0,00 |
|
|
IV. Exchange rate difference: 22400 |
0,00 |
0,00 |
0,00 |
0,00 |
0,00 |
|
|
V. Other: 22500 |
0,00 |
0,00 |
0,00 |
0,00 |
0,00 |
|
|
A-3) Received subsidies, donations and legacies: 23000 |
180.000,00 |
171.000,00 |
230.000,00 |
0,00 |
242.563,00 |
|
|
B)
NON-CURRENT LIABILITIES: 31000 |
2.208.000,00 |
1.246.000,00 |
1.059.000,00 |
838.000,00 |
3.335.744,00 |
|
|
I. Long-term provisions: 31100 |
358.000,00 |
101.000,00 |
120.000,00 |
208.000,00 |
3.335.744,00 |
|
|
1. Long-term employee benefits liability:
31110 |
97.000,00 |
101.000,00 |
120.000,00 |
208.000,00 |
0,00 |
|
|
2. Environmental actions: 31120 |
0,00 |
0,00 |
0,00 |
0,00 |
0,00 |
|
|
3. Restructuring provisions: 31130 |
0,00 |
0,00 |
0,00 |
0,00 |
0,00 |
|
|
4. Other provisions: 31140 |
261.000,00 |
0,00 |
0,00 |
0,00 |
3.335.744,00 |
|
|
II Long-term creditors: 31200 |
1.773.000,00 |
1.072.000,00 |
840.000,00 |
630.000,00 |
0,00 |
|
|
1. Liabilities and other securities:
31210 |
0,00 |
0,00 |
0,00 |
0,00 |
0,00 |
|
|
2. Amounts owed to credit institutions:
31220 |
0,00 |
0,00 |
0,00 |
0,00 |
0,00 |
|
|
3. Creditors from financial leasing:
31230 |
0,00 |
0,00 |
0,00 |
0,00 |
0,00 |
|
|
4. Derivatives : 31240 |
0,00 |
0,00 |
0,00 |
0,00 |
0,00 |
|
|
5. Other financial liabilities :
31250 |
1.773.000,00 |
1.072.000,00 |
840.000,00 |
630.000,00 |
0,00 |
|
|
III. Long-term debts with Group companies and associates:
31300 |
0,00 |
0,00 |
0,00 |
0,00 |
0,00 |
|
|
IV. Liabilities for deferred tax: 31400 |
77.000,00 |
73.000,00 |
99.000,00 |
0,00 |
0,00 |
|
|
V. Long-term accruals: 31500 |
0,00 |
0,00 |
0,00 |
0,00 |
0,00 |
|
|
VI. Non-current trade creditors : 31600 |
0,00 |
0,00 |
0,00 |
0,00 |
0,00 |
|
|
VII. Special long-term debts : 31700 |
0,00 |
0,00 |
0,00 |
0,00 |
0,00 |
|
|
C)
CURRENT LIABILITIES : 32000 |
7.091.000,00 |
8.614.000,00 |
12.284.000,00 |
9.994.000,00 |
7.630.353,00 |
|
|
I. Liabilities linked to non-current assets held for sale:
32100 |
0,00 |
0,00 |
0,00 |
0,00 |
0,00 |
|
|
II. Short-term provisions: 32200 |
171.000,00 |
3.078.000,00 |
2.037.000,00 |
1.238.000,00 |
1.225.638,00 |
|
|
1. Provisions from greenhouse gas emission
allowance: 32210 |
0,00 |
0,00 |
0,00 |
0,00 |
0,00 |
|
|
2. Other provisions: 32220 |
171.000,00 |
0,00 |
0,00 |
0,00 |
0,00 |
|
|
III. Short-term creditors : 32300 |
1.019.000,00 |
781.000,00 |
23.000,00 |
34.000,00 |
0,00 |
|
|
1. Liabilities and other securities:
32310 |
0,00 |
0,00 |
0,00 |
0,00 |
0,00 |
|
|
2. Amounts owed to credit institutions:
32320 |
1.011.000,00 |
582.000,00 |
0,00 |
0,00 |
0,00 |
|
|
3. Creditors from financial leasing:
32330 |
0,00 |
0,00 |
0,00 |
0,00 |
0,00 |
|
|
4. Derivatives : 32340 |
0,00 |
0,00 |
0,00 |
0,00 |
0,00 |
|
|
5. Other financial liabilities :
32350 |
8.000,00 |
199.000,00 |
23.000,00 |
34.000,00 |
0,00 |
|
|
IV. Short-term debts with Group companies and associates:
32400 |
930.000,00 |
871.000,00 |
5.339.000,00 |
3.719.000,00 |
1.126.992,00 |
|
|
V. Trade creditors and other accounts payable: 32500 |
4.970.000,00 |
3.881.000,00 |
4.879.000,00 |
4.990.000,00 |
5.277.724,00 |
|
|
1. Suppliers: 32510 |
4.106.000,00 |
2.876.000,00 |
4.044.000,00 |
2.913.000,00 |
3.061.680,00 |
|
|
a) Long-term debts :
32511 |
0,00 |
0,00 |
0,00 |
0,00 |
0,00 |
|
|
b) Short-term debts :
32512 |
4.106.000,00 |
2.876.000,00 |
4.044.000,00 |
2.913.000,00 |
3.061.680,00 |
|
|
2. Suppliers, Group companies and
associates: 32520 |
0,00 |
0,00 |
0,00 |
97.000,00 |
322.354,00 |
|
|
3. Other creditors: 32530 |
0,00 |
0,00 |
0,00 |
0,00 |
955.449,00 |
|
|
4. Personnel (remuneration due):
32540 |
738.000,00 |
890.000,00 |
701.000,00 |
818.000,00 |
821.047,00 |
|
|
5. Liabilities for current tax:
32550 |
0,00 |
0,00 |
0,00 |
0,00 |
0,00 |
|
|
6. Other accounts payable to Public
Administrations.: 32560 |
126.000,00 |
115.000,00 |
134.000,00 |
1.162.000,00 |
117.194,00 |
|
|
7. Advances from clients: 32570 |
0,00 |
0,00 |
0,00 |
0,00 |
0,00 |
|
|
VI. Short-term accruals: 32600 |
1.000,00 |
3.000,00 |
6.000,00 |
13.000,00 |
0,00 |
|
|
VII. Special short-term debts : 32700 |
0,00 |
0,00 |
0,00 |
0,00 |
0,00 |
|
|
TOTAL
NET WORTH AND LIABILITIES (A + B + C) : 30000 |
25.514.000,00 |
25.433.000,00 |
33.608.000,00 |
34.012.000,00 |
26.913.218,00 |
|
|
|
ORIGINAL |
ORIGINAL |
ORIGINAL |
ORIGINAL |
ORIGINAL |
|
|
Profit
and Loss |
2013 |
2012 |
2011 |
2010 |
2009 |
|
|
1.
Net turnover: 40100 |
27.418.000,00 |
25.852.000,00 |
23.508.000,00 |
22.328.000,00 |
10.665.015,00 |
|
|
a) Sales: 40110 |
27.418.000,00 |
25.852.000,00 |
23.508.000,00 |
22.328.000,00 |
10.665.015,00 |
|
|
b) Rendering of services: 40120 |
0,00 |
0,00 |
0,00 |
0,00 |
0,00 |
|
|
c) Income of financial nature of holding companies: 40130 |
0,00 |
0,00 |
0,00 |
0,00 |
0,00 |
|
|
2.
Changes in stocks of finished goods and work in progress: 40200 |
321.000,00 |
-1.643.000,00 |
1.060.000,00 |
-1.120.000,00 |
1.550.189,00 |
|
|
3.
Works carried out by the company for its assets: 40300 |
173.000,00 |
121.000,00 |
177.000,00 |
201.000,00 |
0,00 |
|
|
4.
Supplies : 40400 |
-14.125.000,00 |
-16.472.000,00 |
-15.838.000,00 |
-13.230.000,00 |
-6.879.200,00 |
|
|
a) Stock consumption: 40410 |
0,00 |
0,00 |
0,00 |
0,00 |
-6.879.200,00 |
|
|
b) Consumption of raw materials and miscellaneous consumable
ones: 40420 |
-14.769.000,00 |
-16.570.000,00 |
-15.609.000,00 |
-12.928.000,00 |
0,00 |
|
|
c) Works carried out by other companies: 40430 |
0,00 |
0,00 |
0,00 |
0,00 |
0,00 |
|
|
d) Impairment of stock, primary material and other supplies:
40440 |
644.000,00 |
98.000,00 |
-229.000,00 |
-302.000,00 |
0,00 |
|
|
5.
Other operating income: 40500 |
960.000,00 |
328.000,00 |
245.000,00 |
148.000,00 |
0,00 |
|
|
a) Auxiliary income and other from current management:
40510 |
887.000,00 |
206.000,00 |
245.000,00 |
148.000,00 |
0,00 |
|
|
b) Operation subsidies included in the Period's
result: 40520 |
73.000,00 |
122.000,00 |
0,00 |
0,00 |
0,00 |
|
|
6.
Personnel costs: 40600 |
-4.209.000,00 |
-4.510.000,00 |
-4.190.000,00 |
-4.311.000,00 |
-1.871.408,00 |
|
|
a) Wages, salaries et al.: 40610 |
-3.249.000,00 |
-3.601.000,00 |
-3.263.000,00 |
-3.306.000,00 |
-1.500.493,00 |
|
|
b) Social security costs: 40620 |
-960.000,00 |
-909.000,00 |
-927.000,00 |
-1.005.000,00 |
-370.916,00 |
|
|
c) Provisions : 40630 |
0,00 |
0,00 |
0,00 |
0,00 |
0,00 |
|
|
7.
Other operating costs: 40700 |
-6.216.000,00 |
-5.269.000,00 |
-5.265.000,00 |
-3.986.000,00 |
-1.822.314,00 |
|
|
a) External services: 40710 |
-5.774.000,00 |
-4.674.000,00 |
-5.098.000,00 |
-3.885.000,00 |
0,00 |
|
|
b) Taxes: 40720 |
-169.000,00 |
-103.000,00 |
-160.000,00 |
-98.000,00 |
-13.583,00 |
|
|
c) Losses, impairments and variation in provisions from trade
operations : 40730 |
-11.000,00 |
-407.000,00 |
0,00 |
0,00 |
0,00 |
|
|
d) Other current management expenditure : 40740 |
-262.000,00 |
-85.000,00 |
-7.000,00 |
-3.000,00 |
-1.808.731,00 |
|
|
e) Expenses due to greenhouse gas emissions: 40750 |
0,00 |
0,00 |
0,00 |
0,00 |
0,00 |
|
|
8.
Amortisation of fixed assets: 40800 |
-804.000,00 |
-678.000,00 |
-567.000,00 |
-562.000,00 |
-286.675,00 |
|
|
9.
Allocation of subsidies of non-financial fixed assets and other: 40900 |
0,00 |
0,00 |
0,00 |
0,00 |
0,00 |
|
|
10.
Excess provisions : 41000 |
6.000,00 |
13.000,00 |
137.000,00 |
88.000,00 |
0,00 |
|
|
11.
Impairment and result of transfers of fixed assets: 41100 |
-4.000,00 |
-57.000,00 |
0,00 |
8.851.000,00 |
0,00 |
|
|
a) Impairment and losses : 41110 |
-4.000,00 |
-57.000,00 |
0,00 |
0,00 |
0,00 |
|
|
b) Results for transfers and other : 41120 |
0,00 |
0,00 |
0,00 |
8.851.000,00 |
0,00 |
|
|
c) Impairment and profit due to disposals of assets of holding
companies: 41130 |
0,00 |
0,00 |
0,00 |
0,00 |
0,00 |
|
|
12.
Negative difference in combined businesses: 41200 |
0,00 |
0,00 |
0,00 |
0,00 |
0,00 |
|
|
13.
Other results : 41300 |
-183.000,00 |
7.804.000,00 |
23.000,00 |
0,00 |
120.795,00 |
|
|
A.1)
OPERATING INCOME (1 + 2 + 3 + 4 + 5 + 6 + 7 + 8 + 9 + 10 + 11 + 12 + 13) :
49100 |
3.337.000,00 |
5.489.000,00 |
-710.000,00 |
8.407.000,00 |
1.476.402,00 |
|
|
14.
Financial income : 41400 |
340.000,00 |
377.000,00 |
884.000,00 |
1.153.000,00 |
694.675,00 |
|
|
a) Of shares in equity instruments : 41410 |
340.000,00 |
377.000,00 |
884.000,00 |
1.153.000,00 |
694.675,00 |
|
|
a 1) In Group companies and associates:
41411 |
331.000,00 |
369.000,00 |
884.000,00 |
1.153.000,00 |
415.907,00 |
|
|
a 2) In third parties: 41412 |
9.000,00 |
8.000,00 |
0,00 |
0,00 |
278.769,00 |
|
|
b) From negotiable securities and other financial instruments :
41420 |
0,00 |
0,00 |
0,00 |
0,00 |
0,00 |
|
|
b 1) From Group companies and associates :
41421 |
0,00 |
0,00 |
0,00 |
0,00 |
0,00 |
|
|
b 2) From third parties : 41422 |
0,00 |
0,00 |
0,00 |
0,00 |
0,00 |
|
|
c) Allocation of financial subsidies, donations and legacies :
41430 |
0,00 |
0,00 |
0,00 |
0,00 |
0,00 |
|
|
15.
Financial expenditure: 41500 |
-235.000,00 |
-212.000,00 |
-264.000,00 |
-98.000,00 |
-491.851,00 |
|
|
a) Amounts owed to Group companies and associates : 41510 |
-4.000,00 |
-42.000,00 |
-214.000,00 |
-74.000,00 |
-204.303,00 |
|
|
b) For debts with third parties : 41520 |
-231.000,00 |
-170.000,00 |
-50.000,00 |
-24.000,00 |
-287.548,00 |
|
|
c) Stock renewal : 41530 |
0,00 |
0,00 |
0,00 |
0,00 |
0,00 |
|
|
16.
Changes in fair value of financial instruments : 41600 |
0,00 |
0,00 |
0,00 |
0,00 |
0,00 |
|
|
a) Trading book and other : 41610 |
0,00 |
0,00 |
0,00 |
0,00 |
0,00 |
|
|
b) Allocation of financial assets held for sale to the result
for the period: 41620 |
0,00 |
0,00 |
0,00 |
0,00 |
0,00 |
|
|
17.
Exchange rate differences : 41700 |
-309.000,00 |
-266.000,00 |
-173.000,00 |
482.000,00 |
0,00 |
|
|
18.
Impairment and result for transfers of financial instruments: 41800 |
0,00 |
0,00 |
-260.000,00 |
44.000,00 |
276.550,00 |
|
|
a) Impairment and losses : 41810 |
0,00 |
0,00 |
-260.000,00 |
44.000,00 |
276.550,00 |
|
|
b) Results for transfers and other : 41820 |
0,00 |
0,00 |
0,00 |
0,00 |
0,00 |
|
|
19.
Other financial income and expenditure: 42100 |
0,00 |
0,00 |
0,00 |
0,00 |
0,00 |
|
|
a) Incorporation of financial expenditure to assets:
42110 |
0,00 |
0,00 |
0,00 |
0,00 |
0,00 |
|
|
b) Financial income from arrangement with creditors:
42120 |
0,00 |
0,00 |
0,00 |
0,00 |
0,00 |
|
|
c) Other income and expenditure: 42130 |
0,00 |
0,00 |
0,00 |
0,00 |
0,00 |
|
|
A.2)
FINANCIAL REVENUE (14+15+16+17+18+19) : 49200 |
-204.000,00 |
-101.000,00 |
187.000,00 |
1.581.000,00 |
479.375,00 |
|
|
A.3)
NET RESULT BEFORE TAXES (A.1+A.2) : 49300 |
3.133.000,00 |
5.388.000,00 |
-523.000,00 |
9.988.000,00 |
1.955.777,00 |
|
|
20.
Income taxes: 41900 |
-940.000,00 |
3.485.000,00 |
-222.000,00 |
-2.714.000,00 |
-618.053,00 |
|
|
A.4)
PROFIT AFTER TAXES (A.3+20) : 49400 |
2.193.000,00 |
8.873.000,00 |
-745.000,00 |
7.274.000,00 |
1.337.724,00 |
|
|
21.
Result of the year coming from interrupted operations : 42000 |
0,00 |
0,00 |
0,00 |
0,00 |
0,00 |
|
|
A.5)
RESULT OF THE PERIOD (A.4+21) : 49500 |
2.193.000,00 |
8.873.000,00 |
-745.000,00 |
7.274.000,00 |
1.337.724,00 |
|
> Normal Balance Sheet under the rules of the 1990 General
Accounting Plan (repealed since 1st January of 2008)
Information corresponding to
the fiscal year 2013 2012 2011 2010 2009 has been
compiled based on the equivalence criteria stipulated in Act JUS/206/2009.
Where the provisions of the Act did not establish relevant equivalence
criteria, Axesor created such criteria using its own methodology. To view
details on the methodology 2013 2012 2011 2010 2009
is taken from information submitted to the TRADE REGISTER.
|
|
EQUIVALENCIA |
EQUIVALENCIA |
EQUIVALENCIA |
EQUIVALENCIA |
EQUIVALENCIA |
|
|
ASSETS |
2013 |
2012 |
2011 |
2010 |
2009 |
|
|
A)
SHAREHOLDERS (PARTNERS) BY UNCALLED SUSCRIBED CAPITAL: |
0,00 |
0,00 |
0,00 |
0,00 |
0,00 |
|
|
B)
FIXED ASSETS: |
12.328.000,00 |
12.852.000,00 |
16.473.000,00 |
15.910.000,00 |
6.389.017,00 |
|
|
I. Formation expenses: |
0,00 |
0,00 |
0,00 |
0,00 |
0,00 |
|
|
II. Intangible fixed assets: |
543.000,00 |
469.000,00 |
423.000,00 |
204.000,00 |
4.581,00 |
|
|
1. Research and development costs: |
456.000,00 |
383.000,00 |
338.000,00 |
201.000,00 |
0,00 |
|
|
2. Concessions, patents, licences,
trademarks et al.: |
0,00 |
0,00 |
0,00 |
0,00 |
0,00 |
|
|
3. Goodwill: |
0,00 |
0,00 |
0,00 |
0,00 |
0,00 |
|
|
4. Key money paid for premises: |
0,00 |
0,00 |
0,00 |
0,00 |
0,00 |
|
|
5. Software: |
8.000,00 |
7.000,00 |
10.000,00 |
3.000,00 |
4.581,00 |
|
|
6. Assets under capital leases: |
0,00 |
0,00 |
0,00 |
0,00 |
0,00 |
|
|
7. Payments on account: |
79.000,00 |
79.000,00 |
75.000,00 |
0,00 |
0,00 |
|
|
8. Provisions: |
0,00 |
0,00 |
0,00 |
0,00 |
0,00 |
|
|
9. Accumulated depreciation: |
0,00 |
0,00 |
0,00 |
0,00 |
0,00 |
|
|
III. Tangible fixed assets: |
4.236.000,00 |
4.260.000,00 |
3.649.000,00 |
3.119.000,00 |
3.559.969,00 |
|
|
1. Land and construction: |
0,00 |
0,00 |
0,00 |
0,00 |
1.114.030,00 |
|
|
2. Technical installations and machinery:
|
3.232.270,00 |
3.216.601,00 |
2.838.792,00 |
1.889.046,00 |
2.071.209,00 |
|
|
3. Other installations, tools and
furniture: |
464.931,00 |
462.677,00 |
408.333,00 |
271.721,00 |
297.923,00 |
|
|
4. Payments on account and tangible fixed
assets under construction: |
523.000,00 |
565.000,00 |
388.000,00 |
949.000,00 |
66.684,00 |
|
|
5. Other tangible assets: |
15.799,00 |
15.722,00 |
13.875,00 |
9.233,00 |
10.124,00 |
|
|
6. Provisions: |
0,00 |
0,00 |
0,00 |
0,00 |
0,00 |
|
|
7. Accumulated depreciation: |
0,00 |
0,00 |
0,00 |
0,00 |
0,00 |
|
|
IV. Financial investments: |
7.549.000,00 |
8.123.000,00 |
12.401.000,00 |
12.587.000,00 |
2.824.466,00 |
|
|
1. Equity investments in group companies:
|
0,00 |
0,00 |
3.664.000,00 |
3.386.000,00 |
2.820.837,00 |
|
|
2. Receivables from group companies:
|
7.468.000,00 |
8.044.000,00 |
8.658.000,00 |
9.197.000,00 |
0,00 |
|
|
3. Equity investment in associated
companies: |
0,00 |
0,00 |
0,00 |
0,00 |
0,00 |
|
|
4. Credits to associated companies: |
0,00 |
0,00 |
0,00 |
0,00 |
0,00 |
|
|
5. Long-term securities portfolio: |
0,00 |
0,00 |
0,00 |
0,00 |
0,00 |
|
|
6. Other receivables: |
0,00 |
0,00 |
0,00 |
0,00 |
0,00 |
|
|
7. Long term guarantees and deposits:
|
81.000,00 |
79.000,00 |
79.000,00 |
4.000,00 |
3.629,00 |
|
|
8. Provisions: |
0,00 |
0,00 |
0,00 |
0,00 |
0,00 |
|
|
9. Long-term receivables from public
bodies: |
0,00 |
0,00 |
0,00 |
0,00 |
0,00 |
|
|
V. Own shares: |
0,00 |
0,00 |
0,00 |
0,00 |
0,00 |
|
|
VI. Long-term trade receivables: |
0,00 |
0,00 |
0,00 |
0,00 |
0,00 |
|
|
C)
Deferred expenses: |
0,00 |
0,00 |
0,00 |
0,00 |
0,00 |
|
|
D)
CURRENT ASSETS: |
13.186.000,00 |
12.581.000,00 |
17.135.000,00 |
18.102.000,00 |
20.524.201,00 |
|
|
I. Called-up share capital (not paid): |
0,00 |
0,00 |
0,00 |
0,00 |
0,00 |
|
|
II. Stocks: |
4.425.000,00 |
3.784.000,00 |
4.605.000,00 |
4.572.000,00 |
9.036.636,00 |
|
|
1. Goods for resale: |
0,00 |
0,00 |
0,00 |
0,00 |
0,00 |
|
|
2. Raw materials and other consumables:
|
1.336.000,00 |
1.655.000,00 |
936.000,00 |
1.734.000,00 |
3.833.121,00 |
|
|
3. Goods in process and semifinished ones:
|
390.000,00 |
332.000,00 |
313.000,00 |
3.000,00 |
0,00 |
|
|
4. Finished products: |
2.699.000,00 |
1.792.000,00 |
3.356.000,00 |
2.835.000,00 |
5.203.515,00 |
|
|
5. Byproducts, scrap and recovered
materials: |
0,00 |
0,00 |
0,00 |
0,00 |
0,00 |
|
|
6. Payments on account: |
0,00 |
5.000,00 |
0,00 |
0,00 |
0,00 |
|
|
7. Provisions: |
0,00 |
0,00 |
0,00 |
0,00 |
0,00 |
|
|
III. Debtors: |
5.289.000,00 |
6.576.000,00 |
8.509.000,00 |
8.641.000,00 |
9.420.767,00 |
|
|
1. Trade debtors / accounts receivable:
|
4.413.000,00 |
4.751.000,00 |
3.080.000,00 |
4.765.000,00 |
4.631.807,00 |
|
|
2. Accounts receivable, Group companies:
|
0,00 |
0,00 |
2.693.497,00 |
2.527.624,00 |
1.778.299,00 |
|
|
3. Accounts receivable, associated
companies: |
0,00 |
0,00 |
99.503,00 |
93.376,00 |
65.694,00 |
|
|
4. Other debtors: |
5.000,00 |
39.000,00 |
5.000,00 |
5.000,00 |
98.801,00 |
|
|
5. Staff: |
9.000,00 |
10.000,00 |
19.000,00 |
36.000,00 |
35.906,00 |
|
|
6. Public bodies: |
862.000,00 |
1.776.000,00 |
2.612.000,00 |
1.214.000,00 |
2.810.261,00 |
|
|
7. Provisions: |
0,00 |
0,00 |
0,00 |
0,00 |
0,00 |
|
|
IV. Short-term investments: |
1.447.000,00 |
1.422.000,00 |
3.526.000,00 |
4.502.000,00 |
0,00 |
|
|
1. Equity investments in group companies:
|
0,00 |
0,00 |
0,00 |
0,00 |
0,00 |
|
|
2. Receivables from group companies:
|
1.447.000,00 |
1.422.000,00 |
3.526.000,00 |
4.502.000,00 |
0,00 |
|
|
3. Equity investment in associated
companies: |
0,00 |
0,00 |
0,00 |
0,00 |
0,00 |
|
|
4. Credits to associated companies: |
0,00 |
0,00 |
0,00 |
0,00 |
0,00 |
|
|
5. Short term securities portfolio: |
0,00 |
0,00 |
0,00 |
0,00 |
0,00 |
|
|
6. Other receivables: |
0,00 |
0,00 |
0,00 |
0,00 |
0,00 |
|
|
7. Shor term guarantees and deposits:
|
0,00 |
0,00 |
0,00 |
0,00 |
0,00 |
|
|
8. Provisions: |
0,00 |
0,00 |
0,00 |
0,00 |
0,00 |
|
|
V. Short-term treasury shares: |
0,00 |
0,00 |
0,00 |
0,00 |
0,00 |
|
|
VI. Cash at bank and in hand: |
1.957.000,00 |
766.000,00 |
458.000,00 |
350.000,00 |
2.028.410,00 |
|
|
VII. Prepayments and accrued income: |
68.000,00 |
33.000,00 |
37.000,00 |
37.000,00 |
38.388,00 |
|
|
GENERAL
TOTAL (A + B + C + D): |
25.514.000,00 |
25.433.000,00 |
33.608.000,00 |
34.012.000,00 |
26.913.218,00 |
|
MERCANTILE REGISTRY.
|
|
EQUIVALENCIA |
EQUIVALENCIA |
EQUIVALENCIA |
EQUIVALENCIA |
EQUIVALENCIA |
|
|
LIABILITIES |
2013 |
2012 |
2011 |
2010 |
2009 |
|
|
A)
EQUITY: |
16.089.000,00 |
15.453.300,00 |
20.104.000,00 |
23.180.000,00 |
15.777.326,00 |
|
|
I. Subscribed capital: |
6.397.000,00 |
6.397.000,00 |
6.397.000,00 |
6.397.000,00 |
6.397.345,00 |
|
|
II. Share premium: |
461.000,00 |
461.000,00 |
461.000,00 |
461.000,00 |
460.503,00 |
|
|
III. Revaluation reserves: |
0,00 |
0,00 |
0,00 |
0,00 |
0,00 |
|
|
IV. Reserves: |
8.598.000,00 |
7.722.300,00 |
13.991.000,00 |
10.048.000,00 |
7.581.755,00 |
|
|
1. Legal reserve: |
1.280.000,00 |
1.280.000,00 |
1.280.000,00 |
1.280.000,00 |
1.279.469,00 |
|
|
2. Reserves for own shares: |
0,00 |
0,00 |
0,00 |
0,00 |
0,00 |
|
|
3. Reserves for shares of the controlling
company: |
0,00 |
0,00 |
0,00 |
0,00 |
0,00 |
|
|
4. Statutory reserves: |
0,00 |
0,00 |
0,00 |
0,00 |
0,00 |
|
|
5. Miscellaneous reserves: |
7.318.000,00 |
6.442.300,00 |
12.711.000,00 |
8.768.000,00 |
6.302.286,00 |
|
|
Differences due to capital adjustement to euros:
|
0,00 |
0,00 |
0,00 |
0,00 |
0,00 |
|
|
V. Profit or loss brought forward: |
0,00 |
0,00 |
0,00 |
0,00 |
0,00 |
|
|
1. Retained earnings: |
0,00 |
0,00 |
0,00 |
0,00 |
0,00 |
|
|
2. Prior year losses: |
0,00 |
0,00 |
0,00 |
0,00 |
0,00 |
|
|
3. Partners' contributions so as
to compensate losses: |
0,00 |
0,00 |
0,00 |
0,00 |
0,00 |
|
|
VI. Profit or loss for the financial year: |
2.193.000,00 |
8.873.000,00 |
-745.000,00 |
7.274.000,00 |
1.337.724,00 |
|
|
VII. Interim dividend paid: |
-1.560.000,00 |
-8.000.000,00 |
0,00 |
-1.000.000,00 |
0,00 |
|
|
VIII. Own shares for capital reduction: |
0,00 |
0,00 |
0,00 |
0,00 |
0,00 |
|
|
B)
Deferred income: |
126.000,00 |
119.700,00 |
161.000,00 |
0,00 |
169.794,00 |
|
|
1. Capital grants: |
126.000,00 |
119.700,00 |
161.000,00 |
0,00 |
169.794,00 |
|
|
2. Unrealised exchange gains: |
0,00 |
0,00 |
0,00 |
0,00 |
0,00 |
|
|
3. Other deferred income: |
0,00 |
0,00 |
0,00 |
0,00 |
0,00 |
|
|
4. Public revenues to distribute in
several financial years: |
0,00 |
0,00 |
0,00 |
0,00 |
0,00 |
|
|
C)
PROVISIONS FOR LIABILITIES AND CHARGES: |
358.000,00 |
101.000,00 |
120.000,00 |
208.000,00 |
3.335.744,00 |
|
|
1. Provisions for pension fund and other
similar obligations: |
97.000,00 |
101.000,00 |
120.000,00 |
208.000,00 |
0,00 |
|
|
2. Provisions for taxes: |
0,00 |
0,00 |
0,00 |
0,00 |
0,00 |
|
|
3. Other provisions: |
261.000,00 |
0,00 |
0,00 |
0,00 |
3.335.744,00 |
|
|
4. Reversion fund: |
0,00 |
0,00 |
0,00 |
0,00 |
0,00 |
|
|
D)
LONG TERM LIABILITIES: |
1.850.000,00 |
1.145.000,00 |
939.000,00 |
630.000,00 |
0,00 |
|
|
I. Issued debentures and other marketable securities: |
0,00 |
0,00 |
0,00 |
0,00 |
0,00 |
|
|
1. Non-convertible debentures: |
0,00 |
0,00 |
0,00 |
0,00 |
0,00 |
|
|
2. Convertible debentures: |
0,00 |
0,00 |
0,00 |
0,00 |
0,00 |
|
|
3. Other debt securities: |
0,00 |
0,00 |
0,00 |
0,00 |
0,00 |
|
|
II. Amounts owed to credit institutions: |
0,00 |
0,00 |
0,00 |
0,00 |
0,00 |
|
|
1. Loans and other liabilities: |
0,00 |
0,00 |
0,00 |
0,00 |
0,00 |
|
|
2. Long-term liabilities from capital
leases: |
0,00 |
0,00 |
0,00 |
0,00 |
0,00 |
|
|
III. Debts with companies of the group and affiliated ones:
|
0,00 |
0,00 |
0,00 |
0,00 |
0,00 |
|
|
1. Amounts owed to group companies: |
0,00 |
0,00 |
0,00 |
0,00 |
0,00 |
|
|
2. Amounts owed to associated companies:
|
0,00 |
0,00 |
0,00 |
0,00 |
0,00 |
|
|
IV. Other creditors: |
1.850.000,00 |
1.145.000,00 |
939.000,00 |
630.000,00 |
0,00 |
|
|
1. Long-term bills of exchange payable:
|
0,00 |
0,00 |
0,00 |
0,00 |
0,00 |
|
|
2. Other creditors: |
1.773.000,00 |
1.072.000,00 |
840.000,00 |
630.000,00 |
0,00 |
|
|
3. Long term guarantees and deposits
received: |
0,00 |
0,00 |
0,00 |
0,00 |
0,00 |
|
|
4. Long term payables to public bodies:
|
77.000,00 |
73.000,00 |
99.000,00 |
0,00 |
0,00 |
|
|
V. Unpaid portion of equity investment: |
0,00 |
0,00 |
0,00 |
0,00 |
0,00 |
|
|
1. Group companies: |
0,00 |
0,00 |
0,00 |
0,00 |
0,00 |
|
|
2. Associated companies: |
0,00 |
0,00 |
0,00 |
0,00 |
0,00 |
|
|
3. Third parties: |
0,00 |
0,00 |
0,00 |
0,00 |
0,00 |
|
|
VI. Long term trade creditors: |
0,00 |
0,00 |
0,00 |
0,00 |
0,00 |
|
|
E)
SHORT TERM CREDITORS: |
6.920.000,00 |
5.536.000,00 |
10.247.000,00 |
8.756.000,00 |
6.404.715,00 |
|
|
I. Issued debentures and other marketable securities: |
0,00 |
0,00 |
0,00 |
0,00 |
0,00 |
|
|
1. Non-convertible debentures: |
0,00 |
0,00 |
0,00 |
0,00 |
0,00 |
|
|
2. Convertible debentures: |
0,00 |
0,00 |
0,00 |
0,00 |
0,00 |
|
|
3. Other debt securities: |
0,00 |
0,00 |
0,00 |
0,00 |
0,00 |
|
|
4. Accrued interest on debentures and
other debt securities: |
0,00 |
0,00 |
0,00 |
0,00 |
0,00 |
|
|
II. Amounts owed to credit institutions: |
1.011.000,00 |
582.000,00 |
0,00 |
0,00 |
0,00 |
|
|
1. Loans and other liabilities: |
1.011.000,00 |
582.000,00 |
0,00 |
0,00 |
0,00 |
|
|
2. Accrued interest on liabilities with
credit institutions: |
0,00 |
0,00 |
0,00 |
0,00 |
0,00 |
|
|
3. Short-term liabilities from capital
leases: |
0,00 |
0,00 |
0,00 |
0,00 |
0,00 |
|
|
III. Short-term amounts owed to group and associated companies:
|
930.000,00 |
871.000,00 |
5.339.000,00 |
3.816.000,00 |
1.449.346,00 |
|
|
1. Amounts owed to group companies: |
930.000,00 |
871.000,00 |
5.339.000,00 |
3.816.000,00 |
1.449.346,00 |
|
|
2. Amounts owed to associated companies:
|
0,00 |
0,00 |
0,00 |
0,00 |
0,00 |
|
|
IV. Trade creditors: |
4.106.000,00 |
2.876.000,00 |
4.044.000,00 |
2.913.000,00 |
4.017.129,00 |
|
|
1. Advanced payments from customers:
|
0,00 |
0,00 |
0,00 |
0,00 |
0,00 |
|
|
2. Amounts owed for purchases of goods or
services: |
4.106.000,00 |
2.876.000,00 |
4.044.000,00 |
2.913.000,00 |
4.017.129,00 |
|
|
3. Debts represented by notes payable:
|
0,00 |
0,00 |
0,00 |
0,00 |
0,00 |
|
|
V. Other creditors: |
872.000,00 |
1.204.000,00 |
858.000,00 |
2.014.000,00 |
938.241,00 |
|
|
1. Public bodies: |
126.000,00 |
115.000,00 |
134.000,00 |
1.162.000,00 |
117.194,00 |
|
|
2. Bills of exchange payable: |
0,00 |
0,00 |
0,00 |
0,00 |
0,00 |
|
|
3. Miscellaneous debts: |
8.000,00 |
199.000,00 |
23.000,00 |
34.000,00 |
0,00 |
|
|
4. Wages and salaries payable: |
738.000,00 |
890.000,00 |
701.000,00 |
818.000,00 |
821.047,00 |
|
|
5. Guarantees and deposits received at
short term: |
0,00 |
0,00 |
0,00 |
0,00 |
0,00 |
|
|
VI. Provisions: |
0,00 |
0,00 |
0,00 |
0,00 |
0,00 |
|
|
VII. Prepayments and accrued income: |
1.000,00 |
3.000,00 |
6.000,00 |
13.000,00 |
0,00 |
|
|
F)
SHORT-TERM PROVISIONS FOR LIABILITIES AND CHARGES: |
171.000,00 |
3.078.000,00 |
2.037.000,00 |
1.238.000,00 |
1.225.638,00 |
|
|
GENERAL
TOTAL (A + B + C + D + E + F): |
25.514.000,00 |
25.433.000,00 |
33.608.000,00 |
34.012.000,00 |
26.913.218,00 |
|
MERCANTILE REGISTRY.
|
|
EQUIVALENCIA |
EQUIVALENCIA |
EQUIVALENCIA |
EQUIVALENCIA |
EQUIVALENCIA |
|
|
DEBIT |
2013 |
2012 |
2011 |
2010 |
2009 |
|
|
A)
CHARGES (A.1 to A.15): |
27.025.000,00 |
25.622.000,00 |
26.779.000,00 |
25.977.000,00 |
11.692.951,00 |
|
|
A.1. Stock reduction of both manufactured
goods and the ones in process: |
0,00 |
1.643.000,00 |
0,00 |
1.120.000,00 |
0,00 |
|
|
A.2. Supplies: |
14.769.000,00 |
16.570.000,00 |
15.609.000,00 |
12.928.000,00 |
6.879.200,00 |
|
|
a) Stock consumption:
|
0,00 |
0,00 |
0,00 |
0,00 |
6.879.200,00 |
|
|
b) Consumption of raw
materials and miscellaneous consumable ones: |
14.769.000,00 |
16.570.000,00 |
15.609.000,00 |
12.928.000,00 |
0,00 |
|
|
c) Miscellaneous
external expenditure: |
0,00 |
0,00 |
0,00 |
0,00 |
0,00 |
|
|
A.3. Staff costs: |
4.209.000,00 |
4.510.000,00 |
4.190.000,00 |
4.311.000,00 |
1.871.408,00 |
|
|
a) Wages, salaries et
al.: |
3.249.000,00 |
3.601.000,00 |
3.263.000,00 |
3.306.000,00 |
1.500.493,00 |
|
|
b) Social security
costs: |
960.000,00 |
909.000,00 |
927.000,00 |
1.005.000,00 |
370.916,00 |
|
|
A.4. Depreciation expense: |
804.000,00 |
678.000,00 |
567.000,00 |
562.000,00 |
286.675,00 |
|
|
A.5. Variation of trade provisions and
losses of unrecovered receivables: |
-633.000,00 |
309.000,00 |
229.000,00 |
302.000,00 |
0,00 |
|
|
a) Stock provision
variation: |
-644.000,00 |
-98.000,00 |
229.000,00 |
302.000,00 |
0,00 |
|
|
b) Variation in
provision and bad debt losses: |
0,00 |
0,00 |
0,00 |
0,00 |
0,00 |
|
|
c) Variation of other
trade provisions: |
11.000,00 |
407.000,00 |
0,00 |
0,00 |
0,00 |
|
|
A.6. Other operating charges: |
6.205.000,00 |
4.862.000,00 |
5.265.000,00 |
3.986.000,00 |
1.822.314,00 |
|
|
a) External services:
|
5.774.000,00 |
4.674.000,00 |
5.098.000,00 |
3.885.000,00 |
0,00 |
|
|
b) Taxes: |
169.000,00 |
103.000,00 |
160.000,00 |
98.000,00 |
13.583,00 |
|
|
c) Other operating
expenses: |
262.000,00 |
85.000,00 |
7.000,00 |
3.000,00 |
1.808.731,00 |
|
|
d) Allocation to
revision fund: |
0,00 |
0,00 |
0,00 |
0,00 |
0,00 |
|
|
A.I. OPERATING BENEFITS
(B.1+B.2+B.3+B.4-A.1-A.2-A.3-A.4-A.5-A.6): |
3.524.000,00 |
0,00 |
0,00 |
0,00 |
1.355.606,00 |
|
|
A.7. Financial and similar charges: |
235.000,00 |
212.000,00 |
264.000,00 |
98.000,00 |
491.851,00 |
|
|
a) Due to liabilities
with companies of the group: |
4.000,00 |
42.000,00 |
214.000,00 |
74.000,00 |
204.303,00 |
|
|
b) Due to liabilities
with associated companies: |
0,00 |
0,00 |
0,00 |
0,00 |
0,00 |
|
|
c) Due to other
debts.: |
231.000,00 |
170.000,00 |
50.000,00 |
24.000,00 |
287.548,00 |
|
|
d) Losses from
financial investments: |
0,00 |
0,00 |
0,00 |
0,00 |
0,00 |
|
|
A.8. Changes in financial investment
provisions: |
0,00 |
0,00 |
260.000,00 |
-44.000,00 |
-276.550,00 |
|
|
A.9. Exchange losses: |
309.000,00 |
266.000,00 |
173.000,00 |
0,00 |
0,00 |
|
|
A.II. NET FINANCIAL INCOME (B.5+B.6+B.7+B.8-A.7-A.8-A.9):
|
0,00 |
0,00 |
187.000,00 |
1.581.000,00 |
479.375,00 |
|
|
A.III. PROFIT FROM ORDINARY ACTIVITIES (A.I+A.II-B.I-B.II):
|
3.320.000,00 |
0,00 |
0,00 |
1.137.000,00 |
1.834.982,00 |
|
|
A.10. Changes in provisions for
intangible, tangible and securities portfolio: |
4.000,00 |
57.000,00 |
0,00 |
0,00 |
0,00 |
|
|
A.11. Losses from tangible and intangible
fixed assets and securities portfolio: |
0,00 |
0,00 |
0,00 |
0,00 |
0,00 |
|
|
A.12. Losses from transactions with own shares
and debentures: |
0,00 |
0,00 |
0,00 |
0,00 |
0,00 |
|
|
A.13. Extraordinary expenses: |
183.000,00 |
0,00 |
0,00 |
0,00 |
0,00 |
|
|
A.14. Expenses and losses of former
financial years: |
0,00 |
0,00 |
0,00 |
0,00 |
0,00 |
|
|
A.IV. EXTRAORDINARY PROFIT
(B.9+B.10+B.11+B.12+B.13-A.10-A.11-A.12-A.13-A.14): |
0,00 |
7.747.000,00 |
23.000,00 |
8.851.000,00 |
120.795,00 |
|
|
A.V. PROFIT BEFORE TAXES (A.III+A.IV-B.III-B.IV): |
3.133.000,00 |
5.388.000,00 |
0,00 |
9.988.000,00 |
1.955.777,00 |
|
|
A.15. Corporation tax: |
940.000,00 |
-3.485.000,00 |
222.000,00 |
2.714.000,00 |
618.053,00 |
|
|
A.16. Miscellaneous taxes: |
0,00 |
0,00 |
0,00 |
0,00 |
0,00 |
|
|
A.VI. FINANCIAL YEAR RESULTS (PROFIT) (A.V-A.15-A.16): |
2.193.000,00 |
8.873.000,00 |
0,00 |
7.274.000,00 |
1.337.724,00 |
|
MERCANTILE REGISTRY.
|
|
EQUIVALENCIA |
EQUIVALENCIA |
EQUIVALENCIA |
EQUIVALENCIA |
EQUIVALENCIA |
|
|
CREDIT |
2013 |
2012 |
2011 |
2010 |
2009 |
|
|
B)
INCOME ( B.1 to B.13): |
29.218.000,00 |
34.495.000,00 |
26.034.000,00 |
33.251.000,00 |
13.030.675,00 |
|
|
B.1. Net total sales: |
27.418.000,00 |
25.852.000,00 |
23.508.000,00 |
22.328.000,00 |
10.665.015,00 |
|
|
a) Sales: |
28.050.485,00 |
26.448.360,00 |
24.050.289,00 |
22.843.068,00 |
10.911.039,00 |
|
|
b) Rendering of
services: |
0,00 |
0,00 |
0,00 |
0,00 |
0,00 |
|
|
Returns and Rappel on
sales: |
-632.485,00 |
-596.360,00 |
-542.289,00 |
-515.068,00 |
-246.023,00 |
|
|
B.2. Stock increase of manufactured goods
and products in process: |
321.000,00 |
0,00 |
1.060.000,00 |
0,00 |
1.550.189,00 |
|
|
B.3. Works performed by the company for
fixed assets: |
173.000,00 |
121.000,00 |
177.000,00 |
201.000,00 |
0,00 |
|
|
B.4. Miscellaneous operating income:
|
966.000,00 |
341.000,00 |
382.000,00 |
236.000,00 |
0,00 |
|
|
a) Auxiliary income
and other from current management: |
887.000,00 |
206.000,00 |
245.000,00 |
148.000,00 |
0,00 |
|
|
b) Grants: |
73.000,00 |
122.000,00 |
0,00 |
0,00 |
0,00 |
|
|
c) Liabilities and
charges provisions surplus: |
6.000,00 |
13.000,00 |
137.000,00 |
88.000,00 |
0,00 |
|
|
B.I. PÉRDIDAS DE EXPLOTACIÓN (A.1+A.2+A.3+A.4+A.5-A.6-B.1-B.2-B.3-B.4):
|
0,00 |
2.258.000,00 |
733.000,00 |
444.000,00 |
0,00 |
|
|
B.5. Income from equity investment: |
340.000,00 |
377.000,00 |
884.000,00 |
1.153.000,00 |
694.675,00 |
|
|
a) In companies of
the group: |
331.000,00 |
369.000,00 |
884.000,00 |
1.153.000,00 |
415.907,00 |
|
|
b) In associated
companies: |
0,00 |
0,00 |
0,00 |
0,00 |
0,00 |
|
|
c) Third parties:
|
9.000,00 |
8.000,00 |
0,00 |
0,00 |
278.769,00 |
|
|
B.6. Income from other marketable
securities and long-term receivables: |
0,00 |
0,00 |
0,00 |
0,00 |
0,00 |
|
|
a) From companies of
the group: |
0,00 |
0,00 |
0,00 |
0,00 |
0,00 |
|
|
b) From associated
companies: |
0,00 |
0,00 |
0,00 |
0,00 |
0,00 |
|
|
c) From companies out
of the group: |
0,00 |
0,00 |
0,00 |
0,00 |
0,00 |
|
|
B.7. Miscellaneous interests or similar
income: |
0,00 |
0,00 |
0,00 |
0,00 |
0,00 |
|
|
a) From companies of
the group: |
0,00 |
0,00 |
0,00 |
0,00 |
0,00 |
|
|
b) From associated
companies: |
0,00 |
0,00 |
0,00 |
0,00 |
0,00 |
|
|
c) Miscellaneous
interests: |
0,00 |
0,00 |
0,00 |
0,00 |
0,00 |
|
|
d) Profit on
financial investment: |
0,00 |
0,00 |
0,00 |
0,00 |
0,00 |
|
|
B.8. Exchange positive differences: |
0,00 |
0,00 |
0,00 |
482.000,00 |
0,00 |
|
|
B.II. NEGATIVE FINANCIAL RESULTS (A.7+A.8+A.9-B.5-B.6-B.7-B.8):
|
204.000,00 |
101.000,00 |
0,00 |
0,00 |
0,00 |
|
|
B.III. LOSSES ON ORDINARY ACTIVITIES ( B.I + B.II - A.I - A.II
): |
0,00 |
2.359.000,00 |
546.000,00 |
0,00 |
0,00 |
|
|
B.9.Profit on disposal of both tangible
and intangible fixed assets and securities portfolio: |
0,00 |
0,00 |
0,00 |
8.851.000,00 |
0,00 |
|
|
B.10. Profit on transactions with own
shares and debentures: |
0,00 |
0,00 |
0,00 |
0,00 |
0,00 |
|
|
B.11. Capital grants transferred to profit
and loss: |
0,00 |
0,00 |
0,00 |
0,00 |
0,00 |
|
|
B.12. Extraordinary income: |
0,00 |
7.804.000,00 |
23.000,00 |
0,00 |
120.795,00 |
|
|
B.13. Income and profit of former
financial years: |
0,00 |
0,00 |
0,00 |
0,00 |
0,00 |
|
|
B.IV. NEGATIVE EXTRAORDINARY RESULTS
(A.10+A.11+A.12+A.13+A.14-B.9-B.10-B.11-B.12-B.13): |
187.000,00 |
0,00 |
0,00 |
0,00 |
0,00 |
|
|
B.V. LOSSES BEFORE TAXES (B.III+B.IV-A.III-A.IV): |
0,00 |
0,00 |
523.000,00 |
0,00 |
0,00 |
|
|
B.VI. RESULT OF THE PERIOD (LOSSES) (B.V+A.15+A.16): |
0,00 |
0,00 |
745.000,00 |
0,00 |
0,00 |
|
MERCANTILE REGISTRY.
|
CASHFLOW
STATEMENT
|
|
|
|
|
Model: Normal
>
Source of information: Data contained in this section is taken from the
information declared in the Annual Accounts submitted to the Trade Register.
|
|
2013 |
2012 |
2011 |
2010 |
2009 |
|
|
1.
Fiscal year result before taxes.: 61100 |
3.133.000,00 |
5.388.000,00 |
-523.000,00 |
9.988.000,00 |
1.955.777,00 |
|
|
2.
Results adjustments.: 61200 |
-2.271.000,00 |
2.108.000,00 |
295.000,00 |
-9.878.000,00 |
1.748.233,00 |
|
|
a) Fixed Assets Amortization (+).: 61201 |
804.000,00 |
678.000,00 |
567.000,00 |
562.000,00 |
286.675,00 |
|
|
b) Obsolescence Allowances (+/-). : 61202 |
-633.000,00 |
309.000,00 |
489.000,00 |
258.000,00 |
0,00 |
|
|
c) Variation in Provision (+/-). : 61203 |
-2.650.000,00 |
1.022.000,00 |
-137.000,00 |
-88.000,00 |
1.664.382,00 |
|
|
d) Allocation of grants (-).: 61204 |
0,00 |
0,00 |
0,00 |
-8.872.000,00 |
0,00 |
|
|
e) Results on disposal of fixed assets (+/-). : 61205 |
4.000,00 |
57.000,00 |
0,00 |
0,00 |
0,00 |
|
|
g) Financial income (-).: 61207 |
-340.000,00 |
-377.000,00 |
-884.000,00 |
-1.153.000,00 |
-694.675,00 |
|
|
h) Financial Expenses (+). : 61208 |
235.000,00 |
212.000,00 |
264.000,00 |
98.000,00 |
491.851,00 |
|
|
i) Exchange differences (+/-). : 61209 |
309.000,00 |
266.000,00 |
173.000,00 |
-482.000,00 |
0,00 |
|
|
k) Other income and expense (-/+). : 61211 |
0,00 |
-59.000,00 |
-177.000,00 |
-201.000,00 |
0,00 |
|
|
3.
Changes in current capital equity.: 61300 |
1.303.000,00 |
1.167.000,00 |
728.000,00 |
-96.000,00 |
-1.304.648,00 |
|
|
a) Stock (+/-).: 61301 |
-1.285.000,00 |
723.000,00 |
-262.000,00 |
1.670.000,00 |
-2.808.636,00 |
|
|
d) Debtors and other accounts receivable (+/-). : 61302 |
479.000,00 |
2.468.000,00 |
130.000,00 |
473.000,00 |
-1.011.295,00 |
|
|
c) Other current assets (+/-). : 61303 |
752.000,00 |
-911.000,00 |
978.000,00 |
-3.489.000,00 |
848.612,00 |
|
|
d) Creditors and other accounts payable (+/-). : 61304 |
1.089.000,00 |
-938.000,00 |
-111.000,00 |
1.237.000,00 |
1.669.671,00 |
|
|
e) Other current liabilities (+/-).: 61305 |
268.000,00 |
-88.000,00 |
-7.000,00 |
13.000,00 |
-3.000,00 |
|
|
4.
Other cash flows for operating activities.: 61400 |
105.000,00 |
165.000,00 |
-121.000,00 |
-2.364.000,00 |
202.825,00 |
|
|
a) Interest payments (-). : 61401 |
0,00 |
0,00 |
0,00 |
0,00 |
-491.851,00 |
|
|
b) Dividend payment collection (+). : 61402 |
0,00 |
377.000,00 |
0,00 |
358.000,00 |
0,00 |
|
|
c) Interest collection (+). : 61403 |
340.000,00 |
0,00 |
365.000,00 |
90.000,00 |
694.675,00 |
|
|
d) Income tax payment collection (payments) (+/-).: 61404 |
0,00 |
0,00 |
-222.000,00 |
-2.714.000,00 |
0,00 |
|
|
e) Other payments (payment collection) (-/+) : 61405 |
-235.000,00 |
-212.000,00 |
-264.000,00 |
-98.000,00 |
0,00 |
|
|
5.
Operating activity cash flows (1 + 2 + 3 + 4) : 61500 |
2.270.000,00 |
8.828.000,00 |
379.000,00 |
-2.350.000,00 |
2.602.186,00 |
|
|
6.
Payments for investment (-).: 62100 |
-854.000,00 |
-3.158.000,00 |
-1.390.000,00 |
-1.408.000,00 |
-1.339.837,00 |
|
|
a) Companies of the group and affiliates. : 62101 |
0,00 |
0,00 |
0,00 |
0,00 |
-1.339.837,00 |
|
|
b) Intangible fixed assets. : 62102 |
-854.000,00 |
-1.336.000,00 |
-1.390.000,00 |
-1.408.000,00 |
0,00 |
|
|
g) Business Unit : 62107 |
0,00 |
-1.822.000,00 |
0,00 |
0,00 |
0,00 |
|
|
7.
Divestment payment collection (+). : 62200 |
551.000,00 |
6.382.000,00 |
0,00 |
211.000,00 |
210.348,00 |
|
|
b) Intangible fixed assets. : 62202 |
0,00 |
0,00 |
0,00 |
211.000,00 |
419,00 |
|
|
c) Fixed assets. : 62203 |
0,00 |
0,00 |
0,00 |
0,00 |
180.031,00 |
|
|
e) Other financial assets. : 62205 |
0,00 |
6.382.000,00 |
0,00 |
0,00 |
371,00 |
|
|
h) Other assets. : 62208 |
551.000,00 |
0,00 |
0,00 |
0,00 |
29.528,00 |
|
|
8.
Investment activity cash flows (6 + 7) minus Amortization: 62300 |
-303.000,00 |
3.224.000,00 |
-1.390.000,00 |
-1.197.000,00 |
-1.416.164,00 |
|
|
9.
Payment collection and payments for equity instruments. : 63100 |
0,00 |
0,00 |
0,00 |
0,00 |
-2.643.604,00 |
|
|
b) Amortization of assets instruments (-). : 63102 |
0,00 |
0,00 |
0,00 |
0,00 |
-2.886.167,00 |
|
|
e) Grants, donations and bequests received (+). : 63105 |
0,00 |
0,00 |
0,00 |
0,00 |
242.563,00 |
|
|
10.
Payment collection and payments for financial liabilities instruments.:
63200 |
785.000,00 |
-3.478.000,00 |
1.830.000,00 |
3.216.000,00 |
279.992,00 |
|
|
a) Issuance : 63201 |
939.000,00 |
990.000,00 |
1.830.000,00 |
3.216.000,00 |
-243.000,00 |
|
|
2. Debts incurred with credit institutions (+). : 63203 |
939.000,00 |
990.000,00 |
1.830.000,00 |
3.216.000,00 |
0,00 |
|
|
5. Other debts (+). : 63206 |
0,00 |
0,00 |
0,00 |
0,00 |
-243.000,00 |
|
|
b) Repayment and amortization of : 63207 |
-154.000,00 |
-4.468.000,00 |
0,00 |
0,00 |
522.992,00 |
|
|
3. Debts incurred with companies of the group and affiliates
(-). : 63210 |
-154.000,00 |
-4.468.000,00 |
0,00 |
0,00 |
522.992,00 |
|
|
11.
Payments from dividends and remunerations from other assets instruments. :
63300 |
-1.560.000,00 |
-8.000.000,00 |
-538.000,00 |
-924.000,00 |
2.890.000,00 |
|
|
a) Dividends (-).: 63301 |
-1.560.000,00 |
-8.000.000,00 |
0,00 |
0,00 |
2.890.000,00 |
|
|
b) Remuneration from other assets instruments (-).: 63302 |
0,00 |
0,00 |
-538.000,00 |
-924.000,00 |
0,00 |
|
|
12.
Cash flows for financing activities (9+10+11).: 63400 |
-775.000,00 |
-11.478.000,00 |
1.292.000,00 |
2.292.000,00 |
526.388,00 |
|
|
D)
EFFECT OF EXCHANGE RATE CHANGES: 64000 |
-309.000,00 |
-266.000,00 |
-173.000,00 |
482.000,00 |
0,00 |
|
|
E)
NET INCREASE/DECREASE OF CASH OR EQUIVALENT ASSETS (+/-5+/-8+/12+/-D) :
65000 |
883.000,00 |
308.000,00 |
108.000,00 |
-773.000,00 |
1.712.410,00 |
|
|
Cash or equivalent assets as of beginning of the fiscal year.:
65100 |
766.000,00 |
458.000,00 |
350.000,00 |
1.123.000,00 |
316.000,00 |
|
|
Cash or equivalent assets as of end of the fiscal year.:
65200 |
1.957.000,00 |
766.000,00 |
458.000,00 |
350.000,00 |
2.028.410,00 |
|
|
FINANCIAL
DIAGNOSIS
|
|
|
|
|
> Economic-Financial Comparative Analysis
Data used in the following ratios and indicators is taken from the
Annual Accounts submitted by the company to the TRADE REGISTER.
>
Comparison within the Sector
|
Cash
Flow |
2013 |
2012 |
Variación 2013 - 2012 |
|
|||
|
|
Empresa |
Sector |
Empresa |
Sector |
Empresa |
Sector |
|
|
Cash
Flow over Sales: |
0,04 % |
0,01 % |
0,01 % |
0,01 % |
264,60 % |
109,55 % |
|
|
EBITDA
over Sales: |
15,76 % |
11,37 % |
-6,16 % |
9,02 % |
355,82 % |
26,04 % |
|
|
Cash
Flow Yield: |
0,05 % |
0,01 % |
0,01 % |
0,00 % |
285,47 % |
|
|
|
Profitability |
2013 |
2012 |
Variación 2013 - 2012 |
|
|||
|
|
Empresa |
Sector |
Empresa |
Sector |
Empresa |
Sector |
|
|
Operating
economic profitability: |
21,31 % |
6,91 % |
-14,57 % |
4,94 % |
246,25 % |
39,81 % |
|
|
Total
economic profitability: |
13,20 % |
3,75 % |
22,02 % |
2,31 % |
-40,05 % |
62,51 % |
|
|
Financial
profitability: |
13,68 % |
4,23 % |
57,61 % |
0,82 % |
-76,26 % |
413,51 % |
|
|
Margin:
|
12,33 % |
6,73 % |
-8,80 % |
4,62 % |
240,07 % |
45,55 % |
|
|
Mark-up:
|
11,61 % |
4,48 % |
-9,19 % |
1,22 % |
226,44 % |
265,84 % |
|
|
Solvency |
2013 |
2012 |
Variación 2013 - 2012 |
|
|||
|
|
Empresa |
Sector |
Empresa |
Sector |
Empresa |
Sector |
|
|
Liquidity:
|
0,28 |
0,13 |
0,14 |
0,12 |
104,39 |
14,66 |
|
|
Acid
Test: |
1,22 |
0,87 |
1,40 |
0,85 |
-12,49 |
1,97 |
|
|
Working
Capital / Investment: |
0,23 |
0,05 |
0,12 |
0,03 |
99,09 |
86,34 |
|
|
Solvency:
|
1,91 |
1,18 |
2,27 |
1,17 |
-16,15 |
0,42 |
|
|
Indebtedness |
2013 |
2012 |
Variación 2013 - 2012 |
|
|||
|
|
Empresa |
Sector |
Empresa |
Sector |
Empresa |
Sector |
|
|
Indebtedness
level: |
0,53 |
1,38 |
0,43 |
1,62 |
24,15 |
-14,91 |
|
|
Borrowing
Composition: |
0,27 |
1,00 |
0,21 |
1,02 |
29,26 |
-2,46 |
|
|
Repayment
Ability: |
7,36 |
91,21 |
21,69 |
198,82 |
-66,05 |
-54,13 |
|
|
Warranty:
|
2,91 |
1,73 |
3,81 |
1,62 |
-23,58 |
6,79 |
|
|
Generated
resources / Total creditors: |
0,27 |
0,08 |
1,41 |
0,07 |
-81,04 |
25,48 |
|
|
Efficiency |
2013 |
2012 |
Variación 2013 - 2012 |
|
|||
|
|
Empresa |
Sector |
Empresa |
Sector |
Empresa |
Sector |
|
|
Productivity:
|
2,03 |
1,85 |
0,65 |
1,70 |
213,37 |
8,72 |
|
|
Turnover
of Collection Rights : |
5,65 |
5,00 |
4,75 |
4,78 |
19,08 |
4,60 |
|
|
Turnover
of Payment Entitlements: |
4,16 |
3,64 |
5,18 |
3,51 |
-19,72 |
3,56 |
|
|
Stock
rotation: |
5,66 |
7,34 |
7,55 |
6,48 |
-25,08 |
13,38 |
|
|
Assets
turnover: |
1,73 |
1,03 |
1,66 |
1,07 |
4,41 |
-3,95 |
|
|
Borrowing
Cost: |
2,68 |
2,86 |
3,17 |
2,95 |
-15,56 |
-3,02 |
|
>
Trend of indicators under the General Accounting Plan of 2007 (2013, 2012,
2011, 2010, 2009)
|
Cash
Flow |
2013 |
2012 |
2011 |
2010 |
2009 |
|
|
Cash
Flow over Sales: |
0,04 % |
0,01 % |
0,00 % |
-0,08 % |
0,16 % |
|
|
EBITDA
over Sales: |
15,76 % |
-6,16 % |
-1,29 % |
0,13 % |
15,40 % |
|
|
Cash
Flow Yield: |
0,05 % |
0,01 % |
0,00 % |
-0,05 % |
0,06 % |
|
|
Profitability |
2013 |
2012 |
2011 |
2010 |
2009 |
|
|
Operating
economic profitability: |
21,31 % |
-14,57 % |
-4,15 % |
49,68 % |
5,63 % |
|
|
Total
economic profitability: |
13,20 % |
22,02 % |
-0,77 % |
29,65 % |
9,09 % |
|
|
Financial
profitability: |
13,68 % |
57,61 % |
-3,72 % |
31,38 % |
8,52 % |
|
|
Margin:
|
12,33 % |
-8,80 % |
-3,06 % |
37,07 % |
12,71 % |
|
|
Mark-up:
|
11,61 % |
-9,19 % |
-2,28 % |
44,04 % |
17,21 % |
|
|
Solvency |
2013 |
2012 |
2011 |
2010 |
2009 |
|
|
Liquidity:
|
0,28 |
0,14 |
0,04 |
0,04 |
0,32 |
|
|
Acid
Test: |
1,22 |
1,40 |
1,21 |
1,53 |
1,78 |
|
|
Working
Capital / Investment: |
0,23 |
0,12 |
0,14 |
0,24 |
0,48 |
|
|
Solvency:
|
1,91 |
2,27 |
1,67 |
2,07 |
3,20 |
|
|
Indebtedness |
2013 |
2012 |
2011 |
2010 |
2009 |
|
|
Indebtedness
level: |
0,53 |
0,43 |
0,55 |
0,40 |
0,33 |
|
|
Borrowing
Composition: |
0,27 |
0,21 |
0,09 |
0,07 |
0,00 |
|
|
Repayment
Ability: |
7,36 |
21,69 |
103,57 |
-5,59 |
3,74 |
|
|
Warranty:
|
2,91 |
3,81 |
3,00 |
3,62 |
4,20 |
|
|
Generated
resources / Total creditors: |
0,27 |
1,41 |
0,03 |
0,86 |
0,21 |
|
|
Efficiency |
2013 |
2012 |
2011 |
2010 |
2009 |
|
|
Productivity:
|
2,03 |
0,65 |
0,93 |
1,01 |
1,88 |
|
|
Turnover
of Collection Rights : |
5,65 |
4,75 |
2,84 |
2,65 |
1,14 |
|
|
Turnover
of Payment Entitlements: |
4,16 |
5,18 |
4,54 |
3,23 |
1,94 |
|
|
Stock
rotation: |
5,66 |
7,55 |
5,39 |
5,08 |
1,03 |
|
|
Assets
turnover: |
1,73 |
1,66 |
1,35 |
1,34 |
0,44 |
|
|
Borrowing
Cost: |
2,68 |
3,17 |
2,36 |
1,04 |
7,68 |
|
COMPARATIVE
SECTORIAL BALANCE
|
|
|
|
|
Sector-based Comparison
under the rules of the New General Accounting Plan.
|
|
Variación - |
|
|
|
Empresa |
Sector |
|
|
Variación - |
|
|
|
Empresa |
Sector |
|
|
Variación - |
|
|
|
Empresa |
Sector |
|
Public
Tenders and Works Won
|
|
|
|
|
No Public Tenders assigned to the name of
the company.
|
Detail
of Subsidies appearing in Balances Memories
|
|
|
|
|
|
Entity |
ORGANISMO NO ESPECIFICADO |
|
Subsidy Concept |
Subvencion de capital. |
|
Status |
CONCEDIDA |
|
Amount Granted |
49.000,00 |
|
Notes |
el importe reflejado corresponde al imputado a
resultados |
|
Entity |
ORGANISMO NO ESPECIFICADO |
|
Subsidy Concept |
Subvencion de capital. |
|
Status |
CONCEDIDA |
|
Amount Granted |
171.000,00 |
|
Notes |
El importe reflejado corresponde al saldo al
cierre. |
|
Entity |
ORGANISMO NO ESPECIFICADA |
|
Subsidy Concept |
Subvencion de capital. |
|
Status |
CONCEDIDA |
|
Amount Granted |
230.000,00 |
|
Notes |
El importe reflejado corresponde al saldo al
cierre. |
FOREIGN EXCHANGE RATES
|
Currency |
Unit
|
Indian Rupees |
|
US Dollar |
1 |
Rs.65.25 |
|
|
1 |
Rs.102.25 |
|
Euro |
1 |
Rs.72.20 |
INFORMATION DETAILS
|
Analysis Done by
: |
KAR |
|
|
|
|
Report Prepared
by : |
ASH |
RATING EXPLANATIONS
|
RATING |
STATUS |
PROPOSED CREDIT LINE |
|
|
>86 |
Aaa |
Possesses an extremely sound financial base with the strongest
capability for timely payment of interest and principal sums |
Unlimited |
|
71-85 |
Aa |
Possesses adequate working capital. No caution needed for credit
transaction. It has above average (strong) capability for payment of interest
and principal sums |
Large |
|
56-70 |
A |
Financial & operational base are regarded healthy. General unfavourable
factors will not cause fatal effect. Satisfactory capability for payment of
interest and principal sums |
Fairly Large |
|
41-55 |
Ba |
Overall operation is considered normal. Capable to meet normal
commitments. |
Satisfactory |
|
26-40 |
B |
Capability to overcome financial difficulties seems comparatively
below average. |
Small |
|
11-25 |
Ca |
Adverse factors are apparent. Repayment of interest and principal sums
in default or expected to be in default upon maturity |
Limited with full
security |
|
<10 |
C |
Absolute credit risk exists. Caution needed to be exercised |
Credit not
recommended |
|
-- |
NB |
New Business |
-- |
This score serves
as a reference to assess SC’s credit risk and to set the amount of credit to be
extended. It is calculated from a composite of weighted scores obtained from
each of the major sections of this report. The assessed factors and their
relative weights (as indicated through %) are as follows:
Financial
condition (40%) Ownership
background (20%) Payment
record (10%)
Credit history
(10%) Market trend (10%) Operational size
(10%)
This report is issued at your request without any
risk and responsibility on the part of MIRA INFORM PRIVATE LIMITED (MIPL)
or its officials.