MIRA INFORM REPORT
|
Report No. : |
337164 |
|
Report Date : |
21.08.2015 |
IDENTIFICATION DETAILS
|
Name : |
SATNET LTD |
|
|
|
|
Registered Office : |
Ul. Yumrukchal 20, Vh. B,Eet. 2, Ap. 3 4300 Karlovo |
|
|
|
|
Country : |
Bulgaria |
|
|
|
|
Financials (as on) : |
31.12.2014 |
|
|
|
|
Date of Incorporation : |
31.03.2003 |
|
|
|
|
Legal Form : |
Limited Liability Company (OOD) |
|
|
|
|
Line of Business : |
·
Wholesale of agricultural machinery and
accessories and implements, including tractors ·
Trade with second hand tractors. |
|
|
|
|
No. of Employees : |
35 |
RATING & COMMENTS
|
MIRA’s Rating : |
Ba |
|
RATING |
STATUS |
PROPOSED CREDIT LINE |
|
|
41-55 |
Ba |
Overall operation is considered normal. Capable to meet normal
commitments. |
Satisfactory |
|
Status : |
Satisfactory |
|
|
|
|
Payment Behaviour : |
No Complaints |
|
|
|
|
Litigation : |
Clear |
NOTES:
Any query related to this report can be made
on e-mail: infodept@mirainform.com
while quoting report number, name and date.
ECGC Country Risk Classification List – March 31, 2015
|
Country Name |
Previous Rating (31.12.2014) |
Current Rating (31.03.2015) |
|
Bulgaria |
A2 |
A2 |
|
Risk Category |
ECGC
Classification |
|
Insignificant |
A1 |
|
Low |
A2 |
|
Moderate |
B1 |
|
High |
B2 |
|
Very High |
C1 |
|
Restricted |
C2 |
|
Off-credit |
D |
BULGARIA - ECONOMIC
OVERVIEW
Bulgaria, a former Communist country that entered the EU on 1 January 2007, averaged more than 6% annual growth from 2004 to 2008, driven by significant amounts of bank lending, consumption, and foreign direct investment. Successive governments have demonstrated a commitment to economic reforms and responsible fiscal planning, but the global downturn sharply reduced domestic demand, exports, capital inflows, and industrial production. GDP contracted by 5.5% in 2009, and has been slow to recover in the years since. Despite having a favorable investment regime, including low, flat corporate income taxes, significant challenges remain. Corruption in public administration, a weak judiciary, and the presence of organized crime continue to hamper the country's investment climate and economic prospects.
|
Source
: CIA |
COMPANY
DETAILS
Local name: SATNET OOD
International name: SATNET LTD
Registered
address:
UL. YUMRUKCHAL 20, VH. B, ET. 2, AP. 3
4300 KARLOVO
Bulgaria
Telephone: +359-888-111777, +359-335-92018
Fax: +359-335-92018
E-Mail: mitak@satnet.bg
Internet: http://www.kubotabg.com/
Head
office:
Plovdivsko shose
4300 Karlovo
Bulgaria
Telephone: +359-335-92018, +359-888-666000
E-Mail: mitak@satnet.bg
Internet: http://www.kubotabg.com
Branch
office:
ul. Polkovnik Bochev
4300 Karlovo
Bulgaria
Telephone: +359-335-92018, +359-885-598472
Fax: +359-335-97000
ESTABLISHMENT
& REGISTRATION:
Established: 31.03.2003
Registered at District court Plovdiv
Court number 1318/2003
Bulstat/VAT number: 115787627
Status of
the company:
Active
LEGAL
FORM:
Limited Liability Company (OOD)
REGISTERED
CAPITAL:
BGN 5 000.00
SHAREHOLDERS/MANAGEMENT
SHAREHOLDERS:
DIMITAR VANGELOV VANGELOV
ID 7403124466, Function: Shareholder, Nationality: Bulgaria
Share: 50,00%
KONSTANTIN VANGELOV VANGELOV
ID 7706244403, Function: Shareholder, Nationality: Bulgaria
Share: 50,00%
MANAGEMENT:
KONSTANTIN VANGELOV VANGELOV (Personal ID 7706244403) - Manager
DIMITAR VANGELOV VANGELOV (Personal ID 7403124466) - Manager
RELATED
COMPANIES:
|
Company ID |
Company Name |
|
115886329 |
EREFLAN |
|
115661909 |
PROMIKOM |
BUSINESS
ACTIVITY
BUSINESS
OPERATION:
NACE 1.1: 51.88 Wholesale of agricultural machinery and
accessories and implements, including tractors
Activity:
Trade with second hand tractors.
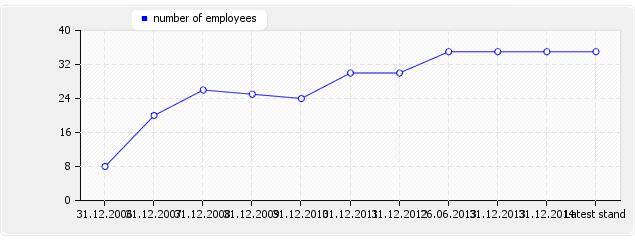
NUMBER OF
EMPLOYEES:
|
As at date |
Value |
|
31.12.2006 |
8 |
|
31.12.2007 |
20 |
|
31.12.2008 |
26 |
|
31.12.2009 |
25 |
|
31.12.2010 |
24 |
|
31.12.2011 |
30 |
|
31.12.2012 |
30 |
|
26.06.2013 |
35 |
|
31.12.2013 |
35 |
|
31.12.2014 |
35 |
|
Latest stand |
35 |
EXPORT:
None
IMPORT:
Japan
REAL ESTATE:
Own land.
FINANCIAL
DATA
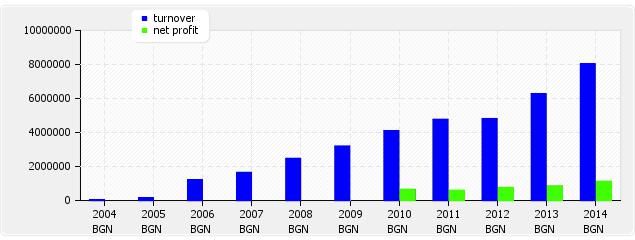
TURNOVER:
|
Year |
Currency |
Value |
|
2004 |
BGN |
41 000.00 |
|
2005 |
BGN |
153 000.00 |
|
2006 |
BGN |
1 216 000.00 |
|
2007 |
BGN |
1 649 000.00 |
|
2008 |
BGN |
2 475 000.00 |
|
2009 |
BGN |
3 199 000.00 |
|
2010 |
BGN |
4 103 000.00 |
|
2011 |
BGN |
4 774 000.00 |
|
2012 |
BGN |
4 814 000.00 |
|
2013 |
BGN |
6 278 000.00 |
|
2014 |
BGN |
8 031 000.00 |
MODES OF
PAYMENT:
Payments are made within agreed terms.
DEBT
COLLECTION:
No debt collection cases are registered against the company.
BANK
DISTRAINTS:
No shares of the company are under bank distraint.
UNPAID
TAXES/ CONTRIBUTIONS TO GOVERNMENT:
There is no publication about overdue unpaid taxes.
INVOLVEMENT
IN LEGAL DISPUTES:
There is no publication about legal claims or disputes against the
company.
OTHER
PAYMENT INFORMATION:
No adverse payment information is available.
BRANCH
INDICATOR:
The company's payment behaviour is average for the branch.
Exchange rate since 1998 is 1 BGN (denominated lev) = 0.51 EUR
|
Ratio |
2011 |
2012 |
2013 |
2014 |
|
Accounting period: |
1.1.2011
- |
1.1.2012
- |
1.1.2013
- |
1.1.2014
- |
|
Debt ratio |
0.08 |
0.07 |
0.05 |
0.04 |
|
Quick ratio |
10.73 |
4.23 |
6.38 |
8.16 |
|
Current ratio |
20.80 |
22.71 |
27.34 |
36.12 |
|
Days purchase in payables |
7.77 |
8.82 |
6.88 |
5.29 |
|
Operating margin in % |
13.91 |
17.53 |
15.00 |
15.63 |
|
Cash ratio (acid ratio) |
4.07 |
1.93 |
4.30 |
5.25 |
|
Return on sales ROS in % |
12.53 |
15.81 |
13.52 |
14.06 |
|
Return on assets ROA in % |
27.01 |
25.32 |
23.38 |
23.74 |
|
Return on equity ROE in % |
29.46 |
27.27 |
24.68 |
24.71 |
|
Days supply in inventory |
78.20 |
163.10 |
144.22 |
147.88 |
|
Days sales in receivables |
51.73 |
20.27 |
14.34 |
15.42 |
|
BALANCE
SHEET in BGN'000 |
2011 |
2012 |
2013 |
2014 |
|
Accounting period: |
1.1.2011
- |
1.1.2012
- |
1.1.2013
- |
1.1.2014
- |
|
A.UNPAID CAPITAL |
|
|
|
|
|
B. FIXED ASSETS |
|
|
|
|
|
I Fixed Intangible Assets: |
|
|
|
|
|
R&D Products |
|
|
|
|
|
Concessions, patents, trade-marks |
|
|
|
|
|
Goodwill |
|
|
|
|
|
Intangible fixed assets under construction |
|
|
|
|
|
thereof advances |
|
|
|
|
|
Total I: |
|
|
|
|
|
II Fixed Tangible Assets |
|
|
|
|
|
Land and Buildings |
41 |
291 |
321 |
323 |
|
thereof Land |
41 |
291 |
291 |
294 |
|
thereof Buildings |
|
|
30 |
29 |
|
Machines, Vehicles |
30 |
33 |
29 |
75 |
|
Equipment |
|
|
|
|
|
Tangible fixed assets under construction |
|
|
|
|
|
thereof advances |
|
|
|
|
|
Total II |
71 |
324 |
350 |
398 |
|
III. Fixed Financial Assets |
|
|
|
|
|
Shares in group companies |
|
|
|
|
|
Loans granted to group companies |
|
|
|
|
|
Shares in joint ventures |
|
|
|
|
|
Long term investments |
|
|
|
|
|
Other loans |
|
|
|
|
|
Bought back own shares |
|
|
|
|
|
Total III |
|
|
|
|
|
IV. Deferred Taxes |
|
|
|
|
|
B. FIXED ASSETS TOTAL |
71 |
324 |
350 |
398 |
|
C. CURRENT ASSETS |
|
|
|
|
|
I. Inventories |
|
|
|
|
|
Raw Materials |
9 |
13 |
1 |
7 |
|
Work in progress |
|
|
|
|
|
thereof young animals |
|
|
|
|
|
Trading goods |
908 |
1711 |
2076 |
2310 |
|
thereof production |
|
|
|
|
|
thereof goods for sale |
908 |
1711 |
2076 |
2310 |
|
Advances |
120 |
457 |
438 |
982 |
|
Total I |
1037 |
2181 |
2515 |
3299 |
|
II. Receivables |
|
|
|
|
|
Receivables from customers |
290 |
271 |
250 |
344 |
|
thereof more than 1 year |
|
|
|
|
|
Receivables from group companies |
|
|
|
|
|
thereof more than 1 year |
|
|
|
|
|
Receivables from joint ventures |
|
|
|
|
|
thereof more than 1 year |
|
|
|
|
|
Other receivables |
396 |
|
|
|
|
thereof more than 1 year |
|
|
|
|
|
Total II |
686 |
271 |
250 |
344 |
|
III. Current Financial Assets |
|
|
|
|
|
Current investments in related companies |
|
|
|
|
|
Bought back own shares |
|
|
|
|
|
Other current financial assets |
|
|
|
|
|
Total III |
|
|
|
|
|
IV. Cash equivalents |
|
|
|
|
|
Cash and accounts in the country |
419 |
228 |
516 |
619 |
|
thereof cash |
207 |
147 |
110 |
578 |
|
Thereof cash in foreign currency (equivalent) |
|
|
|
|
|
thereof current accounts |
212 |
81 |
406 |
41 |
|
thereof blocked accounts |
|
|
|
|
|
thereof cash equivalents |
|
|
|
|
|
Cash and accounts abroad |
|
|
|
|
|
thereof cash |
|
|
|
|
|
Thereof cash in foreign currency (equivalent) |
|
|
|
|
|
thereof current accounts |
|
|
|
|
|
thereof blocked accounts |
|
|
|
|
|
Total IV |
419 |
228 |
516 |
619 |
|
C. CURRENT ASSETS TOTAL |
2142 |
2680 |
3281 |
4262 |
|
D. Deferred expenses |
1 |
1 |
|
96 |
|
TOTAL ASSETS |
2214 |
3005 |
3631 |
4756 |
|
A. OWNERS EQUITY |
|
|
|
|
|
I. Share capital |
5 |
5 |
5 |
5 |
|
II. Issue premium |
|
|
|
|
|
III. Revaluation reserves |
|
|
|
|
|
thereof revaluation reserves of financial instruments |
|
|
|
|
|
IV. Reserves |
|
|
|
|
|
legal reserves |
|
|
|
|
|
reserve related to bought back own shares |
|
|
|
|
|
reserve from company foundation |
|
|
|
|
|
other reserves |
|
|
1450 |
1450 |
|
Total IV |
|
|
1450 |
1450 |
|
V. Result from previous period |
|
|
|
|
|
Undistributed profit |
1427 |
2025 |
1136 |
1985 |
|
Uncovered loss |
|
|
|
|
|
Total V |
1427 |
2025 |
1136 |
1985 |
|
VI. Current result profit (loss) |
598 |
761 |
849 |
1129 |
|
A. OWNERS EQUITY TOTAL |
2030 |
2791 |
3440 |
4569 |
|
B. PROVISIONS |
|
|
|
|
|
Provisions for pensions |
|
|
|
|
|
Provisions for taxes |
|
|
|
|
|
thereof deferred taxes |
|
|
|
|
|
Other provisions |
|
|
|
|
|
B. PROVISIONS TOTAL |
|
|
|
|
|
C. LIABILITIES |
|
|
|
|
|
Bond-backed loans |
|
|
|
|
|
less than 1 year |
|
|
|
|
|
more than 1 year |
|
|
|
|
|
Bank loans |
|
|
|
|
|
less than 1 year |
|
|
|
|
|
more than 1 year |
|
|
|
|
|
Advances received |
|
|
|
|
|
less than 1 year |
|
|
|
|
|
more than 1 year |
|
|
|
|
|
Payables to suppliers |
13 |
11 |
21 |
5 |
|
less than 1 year |
13 |
11 |
21 |
5 |
|
more than 1 year |
|
|
|
|
|
Liabilities on policies |
10 |
8 |
|
|
|
less than 1 year |
|
|
|
|
|
more than 1 year |
10 |
8 |
|
|
|
Liabilities to group companies |
|
|
|
|
|
less than 1 year |
|
|
|
|
|
more than 1 year |
|
|
|
|
|
Liabilities to joint-venture companies |
|
|
|
|
|
less than 1 year |
|
|
|
|
|
more than 1 year |
|
|
|
|
|
Other liabilities |
161 |
195 |
170 |
182 |
|
less than 1 year |
90 |
107 |
99 |
113 |
|
more than 1 year |
71 |
88 |
71 |
69 |
|
thereof to personnel |
9 |
11 |
12 |
11 |
|
less than 1 year |
9 |
11 |
12 |
11 |
|
more than 1 year |
|
|
|
|
|
thereof to social insurance |
4 |
4 |
6 |
3 |
|
less than 1 year |
4 |
4 |
6 |
3 |
|
more than 1 year |
|
|
|
|
|
thereof for taxes |
77 |
92 |
81 |
99 |
|
less than 1 year |
77 |
92 |
81 |
99 |
|
more than 1 year |
|
|
|
|
|
C. LIABILITIES TOTAL |
184 |
214 |
191 |
187 |
|
less than 1 year |
103 |
118 |
120 |
118 |
|
more than 1 year |
81 |
96 |
71 |
69 |
|
D. FINANCING AND DEFERRED INCOME |
|
|
|
|
|
thereof |
|
|
|
|
|
Financing |
|
|
|
|
|
Deferred income |
|
|
|
|
|
TOTAL EQUITY AND LIABILITIES |
2214 |
3005 |
3631 |
4756 |
|
P&L
ACCOUNT in BGN'000 |
2011 |
2012 |
2013 |
2014 |
|
Accounting period: |
1.1.2011
- |
1.1.2012
- |
1.1.2013
- |
1.1.2014
- |
|
A. EXPENSES |
|
|
|
|
|
I. OPERATION EXPENSES |
|
|
|
|
|
Decrease of inventories |
|
|
|
|
|
thereof for materials |
438 |
255 |
325 |
559 |
|
thereof for services |
593 |
642 |
675 |
793 |
|
Personnel expenses |
157 |
185 |
208 |
224 |
|
thereof wages |
133 |
157 |
177 |
191 |
|
thereof social insurance |
24 |
28 |
31 |
33 |
|
thereof pensions |
|
|
|
|
|
Depreciation |
26 |
20 |
21 |
15 |
|
thereof Depreciation of fixed assets |
26 |
20 |
21 |
15 |
|
Other expenses |
2881 |
2843 |
4091 |
5148 |
|
thereof Book value of sold assets (without production) |
2870 |
2836 |
4089 |
5142 |
|
I. OPERATION EXPENSES TOTAL |
4095 |
3945 |
5320 |
6739 |
|
II. Financial expenditures |
|
|
|
|
|
Depreciation of financial assets |
|
|
|
7 |
|
thereof exchange rate losses |
|
|
|
7 |
|
Paid interest |
15 |
25 |
16 |
30 |
|
thereof interest to group companies |
|
|
|
|
|
Thereof expenditures for securities operations |
|
|
|
|
|
II. Financial expenditures Total |
15 |
25 |
16 |
37 |
|
B. Profit on ordinary activity |
664 |
844 |
942 |
1255 |
|
III. Extraordinary expenses |
|
|
|
|
|
thereof expenses on disasters and emergency expenses |
|
|
|
|
|
C. Total expenses (I+II+III) |
4110 |
3970 |
5336 |
6776 |
|
D. Accounting profit |
664 |
844 |
942 |
1255 |
|
IV. Taxation on profit |
66 |
83 |
93 |
126 |
|
V. Other taxes |
|
|
|
|
|
E. Net profit |
598 |
761 |
849 |
1129 |
|
Total expenses |
4774 |
4814 |
6278 |
8031 |
|
A. REVENUES |
|
|
|
|
|
I . OPERATING REVENUES |
|
|
|
|
|
Net sales |
4774 |
4814 |
6278 |
8031 |
|
Production |
|
|
|
|
|
Goods |
4653 |
4650 |
6100 |
7855 |
|
Services |
121 |
164 |
178 |
176 |
|
Increase of production and work in progress |
|
|
|
|
|
Expenses on acquisition of assets |
|
|
|
|
|
Other revenues |
|
|
|
|
|
thereof financing |
|
|
|
|
|
I. TOTAL OPERATING REVENUES |
4774 |
4814 |
6278 |
8031 |
|
II FINANCIAL REVENUES |
|
|
|
|
|
Income from shares |
|
|
|
|
|
thereof income from shares in group companies |
|
|
|
|
|
Income from investments and loans |
|
|
|
|
|
thereof from investments in group companies |
|
|
|
|
|
Income from interest |
|
|
|
|
|
thereof from interest from group companies |
|
|
|
|
|
II FINANCIAL REVENUES TOTAL |
|
|
|
|
|
TOTAL REVENUES FROM ORDINARY ACTIVITIES |
4774 |
4814 |
6278 |
8031 |
|
LOSS |
|
|
|
|
|
Extraordinary revenues |
|
|
|
|
|
AFTER TAX LOSS |
|
|
|
|
|
TOTAL REVENUES |
4774 |
4814 |
6278 |
8031 |
FOREIGN EXCHANGE RATES
|
Currency |
Unit
|
Indian Rupees |
|
US Dollar |
1 |
Rs.65.24 |
|
UK Pound |
1 |
Rs.102.21 |
|
Euro |
1 |
Rs.72.57 |
INFORMATION DETAILS
|
Analysis Done by
: |
KIN |
|
|
|
|
Report Prepared
by : |
TRU |
RATING EXPLANATIONS
|
RATING |
STATUS |
PROPOSED CREDIT LINE |
|
|
|
>86 |
Aaa |
Possesses an extremely sound financial base with the strongest capability
for timely payment of interest and principal sums |
Unlimited |
|
|
71-85 |
Aa |
Possesses adequate working capital. No caution needed for credit
transaction. It has above average (strong) capability for payment of interest
and principal sums |
Large |
|
|
56-70 |
A |
Financial & operational base are regarded healthy. General
unfavourable factors will not cause fatal effect. Satisfactory capability for
payment of interest and principal sums |
Fairly Large |
|
|
41-55 |
Ba |
Overall operation is considered normal. Capable to meet normal
commitments. |
Satisfactory |
|
|
26-40 |
B |
Capability to overcome financial difficulties seems comparatively
below average. |
Small |
|
|
11-25 |
Ca |
Adverse factors are apparent. Repayment of interest and principal sums
in default or expected to be in default upon maturity |
Limited with
full security |
|
|
<10 |
C |
Absolute credit risk exists. Caution needed to be exercised |
Credit not
recommended |
|
|
-- |
NB |
New Business |
-- |
|
This score serves as a reference to assess
SC’s credit risk and to set the amount of credit to be extended. It is
calculated from a composite of weighted scores obtained from each of the major sections
of this report. The assessed factors and their relative weights (as indicated
through %) are as follows:
Financial
condition (40%) Ownership
background (20%) Payment
record (10%)
Credit history
(10%) Market trend (10%) Operational size
(10%)
This report is issued at your request without any
risk and responsibility on the part of MIRA INFORM PRIVATE LIMITED (MIPL)
or its officials.