MIRA INFORM REPORT
|
Report No. : |
337900 |
|
Report Date : |
25.08.2015 |
IDENTIFICATION DETAILS
|
Name : |
LAM SOON [THAILAND]
PUBLIC COMPANY LIMITED |
|
|
|
|
Registered Office : |
64
SOI Bangna-Trad 25, Bangna-Trad
Road, Bangna, Bangkok 10260 |
|
|
|
|
Country : |
Thailand |
|
|
|
|
Financials (as on) : |
31.12.2014 |
|
|
|
|
Year of Establishment : |
1974 |
|
|
|
|
Com. Reg. No.: |
0107538000568 |
|
|
|
|
Legal Form : |
Public Limited Company |
|
|
|
|
Line of Business : |
|
|
|
|
|
No. of Employee : |
544 |
RATING & COMMENTS
|
MIRA’s Rating : |
Ba |
|
RATING |
STATUS |
PROPOSED CREDIT LINE |
|
|
41-55 |
Ba |
Overall operation is considered normal. Capable to meet normal
commitments. |
Satisfactory |
|
Status : |
Satisfactory |
|
|
|
|
Payment Behaviour : |
No complaints |
|
|
|
|
Litigation : |
Clear |
NOTES :
Any query related to this report can be made
on e-mail : infodept@mirainform.com
while quoting report number, name and date.
ECGC Country Risk Classification List – March 31, 2015
|
Country Name |
Previous Rating (31.12.2014) |
Current Rating (31.03.2015) |
|
Thailand |
A2 |
A2 |
|
Risk Category |
ECGC
Classification |
|
Insignificant |
A1 |
|
Low |
A2 |
|
Moderate |
B1 |
|
High |
B2 |
|
Very High |
C1 |
|
Restricted |
C2 |
|
Off-credit |
D |
THAILAND - ECONOMIC OVERVIEW
With a well-developed infrastructure, a free-enterprise economy, and generally pro-investment policies Thailand has historically had a strong economy due in part to competitive industrial and agriculture exports - mostly electronics, agricultural commodities, automobiles and parts, and processed foods. The economy experienced slow growth and declining exports in 2014, in part due to domestic political turmoil and sluggish global demand. With full employment, Thailand attracts an estimated 2-4 million migrant workers from neighboring countries, and faces labor shortages. Following the May 2014 coup d’�tat, tourism decreased 6-7% but is beginning to recover. The household debt to GDP ratio is over 80%. The Thai government in 2013 implemented a nation-wide 300 baht ($10) per day minimum wage policy and deployed new tax reforms designed to lower rates on middle-income earners. The Thai baht has remained stable.
|
Source
: CIA |
Company
name
LAM SOON
[THAILAND] PUBLIC COMPANY
LIMITED
SUMMARY
BUSINESS
ADDRESS : 64
SOI BANGNA-TRAD 25, BANGNA-TRAD ROAD,
BANGNA, BANGKOK
10260, THAILAND
TELEPHONE : [66] 2361-8959-87
FAX :
[66] 2361-8988-9,
2361-8994-5
REGISTRATION
ADDRESS : SAME
AS BUSINESS ADDRESS
ESTABLISHED
: 1974
REGISTRATION NO. : 0107538000568 [Former: BOR MOR JOR. 579]
TAX
ID NO. : 3101027358
CAPITAL REGISTERED : BHT. 820,000,000
CAPITAL PAID-UP : BHT.
820,000,000
FISCAL YEAR CLOSING DATE : DECEMBER 31
LEGAL
STATUS : PUBLIC LIMITED
COMPANY
EXECUTIVE : MS. ANCHALEE SUEBCHANTASIRI, THAI
MANAGING DIRECTOR
AND FINANCE MANAGER
NO.
OF STAFF : 544
LINES OF
BUSINESS : VEGETABLE OILS
AND OTHER RELATED
PRODUCTS
MANUFACTURER, DISTRIBUTOR
AND EXPORTER
CORPORATE PROFILE
OPERATING
TREND : STABLE
PRESENT
SITUATION : OPERATING NORMALLY
REPUTATION : GOOD
WITH NORMAL BUSINESS
ENGAGEMENT
MANAGEMENT
STANDARD : MANAGEMENT WITH
GOOD PERFORMANCE
HISTORY
The subject
was established on September 18,
1974 as a
private limited company under
the registered name “Lam
Soon [Thailand] Company
Limited”, by Thai and
foreign groups, with
the business objective
to manufacture vegetable
oils and other
related products to
both domestic and
international markets. On
October 27, 1995,
the subject’s status
was converted to a public
limited company, under
the name LAM SOON
[THAILAND] PUBLIC COMPANY
LIMITED, and it
was listed on
the Stock Exchange
of Thailand on June 20, 1996,
under the symbolic “LST”, trading in food and beverage business. It currently
employs 544 staff.
It
achieved the standard
HACCP, 9001: 2000, ISO
14001 as well as GMP
certified.
The
subject’s registered address
was initially at
947/155 Moo 12,
Bangna-Trad Rd., Bangna,
Bangkok 10260.
In
2013, its registered
address has been
changed to 64
Soi Bangna-Trad 25,
Bangna-Trad Road, Bangna,
Bangkok 10260, by
the Bangna District
Office, which is
actually the same
location, and this
is the subject’s
current operation address.
THE BOARD
OF DIRECTORS
|
Name |
|
Nationality |
Age |
|
|
|
|
|
|
Mr. Art-ong Jumsai Na
Ayudhya : Chairman |
|
Thai |
75 |
|
Mr. Shim Kong Yip |
|
Malaysian |
59 |
|
Mr. Preecha Jarunggidanan |
|
Thai |
69 |
|
Mr. Banchong Chittchang |
|
Thai |
67 |
|
Ms. Lackana Leelayouthayotin |
|
Thai |
62 |
|
Mr. Whang Shang Ying |
[x] |
Singaporean |
54 |
|
Ms. Anchalee Suebchantasiri |
[x] |
Thai |
56 |
|
Mr. Ampol Simarojana |
|
Thai |
58 |
|
Ms. Piyathida Sukchan |
[x] |
Thai |
46 |
AUTHORIZED PERSON
Two of the mentioned
directors [x] can
jointly sign on
behalf of the
subject with
company’s affixed.
MANAGEMENT
Ms. Anchalee Suebchantasiri is
the Managing Director
and Finance Manager.
She is Thai
nationality with the
age of 56
years old.
Mr. Komkris Siriwongpairat is
the Sales Manager - Modern Trade/Food
Solution.
He is Thai
nationality.
Ms. Jirasuda Sumpaotong is
the Senior Accounting
Manager.
She is Thai
nationality.
Mr. Sirichai Navasettavorn is
the Sales Manager -
Traditional Trade.
He is Thai nationality.
Mrs. Rungnapa Panomcheng is
the Industrial Sales
Manager.
She is Thai
nationality.
Mr. Ampol Simarojana is
the Factory Manager.
He is Thai
nationality with the
age of 58
years old.
BUSINESS OPERATIONS
The subject is
engaged in manufacturing, distributing
and exporting of
vegetable oils and
other related products.
Its products are
as follows:
- Processed
Palm Oil
-
RBD
palm oil
-
RBD
palm olein oil
-
RBD
palm stearin oil
-
Hydrogenated
fat oil
-
Palm
fatty acid
-
RBD
palm kernel oil
- Other
Non-Palm Vegetable Oil
-
Coconut oil
-
Soybean oil
-
Sunflower
seed oil
-
Corn oil
-
Camellia oil
-
Olive oil
-
Blended
canola and sunflower
oil
-
Pure
canola oil
-
Rice
bran oil
- Margarine
and Shortening
Subject is also
an authorized distributor
of canned vegetable
and fruit products,
under
the brand name
“UFC”.
PRODUCTION
365,000 tons per
annum
MAJOR BRANDS
“YOK”, “SAENG CHAN”, “BAI MAI
THONG”, “KNIFE”, “NATUREL”,
“DAISY”, “FRYING”, “FRY
FRY”, “HYFAT K-1”, “ZEST
GOLD”, “BUTTER CREAM”
PURCHASE
Raw materials and
components are purchased
from suppliers and
agents both domestic
and overseas, mainly
in Singapore, Malaysia and
Germany.
MAJOR SUPPLIERS
United Palm Oil
Industry Public Company
Limited : Thailand
Universal Food Public
Company Limited : Thailand
SALES
[LOCAL]
95% of the
products is sold
locally by wholesale
to dealers and
end-users.
EXPORT
5% of the products
is exported to
Singapore, Republic of China,
India, Malaysia,
Bangladesh, Japan, Pakistan,
United States of
America and the
countries in Europe.
REVENUE STRUCTURE
[Company and Subsidiaries]
|
|
2014 |
2013 |
||
|
Products/Services |
Million baht |
% |
Million baht |
% |
|
|
|
|
|
|
|
Vegetable Oil Group |
5,457 |
64.57 |
4,408 |
60.86 |
|
Margarine and Shortening |
604 |
7.15 |
593 |
8.18 |
|
Other Non-Palm Vegetable
Oil |
426 |
5.04 |
415 |
5.73 |
|
Electricity |
27 |
0.32 |
23 |
0.32 |
|
Fruit and Vegetable
Group |
971 |
11.49 |
1,135 |
15.66 |
|
Beverage Group |
855 |
10.11 |
558 |
7.70 |
|
Sauce and Seasoning Products |
111 |
1.31 |
112 |
1.55 |
|
|
|
|
|
|
|
Total Revenue |
8,451 |
100.0 |
7,244 |
100.0 |
SUBSIDIARY AND
AFFILIATED COMPANIES
UNITED PALM
OIL INDUSTRY PUBLIC
COMPANY LIMITED
Business Type :
Crushing mill and
palm oil refinery
Investment : The
subject holds around
66.29% of the
company’s total shares.
UNIVERSAL FOOD
PUBLIC COMPANY LIMITED
Business Type :
Manufacturer and distributor
of canned fruit
and vegetable products
Investment : The
subject holds around
96.79% of the company’s total
shares.
LITIGATION
Bankruptcy and Receivership
There are no
litigation on bankruptcy
and receivership cases
filed against the
subject found at
Legal Execution Department
for the past
five years.
Others
There are no
legal suits filed
against the subject
for the past
two years.
CREDIT
Sales are by
cash or on
the credits term
of 30-60 days.
Local bills are
paid by cash
or on the
credits term of
30-60 days.
Imports are by
L/C at sight
or T/T.
Exports are against
L/C at sight
or T/T.
BANKING
Krung Thai Bank
Public Co., Ltd.
Bangkok Bank Public
Co., Ltd.
Kasikornbank Public Co.,
Ltd.
EMPLOYMENT
The
subject employs 544
staff.
LOCATION DETAILS
The
premise is rented
for administrative office
at the heading
address. Premise is
located in commercial/residential area.
Factories
and Warehouses:
1.
236 Moo 4,
Bangpoo Industrial Estate,
Sukhumvit Rd., Praeksa,
Muang,
Samutprakarn
10280.
2.
99/9
Moo 2, Sikao-Konkul
Rd., T. Talase, A. Sikao,
Trang 92150.
Tel.
[66] 75 267-275,
Fax. [66] 75
267-265.
COMMENT
The
subject is the
largest palm oil
refinery in the country.
Its products have been
widely marketed in
both domestic and
overseas.
The
subject maintains its
excellent business despite
the higher raw
material and operating
costs. The subject’s
operating trend is
in progress.
FINANCIAL INFORMATION
The
capital was registered
at Bht. 5,000,000
divided into 50,000
shares of Bht. 100
each.
The
capital was increased
later as following:
Bht. 140,000,000 on
November 14, 1989
Bht. 300,000,000 on
March 31, 1993
The latest registered
capital was increased
to Bht. 820,000,000 divided
into 820,000,000
shares
of Bht. 1
each with fully
paid.
MAIN SHAREHOLDERS
[as
at May 8,
2015]
|
NAME |
HOLDING |
% |
|
|
|
|
|
Lam Soon Holding
Co., Ltd. |
345,323,250 |
42.11 |
|
HAP Seng Consolidated Berhad |
164,000,020 |
20.00 |
|
CIMB Securities [Singapore] Pte. Ltd. |
90,122,600 |
10.99 |
|
Lam Soon Cannery
Private Limited |
61,358,060 |
7.48 |
|
Mr. Suwit Laohapolwattana |
28,098,056 |
3.43 |
|
CIMB Securities Limited |
13,255,000 |
1.62 |
|
Mrs. Supaporn Smittinan |
10,153,900 |
1.24 |
|
Mrs. Phennipha
Tuangsitthisombat |
5,771,600 |
0.70 |
|
The Hong Kong
and Shanghai Banking
Corporation Limited, Singapore Branch |
5,743,900 |
0.70 |
|
Mr. Niti Jongsawadchai |
5,300,000 |
0.65 |
|
Ms. Nalin Jongsawadchai |
5,300,000 |
0.65 |
|
Others |
85,573,614 |
10.43 |
Total Shareholders :
1,780
NAME
OF AUDITOR &
CERTIFIED PUBLIC ACCOUNTANT
NO.
Ms. Kamolthip Lertwitworathep
No. 4377
Financials
The latest financial figures published
as at December 31,
2014, 2013 &
2012 were:
ASSETS
|
Current Assets |
2014 |
2013 |
2012 [Restated] |
|
|
|
|
|
|
Cash and cash equivalents |
27,893,106 |
46,880,426 |
54,861,727 |
|
Trade and other
receivable |
816,939,192 |
929,688,533 |
822,070,831 |
|
Inventories |
629,344,464 |
548,842,010 |
775,711,507 |
|
Other Current Assets
|
12,453,224 |
18,931,219 |
18,048,415 |
|
|
|
|
|
|
Total Current Assets
|
1,486,629,986 |
1,544,342,188 |
1,670,692,480 |
|
Investment in subsidiaries |
1,312,490,844 |
1,312,490,844 |
1,312,490,844 |
|
Other long-term investments
|
3,939,715 |
836,479 |
1,010,847 |
|
Investment properties |
8,261,203 |
9,959,861 |
11,658,519 |
|
Property, plant and equipment |
608,463,720 |
607,504,980 |
639,100,585 |
|
Cost of forest land rights
and cost of palm plantation |
236,294 |
248,059 |
259,824 |
|
Intangible assets |
5,064,874 |
5,126,205 |
2,693,407 |
|
Deferred tax assets |
8,181,489 |
10,670,843 |
11,453,596 |
|
Other non - current assets |
518,235 |
468,435 |
516,738 |
|
Total Assets |
3,433,786,360 |
3,491,647,894 |
3,649,876,840 |
LIABILITIES &
SHAREHOLDERS’ EQUITY [BAHT]
|
Current
Liabilities |
2014 |
2013 |
2012 [Restated] |
|
|
|
|
|
|
Short-term loan from
financial institutions |
140,000,000 |
185,000,000 |
600,000,000 |
|
Trade and other
payable |
414,467,581 |
531,110,105 |
393,875,131 |
|
Current portion of
long-term loans |
- |
15,000,000 |
40,000,000 |
|
Accrued income tax |
22,680,531 |
16,544,213 |
10,913,161 |
|
Other current liabilities |
51,386,151 |
47,168,727 |
112,536,119 |
|
|
|
|
|
|
Total Current Liabilities |
628,534,263 |
794,823,045 |
1,157,324,411 |
|
Long-term loans - net of current portion |
- |
- |
15,000,000 |
|
Provision for long-term employee benefits
|
30,453,694 |
41,842,550 |
43,886,577 |
|
Total Liabilities |
658,987,957 |
836,665,595 |
1,216,210,988 |
|
|
|
|
|
|
Shareholders' Equity |
|
|
|
|
Share capital |
|
|
|
|
Registered |
|
|
|
|
820,000,000 ordinary shares of Baht 1 |
820,000,000 |
820,000,000 |
820,000,000 |
|
Issued and fully paid-up |
|
|
|
|
820,000,000 ordinary shares of Baht 1 |
820,000,000 |
820,000,000 |
820,000,000 |
|
Paid-in surplus |
|
|
|
|
Share premium |
241,970,265 |
241,970,265 |
241,970,265 |
|
Premium on treasury stock |
5,269,100 |
5,269,100 |
5,269,100 |
|
Retained earnings: Appropriated for statutory
reserve |
82,000,000 |
82,000,000 |
82,000,000 |
|
Unappropriated |
1,625,182,005 |
1,506,288,490 |
1,284,832,549 |
|
Other components of shareholders’ equity |
377,033 |
[545,556] |
[406,062] |
|
Total Shareholders' Equity |
2,774,798,403 |
2,654,982,299 |
2,433,665,852 |
|
Total Liabilities & Shareholders' Equity |
3,433,786,360 |
3,491,647,894 |
3,649,876,840 |
PROFIT &
LOSS ACCOUNT
|
Revenue |
2014 |
2013 |
2012 [Restated] |
|
|
|
|
|
|
Sales |
6,931,738,438 |
5,859,338,205 |
6,383,852,900 |
|
Dividend income |
124,788,381 |
113,539,823 |
249,503,202 |
|
Other income |
108,987,831 |
104,309,534 |
125,316,095 |
|
Total Revenues |
7,165,514,650 |
6,077,187,562 |
6,758,672,197 |
|
Expenses |
|
|
|
|
|
|
|
|
|
Cost of sales
|
6,286,769,265 |
5,144,256,220 |
5,912,670,773 |
|
Selling expenses |
422,353,069 |
361,622,924 |
338,854,797 |
|
Administrative expenses |
125,409,840 |
122,094,987 |
132,616,771 |
|
Total Expenses |
6,834,532,174 |
5,627,974,131 |
6,384,142,341 |
|
|
|
|
|
|
Profit before financial
cost and income
tax expenses |
330,982,476 |
449,213,431 |
374,529,856 |
|
Financial cost |
[13,197,751] |
[12,412,778] |
[36,111,652] |
|
Profit before income
tax expenses |
317,784,725 |
436,800,653 |
338,111,652 |
|
Income tax expenses |
[37,289,230] |
[51,385,038] |
[20,319,400] |
|
|
|
|
|
|
Net Profit / [Loss] |
280,495,495 |
385,415,615 |
318,098,804 |
LAM SOON
[THAILAND] PUBLIC COMPANY
LIMITED
FINANCIAL ANALYSIS
|
ITEM |
UNIT |
2014 |
2013 |
2012 |
|
|
|
|
|
|
|
LIQUIDITY RATIO |
|
|
|
|
|
CURRENT RATIO |
TIMES |
2.37 |
1.94 |
1.44 |
|
QUICK RATIO |
TIMES |
1.34 |
1.23 |
0.76 |
|
|
|
|
|
|
|
ACTIVITY RATIO |
|
|
|
|
|
FIXED ASSETS TURNOVER |
TIMES |
11.39 |
9.64 |
9.99 |
|
TOTAL ASSETS TURNOVER |
TIMES |
2.02 |
1.68 |
1.75 |
|
INVENTORY CONVERSION PERIOD |
DAYS |
36.54 |
38.94 |
47.89 |
|
INVENTORY TURNOVER |
TIMES |
9.99 |
9.37 |
7.62 |
|
RECEIVABLES CONVERSION PERIOD |
DAYS |
43.02 |
57.91 |
47.00 |
|
RECEIVABLES TURNOVER |
TIMES |
8.49 |
6.30 |
7.77 |
|
PAYABLES CONVERSION PERIOD |
DAYS |
24.06 |
37.68 |
24.31 |
|
CASH CONVERSION CYCLE |
DAYS |
55.49 |
59.17 |
70.57 |
|
|
|
|
|
|
|
PROFITABILITY
RATIO |
|
|
|
|
|
COST OF GOODS SOLD |
% |
90.70 |
87.80 |
92.62 |
|
SELLING & ADMINISTRATION |
% |
7.90 |
8.26 |
7.39 |
|
INTEREST |
% |
0.19 |
0.21 |
0.57 |
|
GROSS PROFIT MARGIN |
% |
12.68 |
15.92 |
13.25 |
|
NET PROFIT MARGIN BEFORE EX. ITEM |
% |
4.77 |
7.67 |
5.87 |
|
NET PROFIT MARGIN |
% |
4.05 |
6.58 |
4.98 |
|
RETURN ON EQUITY |
% |
10.11 |
14.52 |
13.07 |
|
RETURN ON ASSET |
% |
8.17 |
11.04 |
8.72 |
|
EARNING PER SHARE |
BAHT |
34.21 |
47.00 |
38.79 |
|
|
|
|
|
|
|
LEVERAGE RATIO |
|
|
|
|
|
DEBT RATIO |
TIMES |
0.19 |
0.24 |
0.33 |
|
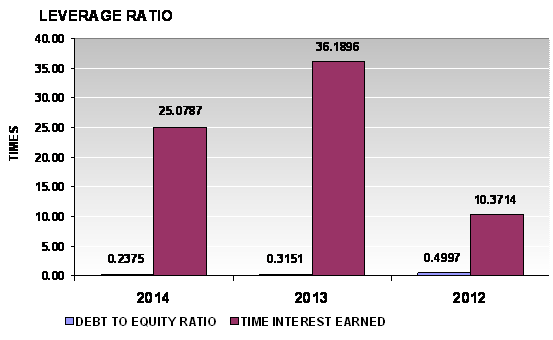
DEBT TO EQUITY RATIO |
TIMES |
0.24 |
0.32 |
0.50 |
|
TIME INTEREST EARNED |
TIMES |
25.08 |
36.19 |
10.37 |
|
|
|
|
|
|
|
ANNUAL GROWTH |
|
|
|
|
|
SALES GROWTH |
% |
18.30 |
(8.22) |
|
|
OPERATING PROFIT |
% |
(26.32) |
19.94 |
|
|
NET PROFIT |
% |
(27.22) |
21.16 |
|
|
FIXED ASSETS |
% |
0.16 |
(4.94) |
|
|
TOTAL ASSETS |
% |
(1.66) |
(4.34) |
|
ANNUAL GROWTH :
ACCEPTABLE
An annual sales growth is 18.3%. Turnover has increased from THB
PROFITABILITY :
IMPRESSIVE

PROFITABILITY
RATIO
|
Gross Profit Margin |
12.68 |
Acceptable |
Industrial
Average |
18.92 |
|
Net Profit Margin |
4.05 |
Impressive |
Industrial
Average |
1.35 |
|
Return on Assets |
8.17 |
Impressive |
Industrial
Average |
0.14 |
|
Return on Equity |
10.11 |
Impressive |
Industrial
Average |
1.06 |
Gross Profit Margin used to assess a firm's financial health by revealing
the proportion of money left over from revenues after accounting for the cost
of goods sold. Gross profit margin serves as the source for paying additional
expenses and future savings. The company's figure is 12.68%. When compared with
the industry average, the ratio of the company was lower. This indicated that
company may have problems with control over its costs.
Net Profit Margin is the indicator of the company's efficiency in that
net profit takes into consideration all expenses of the company. A low profit
margin indicates a low margin of safety, higher risk that a decline in sales
will erase profits and result in a net loss. The company's figure is 4.05%,
higher figure when compared with those of its average competitors in the same
industry, indicated that business was an efficient operator in a dominant position within its industry.
Return on Assets measures how efficiently profits are being generated
from the assets employed in the business when compared with the ratios of firms
in a similar business. A low ratio in comparison with industry averages
indicates an inefficient use of business assets. Return on Assets ratio is 8.17%, higher figure when compared
with those of its average competitors in the same industry, indicated that
business was an efficient profit in a
dominant position within its industry.
Return on Equity indicates how profitable a company is by comparing its
net income to its average shareholders' equity, ROE measures how much the
shareholders earned for their investment in the company. Return on Equity ratio
is 10.11%, higher figure when compared with those of its average competitors in
the same industry, indicated that business was an efficient profit in a dominant position within its industry.
Trend of the average
competitors in the same industry for last 5 years
Return on Assets Downtrend
Return on Equity Downtrend
LIQUIDITY :
SATISFACTORY

LIQUIDITY RATIO
|
Current Ratio |
2.37 |
Impressive |
Industrial
Average |
1.16 |
|
Quick Ratio |
1.34 |
|
|
|
|
Cash Conversion Cycle |
55.49 |
|
|
|
The Current Ratio is to ascertain whether a company's short-term assets are
readily available to pay off its short-term liabilities. The company's figure
is 2.37 times in 2014, increased from 1.94 times, then it is generally
considered to have good short-term financial strength. When compared with the
industry average, the ratio of the company was higher, indicated that company
was an efficient operator in a dominant position within its industry.
The Quick Ratio is a liquidity indicator that further refines the
current ratio by measuring the amount of the most liquid current assets there
are to cover current liabilities. The company's figure is 1.34 times in 2014,
increased from 1.23 times, although excluding inventory so the company still
have good short-term financial strength.
The Cash Conversion Cycle measures the number of days a company's cash
is tied up in the production and sales process of its operations and the
benefit from payment terms from its creditors. It meant the company could
survive when no cash inflow was received from sale for 56 days.
Trend of the
average competitors in the same industry for last 5 years
Current Ratio Downtrend
LEVERAGE :
EXCELLENT

LEVERAGE RATIO
|
Debt Ratio |
0.19 |
Impressive |
Industrial Average |
0.49 |
|
Debt to Equity Ratio |
0.24 |
Impressive |
Industrial Average |
0.96 |
|
Times Interest Earned |
25.08 |
Impressive |
Industrial Average |
- |
Debt to Equity Ratio a measurement of how much suppliers, lenders,
creditors and obligors have committed to the company versus what the
shareholders have committed. A lower the percentage means that the company is
using less leverage and has a stronger equity position.
Times Interest Earned measuring a company's ability to meet its debt
obligations. Ratio is 25.08 higher than 1, so the company can pay interest
expenses on outstanding debt.
Debt Ratio shows the proportion of a company's assets which are financed
through debt. The company's figure is 0.19 less than 0.5, most of the company's
assets are financed through equity.
Trend of the
average competitors in the same industry for last 5 years
Debt Ratio Uptrend
Times Interest Earned Stable
ACTIVITY :
EXCELLENT

ACTIVITY RATIO
|
Fixed Assets Turnover |
11.39 |
Impressive |
Industrial
Average |
- |
|
Total Assets Turnover |
2.02 |
Impressive |
Industrial
Average |
1.46 |
|
Inventory Conversion Period |
36.54 |
|
|
|
|
Inventory Turnover |
9.99 |
Impressive |
Industrial
Average |
8.73 |
|
Receivables Conversion Period |
43.02 |
|
|
|
|
Receivables Turnover |
8.49 |
Impressive |
Industrial
Average |
6.23 |
|
Payables Conversion Period |
24.06 |
|
|
|
The company's Account Receivable Ratio is calculated as 8.49 and
Inventory Turnover in Days Ratio indicates the liquidity of inventory.
It estimates the number of days that it will take to sell the current
inventory. Inventory is particularly sensitive to change in business
activities. The inventory turnover in days has decreased from 39 days at the
end of 2013 to 37 days at the end of 2014. This represents a positive trend.
And Inventory turnover has increased from 9.37 times in year 2013 to 9.99 times
in year 2014.
The company's Total Asset Turnover is calculated as 2.02 times and 1.68
times in 2014 and 2013 respectively. This ratio is determined by dividing total
assets into total sales turnover. The ratio measures the activity of the assets
and the ability of the firm to generate sales through the use of the assets.
Trend of the
average competitors in the same industry for last 5 years
Fixed Assets Turnover Stable
Total Assets Turnover Downtrend
Inventory Turnover Downtrend
Receivables Turnover Downtrend
FOREIGN EXCHANGE RATES
|
Currency |
Unit
|
Indian Rupees |
|
US Dollar |
1 |
Rs.66.51 |
|
|
1 |
Rs.104.01 |
|
Euro |
1 |
Rs.76.27 |
INFORMATION DETAILS
|
Analysis Done by
: |
DIV |
|
|
|
|
Report Prepared
by : |
ASH |
RATING EXPLANATIONS
|
RATING |
STATUS |
PROPOSED CREDIT LINE |
|
|
>86 |
Aaa |
Possesses an extremely sound financial base with the strongest
capability for timely payment of interest and principal sums |
Unlimited |
|
71-85 |
Aa |
Possesses adequate working capital. No caution needed for credit
transaction. It has above average (strong) capability for payment of interest
and principal sums |
Large |
|
56-70 |
A |
Financial & operational base are regarded healthy. General unfavourable
factors will not cause fatal effect. Satisfactory capability for payment of
interest and principal sums |
Fairly Large |
|
41-55 |
Ba |
Overall operation is considered normal. Capable to meet normal
commitments. |
Satisfactory |
|
26-40 |
B |
Capability to overcome financial difficulties seems comparatively
below average. |
Small |
|
11-25 |
Ca |
Adverse factors are apparent. Repayment of interest and principal sums
in default or expected to be in default upon maturity |
Limited with full
security |
|
<10 |
C |
Absolute credit risk exists. Caution needed to be exercised |
Credit not
recommended |
|
-- |
NB |
New Business |
-- |
This score serves as a reference to assess SC’s
credit risk and to set the amount of credit to be extended. It is calculated
from a composite of weighted scores obtained from each of the major sections of
this report. The assessed factors and their relative weights (as indicated
through %) are as follows:
Financial
condition (40%) Ownership
background (20%) Payment
record (10%)
Credit history
(10%) Market trend (10%) Operational size
(10%)
This report is issued at your request without any
risk and responsibility on the part of MIRA INFORM PRIVATE LIMITED (MIPL)
or its officials.