MIRA
INFORM REPORT
|
Report No. : |
338275 |
|
Report Date : |
27.08.2015 |
IDENTIFICATION DETAILS
|
Name : |
TD POWER SYSTEMS LIMITED |
|
|
|
|
Registered
Office : |
No. 27, 28 and 29, KIADB Industrial Area, Dabaspet, Nelamangala
Taluka, |
|
Tel. No.: |
91-80-22995700 |
|
|
|
|
Country : |
|
|
|
|
|
Financials (as
on) : |
31.03.2015 |
|
|
|
|
Date of
Incorporation : |
16.04.1999 |
|
|
|
|
Com. Reg. No.: |
08-025071 |
|
|
|
|
Capital
Investment / Paid-up Capital : |
Rs. 332.376 Million |
|
|
|
|
CIN No.: [Company Identification
No.] |
L31103KA1999PLC025071 |
|
|
|
|
IEC No.: |
0799012220 |
|
|
|
|
TAN No.: [Tax Deduction &
Collection Account No.] |
BLRT01321F |
|
|
|
|
PAN No.: [Permanent Account No.] |
AABCT0360J |
|
|
|
|
Legal Form : |
A Public Limited Liability Company. The Company’s Shares are Listed on
the Stock Exchanges. |
|
|
|
|
Line of Business
: |
Manufacturer of AC Generator and Electrical Motor. |
|
|
|
|
No. of Employees
: |
1136 (Approximately) |
RATING & COMMENTS
|
MIRA’s Rating : |
A (62) |
|
RATING |
STATUS |
PROPOSED CREDIT LINE |
|
|
56-70 |
A |
Financial & operational base are regarded healthy. General
unfavourable factors will not cause fatal effect. Satisfactory capability for
payment of interest and principal sums |
Fairly Large |
|
Maximum Credit Limit : |
USD 14040000 |
|
|
|
|
Status : |
Good |
|
|
|
|
Payment Behaviour : |
Regular |
|
|
|
|
Litigation : |
Clear |
|
|
|
|
Comments : |
Subject was established in the year 1999 and it is manufacturer, and
importer of AC Generators. Subject is a well-established company having fine
track record. For the financial year ended 2015, company possesses healthy operational
performance and it has maintained adequate profitability margin during a year
under a review. Rating also takes into consideration company’s strong market position
in the low-capacity-generator manufacturing market in India supported by
adequate financial base along with strong capital structure and healthy debt
protection metrics. Trade relations are reported to be regular and as per commitment. In view of aforesaid, the company can be considered good for normal
business dealings at usual trade terms and conditions. |
NOTES :
Any query related to this report can be made
on e-mail : infodept@mirainform.com
while quoting report number, name and date.
ECGC Country Risk Classification List – March 31, 2015
|
Country Name |
Previous Rating (31.12.2014) |
Current Rating (31.03.2015) |
|
India |
A1 |
A1 |
|
Risk Category |
ECGC
Classification |
|
Insignificant |
A1 |
|
Low |
A2 |
|
Moderate |
B1 |
|
High |
B2 |
|
Very High |
C1 |
|
Restricted |
C2 |
|
Off-credit |
D |
EXTERNAL AGENCY RATING
|
Rating Agency Name |
CRISIL |
|
Rating |
A+ (Long Term Rating) |
|
Rating Explanation |
Adequate degree of safety and low credit
risk. |
|
Date |
September 03, 2014 |
|
Rating Agency Name |
CRISIL |
|
Rating |
A1+ (Short Term Rating) |
|
Rating Explanation |
Very strong degree of safety and lowest credit risk. |
|
Date |
September 03, 2014 |
RBI DEFAULTERS’ LIST STATUS
Subject’s name is not enlisted as a defaulter
in the publicly available RBI Defaulters’ list.
EPF (Employee Provident Fund) DEFAULTERS’ LIST STATUS
Subject’s name is not enlisted as a defaulter
in the publicly available EPF (Employee Provident Fund) Defaulters’ list as of
31-03-2013.
INFORMATION DECLINED
MANAGEMENT NON CO-OPERATIVE
(TEL. NO.: 91-80-22995700)
LOCATIONS
|
Registered Office/ Factory 1/ Head Office : |
No. 27, 28 and 29, KIADB Industrial Area, Dabaspet, Nelamangala
Taluka, Bangalore – 562 111, Karnataka, India |
|
Tel. No.: |
91-80-22995700 / 66337700 / 27734432 |
|
Fax No.: |
91-80-22995718 |
|
E-Mail : |
|
|
Website : |
|
|
|
|
|
Japan Branch Office
: |
Towa Building, 4th Floor, 3-3 Kitashinagawa, 3 Chome, Shinagawa-ku. Tokyo-140-0001, Japan |
|
Tel. No.: |
81-3-5783-5380 |
|
Fax No.: |
81-3-5783-5381 |
|
|
|
|
Factory 2 : |
Survey No. 59/2, Yedehalli Village, Dabaspet, Nelamangala, Rural District Bangalore – 562111, Karnataka, India |
DIRECTORS
AS ON 31.03.2015
|
Name : |
Mr. Mohib N Khericha |
|
Designation : |
Chairman |
|
Address : |
711 – Mahakant, Opposite Hospital Ashram Road, Ahmedabad – 380006,
Gujarat, India |
|
Date of Birth/Age : |
04.08.1952 |
|
Date of Appointment : |
22.02.2000 |
|
|
|
|
Name : |
Mr. Hithoshi Matsuo (upto 21.02.2015) |
|
Designation : |
Whole Time Director |
|
Address : |
5-1-20-306, Miniamidai, |
|
Date of Birth/Age : |
04.02.2004 |
|
Qualification : |
M.E. |
|
Date of Appointment : |
01.07.2002 |
|
|
|
|
Name : |
Mr. Nikhil Kumar |
|
Designation : |
Managing Director |
|
Address : |
21, 17th Cross Malleswaram, |
|
Date of Birth/Age : |
17.08.1967 |
|
Qualification : |
B.E. |
|
Date of Appointment : |
01.10.2001 |
|
|
|
|
Name : |
Mr. Salil Baldev Taneja |
|
Designation : |
Director (up to May 17, 2013) |
|
|
|
|
Name : |
Mrs. Nandita Lakshmanan |
|
Designation : |
Director |
|
|
|
|
Name : |
Dr. Arjun Kalyanpur |
|
Designation : |
Director |
|
|
|
|
Name : |
Mr. Nitin Bagamane |
|
Designation : |
Director |
|
|
|
|
Name : |
Mr. Ravi Kanth Mantha |
|
Designation : |
Director (From 02.12.2013) |
|
|
|
|
Name : |
K. G. Prabhakar (from 20.05.2015) |
|
Designation : |
Director |
KEY EXECUTIVES
|
Name : |
Mr. N. Srivatsa |
|
Designation : |
Company Secretary |
|
|
|
|
Name : |
Mr. K. G. Prabhakar |
|
Designation : |
Chief Financial Officer |
MAJOR SHAREHOLDERS / SHAREHOLDING PATTERN
AS ON 30.06.2015
|
Category of Shareholders |
No. of Shares |
Percentage of Holding |
|
(A) Shareholding of Promoter and Promoter Group |
|
|
|
|
|
|
|
|
6485524 |
19.51 |
|
|
5026433 |
15.12 |
|
|
3218352 |
9.68 |
|
|
1134252 |
3.41 |
|
|
2084100 |
6.27 |
|
|
14730309 |
44.32 |
|
|
|
|
|
|
3235254 |
9.73 |
|
|
3235254 |
9.73 |
|
Total shareholding of Promoter and Promoter Group (A) |
17965563 |
54.05 |
|
(B) Public Shareholding |
|
|
|
|
|
|
|
|
7306751 |
21.98 |
|
|
7553 |
0.02 |
|
|
3798360 |
11.43 |
|
|
11112664 |
33.43 |
|
|
|
|
|
|
1576628 |
4.74 |
|
|
|
|
|
|
712928 |
2.14 |
|
|
802272 |
2.41 |
|
|
1067533 |
3.21 |
|
|
61906 |
0.19 |
|
|
35313 |
0.11 |
|
|
876270 |
2.64 |
|
|
94044 |
0.28 |
|
|
4159361 |
12.51 |
|
Total Public shareholding (B) |
15272025 |
45.95 |
|
Total (A)+(B) |
33237588 |
100.00 |
|
(C) Shares held by Custodians and against which Depository Receipts
have been issued |
|
|
|
|
0 |
0.00 |
|
|
0 |
0.00 |
|
|
0 |
0.00 |
|
Total (A)+(B)+(C) |
33237588 |
100.00 |

BUSINESS DETAILS
|
Line of Business : |
Manufacturer of AC Generator and Electrical Motor. |
|
|
|
|
Brand Names : |
-- |
|
|
|
|
Agencies Held : |
-- |
|
|
|
|
Exports : |
Not Divulged |
|
|
|
|
Imports : |
Not Divulged |
|
|
|
|
Terms : |
Not Divulged |
PRODUCTION STATUS: NOT AVAILABLE
GENERAL INFORMATION
|
Suppliers : |
|
||||||||||||||||||||||
|
|
|
||||||||||||||||||||||
|
Customers : |
|
||||||||||||||||||||||
|
|
|
||||||||||||||||||||||
|
No. of Employees : |
1136 (Approximately) |
||||||||||||||||||||||
|
|
|
||||||||||||||||||||||
|
Bankers : |
·
Bank of Baroda Standard Chartered Bank ICICI Bank Limited |
||||||||||||||||||||||
|
|
|
||||||||||||||||||||||
|
Facilities : |
|
|
Banking
Relations : |
-- |
|
|
|
|
Auditors : |
|
|
Name : |
B.K. Ramadhyani and Company LLP Chartered Accountants |
|
Address : |
4 – B, Chitrapura Bhavan, No. 68, 8th Main, 15th
Cross, Malleswaran, |
|
|
|
|
Memberships : |
-- |
|
|
|
|
Collaborators : |
-- |
|
|
|
|
Wholly Owned
Subsidiaries: |
· TD Power Systems (USA) Inc. TD Power Systems Japan Limited DF Power Systems Private Limited |
CAPITAL STRUCTURE
AS ON 31.03.2015
Authorised Capital :
|
No. of Shares |
Type |
Value |
Amount |
|
|
|
|
|
|
35,000,000 |
Equity Shares |
Rs. 10/- each |
Rs. 350.000 Million |
|
|
|
|
|
Issued, Subscribed & Paid-up Capital :
|
No. of Shares |
Type |
Value |
Amount |
|
|
|
|
|
|
33,237,588 |
Equity Shares |
Rs. 10/- each |
Rs. 332.376
Million |
|
|
|
|
|
Other Information
I The Company has only one class of equity shares having par value of Rs. 10/- each. Each holder of equity shares is entitled to one vote per share. The Company declares and pays dividends in Indian rupees.
For the period ended 31 March 2015 (31 March 2014, Rs. 2.30), a dividend per share of Rs. 2.645 has been provided for payment to shareholders subject to approval at the Annual General Meeting of the Company.
In the event of liquidation of the Company, the holders of equity shares will be entitled to receive remaining assets of the Company, after distribution of all preferential amounts. The distribution will be in proportion to the number of equity shares held by the shareholders.
II Equity shares include
a. Shares allotted pursuant to a contract without consideration being received in cash. Issued to the shareholder of subsidiary company, DF Power Systems Private Limited, in exchange of 1,700,000 fully paid up equity shares of Rs. 10/- each on 19th October 2010.
b. Shares allotted by way of bonus shares. On Capitalisation out of Reserves to an extent of 16,246,934 Equity Shares of Rs. 10/- each on 11th January 2011.
III
Particulars of equity shareholders holding more than 5% of the total paid-up
equity share capital
|
Particulars |
As at 31.03.2015 |
|
|
|
No. of shares |
Percentage |
|
Saphire Finman Services Private Limited |
5,026,433 |
15.12% |
|
Nikhil Kumar |
4,638,664 |
13.96% |
|
Hitoshi Matsuo |
3,235,254 |
9.73% |
|
Sofia M. Khericha |
2,084,100 |
6.27% |
|
Mohib N. Khericha |
1,846,860 |
5.56% |
FINANCIAL DATA
[all figures are
in Rupees Million]
ABRIDGED
BALANCE SHEET
|
SOURCES OF FUNDS |
31.03.2015 |
31.03.2014 |
31.03.2013 |
|
I.
EQUITY AND LIABILITIES |
|
|
|
|
(1)Shareholders' Funds |
|
|
|
|
(a) Share Capital |
332.376 |
332.376 |
332.376 |
|
(b) Reserves & Surplus |
4580.437 |
4531.948 |
4281.501 |
|
(c) Money received against share warrants |
0.000 |
0.000 |
0.000 |
|
|
|
|
|
|
(2) Share Application money
pending allotment |
0.000 |
0.000 |
0.000 |
|
Total
Shareholders’ Funds (1) + (2) |
4912.813 |
4864.324 |
4613.877 |
|
|
|
|
|
|
(3) Non-Current
Liabilities |
|
|
|
|
(a) Long-term borrowings |
0.000 |
0.000 |
0.000 |
|
(b) Deferred tax liabilities (Net) |
181.435 |
150.210 |
141.242 |
|
(c) Other long
term liabilities |
0.000 |
0.000 |
0.000 |
|
(d) long-term
provisions |
28.378 |
21.158 |
18.706 |
|
Total Non-current
Liabilities (3) |
209.813 |
171.368 |
159.948 |
|
|
|
|
|
|
(4) Current Liabilities |
|
|
|
|
(a) Short
term borrowings |
573.514 |
597.961 |
269.933 |
|
(b)
Trade payables |
1116.787 |
937.040 |
861.118 |
|
(c)
Other current liabilities |
753.355 |
780.816 |
801.243 |
|
(d) Short-term
provisions |
130.933 |
109.290 |
98.656 |
|
Total Current
Liabilities (4) |
2574.589 |
2425.107 |
2030.950 |
|
|
|
|
|
|
TOTAL |
7697.215 |
7460.799 |
6804.775 |
|
|
|
|
|
|
II.
ASSETS |
|
|
|
|
(1) Non-current assets |
|
|
|
|
(a)
Fixed Assets |
|
|
|
|
(i)
Tangible assets |
2644.890 |
2162.982 |
1984.061 |
|
(ii)
Intangible Assets |
49.262 |
0.000 |
0.000 |
|
(iii)
Capital work-in-progress |
0.096 |
540.174 |
161.750 |
|
(iv)
Intangible assets under development |
0.000 |
0.000 |
0.000 |
|
(b) Non-current Investments |
264.547 |
264.547 |
209.690 |
|
(c) Deferred tax assets (net) |
0.000 |
0.000 |
0.000 |
|
(d) Long-term Loan and Advances |
353.073 |
413.451 |
406.870 |
|
(e) Other
Non-current assets |
0.000 |
0.000 |
0.000 |
|
Total Non-Current
Assets |
3311.868 |
3381.154 |
2762.371 |
|
|
|
|
|
|
(2) Current assets |
|
|
|
|
(a)
Current investments |
0.000 |
0.000 |
0.000 |
|
(b)
Inventories |
760.209 |
862.974 |
530.461 |
|
(c)
Trade receivables |
1140.920 |
1319.994 |
1289.248 |
|
(d) Cash
and cash equivalents |
1920.809 |
1404.647 |
1814.831 |
|
(e)
Short-term loans and advances |
563.409 |
492.030 |
407.864 |
|
(f)
Other current assets |
0.000 |
0.000 |
0.000 |
|
Total
Current Assets |
4385.347 |
4079.645 |
4042.404 |
|
|
|
|
|
|
TOTAL |
7697.215 |
7460.799 |
6804.775 |
PROFIT
& LOSS ACCOUNT
|
|
PARTICULARS |
31.03.2015 |
31.03.2014 |
31.03.2013 |
|
|
|
SALES |
|
|
|
|
|
|
|
Income |
4047.651 |
3541.891 |
4237.981 |
|
|
|
Other Income |
171.854 |
301.998 |
258.365 |
|
|
|
TOTAL (A) |
4219.505 |
3843.889 |
4496.346 |
|
|
|
|
|
|
|
|
Less |
EXPENSES |
|
|
|
|
|
|
|
Cost of Materials Consumed |
2352.253 |
2437.423 |
1748.420 |
|
|
|
Purchases of Stock-in-Trade |
308.360 |
186.757 |
953.746 |
|
|
|
Changes in inventories of finished goods, work-in-progress
and Stock-in-Trade |
116.659 |
(237.144) |
293.236 |
|
|
|
Employees benefits expense |
490.783 |
448.653 |
417.482 |
|
|
|
Other expenses |
404.155 |
371.106 |
388.309 |
|
|
|
TOTAL (B) |
3672.210 |
3206.795 |
3801.193 |
|
|
|
|
|
|
|
|
|
PROFIT
BEFORE INTEREST, TAX, DEPRECIATION AND AMORTISATION (A-B) (C) |
547.295 |
637.094 |
695.153 |
|
|
|
|
|
|
|
|
|
Less |
FINANCIAL
EXPENSES (D) |
37.199 |
36.048 |
34.150 |
|
|
|
|
|
|
|
|
|
|
PROFIT
BEFORE TAX, DEPRECIATION AND AMORTISATION (C-D) (E) |
510.096 |
601.046 |
661.003 |
|
|
|
|
|
|
|
|
|
Less/ Add |
DEPRECIATION/
AMORTISATION (F) |
280.061 |
145.995 |
122.537 |
|
|
|
|
|
|
|
|
|
|
PROFIT BEFORE
TAX (E-F) (G) |
230.035 |
455.051 |
538.466 |
|
|
|
|
|
|
|
|
|
Less |
TAX (H) |
64.406 |
11.166 |
181.722 |
|
|
|
|
|
|
|
|
|
|
PROFIT AFTER TAX
(G-H) (I) |
165.629 |
443.885 |
356.744 |
|
|
|
EARNINGS IN
FOREIGN CURRENCY |
1440.950 |
1301.063 |
1142.359 |
|
|
|
|
|
|
|
|
|
|
IMPORTS |
|
|
|
|
|
|
|
Raw Materials |
490.418 |
605.054 |
229.634 |
|
|
|
Capital Goods |
13.691 |
274.530 |
101.420 |
|
|
TOTAL IMPORTS |
504.109 |
879.584 |
331.054 |
|
|
|
|
|
|
|
|
|
|
Earnings Per
Share (Rs.) |
5.10 |
10.23 |
10.73 |
|
CURRENT MATURITIES
OF LONG TERM DEBT DETAILS
|
Particulars |
31.03.2015 |
31.03.2014 |
31.03.2013 |
|
Current Maturities of Long term debt |
NA |
NA |
NA |
|
|
|
|
|
|
Cash Generated from Operations |
737.857 |
53.872 |
913.326 |
|
|
|
|
|
|
Net Cash Flow from Operating Activities |
695.766 |
(22.835) |
649.568 |
QUARTERLY RESULTS
|
PARTICULARS |
30.06.2015 |
|
Type |
1st
Quarter |
|
Net Sales |
858.130 |
|
Total Expenditure |
817.590 |
|
PBIDT (Excl OI) |
40.540 |
|
Other Income |
36.780 |
|
Operating Profit |
77.320 |
|
Interest |
8.980 |
|
Exceptional Items |
0.000 |
|
PBDT |
68.340 |
|
Depreciation |
70.820 |
|
Profit Before Tax |
(2.480) |
|
Tax |
(3.750) |
|
Provisions and contingencies |
0.000 |
|
Profit After Tax |
1.270 |
|
Extraordinary Items |
0.000 |
|
Prior Period Expenses |
0.000 |
|
Other Adjustments |
0.000 |
|
Net Profit |
1.270 |
KEY
RATIOS
|
PARTICULARS |
|
31.03.2015 |
31.03.2014 |
31.03.2013 |
|
Net Profit Margin (PAT / Sales) |
(%) |
4.09 |
12.53 |
8.42 |
|
|
|
|
|
|
|
Operating Profit Margin (PBDIT/Sales) |
(%) |
13.52 |
17.99 |
16.40 |
|
|
|
|
|
|
|
Return on Total Assets (PBT/Total Assets} |
(%) |
3.09 |
6.84 |
8.37 |
|
|
|
|
|
|
|
Return on Investment (ROI) (PBT/Networth) |
|
0.05 |
0.09 |
0.12 |
|
|
|
|
|
|
|
Debt Equity Ratio (Total Liability/Networth) |
|
0.12 |
0.12 |
0.06 |
|
|
|
|
|
|
|
Current Ratio (Current Asset/Current Liability) |
|
1.70 |
1.68 |
1.99 |
Total Liability = Short-term Debt + Long-term Debt + Current Maturities
of Long-term debts
STOCK
PRICES
|
Face Value |
Rs. 10.00/- |
|
|
|
|
Market Value |
Rs. 273.00/- |
FINANCIAL ANALYSIS
[all figures are
in Rupees Million]
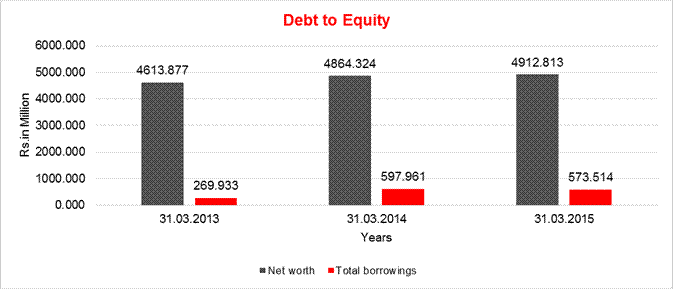
DEBT EQUITY RATIO
|
Particular |
31.03.2013 |
31.03.2014 |
31.03.2015 |
|
|
(Rs.
In Million) |
(Rs.
In Million) |
(Rs.
In Million) |
|
Share Capital |
332.376 |
332.376 |
332.376 |
|
Reserves & Surplus |
4281.501 |
4531.948 |
4580.437 |
|
Money received against share
warrants |
0.000 |
0.000 |
0.000 |
|
Share Application money
pending allotment |
0.000 |
0.000 |
0.000 |
|
Net
worth |
4613.877 |
4864.324 |
4912.813 |
|
|
|
|
|
|
Long-term borrowings |
0.000 |
0.000 |
0.000 |
|
Short term borrowings |
269.933 |
597.961 |
573.514 |
|
Total
borrowings |
270.119 |
597.961 |
573.514 |
|
Debt/Equity
ratio |
0.059 |
0.123 |
0.117 |
YEAR-ON-YEAR GROWTH
|
Year
on Year Growth |
31.03.2013 |
31.03.2014 |
31.03.2015 |
|
|
(Rs.
In Million) |
(Rs.
In Million) |
(Rs.
In Million) |
|
Sales |
4237.981 |
3541.891 |
4047.651 |
|
|
|
(16.425) |
14.279 |
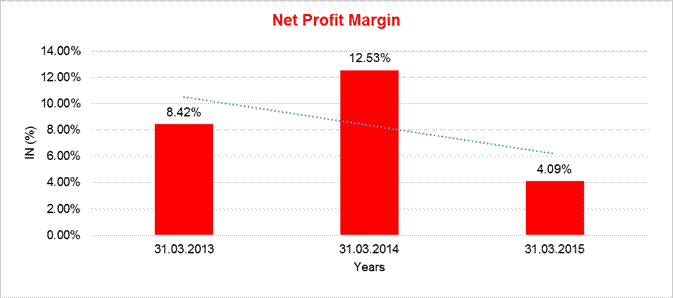
NET PROFIT MARGIN
|
Net
Profit Margin |
31.03.2013 |
31.03.2014 |
31.03.2015 |
|
|
(Rs.
In Million) |
(Rs.
In Million) |
(Rs.
In Million) |
|
Sales |
4237.981 |
3541.891 |
4047.651 |
|
Profit |
356.744 |
443.885 |
165.629 |
|
|
8.42% |
12.53% |
4.09% |
LOCAL AGENCY FURTHER INFORMATION
|
Sr. No. |
Check list by
info agents |
Available in
Report (Yes/No) |
|
1 |
Year of establishment |
Yes |
|
2 |
Constitution of the entity -Incorporation
details |
Yes |
|
3 |
Locality of the entity |
Yes |
|
4 |
Premises details |
No |
|
5 |
Buyer visit details |
-- |
|
6 |
Contact numbers |
Yes |
|
7 |
Name of the person contacted |
Yes |
|
8 |
Designation of contact person |
Yes |
|
9 |
Promoter’s background |
Yes |
|
10 |
Date of Birth of Proprietor / Partners /
Directors |
Yes |
|
11 |
Pan Card No. of Proprietor / Partners |
No |
|
12 |
Voter Id Card No. of Proprietor / Partners |
No |
|
13 |
Type of business |
Yes |
|
14 |
Line of Business |
Yes |
|
15 |
Export/import details (if applicable) |
No |
|
16 |
No. of employees |
Yes |
|
17 |
Details of sister concerns |
Yes |
|
18 |
Major suppliers |
No |
|
19 |
Major customers |
No |
|
20 |
Banking Details |
Yes |
|
21 |
Banking facility details |
Yes |
|
22 |
Conduct of the banking account |
-- |
|
23 |
Financials, if provided |
Yes |
|
24 |
Capital in the business |
Yes |
|
25 |
Last accounts filed at ROC, if applicable |
Yes |
|
26 |
Turnover of firm for last three years |
Yes |
|
27 |
Reasons for variation <> 20% |
-- |
|
28 |
Estimation for coming financial year |
No |
|
29 |
Profitability for last three years |
Yes |
|
30 |
Major shareholders, if available |
Yes |
|
31 |
External Agency Rating, if available |
No |
|
32 |
Litigations that the firm/promoter
involved in |
-- |
|
33 |
Market information |
-- |
|
34 |
Payments terms |
No |
|
35 |
Negative Reporting by Auditors in the
Annual Report |
No |
INDEX OF CHARGES
|
S.NO. |
CHARGE ID |
DATE OF CHARGE CREATION/MODIFICATION |
CHARGE AMOUNT SECURED |
CHARGE HOLDER |
ADDRESS |
SERVICE REQUEST NUMBER (SRN) |
|
1 |
10353809 |
19/04/2012 |
200,000,000.00 |
STANDARD
CHARTERED BANK |
BRANCH
OFFICE: RAHEJA TOWERS, 26/27, M. G. ROAD, B |
B38974481 |
|
2 |
10070492 |
17/10/2008
* |
113,700,000.00 |
BANK OF
BARODA |
CORPORATE
FINANCIAL SERVICES BRANCH, H J S CHAMBERS NO. 26, RICHMOND ROAD, BANGALORE -
560025, KARNATAKA, INDIA |
A49987449 |
|
3 |
90192621 |
16/02/2012
* |
2,130,000,000.00 |
BANK OF
BARODA |
CORPORATE
FINANCIAL SERVICES BRANCH, NO.72, 1ST FLOOR, NITESH LEXINGTON AVENUE,
BRIGADE ROAD, BANG |
B34190702 |
* Date of charge modification
REVIEW OF
OPERATIONS
Even as the market sentiments seemed surcharged with the installation of the new government, no tangible change was witnessed in the business environment during Fiscal 2015. The much expected kick start of investments and consequent industrial growth resulting in an improvement in order book was belied. The capital goods industry was subdued belying expectations of a recovery. The core sector of power, cement, steel, oil and gas was sluggish resulting in virtually no expansion in these sectors affecting order flows to the capital goods sector. The world economy continued to be slow and did not instill confidence.
In these challenging circumstances, the Company increased its revenue from operations by Rs. 375.600 Million in Fiscal 2015- a rise of about 9.77% on the back of a moderate growth of 18% in orders. Net sales from manufacturing business at Rs. 3560.912 Million, increased by Rs. 477.306 Million, a growth of 15.48% in Fiscal 2015, contributing 84.39% of their Total Income in Fiscal 2015, as compared to 80.22% in Fiscal 2014. Net sales from their Project Business at Rs. 486.740 Million increased by Rs. 28.455 Million, a subdued growth of 6.21% in Fiscal 2015 contributing 11.54% of their Total Income as compared to 11.92% in Fiscal 2014.
Exports and deemed exports contributed 66% of Revenue as compared to about 49% in the previous year which reflects their continuing focus on growing their overseas markets. Steam generators contributed 46% of the turnover followed by Hydro generators at 27%. Considering the dismal state of the domestic market, overseas markets have assumed great significance in growing the Companies business year on year and the initiatives undertaken by the Company in the last 3-4 years in seeding these markets are yielding good results encouraging them to enlarge their presence in select markets overseas.
Earnings
Before interest, tax, depreciation & amortization (EBITDA) lower by 14.10%
at Rs. 5,472.94 Lakhs as compared to Rs. 637.093 Million in the previous year
due to lower realizations on account on Euro and JPY devaluation. The Profit
after tax decreased by Rs. 170.200 Million to Rs. 169.629 Million as compared
to Rs. 339.885 Million, a decrease of 50% over previous year mainly due to a
higher depreciation and amortization charge of Rs. 280.060 Million an increase
of Rs. 134.066 Million or 91.83% over previous year due to increased
capitalization of fixed assets, change in the useful life of the asset as
prescribed under the Companies Act, 2013 (“Act”) and amortization of technical
know as per accounting policy of the Company.
MANAGEMENT DISCUSSION AND ANALYSIS
The global recovery was mostly muted due to subdued recovery in some major developed economies of the world and China. The economic slowdown experienced in India since Fiscal 2011 seems to be requiring more time to improve than anticipated. The new government’s efforts to usher in policy momentum conducive for revival of economic and industrial growth have improved business confidence and sentiments. However, as a result of guarded optimism which seems to be guiding over all business and industrial activity, there has been no visible momentum reflecting revival of demand, growth or investment cycle in the economy in Fiscal 2015. The demand for capital goods was subdued, if not nonexistent, in Fiscal 2015, driven by a wait and watch strategy in investment by business and industry faced as they were with falling capacity utilization and market growth. The positive business confidence and optimism failed to translate into significant capex allocations which could revive the capital goods sector. The devaluation of the Japanese yen and the Euro also affected realizations for Indian manufacturers.
In order to drive maximum capacity and operational efficiencies, power intensive industries such as steel, aluminum, copper, cement, engineering, sugar, chemicals depend on Captive Power Plants (CPP) in which the Company has a significant market presence. However, many CPP operated at suboptimal level in Fiscal 2015 due to fuel linkage issues and infrastructure bottlenecks thus seriously affecting growth or expansion. As in the last two to three years the domestic market for generators continued to be stagnant in Fiscal 2015. Consistent depression in demand over the last three years have led to intense competition and consequently unrelenting pricing pressures.
They are one of the leading manufacturers of AC Generators for a diverse range of prime movers with output capacities ranging from 1 MW to 200 MW for steam and gas and up to 35 MW for hydro and upto 20 MW diesel and gas engines and customized rating for wind turbines, catering to both conventional and renewable fuel based power plants.
In the backdrop of the challenging conditions as described above, the Company’s performance has been encouraging. The manufacturing order booking grew by 18% in Fiscal 2015 to Rs. 431.879 Million from Rs. 366.430 Million as compared to Fiscal 2014 of which, the order booking from domestic sector was Rs. 179.273 Million (42%) as compared to exports (including deemed exports) at Rs. 252.606 Million being (58%). While the order booking in the first two quarters of Fiscal 2015 was healthy at Rs. 264.153 lakhs, the third and fourth quarter order booking was Rs. 167.726 Million. Steam and Hydro contributed to 44.44% and 25.71% respectively of order book for Fiscal 2015 while gas contributed to 9.36% and a beginning has been made in Traction generators. As of March 31, 2015 (Fiscal 2015) 2671 generators with an aggregate output capacity of over 20,558 MW and have been supplied to 73 countries.
During Fiscal 2015 they have added 5 new customers OEM’s in steam and wind segments. They have entered the traction generators market in which initial orders as qualification orders and once such orders are successfully completed, a significant potential is awaiting the Company in this segment with substantial orders on a long-term basis. It is hoped that some portion of the serial production orders will be received in Fiscal 2016.
On standalone basis, the Net sales from their manufacturing business increased by Rs. 477.306 Million or 15.48%, to Rs. 3560.912 Million in Fiscal 2015 from Rs.3083.606 Lakhs in Fiscal 2014. The generator business contributed to 84.39% of Fiscal 2015 revenues of the Company. Reflecting the depressed demand in the domestic markets, domestic sales has been sliding over the last 3 years contributing 33.47% of sales in fiscal 2015 as compared to 51.43% in Fiscal 2014 (and 62% in Fiscal 2013), while exports and deemed exports contributed to 66.53% of sales for Fiscal 2015 as compared to 49% in Fiscal 2014 (& 38% in Fiscal 2013). Growing supplies to reputed original equipment manufacturers (OEM’s) who are global leaders in power equipment’s has strengthened their overseas markets and will continue to drive their exports both in the medium and long-term. While they have initiated required steps to strengthen their presence in the USA and Japan, steps are being taken to establish presence in other key markets to grow overseas markets.
Steam and Hydro contributed to 49% and 28.70% respectively of the revenue for Fiscal 2015 while gas contributed to 10.60%. The contribution of Gas generators has increased from 7.1% in Fiscal 2014 (and 2.5% in Fiscal 2013) to 10.60% in Fiscal 2015. Sale of Diesel and Gas engine generators increased by about 36.5% respectively in Fiscal 2015 while the sale of Hydro generators was lower by 10% in Fiscal 2015. Consistent growth in sales of gas, diesel, wind and other application generators contributed to about 22% revenue in Fiscal 2015 while steam and hydro generators contributed 78%, i.e. lower by 5% than in Fiscal 2014, reflecting reducing dependence on steam (though this segment has grown by 5% in Fiscal 2015) and hydro generators. A large part of generator sales take place through OEM’s, with top 10 customers contributing to 70.34% of FY 2015 revenues. Their association with a leading hydro power equipment manufacturer is progressing well reflecting a good potential in this segment as and when the Hydro market grows.
We also undertake overseas Turbine Generator island (TG Island) projects for steam turbine power plants with output capacity up to 55 MW using a Japanese turbine combined with their generator through their Japan branch. Net sales from their Project Business (TG island (up to 52MW) increased by Rs. 28.455 Million or 6.21% to Rs. 486.740 Million in Fiscal 2015 from Rs. 458.285 Million in Fiscal 2014. The appreciation of the Japanese yen as well as dismal economic and investment climate in India and worldwide resulted in low order intake adversely impacting this business in Fiscal 2015.
As of March 31, 2015, the pending order for Manufacturing was Rs. 3393.750 Million and for projects business in India and Japan was Rs. 671.366 Million.
Their Subsidiary, DF Power Systems Private Limited, is in the business of EPC / Boiler-Turbine Generator island projects (BTG) and the balance of plant portion for steam turbine power plants with output capacity up to 150 MW. Net Sales from EPC Business increased by Rs. 358.363 Million or 29.42% to Rs. 1576.564 Million in Fiscal 2015 from Rs. 1218.201 Million in Fiscal 2014. The order book as of close of Fiscal 2014 was Rs. 14,370 Lakhs, made up of two orders – from a cement plant in Karnataka and a waste heat recovery plant in Raipur. Both these orders on hand are scheduled for completion in the ongoing year. Fiscal 2015 witnessed serious weakness in order inflow - both BTG / EPC projects and no orders were received during the year. The orders for Thermal Power Market 15MW-150MW, the Company’s mainstay was dismal in the year. Though there seemed some market traction starting in Small Power Plants (< 10MW), pricing was an issue and certain large players accepted orders merely in the hope of an improved market in future. The Cement waste Heat recovery based Power Plants, which was seen as an innovative option failed to take off due to softening of oil prices and longer payback periods. The above factors prompted the company to stay away from active bidding for projects and adopt a wait and watch policy.
The performance of the two overseas subsidiaries is as stated in the Director’s Report. On a consolidated basis, the Net sales increased by Rs. 1172.121 Million or 24.41% to Rs. 5974.419 Million in Fiscal 2015 from Rs. 4802.298 Million in Fiscal 2014. Their profit after tax decreased by Rs. 235.365 Million or 103.65% resulting in loss of Rs. 8.284 Million in Fiscal 2015 from a profit of Rs. 227.081 Million in Fiscal 2014.
OUTLOOK
The investment cycle is not showing signs of revival while demand continues to be tepid. It is reported that corporate profits as a percentage of GDP are at a historic low thus lending support to a view that entities with large cash flow abilities are holding back investments if not refusing to invest. The demand supply shortfall, quality and price of power continue to be bottlenecks for industrial growth and if investment by industry is to be fruitful, it is imperative for them to have dependable and cost effective power source. In the current Fiscal, the domestic market continues to remain soft till date for the manufacturing business and a revival if at all, in this market would be sustainable from FY 16 again driven by industrial capex recovery. They hope that the domestic market revives and the capex cycle turns around based on the policy changes being driven by the new government, softening interest rates, coal block auctions and the infrastructure investments.
Despite the unfavorable market conditions, they continue to have healthy market share in steam generators (up to 55MW), in diesel generators and hydro generators and are well placed to capitalize on any upswing in domestic as well as overseas demand.
Hydro orders from Indian OEM’s are expected for projects in South East Asia even though no new projects are likely in India. However, price competitiveness is a challenge in the hydro market with aggressive pricing from European manufacturers and the weakening of the rupee could be a major concern.
Projects requiring large generator are in the pipeline but decisions are on hold. The Company is exploring component business from the large generator segment and has received a breakthrough order in this segment. While we hope that the domestic market recovers for steam generators, they continue to focus on building their existing portfolio of generators for other applications and expect growth in gas and wind generators in Fiscal 2016. Exports will continue to be their focus area in Fiscal 2016. They have a comfortable order book currently for Fiscal 2016 and are hopeful in increasing the same to support good growth in manufacturing business over Fiscal 2015. The traction generators business promises to be of significant volumes and could be a game changer for the Company both in domestic and export markets.
The projects business (TG Island) is being realigned to meet business requirements and during this Fiscal 2016 revenues from this segment will continue to be flat.
It is expected that the Company will tide over the difficult market conditions in Fiscal 2016 on the back of a revival in manufacturing business. Any substantial improvements in business in the above segments both in India and overseas will contribute to an improved performance. The Company maintains a healthy cash position and continues to remain debt free.
STATEMENT OF STANDALONE FINANCIAL RESULTS FOR
THE QUARTER ENDED JUNE 30, 2015
PART I
(Rs.
in Million)
|
|
Particulars |
Unaudited 30.06.2015 |
|
1. |
Income
from operations |
|
|
|
Net sales |
858.126 |
|
|
Total Income from Operations (net) |
858.126 |
|
|
|
|
|
2. |
Expenses |
|
|
|
a)
Direct operating expenses |
604.044 |
|
|
b)
Purchase of traded goods |
43.400 |
|
|
c)
Changes in inventories of finished goods, work-in-progress and traded goods |
(70.021) |
|
|
d)
Employee benefits expense |
140 959 |
|
|
e)
Depreciation and amortisation expense |
70.817 |
|
|
f)
Other expenses: (Any item exceeding 10% of the total expenses relating to
continuing operations to be shown separately) |
99.205 |
|
|
Total Expenses |
888.404 |
|
|
|
|
|
3. |
Profit/(Loss) from
Operations before other income, Interest, finance costs and exceptional Items
(1-2) |
(30.278) |
|
4. |
Other
Income |
36.778 |
|
5. |
Profit/(Loss) from ordinary activities before finance
costs and exceptional Items (3+/-4) |
6.500 |
|
6. |
Finance
costs |
8.981 |
|
7. |
Profit/(Loss) from ordinary activities after finance
costs but before exceptional Items (5+/-6) |
(2.481) |
|
8. |
Exceptional
Items |
-- |
|
9. |
Profit/(Loss) from ordinary activities before tax (7+/-8) |
(2.481) |
|
10. |
Tax
expense and prior period expenses |
(3.754) |
|
11. |
Profit/(Loss) from ordinary activities after tax (9+/-10) |
1.273 |
|
12. |
Extraordinary Item (Net of tax expense Rs in Lakhs) |
|
|
13. |
Net profit/ (loss) for the period (11+/-12) |
|
|
14. |
Share of Profit/(Loss)
associates* |
-- |
|
15. |
Minority
Interest* |
-- |
|
16. |
Net Profit/ (Loss) After Taxes Minority Interest and Share of
Profit/(Loss) of Associates (13+/-14+/-15) |
1.273 |
|
17. |
Paid-up Eq. Share Capital (Face Value of Equity Shares: Rs.10/- per
share) |
33.2.376 |
|
18. |
Reserves excluding Revaluation Reserve as per balance sheet of
previous accounting year |
4581.710 |
|
19. i |
Earnings
Per Share (before extraordinary item) (of Rs. 10/- each) |
-- |
|
|
a)
Basic |
0.04 |
|
|
b)
Diluted |
0.04 |
|
19. ii |
Earnings
Per Share (after extraordinary item) (of Rs. 10/- each) |
-- |
|
|
Weighted
average number of shares |
0.04 |
|
|
a)
Basic |
0.04 |
|
|
b)
Diluted |
|
|
|
*Applicable
in the case of consolidated results |
|
|
PART I |
||
|
A. |
PARTICULARS
OF SHAREHOLDING |
30.06.2015 |
|
1. |
Public Shareholding |
|
|
|
-
Number of Shares |
1527025 |
|
|
-
Percentage of Shareholding |
45.95 |
|
2. |
Promoter and Promoter Group Shareholding |
|
|
|
a) Pledged/Encumbered |
Nil |
|
|
-
Number of Shares |
Nil |
|
|
-Percentage
of Shares (as a % of the total shareholding of promoter and promoter group) |
Nil |
|
|
-Percentage
of Shares (as a % of the total share capital of the Company) |
Nil |
|
|
b) Non-Encumbered |
Nil |
|
|
-
Number of Shares |
17965563 |
|
|
-Percentage
of Shares (as a % of the total shareholding of promoter and promoter group) |
100 |
|
|
-Percentage
of Shares (as a % of the total share capital of the Company) |
54.05 |
|
|
||
|
|
Particulars |
30.06.2015 |
|
B. |
INVESTOR
COMPLAINTS |
|
|
|
Pending
at the beginning of the quarter |
Nil |
|
|
Received
during the quarter |
Nil |
|
|
Disposed
of during the quarter |
Nil |
|
|
Remaining
unresolved at the end of the quarter |
Nil |
|
NOTE: 1.
The said financial result have been subject
to a limited review by the statutory auditors in terms of clause 41 of the listing
agreement. There are no qualifications in the limited review report issued by
the statutory auditors. The said financial results have been reviewed by the
Audit Committee and approved by the Board of Directors at its meeting held on
August 06, 2015. 2.
The consolidates financial statements for the quarter ended 30.06.2015
are prepared in accordance with AS21, notified pursuant to the companies
(Accounting Standard) Rulers, 2006 3.
During the quarter, the company has given loan to US subsidiary to
bthe tune of Rs. 6.257 Million (USD 100,000) 4.
As on reporting date, the company has given loan US subsidiary to the
tune of Rs. 31.730 Million (USD 500,000) and Japan Subsidiary to the tune of
Rs. 15.543 Million (JPY 30,000,000) 5.
Mr. K.G. Prabhakar (Chief Financial Officer (CFO) of the company) has
been appointed as Director of the company with effect from May 20, 2015. 6.
Previous year/periods figures have been re-group/rearranged whereve
required in conformity with current period presentation. |
||
|
|
||
|
A. |
PARTICULARS
OF SHAREHOLDING (the details related only to share of the company) |
30.06.2015 |
|
1. |
Segment
Revenues |
|
|
|
(a)
Manufacturing |
792.281 |
|
|
(b)
Project business including WOC |
117.754 |
|
|
(c)
Engineering, procurement and construction (EPC) |
-- |
|
|
Total |
910.035 |
|
|
Less:
Inter Segment Revenue |
51.909 |
|
|
Less:
Inter Company |
-- |
|
|
Net
Sales/Income from Operations |
858.126 |
|
2. |
Segment Revenue Results (Profit)(+)/ Loss(-) before tax and
interest from each segment) |
-- |
|
|
(a)
Manufacturing |
90.849 |
|
|
(a1)
Less: Inter Segment/Company |
-- |
|
|
(a2)
Less: Inter Company |
-- |
|
|
(b) Project Business Including WOC |
(14.879) |
|
|
(c)
Engineering, procurement and construction (EPC) |
-- |
|
|
Total |
75.970 |
|
|
Less: (i) Interest |
8.981 |
|
|
(ii) Depreciation |
70.817 |
|
|
(iii) Un-allocable income net of Un-allocable expenditure |
(1.347) |
|
|
Total Profit Before Tax |
(2.481) |
|
3. |
Capital Employed (Segment
Assets-Segment Liabilities) |
-- |
|
|
(a)
Manufacturing |
3848.960 |
|
|
(b)
Project business including WOC |
125.058 |
|
|
(c)
Engineering, procurement and construction (EPC) |
-- |
|
|
(c)
Un-allocated segment |
940.068 |
|
|
Total |
4914.086 |
CONTINGENT
LIABILITIES:
|
Particulars |
31.03.2015 (Rs.
In Million) |
31.03.2014 (Rs.
In Million) |
|
Guarantees |
759.300 |
1513.628 |
|
Letters of credit (The management believes, based on internal assessment and / or legal advice, that the probability of an ultimate adverse decision and outflow of resources of the Company is not probable and accordingly, no provision for the same is considered necessary.) |
296.752 |
175.303 |
FIXED ASSETS:
·
Free Hold Land
Lease
Hold Land
Buildings
Plant and
Machinery
Office
Equipment’s
Furniture
and Fixtures
Computers
Communication
Equipment’s
Motor
Vehicles
CMT REPORT (Corruption, Money Laundering & Terrorism]
The Public Notice information has been collected from various sources
including but not limited to: The Courts,
1] INFORMATION ON
DESIGNATED PARTY
No exist designating subject or any of its beneficial owners,
controlling shareholders or senior officers as terrorist or terrorist organization
or whom notice had been received that all financial transactions involving
their assets have been blocked or convicted, found guilty or against whom a
judgement or order had been entered in a proceedings for violating
money-laundering, anti-corruption or bribery or international economic or
anti-terrorism sanction laws or whose assets were seized, blocked, frozen or
ordered forfeited for violation of money laundering or international
anti-terrorism laws.
2] Court Declaration :
No exist to suggest that subject is or was
the subject of any formal or informal allegations, prosecutions or other
official proceeding for making any prohibited payments or other improper
payments to government officials for engaging in prohibited transactions or
with designated parties.
3] Asset Declaration :
No records exist to suggest that the property or assets of the subject
are derived from criminal conduct or a prohibited transaction.
4] Record on Financial
Crime :
Charges or conviction registered
against subject: None
5] Records on Violation of
Anti-Corruption Laws :
Charges or
investigation registered against subject: None
6] Records on Int’l
Anti-Money Laundering Laws/Standards :
Charges or
investigation registered against subject: None
7] Criminal Records
No
available information exist that suggest that subject or any of its principals
have been formally charged or convicted by a competent governmental authority
for any financial crime or under any formal investigation by a competent
government authority for any violation of anti-corruption laws or international
anti-money laundering laws or standard.
8] Affiliation with
Government :
No record
exists to suggest that any director or indirect owners, controlling shareholders,
director, officer or employee of the company is a government official or a
family member or close business associate of a Government official.
9] Compensation Package :
Our market
survey revealed that the amount of compensation sought by the subject is fair
and reasonable and comparable to compensation paid to others for similar
services.
10] Press Report :
No press reports / filings exists on
the subject.
CORPORATE GOVERNANCE
MIRA INFORM as part of its Due Diligence do provide comments on Corporate
Governance to identify management and governance. These factors often have been
predictive and in some cases have created vulnerabilities to credit
deterioration.
Our Governance Assessment focuses principally on the interactions
between a company’s management, its Board of Directors, Shareholders and other
financial stakeholders.
CONTRAVENTION
Subject is not known to have contravened any existing local laws,
regulations or policies that prohibit, restrict or otherwise affect the terms
and conditions that could be included in the agreement with the subject.
FOREIGN EXCHANGE RATES
|
Currency |
Unit
|
Indian Rupees |
|
US Dollar |
1 |
Rs.66.16 |
|
|
1 |
Rs.103.88 |
|
Euro |
1 |
Rs.75.89 |
INFORMATION DETAILS
|
Information Gathered
by : |
PRT |
|
|
|
|
Analysis Done by
: |
KAR |
|
|
|
|
Report Prepared
by : |
ARC |
SCORE & RATING EXPLANATIONS
|
SCORE FACTORS |
RANGE |
POINTS |
|
HISTORY |
1~10 |
7 |
|
PAID-UP CAPITAL |
1~10 |
6 |
|
OPERATING SCALE |
1~10 |
7 |
|
FINANCIAL CONDITION |
|
|
|
--BUSINESS SCALE |
1~10 |
7 |
|
--PROFITABILIRY |
1~10 |
7 |
|
--LIQUIDITY |
1~10 |
7 |
|
--LEVERAGE |
1~10 |
7 |
|
--RESERVES |
1~10 |
7 |
|
--CREDIT LINES |
1~10 |
7 |
|
--MARGINS |
-5~5 |
-- |
|
DEMERIT POINTS |
|
|
|
--BANK CHARGES |
YES/NO |
YES |
|
--LITIGATION |
YES/NO |
NO |
|
--OTHER ADVERSE INFORMATION |
YES/NO |
NO |
|
MERIT POINTS |
|
|
|
--SOLE DISTRIBUTORSHIP |
YES/NO |
NO |
|
--EXPORT ACTIVITIES |
YES/NO |
NO |
|
--AFFILIATION |
YES/NO |
YES |
|
--LISTED |
YES/NO |
YES |
|
--OTHER MERIT FACTORS |
YES/NO |
YES |
|
DEFAULTER |
|
|
|
--RBI |
YES/NO |
NO |
|
--EPF |
YES/NO |
NO |
|
TOTAL |
|
|
This score serves as a reference to assess SC’s credit risk
and to set the amount of credit to be extended. It is calculated from a
composite of weighted scores obtained from each of the major sections of this
report. The assessed factors and their relative weights (as indicated through
%) are as follows:
Financial
condition (40%) Ownership
background (20%) Payment
record (10%)
Credit history
(10%) Market trend
(10%) Operational
size (10%)
RATING EXPLANATIONS
|
RATING |
STATUS |
PROPOSED CREDIT LINE |
|
|
>86 |
Aaa |
Possesses an extremely sound financial base with the strongest
capability for timely payment of interest and principal sums |
Unlimited |
|
71-85 |
Aa |
Possesses adequate working capital. No caution needed for credit
transaction. It has above average (strong) capability for payment of interest
and principal sums |
Large |
|
56-70 |
A |
Financial & operational base are regarded healthy. General
unfavourable factors will not cause fatal effect. Satisfactory capability for
payment of interest and principal sums |
Fairly Large |
|
41-55 |
Ba |
Overall operation is considered normal. Capable to meet normal
commitments. |
Satisfactory |
|
26-40 |
B |
Capability to overcome financial difficulties seems comparatively below
average. |
Small |
|
11-25 |
Ca |
Adverse factors are apparent. Repayment of interest and principal sums
in default or expected to be in default upon maturity |
Limited with
full security |
|
<10 |
C |
Absolute credit risk exists. Caution needed to be exercised |
Credit not
recommended |
|
-- |
NB |
New Business |
-- |
This report is issued at your request without any
risk and responsibility on the part of MIRA INFORM PRIVATE LIMITED (MIPL) or
its officials.