MIRA INFORM REPORT
|
Report No. : |
351552 |
|
Report Date : |
01.12.2015 |
IDENTIFICATION DETAILS
|
Name : |
GAMESA EOLICA S.L. |
|
|
|
|
Registered Office : |
Avd. Ciudad De La Innovacion, 9 Nave, - Egues - 31621 – Navarra |
|
|
|
|
Country : |
Spain |
|
|
|
|
Financials (as on) : |
31.12.2014 |
|
|
|
|
Date of Incorporation : |
10.11.2006 |
|
|
|
|
Legal Form : |
Private Company |
|
|
|
|
LINE OF BUSINESS : |
MANUFACTURE
OF ELECTRIC MOTORS, GENERATORS AND TRANSFORMERS. |
|
|
|
|
No. of Employee : |
1758 |
RATING & COMMENTS
|
MIRA’s Rating : |
Ba |
|
RATING |
STATUS |
PROPOSED CREDIT LINE |
|
|
41-55 |
Ba |
Overall operation is considered normal. Capable to meet normal
commitments. |
Satisfactory |
|
Status : |
Good |
|
|
|
|
Payment Behaviour : |
Regular |
|
|
|
|
Litigation : |
Clear |
NOTES :
Any query related to this report can be made
on e-mail : infodept@mirainform.com
while quoting report number, name and date.
ECGC Country Risk Classification List – March 31, 2015
|
Country Name |
Previous Rating (31.12.2014) |
Current Rating (31.03.2015) |
|
Spain |
A1 |
A1 |
|
Risk Category |
ECGC
Classification |
|
Insignificant |
A1 |
|
Low |
A2 |
|
Moderate |
B1 |
|
High |
B2 |
|
Very High |
C1 |
|
Restricted |
C2 |
|
Off-credit |
D |
SPAIN ECONOMIC OVERVIEW
After experiencing
a prolonged recession in the wake of the global financial crisis that began in
2008, in 2014 Spain marked the first full year of positive economic growth in
seven years, largely due to increased private consumption. At the onset of the
global financial crisis Spain's GDP contracted by 3.7% in 2009, ending a
16-year growth trend, and continued contracting through most of 2013. In 2013
the government successfully shored up struggling banks - exposed to the
collapse of Spain's depressed real estate and construction sectors - and in
January 2014 completed an EU-funded restructuring and recapitalization program.
Until
2014, credit contraction in the private sector, fiscal austerity, and high
unemployment weighed on domestic consumption and investment. The unemployment
rate rose from a low of about 8% in 2007 to more than 26% in 2013, but labor
reforms prompted a modest reduction to 23.7% in 2014. High unemployment
strained Spain's public finances, as spending on social benefits increased
while tax revenues fell. Spain’s budget deficit peaked at 11.4% of GDP in 2010,
but Spain gradually reduced the deficit to just under 7% of GDP in 2013-14,
slightly above the 6.5% target negotiated between Spain and the EU. Public debt
has increased substantially – from 60.1% of GDP in 2010 to more than 97% in
2014.
Exports
were resilient throughout the economic downturn and helped to bring Spain's
current account into surplus in 2013 for the first time since 1986, where it
remained in 2014. Rising labor productivity and an internal devaluation
resulting from moderating labor costs and lower inflation have helped to
improve foreign investor interest in the economy and positive FDI flows have
been restored.
The
government's efforts to implement labor, pension, health, tax, and education
reforms - aimed at supporting investor sentiment - have become overshadowed by
political activity in 2015 in anticipation of the national parliamentary
elections in November. Spain’s 2015 budget, published in September 2014, rolls
back some recently imposed taxes in advance of the elections and leaves
untouched the country’s value-added tax (VAT) regime, which continues to
generate significantly lower revenue than the EU average. Spain’s borrowing
costs are dramatically lower since their peak in mid-2012, and despite the
recent uptic in economic activity, inflation has dropped sharply, from 1.5% in
2013 to nearly flat in 2014.
|
Source
: CIA |
EXECUTIVE
SUMMARY
|
|
|
|
|
|
Name: |
GAMESA
EOLICA S.L. |
|
NIF
/ Fiscal code: |
B31907330 |
|
Status: |
ACTIVE |
|
Incorporation
Date: |
10/11/2006 |
|
Register Data |
Register
Section 8 Sheet 25117 |
|
Last Publication in BORME: |
21/08/2015
[Power of attorney modification] |
|
Last
Published Account Deposit: |
2014 |
|
Share
Capital: |
200.500 |
|
|
|
|
Localization: |
AVD.
CIUDAD DE LA INNOVACION, 9 NAVE, - EGUES - 31621 - NAVARRA |
|
Telephone
- Fax - Email - Website: |
Telephone.
902 734 949 Email. info@gamesacorp.com Website. www.gamesacorp.com |
|
Number
of Branches |
18 |
|
|
|
|
Activity: |
|
|
NACE: |
2711
- Manufacture of electric motors, generators and transformers |
|
Registered
Trademarks: |
|
|
Audited
/ Opinion: |
Si
/ |
|
Tenders
and Awards: |
|
|
Subsidies: |
24
for a total cost of 22725000 |
|
Quality
Certificate: |
No |
|
|
|
|
Payment
Behaviour: |
According
to the agreed terms |
|
Prospects: |
Consolidation |
|
Industry
situation: |
Maturity |
|
|
|
|
Defaults, Legal Claims and
Insolvency Proceedings : |
|
|
|
|
|
|
|
Number |
Amount
(€) |
Most
Recent Entry |
|
Insolvency
Proceedings, Bankruptcy and Suspension of Payments |
|
Unpublished |
--- |
--- |
|
Defaults
on debt with Financial Institutions and Large Companies |
|
None |
--- |
--- |
|
Judicial
Claims (Notices, Executive Proceedings, Attachments, Auctions, Bad Debt) |
|
None |
0 |
--- |
|
Proceedings
heard by the Civil Court |
|
Unpublished |
0 |
--- |
|
Proceedings
heard by the Labour Court |
|
Unpublished |
0 |
--- |
|
|
|
Partners: |
|
|
|
GAMESA
ENERGIA SA |
100
% |
|
|
Shares: |
49 |
|
|
Other
Links: |
43 |
|
|
No.
of Active Corporate Bodies: |
SINGLE
ADMINISTRATOR 1 |
|
|
Ratios |
2014 |
2013 |
Change |
|
|
Nº
of employees: |
1758 |
|
|
|
|
|
|
|
Guarantees: |
|
|
Properties
Registered: |
Company
NO, Administrator NO |
|
Financing
/ Guarantee Sources : |
Sources
YES, Guarantees YES |
|
|
|
|
|
|
|
INVESTIGATION
SUMMARY |
|
|
This
company was incorporated in 2006 and it's engaged in the design, manufacture
and sale of wind turbines and their components. It develops its activity at a
national and international level. It's part of the group GAMESA, one of the
main wind turbine producers worldwide. It's part of the exclusive group
forming IBEX 35. There is nothing against registered among the sources
consulted. For all these reasons, we consider the company to keep being
related in terms of risk operations in keeping with its size. |
|
|
Interviewed
Person: |
|
|
Enquiry Details ----- |
|
Identification
|
|
|
Social Denomination: |
GAMESA EOLICA S.L. |
|
NIF / Fiscal code: |
B31907330 |
|
Corporate Status: |
ACTIVE |
|
Start of activity: |
2006 |
|
Registered Office: |
AVD. CIUDAD DE LA
INNOVACION, 9 NAVE, |
|
Locality: |
EGUES |
|
Province: |
NAVARRA |
|
Postal Code: |
31621 |
|
Telephone: |
902 734 949 |
|
Fax: |
948 165 039 |
|
Website: |
www.gamesacorp.com |
|
Email: |
info@gamesacorp.com |
|
Interviewed Person: |
The hereby information has
been obtained through indirect sources in light of the people responsible for
the subject company refusing to collaborate with the present work |
|
Branch
Offices
|
|
|
|
|
|
Address |
Postal Code |
City |
Province |
|
CALLE CONCEPCION 18 3 |
02002 |
ALBACETE |
ALBACETE |
|
CALLE CONDADO DE TREVIÑO 11 |
09001 |
BURGOS |
BURGOS |
|
CALLE MANUEL DE SANDOVAL 5 1 3 |
14008 |
CORDOBA |
CORDOBA |
|
VIA DE PASTEUR PG TAMBRE |
15898 |
SANTIAGO DE COMPOSTELA |
LA CORUÑA |
|
CARRETERA VALENCIA PG PALANCARES |
16004 |
CUENCA |
CUENCA |
|
CALLE RAPOSAL 14 |
26580 |
ARNEDO |
LA RIOJA |
|
CALLE MARCONI 10 |
28823 |
COSLADA |
MADRID |
|
CALLE RAMIREZ DE ARELLANO 37 |
28043 |
MADRID |
MADRID |
|
CALLE DECANO ANTONIO ZEDANO 3 2 2 37 |
29620 |
TORREMOLINOS |
MALAGA |
|
CALLE CABARCENO |
31621 |
EGUES |
NAVARRA |
|
POLIGONO CIUDAD DEL TRANSPORTE 15 EUROPA |
31119 |
NOAIN (VALLE DE ELORZ)/NOAIN (ELORTZIBAR) |
NAVARRA |
|
CALLE MIRAVALLES 4 |
31191 |
BERIAIN |
NAVARRA |
|
CALLE TECNOLOGICO ASTURIAS 2 ED |
33690 |
LLANERA |
ASTURIAS |
|
CALLE OLIVOS LOS 128 2 |
35118 |
AGUIMES |
LAS PALMAS |
|
AVENIDA SAN FRANCISCO JAVIER 15 ED CAPITO 4 |
41005 |
SEVILLA |
SEVILLA |
|
CALLE DE LA CONSTRUCCION 11 ROMERAL |
46340 |
REQUENA |
VALENCIA |
|
CARRETERA POZALDEZ |
47400 |
MEDINA DEL CAMPO |
VALLADOLID |
|
POLIGONO INDUSTRIAL LAS ROZAS |
50660 |
TAUSTE |
ZARAGOZA |
Activity
|
|
|
NACE: |
2711 |
|
Legal Form: |
DESIGN, MANUFACTURE, TRADE, PROMOTION AND SALE OF WIND TURBINES AND ALL ITS COMPONENTS. DEVELOPMENT, COMMERCIALIZATION, AND PROMOTION OF WIND ENERGY PLANTS. PARTICIPATE IN THE MAINTENANCE AND OPERATION OF WIND ENERY PLANTS. |
|
Additional Information: |
Desing, manufacture and sale of wind turbines. |
|
Additional Address: |
Registered office and offices AVENIDA CIUDAD DE LA INNOVACION, 9 NAVE,, 31621, EGUES, NAVARRA |
|
Franchise: |
No |
|
Import / export: |
EXPORTS |
|
Future Perspective: |
Consolidation |
|
Industry situation: |
Maturity |
Number
of Employees
|
|
|
Year |
No. of employees |
Established |
Incidentals |
|
|
|
2014 |
1758 |
|
|
|
The data of employees is from the latest available financial statements in axesor. Failing that, are estimates data calculated by statistical methods
Chronological
Summary
|
|||
|
|
|
|
|
|
|
Year |
Act |
|
|
|
2006 |
Appointments/ Re-elections (1) Change of Social Denomination (3) Company Formation (1) Declaration of Sole Propietorship (1) Take-over Merger (3) |
|
|
|
2007 |
Appointments/ Re-elections (4) Change of Social Denomination (1) Other Concepts/ Events (5) Take-over Merger (1) |
|
|
|
2008 |
Accounts deposit (year 2006, 2007) Appointments/ Re-elections (1) Cessations/ Resignations/ Reversals (1) Change of Social address (1) Correction (1) Other Concepts/ Events (3) Take-over Merger (5) |
|
|
|
2009 |
Accounts deposit (year 2008) Appointments/ Re-elections (4) Cessations/ Resignations/ Reversals (1) Other Concepts/ Events (3) Take-over Merger (1) |
|
|
|
2010 |
Accounts deposit (year 2009) Appointments/ Re-elections (2) Cessations/ Resignations/ Reversals (1) Other Concepts/ Events (2) Take-over Merger (2) |
|
|
|
2011 |
Accounts deposit (year 2010) Appointments/ Re-elections (5) Cessations/ Resignations/ Reversals (1) Other Concepts/ Events (1) Take-over Merger (1) |
|
|
|
2012 |
Accounts deposit (year 2011) Appointments/ Re-elections (2) Cessations/ Resignations/ Reversals (1) Increase of Capital (1) Other Concepts/ Events (1) Take-over Merger (4) |
|
|
|
2013 |
Accounts deposit (year 2012) Appointments/ Re-elections (2) |
|
|
|
2014 |
Accounts deposit (year 2013) Appointments/ Re-elections (2) Take-over Merger (2) |
|
|
|
2015 |
Accounts deposit (year 2014) Appointments/ Re-elections (3) Cessations/ Resignations/ Reversals (3) Modification of Powers (1) Other Concepts/ Events (1) Take-over Merger (1) |
|
Breakdown
of Owners' Equity
|
|
|
Registered Capital: |
200.500 |
|
Paid up capital: |
200.500 |
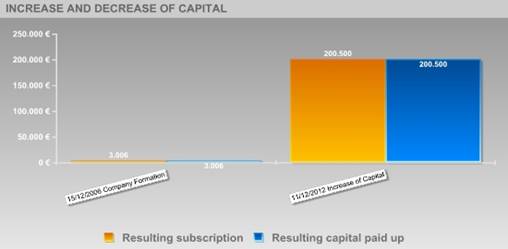
Updated
Evolution of the Subscribed and Paid-in Capital
|
|||||
|
|
|||||
|
|
|
|
|
|
|
|
Publishing Date |
Registration Type |
Capital Subscribed |
Paid up capital |
Underwritten result |
Disbursed Result |
|
15/12/2006 |
Company Formation |
3.006 |
3.006 |
3.006 |
3.006 |
|
11/12/2012 |
Increase of Capital |
197.494 |
197.494 |
200.500 |
200.500 |
Active
Social Bodies
|
|
Post published |
Social Body's Name |
Appointment Date |
Other Positions in this Company |
|
SINGLE PARTNER |
GAMESA ENERGIA SA |
15/12/2006 |
2 |
|
SINGLE ADMINISTRATOR |
GAMESA ENERGIA SA |
15/12/2006 |
2 |
|
PROXY |
LOPEZ GARCIA PEDRO |
19/05/2015 |
4 |
|
|
IÑARRITU IBARRECHE JUAN RAMON |
19/05/2015 |
6 |
|
|
SUAREZ GUTIERREZ HIPOLITO |
19/05/2015 |
2 |
|
|
TREVIÑO IZQUIERDO JAVIER |
19/05/2015 |
3 |
|
|
GARMENDIA ZARANDONA MANUEL |
19/05/2015 |
3 |
|
|
PONCELA SAMPEDRO FRANCISCO JAVIER |
19/05/2015 |
1 |
|
|
CORTAJARENA MANCHADO JOSE ANTONIO |
19/05/2015 |
4 |
|
|
GONZALEZ RIOS NEREA |
19/05/2015 |
3 |
|
|
LEZAUN GOÑI ENRIQUE |
19/05/2015 |
4 |
|
|
LARRAÑETA NIDO JOHN PAUL |
19/05/2015 |
3 |
|
|
PEDROSA GOMEZ ENRIQUE |
19/05/2015 |
4 |
|
|
GELDHOF WIM |
19/05/2015 |
2 |
|
|
ETXEBERRIA MUGURUZA PATXI XABIER |
19/05/2015 |
2 |
|
|
CONNELL THOMAS WILLIAM |
19/05/2015 |
3 |
|
|
ECHEVARRIA SARASQUETA DAVID |
19/05/2015 |
3 |
|
|
COLOMA FERNANDEZ GONZALO |
19/05/2015 |
2 |
|
|
MESONERO MOLINA DAVID JOSE |
19/05/2015 |
1 |
|
|
GONZALEZ RUIZ-JARABO JESUS |
19/05/2015 |
1 |
|
|
ZHENG LILI |
19/05/2015 |
1 |
|
|
ARTAZCOZ BARRENA IGNACIO |
19/05/2015 |
2 |
|
|
HERNANDEZ DEL TESO ANGEL |
19/05/2015 |
1 |
|
|
NICUESA CHACON GAIZKA |
19/05/2015 |
4 |
|
|
LARGO SEISDEDOS JOSE RAMON |
19/05/2015 |
1 |
|
|
BILBAO MORAN ALVARO |
19/05/2015 |
2 |
|
|
PARIS BAJOS LUCIA |
19/05/2015 |
2 |
|
|
LARRETXI BURGOS JOSE IGNACIO |
19/05/2015 |
3 |
|
|
CAAMAÑO MARTINEZ LUIS CLAUDIO |
19/05/2015 |
1 |
|
|
GARCIA CORONADO JESUS MARIA |
19/05/2015 |
2 |
|
|
MIRANDA SOTO JOSE ANTONIO |
19/05/2015 |
1 |
|
|
VALLDEPERES LOPEZ FERNANDO |
19/05/2015 |
3 |
|
|
GARCIA FUENTE JUAN ANTONIO |
19/05/2015 |
3 |
|
|
SUNYER FOLCH ALBERT |
19/05/2015 |
1 |
|
|
CABEZUDO PUEYO JAVIER |
19/05/2015 |
1 |
|
|
CHOCARRO MELGOSA RICARDO |
19/05/2015 |
3 |
|
|
GUTIERREZ GARCIA CARLOS JESUS |
19/05/2015 |
2 |
|
|
LAUCIRICA LARRINAGA ANTONIO EDUARDO |
19/05/2015 |
3 |
|
|
ARZOZ BERAMENDI FRANCISCO JAVIER |
19/05/2015 |
2 |
|
|
MENDEZ RAMOS ITZELL |
19/05/2015 |
1 |
|
|
HIJAS RODRIGUEZ ALBERTO |
19/05/2015 |
1 |
|
|
PALAO BASTARDES ROBIN |
19/05/2015 |
1 |
|
|
RONHOLM NIELSEN MIKAEL |
19/05/2015 |
1 |
|
|
CAMPOS SAN ROMAN JAVIER ANTONIO |
19/05/2015 |
1 |
|
|
TATTERSFIELD PETER PAUL |
19/05/2015 |
1 |
|
|
SABALZA GOYENECHE ROBERTO |
19/05/2015 |
1 |
|
|
ARRIZABALAGA ALBERDI JAVIER |
19/05/2015 |
1 |
|
|
MURGIONDO GOROSTIDI IÑAKI |
19/05/2015 |
1 |
|
|
FERNANDEZ ROMERO LUIS ALBERTO |
19/05/2015 |
1 |
|
|
URDANOZ PEREZ DE OBANOS FRANCISCO JAVIER |
19/05/2015 |
1 |
|
|
GARCIA LOS ARCOS PAULA |
19/05/2015 |
1 |
|
|
DELMAS THIERRY AIME |
19/05/2015 |
1 |
|
|
PIERRE SANCHEZ JEAN |
19/05/2015 |
1 |
|
|
PEREA FRANCES JAVIER |
21/06/2007 |
1 |
|
REPRESENTATIVE |
GERMAN GONZALEZ AVECILLA |
27/04/2015 |
1 |
|
|
CISNEROS HUMARAN IÑIGO |
09/11/2007 |
4 |
|
ACCOUNTS' AUDITOR / HOLDER |
ERNST & YOUNG SL |
15/01/2015 |
1 |
Historical
Social Bodies
|
|
Social Body's Name |
Post published |
End Date |
Other Positions in this Company |
|
ARTAZCOZ BARRENA IGNACIO |
PROXY |
19/05/2015 |
2 |
|
ARZOZ BERAMENDI FRANCISCO JAVIER |
PROXY |
19/05/2015 |
2 |
|
BERMEJO BERAZA MAITE |
PROXY |
19/05/2015 |
1 |
|
BILBAO MORAN ALVARO |
PROXY |
19/05/2015 |
2 |
|
BLANCO DIEGUEZ JOSE LUIS |
PROXY |
14/10/2011 |
2 |
|
|
PROXY |
04/05/2012 |
|
|
CALVET SPINATSCH JORGE |
PROXY |
19/05/2015 |
1 |
|
CAMPOS SANROMAN JAVIER ANTONIO |
PROXY |
19/05/2015 |
2 |
|
|
PROXY |
11/12/2013 |
|
|
CHOCARRO MELGOSA RICARDO |
PROXY |
11/12/2013 |
3 |
|
|
PROXY |
19/05/2015 |
|
|
CISNEROS HUMARAN IÑIGO |
PROXY |
03/10/2008 |
4 |
|
|
PROXY |
07/11/2008 |
|
|
|
PROXY |
04/05/2012 |
|
|
COLOMA FERNANDEZ GONZALO |
PROXY |
19/05/2015 |
2 |
|
CONNELL THOMAS WILLIAM |
PROXY |
11/12/2013 |
3 |
|
|
PROXY |
19/05/2015 |
|
|
CORROCHANO EDGARD |
PROXY |
19/05/2015 |
1 |
|
CORTAJARENA MANCHADO JOSE ANTONIO |
PROXY |
11/12/2013 |
4 |
|
|
PROXY |
19/05/2015 |
|
|
|
REPRESENTATIVE |
27/04/2015 |
|
|
DELOITTE S L |
ACCOUNTS' AUDITOR / HOLDER |
10/01/2011 |
2 |
|
|
ACCOUNTS' AUDITOR / HOLDER |
24/11/2011 |
|
|
DELOITTE SL |
ACCOUNTS' AUDITOR / HOLDER |
11/12/2009 |
2 |
|
|
ACCOUNTS' AUDITOR / HOLDER |
10/01/2011 |
|
|
DIAZ VEGA JUAN DIEGO |
PROXY |
19/05/2015 |
1 |
|
ECHEVARRIA SARASQUETA DAVID |
PROXY |
11/12/2013 |
3 |
|
|
PROXY |
19/05/2015 |
|
|
ETXEBERRIA MUGURUZA PATXI XABIER |
PROXY |
19/05/2015 |
2 |
|
FERNANDEZ DE VELASCO MUÑOZ CESAR |
PROXY |
07/11/2008 |
1 |
|
FERNANDEZ MARTIN DEL CAMPO JUANA MARIA |
PROXY |
03/10/2008 |
3 |
|
|
PROXY |
07/11/2008 |
|
|
|
PROXY |
19/05/2015 |
|
|
GARCIA CORONADO JESUS MARIA |
PROXY |
19/05/2015 |
2 |
|
GARCIA FUENTE JUAN ANTONIO |
PROXY |
11/12/2013 |
3 |
|
|
PROXY |
19/05/2015 |
|
|
GARCIA ROMEU QUINZA JOSE ENRIQUE |
PROXY |
19/05/2015 |
1 |
|
GARMENDIA ZARANDONA MANUEL |
PROXY |
11/12/2013 |
3 |
|
|
PROXY |
19/05/2015 |
|
|
GELDHOF WIM |
PROXY |
19/05/2015 |
2 |
|
GELDHOF WIN |
PROXY |
19/05/2015 |
2 |
|
|
PROXY |
06/04/2009 |
|
|
GIMENEZ SAINZ DE LA MAZA IÑIGO |
PROXY |
03/10/2008 |
3 |
|
|
PROXY |
07/11/2008 |
|
|
|
PROXY |
04/05/2012 |
|
|
GONZALEZ AVECILLA GERMAN |
PROXY |
11/12/2013 |
3 |
|
|
PROXY |
07/10/2014 |
|
|
|
PROXY |
19/05/2015 |
|
|
GONZALEZ RIOS NEREA |
PROXY |
11/12/2013 |
3 |
|
|
PROXY |
19/05/2015 |
|
|
GUTIERREZ GARCIA CARLOS JESUS |
PROXY |
19/05/2015 |
2 |
|
IÑARRITU IBARRECHE JUAN RAMON |
PROXY |
03/10/2008 |
6 |
|
|
PROXY |
07/11/2008 |
|
|
|
PROXY |
24/05/2010 |
|
|
|
PROXY |
11/12/2013 |
|
|
|
PROXY |
19/05/2015 |
|
|
JOURDAIN CHRISTIAN |
PROXY |
14/10/2011 |
1 |
|
LABBE TANGUY |
PROXY |
06/04/2009 |
2 |
|
|
PROXY |
19/05/2015 |
|
|
LABBE TANGUY JEAN |
PROXY |
19/05/2015 |
1 |
|
LARRAÑETA NIDO JOHN PAUL |
PROXY |
11/12/2013 |
3 |
|
|
PROXY |
19/05/2015 |
|
|
LARRETXI BURGOS JOSE IGNACIO |
PROXY |
11/12/2013 |
3 |
|
|
PROXY |
19/05/2015 |
|
|
LAS SANTAFE ENRIQUE |
PROXY |
19/05/2015 |
1 |
|
LAS SANTAFE JOSE ENRIQUE |
PROXY |
19/05/2015 |
1 |
|
LASA IMAZ MIKEL |
PROXY |
03/10/2008 |
4 |
|
|
PROXY |
07/11/2008 |
|
|
|
PROXY |
11/12/2013 |
|
|
|
PROXY |
19/05/2015 |
|
|
LAUCIRICA LARRINAGA ANTONIO EDUARDO |
PROXY |
11/12/2013 |
3 |
|
|
PROXY |
19/05/2015 |
|
|
LEZAMIZ CORTAZAR JON |
PROXY |
07/11/2008 |
1 |
|
LEZAUN GOÑI ENRIQUE |
PROXY |
06/04/2009 |
4 |
|
|
PROXY |
19/05/2015 |
|
|
|
PROXY |
11/12/2013 |
|
|
LOPEZ GARCIA PEDRO |
PROXY |
06/04/2009 |
4 |
|
|
PROXY |
24/05/2010 |
|
|
|
PROXY |
19/05/2015 |
|
|
LOPEZ GARCIA PEDRO JOSE |
PROXY |
19/05/2015 |
1 |
|
MALUMBRES GARCIA JOSE ANTONIO |
PROXY |
11/12/2013 |
2 |
|
|
PROXY |
19/05/2015 |
|
|
MARTIN NEGRETE JOSE IGNACIO |
PROXY |
19/05/2015 |
2 |
|
|
PROXY |
11/12/2013 |
|
|
NICUESA CHACON GAIZKA |
PROXY |
03/10/2008 |
4 |
|
|
PROXY |
07/11/2008 |
|
|
|
PROXY |
19/05/2015 |
|
|
OLLOQUI MALUMBRES JAVIER |
PROXY |
07/11/2008 |
1 |
|
PARDO LOPEZ LUIS MIGUEL |
PROXY |
24/05/2010 |
1 |
|
PARIS BAJOS LUCIA |
PROXY |
19/05/2015 |
2 |
|
PEDROSA GOMEZ ENRIQUE |
PROXY |
11/12/2013 |
4 |
|
|
PROXY |
06/04/2009 |
|
|
|
PROXY |
19/05/2015 |
|
|
PEREA SAENZ DE BURUAGA JAVIER |
PROXY |
07/11/2008 |
2 |
|
|
PROXY |
19/05/2015 |
|
|
PONCELA SAMPEDRO JAVIER |
PROXY |
03/10/2008 |
3 |
|
|
PROXY |
07/11/2008 |
|
|
|
PROXY |
19/05/2015 |
|
|
PRICEWATERHOUSECOOPERS SL |
ACCOUNTS' AUDITOR / HOLDER |
15/01/2015 |
1 |
|
QUILEZ SARDA CRISTINA |
PROXY |
06/04/2009 |
3 |
|
|
PROXY |
04/05/2012 |
|
|
|
PROXY |
19/05/2015 |
|
|
SAEZ DE VICUÑA ORTUETA IRUNE |
PROXY |
07/11/2008 |
1 |
|
SANCHEZ-ALCITURRI DIEZ LUIS |
PROXY |
19/05/2015 |
1 |
|
SARRASIN GOMEZ DAVID |
PROXY |
03/10/2008 |
3 |
|
|
PROXY |
07/11/2008 |
|
|
|
PROXY |
19/05/2015 |
|
|
SUAREZ GUTIERREZ HIPOLITO |
PROXY |
19/05/2015 |
2 |
|
TREVIÑO IZQUIERDO JAVIER |
PROXY |
11/12/2013 |
3 |
|
|
PROXY |
19/05/2015 |
|
|
ULACIA ARNAIZ GUILLERMO |
PROXY |
16/11/2009 |
1 |
|
URDANOZ PEREZ DE OBANOS JAVIER |
PROXY |
03/10/2008 |
3 |
|
|
PROXY |
07/11/2008 |
|
|
|
PROXY |
19/05/2015 |
|
|
VALLDEPERES LOPEZ FERNANDO |
PROXY |
11/12/2013 |
3 |
|
|
PROXY |
19/05/2015 |
|
Executive
board
|
|
Post |
NIF |
Name |
|
FINANCIAL MANAGER |
|
IGNACIO ARTÁZCOZ |
|
DIRECTOR/GENERAL MANAGER |
|
XABIER ETXEBERRÍA |
Defaults,
Legal Claims and Insolvency Proceedings
|
Section enabling assessment of the degree of compliance of the company queried with its payment obligations. It provides information on the existence and nature of all stages of Insolvency and Legal Proceedings published with reference to the Company in the country's various Official Bulletins and national newspapers, as well Defaults Registered in the main national credit bureaus (ASNEF Industrial and RAI ).
> Summary
Chronological summary
|
|
|
Number
of Publications |
Amount
(_) |
Start
date |
End
date |
|
Insolvency
Proceedings, Bankruptcy and Suspension of Payments |
|
Unpublished |
--- |
--- |
--- |
|
Request/Declaration |
|
0 |
--- |
date |
|
|
Proceedings |
|
--- |
--- |
|
--- |
|
Resolution |
|
--- |
--- |
|
--- |
|
Defaults
on debt with Financial Institutions and Large Companies |
Bank
and Commercial Delinquency |
None |
0 |
|
|
|
Status:
Friendly |
|
--- |
|
|
|
|
Status:
Pre-Litigation |
|
--- |
|
|
|
|
Status:
Litigation |
|
--- |
|
|
|
|
Status:
Non-performing |
|
--- |
|
|
|
|
Status:
insolvency proceedings, bankruptcy and suspension of payments |
|
--- |
|
|
|
|
Other
status |
|
--- |
|
|
|
|
Legal
and Administrative Proceedings |
|
Unpublished |
--- |
|
|
|
Notices
of defaults and enforcement |
|
--- |
--- |
|
--- |
|
Seizures |
|
--- |
--- |
|
--- |
|
Auctions |
|
--- |
--- |
|
--- |
|
Declarations
of insolvency and bad debt |
|
--- |
--- |
|
--- |
|
Proceedings
heard by the Civil Court |
|
Unpublished |
--- |
|
|
|
Proceedings heard by the Labour Court |
|
Unpublished |
--- |
|
|
> Basis for
scoring
|
Positive Factors |
Adverse Factors |
|
No judicial claims have been detected in the Official Gazettes, regarding any Entity's outstanding debts with the Tax Bureau or Social Security administrations, as submitted by Courts of the various court jurisdictions. GAMESA EOLICA SL 's borrowing cost is appropriate according to its volume of external financing sources. The development of the structure of the debt during the last two years indicates a decrease of the debt with credit institutions and trade creditors in respect to all liabilities. The lower the level of debt, the lower the dependence on suppliers capital and the more guarantee will have its financial situation. Significant operating income. The Company has the necessary return on the investments for its main activity in comparison with its assets. This return is higher than that of the financial year 2013 which means that the company's financial situation has improved. It presents a efficient productivity. EBITDA shows adequate company costs management as income exceed operating expenses. |
It has been found to have irregular payment performance at the credit bureaus, although it is not relevant enough to change the rating. GAMESA EOLICA SL it presents an excessive indebtedness that may compromise their balance sheet. GAMESA EOLICA SL 's Working Capital is negative, which means, in principle, that its capacity to pay debts maturing within a year using its resources available in the short run is insufficient. GAMESA EOLICA SL presents a low turnover of the current assets , which could indicate an inefficient use of non-current assets due to the lacking of enough operating income capacity based on the dedicated assets available for sale. |
LEGAL
CLAIMS
|
|
Summary of Judicial Claims |
|
|
|
|
|
|
|
|
||
|
|
|
No
se han publicado |
|
|
|
|
No
se han publicado |
|
|
|
|
||
|
|
|
No
se han publicado |
|
|
|
|
No
se han publicado |
|
|
|
|
No
se han publicado |
|
|
|
|
No
se han publicado |
|
|
|
|
||
|
|
|
No
se han publicado |
|
|
|
|
No
se han publicado |
|
|
|
|
||
|
|
|
No
se han publicado |
|
Link
List
|
|
PARTICIPATES IN: |
49 Entities |
|
SHAREHOLDERS: |
1 Entities |
|
RESULTING FROM THE TOTAL SPIN-OFF: |
2 Entities |
|
ABSORBS TO: |
12 Entities |
|
BELONGS TO THE ADMINISTRATION BOARD OF: |
3 Entities |
|
HAS IN ITS ADMINISTRATION BOARD TO: |
1 Entities |
|
IS RELATED WITH: |
24 Entities |
|
RESULT OF THE PARTIAL SPIN-OFF OF: |
1 Entities |
> Shareholders
|
Relationship |
Entity |
Province |
Shareholding stake |
|
SHAREHOLDERS |
GAMESA ENERGIA SA |
VIZCAYA |
100 |
|
PARTICIPATES IN |
EOLICAS CANARIAS SOCIEDAD LIMITADA |
LAS PALMAS |
20 |
|
|
GAMESA WIND ENGINEERING APS |
|
100 |
|
|
ESTRUCTURAS METALICAS SINGULARES SA |
NAVARRA |
100 |
|
|
GAMESA EOLICA ITALIA, S.L. |
|
100 |
|
|
GAMESA INNOVATION AND TECHNOLOGY SL |
NAVARRA |
100 |
|
|
GAMESA EOLICA DEUTSCHLAND, SOCIEDAD ANONIMA, (ALEMANIA) |
|
100 |
|
|
GAMESA WIND POLAND SP ZOO |
|
100 |
|
|
GAMESA BLADE TIANJIN CO, S.A. |
|
100 |
|
|
GAMESA EOLICA MEXICO, S.A. |
|
100 |
|
|
GAMESA JAPAN KK |
|
100 |
|
|
GAMESA WIND TIANJIN CO, S.A. |
|
100 |
|
|
PARQUE EOLICO DOS PICOS SOCIEDAD LIMITADA |
VIZCAYA |
100 |
|
|
GAMESA EOLICA GREECE EPE |
|
100 |
|
|
GAMESA II EOLICA PORTUGAL SUL |
|
100 |
|
|
GAMESA WIND TURBINES PTV LDA |
|
82 |
|
|
GAMESA WIND ROMANIA, S.L. |
|
99 |
|
|
GAMESA MOROCCO SARL |
|
99 |
|
|
GAMESA WIND BULGARIA EOOD |
|
100 |
|
|
GAMESA CANADA ULC |
|
100 |
|
|
GAMESA EOLICA COSTA RICA |
|
100 |
|
|
GAMESA IRELAND, S.A. |
|
100 |
|
|
GAMESA EOLICA BRASIL, S.A. |
|
100 |
|
|
GAMESA EOLICA VE CA |
|
99 |
|
|
GAMESA LANKA PRIVATE, S.A. |
|
100 |
|
|
GAMESA WIND UK, S.A. |
|
100 |
|
|
GAMESA EOLICA FRANCIA, SOCIEDAD ANONIMA, R.L. |
|
100 |
|
|
GAMESA EOLICA SINGAPORE PRIVATE, S.A. |
|
100 |
|
|
GAMESA RUZGAR ENERJIST SERVIS, SOCIEDAD ANONIMA, SIRKETU |
|
99 |
|
|
GAMESA WIND HUNGARY KTG |
|
100 |
|
|
GAMESA AUSTRALIA. PTY, S.A. |
|
100 |
|
|
GAMESA AZERBAIJAN LLC |
|
100 |
|
|
GAMESA CHILE SPA |
|
100 |
|
|
GAMESA CYPRUS, S.A. |
|
100 |
|
|
GAMESA NEW ZELAND, S.A. |
|
100 |
|
|
GAMESA WIND SOUTH AFRICA PTY, S.A. |
|
100 |
|
|
GAMESA EOLICA HONDURAS, S.A. |
|
100 |
|
|
GAMESA EOLICA NICARAGUA |
|
100 |
|
|
GAMESA DOMINICANA SAS |
|
100 |
|
|
GAMESA PUERTO RICO CRL |
|
100 |
|
|
GAMESA KENYA, SOCIEDAD ANONIMA, S.L. |
|
100 |
|
|
SERVICIOS EOLICOS GLOBALES, SOCIEDAD LIMITADA, DE CV (MEXICO) |
|
1 |
|
|
GAMESA ESTONIA EU |
|
100 |
|
|
GAMESA FINLAND OY |
|
100 |
|
|
GAMESA TAIWAN, S.A. |
|
100 |
|
|
GAMESA URUGUAY, SOCIEDAD LIMITADA, R. |
|
99 |
|
|
GAMESA WIND SWEDEN AB LDA |
|
100 |
|
|
GAMESA MAURITANIA SARL |
|
100 |
|
|
GESA EOLICA DE HONDURAS, S.A. |
|
100 |
|
|
GAMESA ENERGETICOS ALMODAR DEL RIO, S.L. |
|
100 |
> Other
relationships
|
Relationship |
Entity |
Province |
Shareholding stake |
|
IS RELATED WITH |
| | |
|
|
|
|
ALMODOVAR DEL RIO |
|
|
|
|
DZLALDOWO SP ZOO |
|
|
|
|
ENERGIAKI PILOU METHONIS, S.A. |
|
|
|
|
EOLICA DOS ARBOLITOS, SOCIEDAD ANONIMA, P.I. DE CV |
|
|
|
|
EOLICA EL RETIRO, SOCIEDAD ANONIMA, P.I. DE CV |
|
|
|
|
GALLEON WIND POLAND 5PZOU |
|
|
|
|
GAMESA EOLICA HONDURAS, S.A. |
|
|
|
|
GAMESA EOLICA TURQUIA |
|
|
|
|
GAMESA NICARAGUA |
|
|
|
|
GAMESA WIND HUNGARY RIG |
|
|
|
|
GESA EOLICA MEXICO, SOCIEDAD ANONIMA, DE CV |
|
|
|
|
GESA EOLICA TURQUIA |
|
|
|
|
IBERENOVA PROMOCIONES SA |
MADRID |
|
|
|
IBEREOLICA HEDROSO ACIBEROS SA |
MADRID |
|
|
|
9REN ESPAÑA SL |
MADRID |
|
|
|
PARQUE EOLICO EL MORAL SL |
MADRID |
|
|
|
AGRAGUA SOCIEDAD ANONIMA |
LAS PALMAS |
|
|
|
IBEREOLICA LUBIAN SA |
MADRID |
|
|
IS RELATED WITH |
IBERDROLA RENOVABLES CASTILLA LA MANCHA SA |
TOLEDO |
|
|
|
GAMESA ENERGIA SA |
VIZCAYA |
|
|
|
ESPECIAL GEAR TRANSMISSIONS SOCIEDAD ANONIMA |
VIZCAYA |
|
|
|
GAMESA ELECTRIC POWER SYSTEMS SL |
MADRID |
|
|
|
OLIVENTO S.L. |
MADRID |
|
|
|
VALENCIA POWER CONVERTERS SA |
VALENCIA |
|
|
ABSORBS TO |
COMPONENTES EOLICOS ALBACETE SOCIEDAD ANONIMA |
ALBACETE |
|
|
|
ESTRUCTURAS EOLICAS MIRANDA SA |
BURGOS |
|
|
|
GAMESA EOLICA SA |
NAVARRA |
|
|
|
COMPONENTES EOLICOS CUENCA SA |
NAVARRA |
|
|
|
MONTAJES EOLICOS AGREDA SA |
NAVARRA |
|
|
|
MANTENIMIENTOS EOLICOS GAMESA RIOJA SL |
LA RIOJA |
|
|
|
MONTAJES EOLICOS TAUSTE SA |
ZARAGOZA |
|
|
|
CASANDRA ENERGY SERVICES SA |
MADRID |
|
|
|
GAMESA ENERGIA AZNALCOLLAR SOCIEDAD ANONIMA |
SEVILLA |
|
|
|
MADE TECNOLOGIAS RENOVABLES SA |
MADRID |
|
|
|
GAMESA NUEVOS DESARROLLOS SOCIEDAD ANONIMA |
VIZCAYA |
|
|
|
COMPASS TRANSWORLD LOGISTICS SA |
NAVARRA |
|
|
RESULT OF THE PARTIAL SPIN-OFF OF |
GAMESA INNOVATION AND TECHNOLOGY SLU |
NAVARRA |
|
|
|
GAMESA POWER SYSTEMS SOCIEDAD ANONIMA |
VIZCAYA |
|
|
RESULTING FROM THE TOTAL SPIN-OFF |
APOYOS Y ESTRUCTURAS METALICAS SA |
NAVARRA |
|
|
HAS IN ITS ADMINISTRATION BOARD TO |
GAMESA ENERGIA SA |
VIZCAYA |
|
|
BELONGS TO THE ADMINISTRATION BOARD OF |
ESTRUCTURAS METALICAS SINGULARES SA |
NAVARRA |
|
|
|
PARQUE EOLICO DOS PICOS SOCIEDAD LIMITADA |
VIZCAYA |
|
|
|
GAMESA INNOVATION AND TECHNOLOGY SL |
NAVARRA |
|
Turnover
|
|
|
Total Sales 2014 |
1.228.348.000 |
The sales data is from the latest available financial statements in axesor. Failing that, are estimates data calculated by statistical methods.
Financial
Accounts and Balance Sheets
|
Financial Years Presented
|
Ejercicio |
Tipo de Cuentas Anuales |
Fecha Presentacion |
|
2014 |
Normales |
September 2015 |
|
2013 |
Normales |
August 2014 |
|
2012 |
Normales |
August 2013 |
|
2011 |
Normales |
August 2012 |
|
2010 |
Normales |
November 2011 |
|
2009 |
Normales |
August 2010 |
|
2008 |
Normales |
August 2009 |
|
2007 |
Normales |
August 2008 |
|
2006 |
Normales |
January 2008 |
The data in the report regarding the last Company Accounts submitted by the company is taken from the TRADE REGISTER serving the region in which the company's address is located 31/12/2014
> Normal format Balance in accordance with the New Accounting Plan 2007
Information
corresponding to the fiscal year
2014 2013 2012 2011 2010 is taken from information
submitted to the TRADE REGISTER. Data corresponding to fiscal years before
2014 2013 2012 2011 2010 has been compiled based on
the equivalence criteria stipulated in Act JUS/206/2009. To view details on the
methodology.
|
|
ORIGINAL |
ORIGINAL |
ORIGINAL |
ORIGINAL |
ORIGINAL |
|
|
Assets |
2014 |
2013 |
2012 |
2011 |
2010 |
|
|
A)
NON-CURRENT ASSETS: 11000 |
1.056.971.000,00 |
772.287.000,00 |
630.775.000,00 |
532.577.000,00 |
442.149.000,00 |
|
|
I. Intangible fixed assets : 11100 |
6.681.000,00 |
7.798.000,00 |
5.044.000,00 |
8.331.000,00 |
6.387.000,00 |
|
|
1. Development: 11110 |
44.000,00 |
1.723.000,00 |
133.000,00 |
3.762.000,00 |
5.090.000,00 |
|
|
2. Concessions: 11120 |
0,00 |
0,00 |
0,00 |
0,00 |
0,00 |
|
|
3. Patents, licencing, trade marks and
similar: 11130 |
0,00 |
0,00 |
0,00 |
0,00 |
0,00 |
|
|
4. Goodwill: 11140 |
0,00 |
0,00 |
0,00 |
0,00 |
0,00 |
|
|
5. IT applications: 11150 |
6.637.000,00 |
6.075.000,00 |
4.911.000,00 |
4.553.000,00 |
1.281.000,00 |
|
|
6. Investigation: 11160 |
0,00 |
0,00 |
0,00 |
0,00 |
0,00 |
|
|
7. Intellectual property: 11180 |
0,00 |
0,00 |
0,00 |
0,00 |
0,00 |
|
|
8. Greenhouse gas emission allowance:
11190 |
0,00 |
0,00 |
0,00 |
0,00 |
0,00 |
|
|
9. Other intangible fixed assets. :
11170 |
0,00 |
0,00 |
0,00 |
16.000,00 |
16.000,00 |
|
|
II. Tangible fixed assets : 11200 |
72.000.000,00 |
72.402.000,00 |
38.536.000,00 |
44.994.000,00 |
46.047.000,00 |
|
|
1. Land and buildings: 11210 |
39.178.000,00 |
44.621.000,00 |
16.178.000,00 |
17.226.000,00 |
17.077.000,00 |
|
|
2. Technical installations and other
tangible fixed assets: 11220 |
32.799.000,00 |
27.703.000,00 |
22.210.000,00 |
26.485.000,00 |
28.747.000,00 |
|
|
3. Tangible asset in progress and
advances: 11230 |
23.000,00 |
78.000,00 |
148.000,00 |
1.283.000,00 |
223.000,00 |
|
|
III. Real estate investment: 11300 |
0,00 |
0,00 |
0,00 |
0,00 |
1.260.000,00 |
|
|
1. Land: 11310 |
0,00 |
0,00 |
0,00 |
0,00 |
0,00 |
|
|
2. Buildings: 11320 |
0,00 |
0,00 |
0,00 |
0,00 |
1.260.000,00 |
|
|
IV. Long-term investments in Group companies and associates :
11400 |
786.009.000,00 |
506.275.000,00 |
475.799.000,00 |
431.617.000,00 |
360.572.000,00 |
|
|
1. Equity instruments: 11410 |
786.009.000,00 |
506.275.000,00 |
475.799.000,00 |
431.617.000,00 |
360.572.000,00 |
|
|
2. Credits to businesses: 11420 |
0,00 |
0,00 |
0,00 |
0,00 |
0,00 |
|
|
3. Debt securities: 11430 |
0,00 |
0,00 |
0,00 |
0,00 |
0,00 |
|
|
4. Derivatives : 11440 |
0,00 |
0,00 |
0,00 |
0,00 |
0,00 |
|
|
5. Other financial assets : 11450 |
0,00 |
0,00 |
0,00 |
0,00 |
0,00 |
|
|
6. Other investments: 11460 |
0,00 |
0,00 |
0,00 |
0,00 |
0,00 |
|
|
V. Long-term financial investments: 11500 |
780.000,00 |
636.000,00 |
577.000,00 |
473.000,00 |
475.000,00 |
|
|
1. Equity instruments: 11510 |
0,00 |
0,00 |
0,00 |
0,00 |
0,00 |
|
|
2. Credits to third parties : 11520 |
0,00 |
0,00 |
0,00 |
0,00 |
0,00 |
|
|
3. Debt securities: 11530 |
0,00 |
0,00 |
0,00 |
0,00 |
0,00 |
|
|
4. Derivatives : 11540 |
0,00 |
0,00 |
0,00 |
0,00 |
0,00 |
|
|
5. Other financial assets : 11550 |
780.000,00 |
636.000,00 |
577.000,00 |
473.000,00 |
475.000,00 |
|
|
6. Other investments: 11560 |
0,00 |
0,00 |
0,00 |
0,00 |
0,00 |
|
|
VI. Assets for deferred tax : 11600 |
191.501.000,00 |
185.176.000,00 |
110.819.000,00 |
47.162.000,00 |
27.408.000,00 |
|
|
VII. Non-current trade debts : 11700 |
0,00 |
0,00 |
0,00 |
0,00 |
0,00 |
|
|
B)
CURRENT ASSETS: 12000 |
1.119.887.000,00 |
1.868.563.000,00 |
2.044.477.000,00 |
1.898.172.000,00 |
2.062.822.000,00 |
|
|
I. Non-current assets held for sale : 12100 |
0,00 |
0,00 |
0,00 |
0,00 |
0,00 |
|
|
II. Stocks: 12200 |
136.011.000,00 |
254.770.000,00 |
218.226.000,00 |
223.483.000,00 |
199.909.000,00 |
|
|
1. Commercial: 12210 |
0,00 |
0,00 |
0,00 |
0,00 |
0,00 |
|
|
2. Primary material and other supplies:
12220 |
85.768.000,00 |
124.056.000,00 |
110.017.000,00 |
152.870.000,00 |
145.834.000,00 |
|
|
3. Work in progress: 12230 |
14.531.000,00 |
23.704.000,00 |
1.759.000,00 |
3.487.000,00 |
634.000,00 |
|
|
a) Of long-term
production cycle : 12231 |
0,00 |
0,00 |
0,00 |
0,00 |
0,00 |
|
|
b) Of short-term
production cycle : 12232 |
14.531.000,00 |
23.704.000,00 |
1.759.000,00 |
3.487.000,00 |
634.000,00 |
|
|
4. Finished goods: 12240 |
11.988.000,00 |
84.562.000,00 |
77.314.000,00 |
55.943.000,00 |
46.546.000,00 |
|
|
a) Of long-term
production cycle : 12241 |
0,00 |
0,00 |
0,00 |
0,00 |
0,00 |
|
|
b) Of short-term
production cycle : 12242 |
11.988.000,00 |
84.562.000,00 |
77.314.000,00 |
55.943.000,00 |
46.546.000,00 |
|
|
5. By-products, residues and recycled
materials: 12250 |
0,00 |
0,00 |
0,00 |
0,00 |
0,00 |
|
|
6. Advances to suppliers: 12260 |
23.724.000,00 |
22.448.000,00 |
29.136.000,00 |
11.183.000,00 |
6.895.000,00 |
|
|
III. Trade debtors and others receivable accounts: 12300 |
524.943.000,00 |
740.794.000,00 |
920.075.000,00 |
1.040.044.000,00 |
972.250.000,00 |
|
|
1. Trade debtors / accounts receivable:
12310 |
275.789.000,00 |
252.984.000,00 |
477.342.000,00 |
476.884.000,00 |
596.843.000,00 |
|
|
a) Long-term receivables
from sales and services supplied : 12311 |
0,00 |
0,00 |
0,00 |
0,00 |
0,00 |
|
|
b) Customers for
sales and provisions of services : 12312 |
275.789.000,00 |
252.984.000,00 |
477.342.000,00 |
476.884.000,00 |
596.843.000,00 |
|
|
2. Customers, Group companies and
associates : 12320 |
220.418.000,00 |
407.210.000,00 |
365.819.000,00 |
495.666.000,00 |
319.810.000,00 |
|
|
3. Other accounts receivable: 12330 |
0,00 |
-312.000,00 |
5.134.000,00 |
28.386.000,00 |
11.074.000,00 |
|
|
4. Personnel: 12340 |
1.592.000,00 |
625.000,00 |
242.000,00 |
284.000,00 |
230.000,00 |
|
|
5. Assets for deferred tax: 12350 |
2.651.000,00 |
2.018.000,00 |
4.274.000,00 |
1.000,00 |
0,00 |
|
|
6. Other debtors, including tax and social
security: 12360 |
24.493.000,00 |
78.269.000,00 |
67.264.000,00 |
38.823.000,00 |
44.293.000,00 |
|
|
7. Called up share capital: 12370 |
0,00 |
0,00 |
0,00 |
0,00 |
0,00 |
|
|
IV. Short-term investments in Group companies and associates:
12400 |
280.908.000,00 |
575.664.000,00 |
502.942.000,00 |
268.925.000,00 |
472.463.000,00 |
|
|
1. Equity instruments: 12410 |
0,00 |
0,00 |
0,00 |
0,00 |
0,00 |
|
|
2. Credits to businesses: 12420 |
254.111.000,00 |
575.664.000,00 |
502.942.000,00 |
268.925.000,00 |
472.463.000,00 |
|
|
3. Debt securities: 12430 |
0,00 |
0,00 |
0,00 |
0,00 |
0,00 |
|
|
4. Derivatives : 12440 |
0,00 |
0,00 |
0,00 |
0,00 |
0,00 |
|
|
5. Other financial assets : 12450 |
26.797.000,00 |
0,00 |
0,00 |
0,00 |
0,00 |
|
|
6. Other investments: 12460 |
0,00 |
0,00 |
0,00 |
0,00 |
0,00 |
|
|
V. Short-term financial investments : 12500 |
6.618.000,00 |
11.911.000,00 |
7.038.000,00 |
64.561.000,00 |
737.000,00 |
|
|
1. Equity instruments: 12510 |
2.000,00 |
2.000,00 |
2.000,00 |
2.000,00 |
2.000,00 |
|
|
2. Credits to businesses: 12520 |
4.000,00 |
38.000,00 |
5.000,00 |
58.000.000,00 |
0,00 |
|
|
3. Debt securities: 12530 |
0,00 |
0,00 |
0,00 |
0,00 |
0,00 |
|
|
4. Derivatives : 12540 |
0,00 |
10.807.000,00 |
2.821.000,00 |
2.494.000,00 |
730.000,00 |
|
|
5. Other financial assets : 12550 |
6.612.000,00 |
1.064.000,00 |
4.210.000,00 |
4.065.000,00 |
5.000,00 |
|
|
6. Other investments: 12560 |
0,00 |
0,00 |
0,00 |
0,00 |
0,00 |
|
|
VI. Short-term accruals: 12600 |
22.654.000,00 |
66.282.000,00 |
35.208.000,00 |
41.546.000,00 |
53.846.000,00 |
|
|
VII. Cash and other equivalent liquid assets : 12700 |
148.753.000,00 |
219.142.000,00 |
360.988.000,00 |
259.613.000,00 |
363.617.000,00 |
|
|
1. Treasury: 12710 |
132.798.000,00 |
219.142.000,00 |
360.988.000,00 |
259.613.000,00 |
363.617.000,00 |
|
|
2. Other equivalent liquid assets:
12720 |
15.955.000,00 |
0,00 |
0,00 |
0,00 |
0,00 |
|
|
TOTAL
ASSETS (A + B) : 10000 |
2.176.858.000,00 |
2.640.850.000,00 |
2.675.252.000,00 |
2.430.749.000,00 |
2.504.971.000,00 |
|
|
|
ORIGINAL |
ORIGINAL |
ORIGINAL |
ORIGINAL |
ORIGINAL |
|
|
Liabilities
and Net Worth |
2014 |
2013 |
2012 |
2011 |
2010 |
|
|
A)
NET WORTH: 20000 |
310.413.000,00 |
135.185.000,00 |
212.999.000,00 |
346.107.000,00 |
375.908.000,00 |
|
|
A-1) Shareholders' equity: 21000 |
307.640.000,00 |
124.704.000,00 |
214.241.000,00 |
343.378.000,00 |
377.078.000,00 |
|
|
I. Capital: 21100 |
201.000,00 |
201.000,00 |
201.000,00 |
3.000,00 |
3.000,00 |
|
|
1. Registered capital : 21110 |
201.000,00 |
201.000,00 |
201.000,00 |
3.000,00 |
3.000,00 |
|
|
2. (Uncalled capital): 21120 |
0,00 |
0,00 |
0,00 |
0,00 |
0,00 |
|
|
II. Share premium: 21200 |
0,00 |
0,00 |
0,00 |
0,00 |
0,00 |
|
|
III. Reserves: 21300 |
255.325.000,00 |
219.956.000,00 |
341.401.000,00 |
376.760.000,00 |
344.241.000,00 |
|
|
1. Legal and statutory: 21310 |
40.000,00 |
1.000,00 |
1.000,00 |
1.000,00 |
1.000,00 |
|
|
2. Other reserves: 21320 |
255.285.000,00 |
219.955.000,00 |
341.400.000,00 |
376.759.000,00 |
344.240.000,00 |
|
|
3. Revaluation reserves: 21330 |
0,00 |
0,00 |
0,00 |
0,00 |
0,00 |
|
|
IV. (Common stock equity): 21400 |
0,00 |
0,00 |
0,00 |
0,00 |
0,00 |
|
|
V. Results from previous periods: 21500 |
-3.814.000,00 |
-130.599.000,00 |
0,00 |
0,00 |
0,00 |
|
|
1. Brought forward: 21510 |
0,00 |
0,00 |
0,00 |
0,00 |
0,00 |
|
|
2. (Negative results from previous
periods): 21520 |
-3.814.000,00 |
-130.599.000,00 |
0,00 |
0,00 |
0,00 |
|
|
VI. Other shareholders' contributions: 21600 |
5.505.000,00 |
4.536.000,00 |
3.238.000,00 |
2.286.000,00 |
1.234.000,00 |
|
|
VII. Result of the period: 21700 |
50.423.000,00 |
182.536.000,00 |
-130.599.000,00 |
-35.671.000,00 |
31.600.000,00 |
|
|
VIII. (Interim dividend): 21800 |
0,00 |
-151.926.000,00 |
0,00 |
0,00 |
0,00 |
|
|
IX. Other net worth instruments: 21900 |
0,00 |
0,00 |
0,00 |
0,00 |
0,00 |
|
|
A-2) Adjustments due to changes in value: 22000 |
-255.000,00 |
4.307.000,00 |
-2.590.000,00 |
1.357.000,00 |
-2.783.000,00 |
|
|
I. Financial assets held for sale: 22100 |
0,00 |
0,00 |
0,00 |
0,00 |
0,00 |
|
|
II. Hedge operations: 22200 |
-255.000,00 |
4.307.000,00 |
-2.590.000,00 |
1.357.000,00 |
-2.783.000,00 |
|
|
III. Linked non-current assets and liabilities held for sale :
22300 |
0,00 |
0,00 |
0,00 |
0,00 |
0,00 |
|
|
IV. Exchange rate difference: 22400 |
0,00 |
0,00 |
0,00 |
0,00 |
0,00 |
|
|
V. Other: 22500 |
0,00 |
0,00 |
0,00 |
0,00 |
0,00 |
|
|
A-3) Received subsidies, donations and legacies: 23000 |
3.028.000,00 |
6.174.000,00 |
1.348.000,00 |
1.372.000,00 |
1.613.000,00 |
|
|
B)
NON-CURRENT LIABILITIES: 31000 |
571.552.000,00 |
586.035.000,00 |
678.977.000,00 |
654.638.000,00 |
520.300.000,00 |
|
|
I. Long-term provisions: 31100 |
39.401.000,00 |
59.818.000,00 |
91.932.000,00 |
64.138.000,00 |
82.079.000,00 |
|
|
1. Long-term employee benefits liability:
31110 |
0,00 |
0,00 |
0,00 |
0,00 |
0,00 |
|
|
2. Environmental actions: 31120 |
0,00 |
0,00 |
0,00 |
0,00 |
0,00 |
|
|
3. Restructuring provisions: 31130 |
0,00 |
0,00 |
0,00 |
0,00 |
0,00 |
|
|
4. Other provisions: 31140 |
39.401.000,00 |
59.818.000,00 |
91.932.000,00 |
64.138.000,00 |
82.079.000,00 |
|
|
II Long-term creditors: 31200 |
508.971.000,00 |
507.237.000,00 |
582.836.000,00 |
586.639.000,00 |
435.945.000,00 |
|
|
1. Liabilities and other securities:
31210 |
0,00 |
0,00 |
0,00 |
0,00 |
0,00 |
|
|
2. Amounts owed to credit institutions:
31220 |
501.405.000,00 |
500.934.000,00 |
578.715.000,00 |
582.020.000,00 |
429.354.000,00 |
|
|
3. Creditors from financial leasing:
31230 |
0,00 |
0,00 |
0,00 |
0,00 |
0,00 |
|
|
4. Derivatives : 31240 |
78.000,00 |
489.000,00 |
973.000,00 |
1.861.000,00 |
4.923.000,00 |
|
|
5. Other financial liabilities :
31250 |
7.488.000,00 |
5.814.000,00 |
3.148.000,00 |
2.758.000,00 |
1.668.000,00 |
|
|
III. Long-term debts with Group companies and associates:
31300 |
0,00 |
0,00 |
0,00 |
0,00 |
0,00 |
|
|
IV. Liabilities for deferred tax: 31400 |
23.180.000,00 |
18.980.000,00 |
4.209.000,00 |
3.861.000,00 |
2.276.000,00 |
|
|
V. Long-term accruals: 31500 |
0,00 |
0,00 |
0,00 |
0,00 |
0,00 |
|
|
VI. Non-current trade creditors : 31600 |
0,00 |
0,00 |
0,00 |
0,00 |
0,00 |
|
|
VII. Special long-term debts : 31700 |
0,00 |
0,00 |
0,00 |
0,00 |
0,00 |
|
|
C)
CURRENT LIABILITIES : 32000 |
1.294.893.000,00 |
1.919.630.000,00 |
1.783.276.000,00 |
1.430.004.000,00 |
1.608.763.000,00 |
|
|
I. Liabilities linked to non-current assets held for sale:
32100 |
0,00 |
0,00 |
0,00 |
0,00 |
0,00 |
|
|
II. Short-term provisions: 32200 |
6.576.000,00 |
8.837.000,00 |
22.708.000,00 |
22.266.000,00 |
1.901.000,00 |
|
|
1. Provisions from greenhouse gas emission
allowance: 32210 |
0,00 |
0,00 |
0,00 |
0,00 |
0,00 |
|
|
2. Other provisions: 32220 |
6.576.000,00 |
8.837.000,00 |
0,00 |
0,00 |
0,00 |
|
|
III. Short-term creditors : 32300 |
43.957.000,00 |
350.142.000,00 |
50.082.000,00 |
92.249.000,00 |
77.086.000,00 |
|
|
1. Liabilities and other securities:
32310 |
0,00 |
0,00 |
0,00 |
0,00 |
0,00 |
|
|
2. Amounts owed to credit institutions:
32320 |
36.420.000,00 |
345.673.000,00 |
41.185.000,00 |
80.379.000,00 |
60.034.000,00 |
|
|
3. Creditors from financial leasing:
32330 |
0,00 |
0,00 |
0,00 |
0,00 |
0,00 |
|
|
4. Derivatives : 32340 |
4.162.000,00 |
734.000,00 |
4.439.000,00 |
5.982.000,00 |
11.503.000,00 |
|
|
5. Other financial liabilities :
32350 |
3.375.000,00 |
3.735.000,00 |
4.458.000,00 |
5.888.000,00 |
5.549.000,00 |
|
|
IV. Short-term debts with Group companies and associates:
32400 |
436.528.000,00 |
460.073.000,00 |
708.402.000,00 |
251.215.000,00 |
287.700.000,00 |
|
|
V. Trade creditors and other accounts payable: 32500 |
805.038.000,00 |
1.097.527.000,00 |
996.116.000,00 |
1.059.623.000,00 |
1.209.057.000,00 |
|
|
1. Suppliers: 32510 |
391.064.000,00 |
289.801.000,00 |
256.131.000,00 |
324.280.000,00 |
433.018.000,00 |
|
|
a) Long-term debts :
32511 |
0,00 |
0,00 |
0,00 |
0,00 |
0,00 |
|
|
b) Short-term debts :
32512 |
391.064.000,00 |
289.801.000,00 |
256.131.000,00 |
324.280.000,00 |
433.018.000,00 |
|
|
2. Suppliers, Group companies and
associates: 32520 |
156.406.000,00 |
468.426.000,00 |
251.681.000,00 |
212.689.000,00 |
209.478.000,00 |
|
|
3. Other creditors: 32530 |
0,00 |
0,00 |
0,00 |
0,00 |
0,00 |
|
|
4. Personnel (remuneration due):
32540 |
8.891.000,00 |
9.377.000,00 |
2.963.000,00 |
3.813.000,00 |
3.360.000,00 |
|
|
5. Liabilities for current tax:
32550 |
0,00 |
0,00 |
0,00 |
-626.000,00 |
-595.000,00 |
|
|
6. Other accounts payable to Public
Administrations.: 32560 |
9.771.000,00 |
12.360.000,00 |
8.204.000,00 |
11.787.000,00 |
12.767.000,00 |
|
|
7. Advances from clients: 32570 |
238.906.000,00 |
317.563.000,00 |
477.137.000,00 |
507.680.000,00 |
551.029.000,00 |
|
|
VI. Short-term accruals: 32600 |
2.794.000,00 |
3.051.000,00 |
5.968.000,00 |
4.651.000,00 |
33.019.000,00 |
|
|
VII. Special short-term debts : 32700 |
0,00 |
0,00 |
0,00 |
0,00 |
0,00 |
|
|
TOTAL
NET WORTH AND LIABILITIES (A + B + C) : 30000 |
2.176.858.000,00 |
2.640.850.000,00 |
2.675.252.000,00 |
2.430.749.000,00 |
2.504.971.000,00 |
|
|
|
ORIGINAL |
ORIGINAL |
ORIGINAL |
ORIGINAL |
ORIGINAL |
|
|
Profit
and Loss |
2014 |
2013 |
2012 |
2011 |
2010 |
|
|
1.
Net turnover: 40100 |
1.228.348.000,00 |
946.848.000,00 |
1.152.629.000,00 |
1.274.278.000,00 |
1.606.418.000,00 |
|
|
a) Sales: 40110 |
922.252.000,00 |
718.389.000,00 |
902.092.000,00 |
1.024.683.000,00 |
1.221.272.000,00 |
|
|
b) Rendering of services: 40120 |
276.080.000,00 |
215.452.000,00 |
250.537.000,00 |
249.595.000,00 |
385.146.000,00 |
|
|
c) Income of financial nature of holding companies: 40130 |
30.016.000,00 |
13.007.000,00 |
0,00 |
0,00 |
0,00 |
|
|
2.
Changes in stocks of finished goods and work in progress: 40200 |
-72.374.000,00 |
-17.610.000,00 |
25.629.000,00 |
12.250.000,00 |
39.797.000,00 |
|
|
3.
Works carried out by the company for its assets: 40300 |
154.000,00 |
4.267.000,00 |
65.000,00 |
146.000,00 |
2.390.000,00 |
|
|
4.
Supplies : 40400 |
-788.891.000,00 |
-626.414.000,00 |
-922.989.000,00 |
-907.115.000,00 |
-1.199.867.000,00 |
|
|
a) Stock consumption: 40410 |
-14.061.000,00 |
-12.695.000,00 |
-21.586.000,00 |
-39.919.000,00 |
-20.003.000,00 |
|
|
b) Consumption of raw materials and miscellaneous consumable
ones: 40420 |
-611.271.000,00 |
-483.804.000,00 |
-704.167.000,00 |
-686.374.000,00 |
-897.941.000,00 |
|
|
c) Works carried out by other companies: 40430 |
-169.428.000,00 |
-118.954.000,00 |
-175.971.000,00 |
-181.249.000,00 |
-274.070.000,00 |
|
|
d) Impairment of stock, primary material and other supplies:
40440 |
5.869.000,00 |
-10.961.000,00 |
-21.265.000,00 |
427.000,00 |
-7.853.000,00 |
|
|
5.
Other operating income: 40500 |
20.657.000,00 |
5.058.000,00 |
4.901.000,00 |
4.094.000,00 |
21.682.000,00 |
|
|
a) Auxiliary income and other from current management:
40510 |
20.657.000,00 |
4.997.000,00 |
4.901.000,00 |
4.094.000,00 |
21.681.000,00 |
|
|
b) Operation subsidies included in the Period's
result: 40520 |
0,00 |
61.000,00 |
0,00 |
0,00 |
1.000,00 |
|
|
6.
Personnel costs: 40600 |
-85.077.000,00 |
-106.823.000,00 |
-83.549.000,00 |
-87.280.000,00 |
-74.756.000,00 |
|
|
a) Wages, salaries et al.: 40610 |
-65.602.000,00 |
-85.126.000,00 |
-65.093.000,00 |
-69.701.000,00 |
-58.893.000,00 |
|
|
b) Social security costs: 40620 |
-19.475.000,00 |
-21.697.000,00 |
-18.456.000,00 |
-17.579.000,00 |
-15.863.000,00 |
|
|
c) Provisions : 40630 |
0,00 |
0,00 |
0,00 |
0,00 |
0,00 |
|
|
7.
Other operating costs: 40700 |
-166.122.000,00 |
-197.984.000,00 |
-284.546.000,00 |
-284.115.000,00 |
-328.568.000,00 |
|
|
a) External services: 40710 |
-147.072.000,00 |
-173.722.000,00 |
-212.652.000,00 |
-268.084.000,00 |
-308.369.000,00 |
|
|
b) Taxes: 40720 |
-4.177.000,00 |
-909.000,00 |
614.000,00 |
-711.000,00 |
-475.000,00 |
|
|
c) Losses, impairments and variation in provisions from trade
operations : 40730 |
-14.873.000,00 |
-23.340.000,00 |
-72.508.000,00 |
-15.320.000,00 |
-19.706.000,00 |
|
|
d) Other current management expenditure : 40740 |
0,00 |
-13.000,00 |
0,00 |
0,00 |
-18.000,00 |
|
|
e) Expenses due to greenhouse gas emissions: 40750 |
0,00 |
0,00 |
0,00 |
0,00 |
0,00 |
|
|
8.
Amortisation of fixed assets: 40800 |
-17.667.000,00 |
-17.203.000,00 |
-13.878.000,00 |
-16.435.000,00 |
-16.011.000,00 |
|
|
9.
Allocation of subsidies of non-financial fixed assets and other: 40900 |
418.000,00 |
599.000,00 |
377.000,00 |
415.000,00 |
569.000,00 |
|
|
10.
Excess provisions : 41000 |
439.000,00 |
8.592.000,00 |
2.036.000,00 |
0,00 |
16.709.000,00 |
|
|
11.
Impairment and result of transfers of fixed assets: 41100 |
1.156.000,00 |
-2.441.000,00 |
-10.978.000,00 |
-278.000,00 |
-1.327.000,00 |
|
|
a) Impairment and losses : 41110 |
-1.729.000,00 |
-1.587.000,00 |
-10.978.000,00 |
-278.000,00 |
-1.091.000,00 |
|
|
b) Results for transfers and other : 41120 |
2.885.000,00 |
-854.000,00 |
0,00 |
0,00 |
-236.000,00 |
|
|
c) Impairment and profit due to disposals of assets of holding
companies: 41130 |
0,00 |
0,00 |
0,00 |
0,00 |
0,00 |
|
|
12.
Negative difference in combined businesses: 41200 |
0,00 |
0,00 |
0,00 |
0,00 |
0,00 |
|
|
13.
Other results : 41300 |
0,00 |
0,00 |
0,00 |
0,00 |
0,00 |
|
|
A.1)
OPERATING INCOME (1 + 2 + 3 + 4 + 5 + 6 + 7 + 8 + 9 + 10 + 11 + 12 + 13) : 49100 |
121.041.000,00 |
-3.111.000,00 |
-130.303.000,00 |
-4.040.000,00 |
67.036.000,00 |
|
|
14.
Financial income : 41400 |
3.087.000,00 |
223.259.000,00 |
3.051.000,00 |
1.249.000,00 |
1.224.000,00 |
|
|
a) Of shares in equity instruments : 41410 |
10.000,00 |
221.926.000,00 |
0,00 |
0,00 |
0,00 |
|
|
a 1) In Group companies and associates:
41411 |
10.000,00 |
221.926.000,00 |
0,00 |
0,00 |
0,00 |
|
|
a 2) In third parties: 41412 |
0,00 |
0,00 |
0,00 |
0,00 |
0,00 |
|
|
b) From negotiable securities and other financial instruments :
41420 |
3.077.000,00 |
1.333.000,00 |
3.051.000,00 |
1.249.000,00 |
1.224.000,00 |
|
|
b 1) From Group companies and associates :
41421 |
0,00 |
0,00 |
0,00 |
0,00 |
0,00 |
|
|
b 2) From third parties : 41422 |
3.077.000,00 |
1.333.000,00 |
3.051.000,00 |
1.249.000,00 |
1.224.000,00 |
|
|
c) Allocation of financial subsidies, donations and legacies :
41430 |
0,00 |
0,00 |
0,00 |
0,00 |
0,00 |
|
|
15.
Financial expenditure: 41500 |
-39.902.000,00 |
-40.204.000,00 |
-36.371.000,00 |
-41.585.000,00 |
-41.925.000,00 |
|
|
a) Amounts owed to Group companies and associates : 41510 |
-12.939.000,00 |
-17.177.000,00 |
-10.545.000,00 |
-8.848.000,00 |
-9.527.000,00 |
|
|
b) For debts with third parties : 41520 |
-26.963.000,00 |
-23.027.000,00 |
-25.826.000,00 |
-32.737.000,00 |
-32.398.000,00 |
|
|
c) Stock renewal : 41530 |
0,00 |
0,00 |
0,00 |
0,00 |
0,00 |
|
|
16.
Changes in fair value of financial instruments : 41600 |
-6.136.000,00 |
0,00 |
0,00 |
0,00 |
0,00 |
|
|
a) Trading book and other : 41610 |
-6.136.000,00 |
0,00 |
0,00 |
0,00 |
0,00 |
|
|
b) Allocation of financial assets held for sale to the result
for the period: 41620 |
0,00 |
0,00 |
0,00 |
0,00 |
0,00 |
|
|
17.
Exchange rate differences : 41700 |
3.790.000,00 |
-5.134.000,00 |
-6.043.000,00 |
13.224.000,00 |
-2.884.000,00 |
|
|
18.
Impairment and result for transfers of financial instruments: 41800 |
0,00 |
-626.000,00 |
-9.166.000,00 |
-6.972.000,00 |
-11.831.000,00 |
|
|
a) Impairment and losses : 41810 |
0,00 |
-6.016.000,00 |
-9.166.000,00 |
-6.972.000,00 |
-11.831.000,00 |
|
|
b) Results for transfers and other : 41820 |
0,00 |
5.390.000,00 |
0,00 |
0,00 |
0,00 |
|
|
19.
Other financial income and expenditure: 42100 |
0,00 |
0,00 |
0,00 |
0,00 |
0,00 |
|
|
a) Incorporation of financial expenditure to assets:
42110 |
0,00 |
0,00 |
0,00 |
0,00 |
0,00 |
|
|
b) Financial income from arrangement with creditors:
42120 |
0,00 |
0,00 |
0,00 |
0,00 |
0,00 |
|
|
c) Other income and expenditure: 42130 |
0,00 |
0,00 |
0,00 |
0,00 |
0,00 |
|
|
A.2)
FINANCIAL REVENUE (14+15+16+17+18+19) : 49200 |
-39.161.000,00 |
177.295.000,00 |
-48.529.000,00 |
-34.084.000,00 |
-55.416.000,00 |
|
|
A.3)
NET RESULT BEFORE TAXES (A.1+A.2) : 49300 |
81.880.000,00 |
174.184.000,00 |
-178.832.000,00 |
-38.124.000,00 |
11.620.000,00 |
|
|
20.
Income taxes: 41900 |
-31.457.000,00 |
8.352.000,00 |
48.233.000,00 |
2.453.000,00 |
19.980.000,00 |
|
|
A.4)
PROFIT AFTER TAXES (A.3+20) : 49400 |
50.423.000,00 |
182.536.000,00 |
-130.599.000,00 |
-35.671.000,00 |
31.600.000,00 |
|
|
21.
Result of the year coming from interrupted operations : 42000 |
0,00 |
0,00 |
0,00 |
0,00 |
0,00 |
|
|
A.5)
RESULT OF THE PERIOD (A.4+21) : 49500 |
50.423.000,00 |
182.536.000,00 |
-130.599.000,00 |
-35.671.000,00 |
31.600.000,00 |
|
> Normal Balance Sheet under the rules of the 1990 General Accounting Plan (repealed since 1st January of 2008)
Information corresponding to the fiscal year 2014 2013 2012 2011 2010 has been compiled based on the equivalence criteria stipulated in Act JUS/206/2009. To view details on the methodology 2014 2013 2012 2011 2010 is taken from information submitted to the TRADE REGISTER.
|
|
EQUIVALENCIA |
EQUIVALENCIA |
EQUIVALENCIA |
EQUIVALENCIA |
EQUIVALENCIA |
|
|
ASSETS |
2014 |
2013 |
2012 |
2011 |
2010 |
|
|
A)
SHAREHOLDERS (PARTNERS) BY UNCALLED SUSCRIBED CAPITAL: |
0,00 |
0,00 |
0,00 |
0,00 |
0,00 |
|
|
B)
FIXED ASSETS: |
865.470.000,00 |
587.111.000,00 |
519.956.000,00 |
485.415.000,00 |
414.741.000,00 |
|
|
I. Formation expenses: |
0,00 |
0,00 |
0,00 |
0,00 |
0,00 |
|
|
II. Intangible fixed assets: |
6.681.000,00 |
7.798.000,00 |
5.044.000,00 |
8.331.000,00 |
6.387.000,00 |
|
|
1. Research and development costs: |
44.000,00 |
1.723.000,00 |
133.000,00 |
3.762.000,00 |
5.090.000,00 |
|
|
2. Concessions, patents, licences,
trademarks et al.: |
0,00 |
0,00 |
0,00 |
0,00 |
0,00 |
|
|
3. Goodwill: |
0,00 |
0,00 |
0,00 |
0,00 |
0,00 |
|
|
4. Key money paid for premises: |
0,00 |
0,00 |
0,00 |
0,00 |
0,00 |
|
|
5. Software: |
6.637.000,00 |
6.075.000,00 |
4.911.000,00 |
4.553.000,00 |
1.281.000,00 |
|
|
6. Assets under capital leases: |
0,00 |
0,00 |
0,00 |
0,00 |
0,00 |
|
|
7. Payments on account: |
0,00 |
0,00 |
0,00 |
16.000,00 |
16.000,00 |
|
|
8. Provisions: |
0,00 |
0,00 |
0,00 |
0,00 |
0,00 |
|
|
9. Accumulated depreciation: |
0,00 |
0,00 |
0,00 |
0,00 |
0,00 |
|
|
III. Tangible fixed assets: |
72.000.000,00 |
72.402.000,00 |
38.536.000,00 |
44.994.000,00 |
47.307.000,00 |
|
|
1. Land and construction: |
39.178.000,00 |
44.621.000,00 |
16.178.000,00 |
17.226.000,00 |
18.337.000,00 |
|
|
2. Technical installations and machinery:
|
10.186.383,00 |
8.603.718,00 |
6.897.758,00 |
8.225.444,00 |
8.927.953,00 |
|
|
3. Other installations, tools and
furniture: |
21.866.431,00 |
18.469.031,00 |
14.806.959,00 |
17.657.015,00 |
19.165.045,00 |
|
|
4. Payments on account and tangible fixed
assets under construction: |
23.000,00 |
78.000,00 |
148.000,00 |
1.283.000,00 |
223.000,00 |
|
|
5. Other tangible assets: |
746.186,00 |
630.251,00 |
505.284,00 |
602.541,00 |
654.002,00 |
|
|
6. Provisions: |
0,00 |
0,00 |
0,00 |
0,00 |
0,00 |
|
|
7. Accumulated depreciation: |
0,00 |
0,00 |
0,00 |
0,00 |
0,00 |
|
|
IV. Financial investments: |
786.789.000,00 |
506.911.000,00 |
476.376.000,00 |
432.090.000,00 |
361.047.000,00 |
|
|
1. Equity investments in group companies:
|
786.009.000,00 |
506.275.000,00 |
475.799.000,00 |
431.617.000,00 |
360.572.000,00 |
|
|
2. Receivables from group companies:
|
0,00 |
0,00 |
0,00 |
0,00 |
0,00 |
|
|
3. Equity investment in associated
companies: |
0,00 |
0,00 |
0,00 |
0,00 |
0,00 |
|
|
4. Credits to associated companies: |
0,00 |
0,00 |
0,00 |
0,00 |
0,00 |
|
|
5. Long-term securities portfolio: |
0,00 |
0,00 |
0,00 |
0,00 |
0,00 |
|
|
6. Other receivables: |
0,00 |
0,00 |
0,00 |
0,00 |
0,00 |
|
|
7. Long term guarantees and deposits:
|
780.000,00 |
636.000,00 |
577.000,00 |
473.000,00 |
475.000,00 |
|
|
8. Provisions: |
0,00 |
0,00 |
0,00 |
0,00 |
0,00 |
|
|
9. Long-term receivables from public
bodies: |
0,00 |
0,00 |
0,00 |
0,00 |
0,00 |
|
|
V. Own shares: |
0,00 |
0,00 |
0,00 |
0,00 |
0,00 |
|
|
VI. Long-term trade receivables: |
0,00 |
0,00 |
0,00 |
0,00 |
0,00 |
|
|
C)
Deferred expenses: |
0,00 |
0,00 |
0,00 |
0,00 |
0,00 |
|
|
D)
CURRENT ASSETS: |
1.311.388.000,00 |
2.042.932.000,00 |
2.152.475.000,00 |
1.942.840.000,00 |
2.089.500.000,00 |
|
|
I. Called-up share capital (not paid): |
0,00 |
0,00 |
0,00 |
0,00 |
0,00 |
|
|
II. Stocks: |
136.011.000,00 |
254.770.000,00 |
218.226.000,00 |
223.483.000,00 |
199.909.000,00 |
|
|
1. Goods for resale: |
0,00 |
0,00 |
0,00 |
0,00 |
0,00 |
|
|
2. Raw materials and other consumables:
|
85.768.000,00 |
124.056.000,00 |
110.017.000,00 |
152.870.000,00 |
145.834.000,00 |
|
|
3. Goods in process and semifinished ones:
|
14.531.000,00 |
23.704.000,00 |
1.759.000,00 |
3.487.000,00 |
634.000,00 |
|
|
4. Finished products: |
11.988.000,00 |
84.562.000,00 |
77.314.000,00 |
55.943.000,00 |
46.546.000,00 |
|
|
5. Byproducts, scrap and recovered
materials: |
0,00 |
0,00 |
0,00 |
0,00 |
0,00 |
|
|
6. Payments on account: |
23.724.000,00 |
22.448.000,00 |
29.136.000,00 |
11.183.000,00 |
6.895.000,00 |
|
|
7. Provisions: |
0,00 |
0,00 |
0,00 |
0,00 |
0,00 |
|
|
III. Debtors: |
716.444.000,00 |
925.970.000,00 |
1.030.894.000,00 |
1.087.206.000,00 |
999.658.000,00 |
|
|
1. Trade debtors / accounts receivable:
|
275.789.000,00 |
252.984.000,00 |
477.342.000,00 |
476.884.000,00 |
596.843.000,00 |
|
|
2. Accounts receivable, Group companies:
|
220.418.000,00 |
407.210.000,00 |
365.819.000,00 |
495.666.000,00 |
319.810.000,00 |
|
|
3. Accounts receivable, associated
companies: |
0,00 |
0,00 |
0,00 |
0,00 |
0,00 |
|
|
4. Other debtors: |
0,00 |
-312.000,00 |
5.134.000,00 |
28.386.000,00 |
11.074.000,00 |
|
|
5. Staff: |
1.592.000,00 |
625.000,00 |
242.000,00 |
284.000,00 |
230.000,00 |
|
|
6. Public bodies: |
218.645.000,00 |
265.463.000,00 |
182.357.000,00 |
85.986.000,00 |
71.701.000,00 |
|
|
7. Provisions: |
0,00 |
0,00 |
0,00 |
0,00 |
0,00 |
|
|
IV. Short-term investments: |
303.481.000,00 |
576.768.000,00 |
507.159.000,00 |
330.992.000,00 |
472.470.000,00 |
|
|
1. Equity investments in group companies:
|
0,00 |
0,00 |
0,00 |
0,00 |
0,00 |
|
|
2. Receivables from group companies:
|
254.111.000,00 |
575.664.000,00 |
502.942.000,00 |
268.925.000,00 |
472.463.000,00 |
|
|
3. Equity investment in associated
companies: |
0,00 |
0,00 |
0,00 |
0,00 |
0,00 |
|
|
4. Credits to associated companies: |
0,00 |
0,00 |
0,00 |
0,00 |
0,00 |
|
|
5. Short term securities portfolio: |
15.957.000,00 |
2.000,00 |
2.000,00 |
2.000,00 |
2.000,00 |
|
|
6. Other receivables: |
26.801.000,00 |
38.000,00 |
5.000,00 |
58.000.000,00 |
0,00 |
|
|
7. Shor term guarantees and deposits:
|
6.612.000,00 |
1.064.000,00 |
4.210.000,00 |
4.065.000,00 |
5.000,00 |
|
|
8. Provisions: |
0,00 |
0,00 |
0,00 |
0,00 |
0,00 |
|
|
V. Short-term treasury shares: |
0,00 |
0,00 |
0,00 |
0,00 |
0,00 |
|
|
VI. Cash at bank and in hand: |
132.798.000,00 |
219.142.000,00 |
360.988.000,00 |
259.613.000,00 |
363.617.000,00 |
|
|
VII. Prepayments and accrued income: |
22.654.000,00 |
66.282.000,00 |
35.208.000,00 |
41.546.000,00 |
53.846.000,00 |
|
|
GENERAL
TOTAL (A + B + C + D): |
2.176.858.000,00 |
2.630.043.000,00 |
2.672.431.000,00 |
2.428.255.000,00 |
2.504.241.000,00 |
|
MERCANTILE REGISTRY.
|
|
EQUIVALENCIA |
EQUIVALENCIA |
EQUIVALENCIA |
EQUIVALENCIA |
EQUIVALENCIA |
|
|
LIABILITIES |
2014 |
2013 |
2012 |
2011 |
2010 |
|
|
A)
EQUITY: |
312.533.400,00 |
121.279.200,00 |
214.646.400,00 |
350.495.600,00 |
390.474.900,00 |
|
|
I. Subscribed capital: |
201.000,00 |
201.000,00 |
201.000,00 |
3.000,00 |
3.000,00 |
|
|
II. Share premium: |
0,00 |
0,00 |
0,00 |
0,00 |
0,00 |
|
|
III. Revaluation reserves: |
0,00 |
0,00 |
0,00 |
0,00 |
0,00 |
|
|
IV. Reserves: |
260.218.400,00 |
216.531.200,00 |
341.806.400,00 |
383.877.600,00 |
357.637.900,00 |
|
|
1. Legal reserve: |
40.000,00 |
1.000,00 |
1.000,00 |
1.000,00 |
1.000,00 |
|
|
2. Reserves for own shares: |
0,00 |
0,00 |
0,00 |
0,00 |
0,00 |
|
|
3. Reserves for shares of the controlling
company: |
0,00 |
0,00 |
0,00 |
0,00 |
0,00 |
|
|
4. Statutory reserves: |
0,00 |
0,00 |
0,00 |
0,00 |
0,00 |
|
|
5. Miscellaneous reserves: |
260.178.400,00 |
216.530.200,00 |
341.805.400,00 |
383.876.600,00 |
357.636.900,00 |
|
|
Differences due to capital adjustement to
euros: |
0,00 |
0,00 |
0,00 |
0,00 |
0,00 |
|
|
V. Profit or loss brought forward: |
1.691.000,00 |
-126.063.000,00 |
3.238.000,00 |
2.286.000,00 |
1.234.000,00 |
|
|
1. Retained earnings: |
0,00 |
0,00 |
0,00 |
0,00 |
0,00 |
|
|
2. Prior year losses: |
-3.814.000,00 |
-130.599.000,00 |
0,00 |
0,00 |
0,00 |
|
|
3. Partners' contributions so as
to compensate losses: |
5.505.000,00 |
4.536.000,00 |
3.238.000,00 |
2.286.000,00 |
1.234.000,00 |
|
|
VI. Profit or loss for the financial year: |
50.423.000,00 |
182.536.000,00 |
-130.599.000,00 |
-35.671.000,00 |
31.600.000,00 |
|
|
VII. Interim dividend paid: |
0,00 |
-151.926.000,00 |
0,00 |
0,00 |
0,00 |
|
|
VIII. Own shares for capital reduction: |
0,00 |
0,00 |
0,00 |
0,00 |
0,00 |
|
|
B)
Deferred income: |
2.119.600,00 |
4.321.800,00 |
943.600,00 |
960.400,00 |
1.129.100,00 |
|
|
1. Capital grants: |
2.119.600,00 |
4.321.800,00 |
943.600,00 |
960.400,00 |
1.129.100,00 |
|
|
2. Unrealised exchange gains: |
0,00 |
0,00 |
0,00 |
0,00 |
0,00 |
|
|
3. Other deferred income: |
0,00 |
0,00 |
0,00 |
0,00 |
0,00 |
|
|
4. Public revenues to distribute in
several financial years: |
0,00 |
0,00 |
0,00 |
0,00 |
0,00 |
|
|
C)
PROVISIONS FOR LIABILITIES AND CHARGES: |
39.401.000,00 |
59.818.000,00 |
91.932.000,00 |
64.138.000,00 |
82.079.000,00 |
|
|
1. Provisions for pension fund and other
similar obligations: |
0,00 |
0,00 |
0,00 |
0,00 |
0,00 |
|
|
2. Provisions for taxes: |
0,00 |
0,00 |
0,00 |
0,00 |
0,00 |
|
|
3. Other provisions: |
39.401.000,00 |
59.818.000,00 |
91.932.000,00 |
64.138.000,00 |
82.079.000,00 |
|
|
4. Reversion fund: |
0,00 |
0,00 |
0,00 |
0,00 |
0,00 |
|
|
D)
LONG TERM LIABILITIES: |
532.073.000,00 |
525.728.000,00 |
586.072.000,00 |
588.639.000,00 |
433.298.000,00 |
|
|
I. Issued debentures and other marketable securities: |
0,00 |
0,00 |
0,00 |
0,00 |
0,00 |
|
|
1. Non-convertible debentures: |
0,00 |
0,00 |
0,00 |
0,00 |
0,00 |
|
|
2. Convertible debentures: |
0,00 |
0,00 |
0,00 |
0,00 |
0,00 |
|
|
3. Other debt securities: |
0,00 |
0,00 |
0,00 |
0,00 |
0,00 |
|
|
II. Amounts owed to credit institutions: |
501.405.000,00 |
500.934.000,00 |
578.715.000,00 |
582.020.000,00 |
429.354.000,00 |
|
|
1. Loans and other liabilities: |
501.405.000,00 |
500.934.000,00 |
578.715.000,00 |
582.020.000,00 |
429.354.000,00 |
|
|
2. Long-term liabilities from capital
leases: |
0,00 |
0,00 |
0,00 |
0,00 |
0,00 |
|
|
III. Debts with companies of the group and affiliated ones:
|
0,00 |
0,00 |
0,00 |
0,00 |
0,00 |
|
|
1. Amounts owed to group companies: |
0,00 |
0,00 |
0,00 |
0,00 |
0,00 |
|
|
2. Amounts owed to associated companies:
|
0,00 |
0,00 |
0,00 |
0,00 |
0,00 |
|
|
IV. Other creditors: |
30.668.000,00 |
24.794.000,00 |
7.357.000,00 |
6.619.000,00 |
3.944.000,00 |
|
|
1. Long-term bills of exchange payable:
|
0,00 |
0,00 |
0,00 |
0,00 |
0,00 |
|
|
2. Other creditors: |
7.488.000,00 |
5.814.000,00 |
3.148.000,00 |
2.758.000,00 |
1.668.000,00 |
|
|
3. Long term guarantees and deposits
received: |
0,00 |
0,00 |
0,00 |
0,00 |
0,00 |
|
|
4. Long term payables to public bodies:
|
23.180.000,00 |
18.980.000,00 |
4.209.000,00 |
3.861.000,00 |
2.276.000,00 |
|
|
V. Unpaid portion of equity investment: |
0,00 |
0,00 |
0,00 |
0,00 |
0,00 |
|
|
1. Group companies: |
0,00 |
0,00 |
0,00 |
0,00 |
0,00 |
|
|
2. Associated companies: |
0,00 |
0,00 |
0,00 |
0,00 |
0,00 |
|
|
3. Third parties: |
0,00 |
0,00 |
0,00 |
0,00 |
0,00 |
|
|
VI. Long term trade creditors: |
0,00 |
0,00 |
0,00 |
0,00 |
0,00 |
|
|
E)
SHORT TERM CREDITORS: |
1.284.155.000,00 |
1.910.059.000,00 |
1.756.129.000,00 |
1.401.756.000,00 |
1.595.359.000,00 |
|
|
I. Issued debentures and other marketable securities: |
0,00 |
0,00 |
0,00 |
0,00 |
0,00 |
|
|
1. Non-convertible debentures: |
0,00 |
0,00 |
0,00 |
0,00 |
0,00 |
|
|
2. Convertible debentures: |
0,00 |
0,00 |
0,00 |
0,00 |
0,00 |
|
|
3. Other debt securities: |
0,00 |
0,00 |
0,00 |
0,00 |
0,00 |
|
|
4. Accrued interest on debentures and
other debt securities: |
0,00 |
0,00 |
0,00 |
0,00 |
0,00 |
|
|
II. Amounts owed to credit institutions: |
36.420.000,00 |
345.673.000,00 |
41.185.000,00 |
80.379.000,00 |
60.034.000,00 |
|
|
1. Loans and other liabilities: |
36.420.000,00 |
345.673.000,00 |
41.185.000,00 |
80.379.000,00 |
60.034.000,00 |
|
|
2. Accrued interest on liabilities with
credit institutions: |
0,00 |
0,00 |
0,00 |
0,00 |
0,00 |
|
|
3. Short-term liabilities from capital
leases: |
0,00 |
0,00 |
0,00 |
0,00 |
0,00 |
|
|
III. Short-term amounts owed to group and associated companies:
|
592.934.000,00 |
928.499.000,00 |
960.083.000,00 |
463.904.000,00 |
497.178.000,00 |
|
|
1. Amounts owed to group companies: |
472.609.821,00 |
740.078.568,00 |
765.253.223,00 |
369.763.896,00 |
396.285.599,00 |
|
|
2. Amounts owed to associated companies:
|
120.324.179,00 |
188.420.432,00 |
194.829.777,00 |
94.140.104,00 |
100.892.401,00 |
|
|
IV. Trade creditors: |
629.970.000,00 |
607.364.000,00 |
733.268.000,00 |
831.960.000,00 |
984.047.000,00 |
|
|
1. Advanced payments from customers:
|
238.906.000,00 |
317.563.000,00 |
477.137.000,00 |
507.680.000,00 |
551.029.000,00 |
|
|
2. Amounts owed for purchases of goods or
services: |
391.064.000,00 |
289.801.000,00 |
256.131.000,00 |
324.280.000,00 |
433.018.000,00 |
|
|
3. Debts represented by notes payable:
|
0,00 |
0,00 |
0,00 |
0,00 |
0,00 |
|
|
V. Other creditors: |
22.037.000,00 |
25.472.000,00 |
15.625.000,00 |
20.862.000,00 |
21.081.000,00 |
|
|
1. Public bodies: |
9.771.000,00 |
12.360.000,00 |
8.204.000,00 |
11.161.000,00 |
12.172.000,00 |
|
|
2. Bills of exchange payable: |
0,00 |
0,00 |
0,00 |
0,00 |
0,00 |
|
|
3. Miscellaneous debts: |
3.375.000,00 |
3.735.000,00 |
4.458.000,00 |
5.888.000,00 |
5.549.000,00 |
|
|
4. Wages and salaries payable: |
8.891.000,00 |
9.377.000,00 |
2.963.000,00 |
3.813.000,00 |
3.360.000,00 |
|
|
5. Guarantees and deposits received at
short term: |
0,00 |
0,00 |
0,00 |
0,00 |
0,00 |
|
|
VI. Provisions: |
0,00 |
0,00 |
0,00 |
0,00 |
0,00 |
|
|
VII. Prepayments and accrued income: |
2.794.000,00 |
3.051.000,00 |
5.968.000,00 |
4.651.000,00 |
33.019.000,00 |
|
|
F)
SHORT-TERM PROVISIONS FOR LIABILITIES AND CHARGES: |
6.576.000,00 |
8.837.000,00 |
22.708.000,00 |
22.266.000,00 |
1.901.000,00 |
|
|
GENERAL
TOTAL (A + B + C + D + E + F): |
2.176.858.000,00 |
2.630.043.000,00 |
2.672.431.000,00 |
2.428.255.000,00 |
2.504.241.000,00 |
|
MERCANTILE REGISTRY.
|
|
EQUIVALENCIA |
EQUIVALENCIA |
EQUIVALENCIA |
EQUIVALENCIA |
EQUIVALENCIA |
|
|
DEBIT |
2014 |
2013 |
2012 |
2011 |
2010 |
|
|
A)
CHARGES (A.1 to A.15): |
1.209.355.000,00 |
1.011.477.000,00 |
1.319.287.000,00 |
1.341.327.000,00 |
1.657.189.000,00 |
|
|
A.1. Stock reduction of both manufactured
goods and the ones in process: |
72.374.000,00 |
17.610.000,00 |
0,00 |
0,00 |
0,00 |
|
|
A.2. Supplies: |
794.760.000,00 |
615.453.000,00 |
901.724.000,00 |
907.542.000,00 |
1.192.014.000,00 |
|
|
a) Stock consumption:
|
14.061.000,00 |
12.695.000,00 |
21.586.000,00 |
39.919.000,00 |
20.003.000,00 |
|
|
b) Consumption of raw
materials and miscellaneous consumable ones: |
611.271.000,00 |
483.804.000,00 |
704.167.000,00 |
686.374.000,00 |
897.941.000,00 |
|
|
c) Miscellaneous
external expenditure: |
169.428.000,00 |
118.954.000,00 |
175.971.000,00 |
181.249.000,00 |
274.070.000,00 |
|
|
A.3. Staff costs: |
85.077.000,00 |
106.823.000,00 |
83.549.000,00 |
87.280.000,00 |
74.756.000,00 |
|
|
a) Wages, salaries et
al.: |
65.602.000,00 |
85.126.000,00 |
65.093.000,00 |
69.701.000,00 |
58.893.000,00 |
|
|
b) Social security
costs: |
19.475.000,00 |
21.697.000,00 |
18.456.000,00 |
17.579.000,00 |
15.863.000,00 |
|
|
A.4. Depreciation expense: |
17.667.000,00 |
17.203.000,00 |
13.878.000,00 |
16.435.000,00 |
16.011.000,00 |
|
|
A.5. Variation of trade provisions and
losses of unrecovered receivables: |
9.004.000,00 |
34.301.000,00 |
93.773.000,00 |
14.893.000,00 |
27.559.000,00 |
|
|
a) Stock provision
variation: |
-5.869.000,00 |
10.961.000,00 |
21.265.000,00 |
-427.000,00 |
7.853.000,00 |
|
|
b) Variation in provision
and bad debt losses: |
0,00 |
0,00 |
0,00 |
0,00 |
0,00 |
|
|
c) Variation of other
trade provisions: |
14.873.000,00 |
23.340.000,00 |
72.508.000,00 |
15.320.000,00 |
19.706.000,00 |
|
|
A.6. Other operating charges: |
151.249.000,00 |
174.644.000,00 |
212.038.000,00 |
268.795.000,00 |
308.862.000,00 |
|
|
a) External services:
|
147.072.000,00 |
173.722.000,00 |
212.652.000,00 |
268.084.000,00 |
308.369.000,00 |
|
|
b) Taxes: |
4.177.000,00 |
909.000,00 |
-614.000,00 |
711.000,00 |
475.000,00 |
|
|
c) Other operating
expenses: |
0,00 |
13.000,00 |
0,00 |
0,00 |
18.000,00 |
|
|
d) Allocation to
revision fund: |
0,00 |
0,00 |
0,00 |
0,00 |
0,00 |
|
|
A.I. OPERATING BENEFITS
(B.1+B.2+B.3+B.4-A.1-A.2-A.3-A.4-A.5-A.6): |
89.451.000,00 |
0,00 |
0,00 |
0,00 |
67.794.000,00 |
|
|
A.7. Financial and similar charges: |
39.902.000,00 |
40.204.000,00 |
36.371.000,00 |
41.585.000,00 |
41.925.000,00 |
|
|
a) Due to liabilities
with companies of the group: |
12.939.000,00 |
17.177.000,00 |
10.545.000,00 |
8.848.000,00 |
9.527.000,00 |
|
|
b) Due to liabilities
with associated companies: |
0,00 |
0,00 |
0,00 |
0,00 |
0,00 |
|
|
c) Due to other
debts.: |
26.963.000,00 |
23.027.000,00 |
25.826.000,00 |
32.737.000,00 |
32.398.000,00 |
|
|
d) Losses from
financial investments: |
0,00 |
0,00 |
0,00 |
0,00 |
0,00 |
|
|
A.8. Changes in financial investment
provisions: |
6.136.000,00 |
0,00 |
0,00 |
0,00 |
0,00 |
|
|
A.9. Exchange losses: |
0,00 |
5.134.000,00 |
6.043.000,00 |
0,00 |
2.884.000,00 |
|
|
A.II. NET FINANCIAL INCOME (B.5+B.6+B.7+B.8-A.7-A.8-A.9):
|
0,00 |
183.311.000,00 |
0,00 |
0,00 |
0,00 |
|
|
A.III. PROFIT FROM ORDINARY ACTIVITIES (A.I+A.II-B.I-B.II):
|
50.290.000,00 |
169.035.000,00 |
0,00 |
0,00 |
24.209.000,00 |
|
|
A.10. Changes in provisions for
intangible, tangible and securities portfolio: |
1.729.000,00 |
7.603.000,00 |
20.144.000,00 |
7.250.000,00 |
12.922.000,00 |
|
|
A.11. Losses from tangible and intangible
fixed assets and securities portfolio: |
0,00 |
854.000,00 |
0,00 |
0,00 |
236.000,00 |
|
|
A.12. Losses from transactions with own
shares and debentures: |
0,00 |
0,00 |
0,00 |
0,00 |
0,00 |
|
|
A.13. Extraordinary expenses: |
0,00 |
0,00 |
0,00 |
0,00 |
0,00 |
|
|
A.14. Expenses and losses of former financial
years: |
0,00 |
0,00 |
0,00 |
0,00 |
0,00 |
|
|
A.IV. EXTRAORDINARY PROFIT
(B.9+B.10+B.11+B.12+B.13-A.10-A.11-A.12-A.13-A.14): |
1.574.000,00 |
0,00 |
0,00 |
0,00 |
0,00 |
|
|
A.V. PROFIT BEFORE TAXES (A.III+A.IV-B.III-B.IV): |
51.864.000,00 |
161.177.000,00 |
0,00 |
0,00 |
11.620.000,00 |
|
|
A.15. Corporation tax: |
31.457.000,00 |
-8.352.000,00 |
-48.233.000,00 |
-2.453.000,00 |
-19.980.000,00 |
|
|
A.16. Miscellaneous taxes: |
0,00 |
0,00 |
0,00 |
0,00 |
0,00 |
|
|
A.VI. FINANCIAL YEAR RESULTS (PROFIT) (A.V-A.15-A.16): |
20.407.000,00 |
169.529.000,00 |
0,00 |
0,00 |
31.600.000,00 |
|
MERCANTILE REGISTRY.
|
|
EQUIVALENCIA |
EQUIVALENCIA |
EQUIVALENCIA |
EQUIVALENCIA |
EQUIVALENCIA |
|
|
CREDIT |
2014 |
2013 |
2012 |
2011 |
2010 |
|
|
B)
INCOME ( B.1 to B.13): |
1.229.762.000,00 |
1.181.006.000,00 |
1.188.688.000,00 |
1.305.656.000,00 |
1.688.789.000,00 |
|
|
B.1. Net total sales: |
1.198.332.000,00 |
933.841.000,00 |
1.152.629.000,00 |
1.274.278.000,00 |
1.606.418.000,00 |
|
|
a) Sales: |
922.252.000,00 |
718.389.000,00 |
902.092.000,00 |
1.024.683.000,00 |
1.221.272.000,00 |
|
|
b) Rendering of
services: |
276.080.000,00 |
215.452.000,00 |
250.537.000,00 |
249.595.000,00 |
385.146.000,00 |
|
|
Returns and Rappel on
sales: |
0,00 |
0,00 |
0,00 |
0,00 |
0,00 |
|
|
B.2. Stock increase of manufactured goods
and products in process: |
0,00 |
0,00 |
25.629.000,00 |
12.250.000,00 |
39.797.000,00 |
|
|
B.3. Works performed by the company for
fixed assets: |
154.000,00 |
4.267.000,00 |
65.000,00 |
146.000,00 |
2.390.000,00 |
|
|
B.4. Miscellaneous operating income:
|
21.096.000,00 |
13.650.000,00 |
6.937.000,00 |
4.094.000,00 |
38.391.000,00 |
|
|
a) Auxiliary income
and other from current management: |
20.657.000,00 |
4.997.000,00 |
4.901.000,00 |
4.094.000,00 |
21.681.000,00 |
|
|
b) Grants: |
0,00 |
61.000,00 |
0,00 |
0,00 |
1.000,00 |
|
|
c) Liabilities and charges
provisions surplus: |
439.000,00 |
8.592.000,00 |
2.036.000,00 |
0,00 |
16.709.000,00 |
|
|
B.I. PÉRDIDAS DE EXPLOTACIÓN
(A.1+A.2+A.3+A.4+A.5-A.6-B.1-B.2-B.3-B.4): |
0,00 |
14.276.000,00 |
119.702.000,00 |
4.177.000,00 |
0,00 |
|
|
B.5. Income from equity investment: |
10.000,00 |
221.926.000,00 |
0,00 |
0,00 |
0,00 |
|
|
a) In companies of
the group: |
10.000,00 |
221.926.000,00 |
0,00 |
0,00 |
0,00 |
|
|
b) In associated
companies: |
0,00 |
0,00 |
0,00 |
0,00 |
0,00 |
|
|
c) Third parties:
|
0,00 |
0,00 |
0,00 |
0,00 |
0,00 |
|
|
B.6. Income from other marketable
securities and long-term receivables: |
0,00 |
0,00 |
0,00 |
0,00 |
0,00 |
|
|
a) From companies of
the group: |
0,00 |
0,00 |
0,00 |
0,00 |
0,00 |
|
|
b) From associated
companies: |
0,00 |
0,00 |
0,00 |
0,00 |
0,00 |
|
|
c) From companies out
of the group: |
0,00 |
0,00 |
0,00 |
0,00 |
0,00 |
|
|
B.7. Miscellaneous interests or similar
income: |
3.077.000,00 |
6.723.000,00 |
3.051.000,00 |
1.249.000,00 |
1.224.000,00 |
|
|
a) From companies of
the group: |
0,00 |
0,00 |
0,00 |
0,00 |
0,00 |
|
|
b) From associated
companies: |
0,00 |
0,00 |
0,00 |
0,00 |
0,00 |
|
|
c) Miscellaneous
interests: |
3.077.000,00 |
1.333.000,00 |
3.051.000,00 |
1.249.000,00 |
1.224.000,00 |
|
|
d) Profit on
financial investment: |
0,00 |
5.390.000,00 |
0,00 |
0,00 |
0,00 |
|
|
B.8. Exchange positive differences: |
3.790.000,00 |
0,00 |
0,00 |
13.224.000,00 |
0,00 |
|
|
B.II. NEGATIVE FINANCIAL RESULTS (A.7+A.8+A.9-B.5-B.6-B.7-B.8):
|
39.161.000,00 |
0,00 |
39.363.000,00 |
27.112.000,00 |
43.585.000,00 |
|
|
B.III. LOSSES ON ORDINARY ACTIVITIES ( B.I + B.II - A.I - A.II
): |
0,00 |
0,00 |
159.065.000,00 |
31.289.000,00 |
0,00 |
|
|
B.9.Profit on disposal of both tangible
and intangible fixed assets and securities portfolio: |
2.885.000,00 |
0,00 |
0,00 |
0,00 |
0,00 |
|
|
B.10. Profit on transactions with own
shares and debentures: |
0,00 |
0,00 |
0,00 |
0,00 |
0,00 |
|
|
B.11. Capital grants transferred to profit
and loss: |
418.000,00 |
599.000,00 |
377.000,00 |
415.000,00 |
569.000,00 |
|
|
B.12. Extraordinary income: |
0,00 |
0,00 |
0,00 |
0,00 |
0,00 |
|
|
B.13. Income and profit of former
financial years: |
0,00 |
0,00 |
0,00 |
0,00 |
0,00 |
|
|
B.IV. NEGATIVE EXTRAORDINARY RESULTS (A.10+A.11+A.12+A.13+A.14-B.9-B.10-B.11-B.12-B.13):
|
0,00 |
7.858.000,00 |
19.767.000,00 |
6.835.000,00 |
12.589.000,00 |
|
|
B.V. LOSSES BEFORE TAXES (B.III+B.IV-A.III-A.IV): |
0,00 |
0,00 |
178.832.000,00 |
38.124.000,00 |
0,00 |
|
|
B.VI. RESULT OF THE PERIOD (LOSSES) (B.V+A.15+A.16): |
0,00 |
0,00 |
130.599.000,00 |
35.671.000,00 |
0,00 |
|
MERCANTILE REGISTRY.
CASHFLOW
STATEMENT
|
Model: Normal
>
Source of information: Data contained in this section is taken from the
information declared in the Annual Accounts submitted to the Trade Register.
|
1.
Fiscal year result before taxes.: 61100 |
81.880.000,00 |
174.184.000,00 |
-178.832.000,00 |
-38.124.000,00 |
11.620.000,00 |
|
|
2.
Results adjustments.: 61200 |
59.575.000,00 |
-128.544.000,00 |
134.773.000,00 |
79.933.000,00 |
63.147.000,00 |
|
|
a) Fixed Assets Amortization (+).: 61201 |
17.667.000,00 |
17.203.000,00 |
13.878.000,00 |
16.435.000,00 |
16.011.000,00 |
|
|
b) Obsolescence Allowances (+/-). : 61202 |
1.729.000,00 |
20.552.000,00 |
-1.509.000,00 |
-8.787.000,00 |
16.533.000,00 |
|
|
c) Variation in Provision (+/-). : 61203 |
530.000,00 |
19.765.000,00 |
81.085.000,00 |
33.265.000,00 |
8.283.000,00 |
|
|
d) Allocation of grants (-).: 61204 |
-418.000,00 |
-599.000,00 |
-378.000,00 |
-415.000,00 |
-569.000,00 |
|
|
e) Results on disposal of fixed assets (+/-). : 61205 |
-2.885.000,00 |
2.441.000,00 |
10.979.000,00 |
278.000,00 |
244.000,00 |
|
|
f) Results on disposal of financial instruments (+/-).:
61206 |
0,00 |
0,00 |
0,00 |
6.973.000,00 |
0,00 |
|
|
g) Financial income (-).: 61207 |
-3.087.000,00 |
-223.259.000,00 |
-15.332.000,00 |
-1.249.000,00 |
-1.224.000,00 |
|
|
h) Financial Expenses (+). : 61208 |
39.903.000,00 |
40.204.000,00 |
36.371.000,00 |
41.585.000,00 |
41.925.000,00 |
|
|
i) Exchange differences (+/-). : 61209 |
0,00 |
0,00 |
0,00 |
0,00 |
-5.154.000,00 |
|
|
j) Reasonable Value Variation in Financial Instruments (+/-).:
61210 |
0,00 |
-5.390.000,00 |
9.296.000,00 |
0,00 |
0,00 |
|
|
k) Other income and expense (-/+). : 61211 |
6.136.000,00 |
539.000,00 |
383.000,00 |
-8.152.000,00 |
-12.902.000,00 |
|
|
3.
Changes in current capital equity.: 61300 |
255.191.000,00 |
134.528.000,00 |
16.212.000,00 |
-261.661.000,00 |
72.995.000,00 |
|
|
a) Stock (+/-).: 61301 |
118.759.000,00 |
-8.821.000,00 |
-16.008.000,00 |
-14.802.000,00 |
-34.206.000,00 |
|
|
d) Debtors and other accounts receivable (+/-). : 61302 |
215.851.000,00 |
180.238.000,00 |
111.364.000,00 |
-41.268.000,00 |
461.456.000,00 |
|
|
c) Other current assets (+/-). : 61303 |
339.115.000,00 |
-27.955.000,00 |
7.521.000,00 |
7.685.000,00 |
-12.684.000,00 |
|
|
d) Creditors and other accounts payable (+/-). : 61304 |
-398.299.000,00 |
61.866.000,00 |
-63.508.000,00 |
-149.910.000,00 |
-299.849.000,00 |
|
|
e) Other current liabilities (+/-).: 61305 |
-257.000,00 |
0,00 |
0,00 |
0,00 |
728.000,00 |
|
|
f) Other non-current assets and liabilities (+/-).: 61306 |
-19.978.000,00 |
-70.800.000,00 |
-23.157.000,00 |
-63.366.000,00 |
-42.450.000,00 |
|
|
4.
Other cash flows for operating activities.: 61400 |
-36.816.000,00 |
185.509.000,00 |
-24.767.000,00 |
7.015.000,00 |
-25.723.000,00 |
|
|
a) Interest payments (-). : 61401 |
-39.903.000,00 |
-40.202.000,00 |
-30.083.000,00 |
-2.749.000,00 |
-29.569.000,00 |
|
|
c) Interest collection (+). : 61403 |
0,00 |
223.259.000,00 |
5.316.000,00 |
10.052.000,00 |
14.230.000,00 |
|
|
d) Income tax payment collection (payments) (+/-).: 61404 |
0,00 |
0,00 |
0,00 |
0,00 |
-10.384.000,00 |
|
|
e) Other payments (payment collection) (-/+) : 61405 |
3.087.000,00 |
2.452.000,00 |
0,00 |
-288.000,00 |
0,00 |
|
|
5.
Operating activity cash flows (1 + 2 + 3 + 4) : 61500 |
359.830.000,00 |
365.677.000,00 |
-52.614.000,00 |
-212.837.000,00 |
122.039.000,00 |
|
|
6.
Payments for investment (-).: 62100 |
-303.674.000,00 |
-188.886.000,00 |
-234.302.000,00 |
-96.536.000,00 |
-275.121.000,00 |
|
|
a) Companies of the group and affiliates. : 62101 |
-285.117.000,00 |
-164.515.000,00 |
-218.905.000,00 |
-78.342.000,00 |
-265.871.000,00 |
|
|
b) Intangible fixed assets. : 62102 |
-2.745.000,00 |
-4.272.000,00 |
-1.551.000,00 |
-3.991.000,00 |
-956.000,00 |
|
|
c) Fixed assets. : 62103 |
-16.612.000,00 |
-20.040.000,00 |
-13.742.000,00 |
-14.203.000,00 |
-8.280.000,00 |
|
|
e) Other financial assets. : 62105 |
-144.000,00 |
-59.000,00 |
-104.000,00 |
0,00 |
-14.000,00 |
|
|
g) Business Unit : 62107 |
944.000,00 |
0,00 |
0,00 |
0,00 |
0,00 |
|
|
7.
Divestment payment collection (+). : 62200 |
4.365.000,00 |
3.424.000,00 |
310.000,00 |
148.526.000,00 |
89.701.000,00 |
|
|
a) Companies of the group and affiliates. : 62201 |
0,00 |
3.205.000,00 |
130.000,00 |
146.676.000,00 |
87.775.000,00 |
|
|
c) Fixed assets. : 62203 |
4.365.000,00 |
219.000,00 |
180.000,00 |
1.850.000,00 |
1.926.000,00 |
|
|
8.
Investment activity cash flows (6 + 7) minus Amortization: 62300 |
-299.309.000,00 |
-185.462.000,00 |
-233.992.000,00 |
51.990.000,00 |
-185.420.000,00 |
|
|
9.
Payment collection and payments for equity instruments. : 63100 |
127.872.000,00 |
123.000,00 |
-110.000,00 |
70.000,00 |
0,00 |
|
|
b) Amortization of assets instruments (-). : 63102 |
0,00 |
0,00 |
-110.000,00 |
0,00 |
0,00 |
|
|
e) Grants, donations and bequests received (+). : 63105 |
127.872.000,00 |
123.000,00 |
0,00 |
70.000,00 |
0,00 |
|
|
10.
Payment collection and payments for financial liabilities instruments.:
63200 |
-258.782.000,00 |
-20.258.000,00 |
388.091.000,00 |
56.773.000,00 |
-124.083.000,00 |
|
|
a) Issuance : 63201 |
50.471.000,00 |
425.250.000,00 |
461.380.000,00 |
115.041.000,00 |
234.898.000,00 |
|
|
2. Debts incurred with credit institutions (+). : 63203 |
50.471.000,00 |
425.250.000,00 |
25.000.000,00 |
115.041.000,00 |
145.160.000,00 |
|
|
3. Debts incurred with companies of the group and affiliates
(+).: 63204 |
0,00 |
0,00 |
436.380.000,00 |
0,00 |
89.738.000,00 |
|
|
b) Repayment and amortization of : 63207 |
-309.253.000,00 |
-445.508.000,00 |
-73.289.000,00 |
-58.268.000,00 |
-358.981.000,00 |
|
|
2. Debts incurred with credit institutions (-).: 63209 |
-309.253.000,00 |
-197.179.000,00 |
0,00 |
0,00 |
-209.841.000,00 |
|
|
3. Debts incurred with companies of the group and affiliates (-).
: 63210 |
0,00 |
-248.329.000,00 |
-73.289.000,00 |
-58.268.000,00 |
-149.140.000,00 |
|
|
11.
Payments from dividends and remunerations from other assets instruments. :
63300 |
0,00 |
-301.926.000,00 |
0,00 |
0,00 |
0,00 |
|
|
a) Dividends (-).: 63301 |
0,00 |
-301.926.000,00 |
0,00 |
0,00 |
0,00 |
|
|
12.
Cash flows for financing activities (9+10+11).: 63400 |
-130.910.000,00 |
-322.061.000,00 |
387.981.000,00 |
56.843.000,00 |
-124.083.000,00 |
|
|
D)
EFFECT OF EXCHANGE RATE CHANGES: 64000 |
0,00 |
0,00 |
0,00 |
0,00 |
0,00 |
|
|
E)
NET INCREASE/DECREASE OF CASH OR EQUIVALENT ASSETS (+/-5+/-8+/12+/-D) :
65000 |
-70.389.000,00 |
-141.846.000,00 |
101.375.000,00 |
-104.004.000,00 |
-187.464.000,00 |
|
|
Cash or equivalent assets as of beginning of the fiscal year.:
65100 |
219.142.000,00 |
360.988.000,00 |
259.613.000,00 |
363.617.000,00 |
551.081.000,00 |
|
|
Cash or equivalent assets as of end of the fiscal year.:
65200 |
148.753.000,00 |
219.142.000,00 |
360.988.000,00 |
259.613.000,00 |
363.617.000,00 |
|
|
FINANCIAL
DIAGNOSIS
|
> Economic-Financial Comparative Analysis
Data used in the following ratios and indicators is taken from the Annual Accounts submitted by the company to the TRADE REGISTER.
> Comparison within the Sector
|
Cash
Flow |
2014 |
2013 |
Variación 2014 - 2013 |
|
|||
|
|
Empresa |
Sector |
Empresa |
Sector |
Empresa |
Sector |
|
|
Cash
Flow over Sales: |
-0,06 % |
0,04 % |
-0,15 % |
0,01 % |
61,75 % |
229,44 % |
|
|
EBITDA
over Sales: |
11,13 % |
11,91 % |
0,78 % |
11,52 % |
1.335,15 % |
3,39 % |
|
|
Cash
Flow Yield: |
-0,03 % |
0,02 % |
-0,05 % |
0,01 % |
39,80 % |
272,76 % |
|
|
Profitability |
2014 |
2013 |
Variación 2014 - 2013 |
|
|||
|
|
Empresa |
Sector |
Empresa |
Sector |
Empresa |
Sector |
|
|
Operating
economic profitability: |
10,98 % |
8,67 % |
-0,20 % |
7,04 % |
5.556,92 % |
23,25 % |
|
|
Total
economic profitability: |
5,59 % |
5,12 % |
8,12 % |
3,70 % |
-31,09 % |
38,27 % |
|
|
Financial
profitability: |
16,39 % |
7,88 % |
146,38 % |
4,06 % |
-88,80 % |
94,20 % |
|
|
Margin:
|
9,69 % |
7,43 % |
-0,33 % |
6,87 % |
3.078,18 % |
8,15 % |
|
|
Mark-up:
|
6,55 % |
6,95 % |
18,22 % |
4,51 % |
-64,02 % |
54,06 % |
|
|
Solvency |
2014 |
2013 |
Variación 2014 - 2013 |
|
|||
|
|
Empresa |
Sector |
Empresa |
Sector |
Empresa |
Sector |
|
|
Liquidity:
|
0,12 |
0,14 |
0,11 |
0,13 |
0,68 |
7,67 |
|
|
Acid
Test: |
0,75 |
0,89 |
0,81 |
0,87 |
-7,87 |
2,84 |
|
|
Working
Capital / Investment: |
-0,08 |
0,03 |
-0,02 |
0,05 |
-315,75 |
-35,47 |
|
|
Solvency:
|
1,02 |
1,22 |
1,07 |
1,18 |
-5,29 |
3,91 |
|
|
Indebtedness |
2014 |
2013 |
Variación 2014 - 2013 |
|
|||
|
|
Empresa |
Sector |
Empresa |
Sector |
Empresa |
Sector |
|
|
Indebtedness
level: |
5,20 |
1,31 |
12,78 |
1,38 |
-59,31 |
-5,58 |
|
|
Borrowing
Composition: |
0,41 |
1,12 |
0,28 |
1,00 |
49,99 |
11,28 |
|
|
Repayment
Ability: |
-25,86 |
25,94 |
-17,18 |
99,00 |
-50,54 |
-73,80 |
|
|
Warranty:
|
1,20 |
1,77 |
1,08 |
1,73 |
10,35 |
2,40 |
|
|
Generated
resources / Total creditors: |
0,03 |
0,09 |
0,09 |
0,08 |
-60,58 |
8,30 |
|
|
Efficiency |
2014 |
2013 |
Variación 2014 - 2013 |
|
|||
|
|
Empresa |
Sector |
Empresa |
Sector |
Empresa |
Sector |
|
|
Productivity:
|
2,61 |
1,99 |
1,07 |
1,86 |
143,91 |
6,74 |
|
|
Turnover
of Collection Rights : |
2,38 |
5,40 |
1,29 |
4,99 |
84,36 |
8,17 |
|
|
Turnover
of Payment Entitlements: |
1,10 |
3,82 |
0,74 |
3,62 |
49,15 |
5,48 |
|
|
Stock
rotation: |
8,31 |
8,40 |
3,79 |
7,32 |
119,13 |
14,76 |
|
|
Assets
turnover: |
1,13 |
1,17 |
0,62 |
1,02 |
83,23 |
13,97 |
|
|
Borrowing
Cost: |
2,19 |
2,89 |
1,65 |
2,88 |
32,86 |
0,19 |
|
>
Trend of indicators under the General Accounting Plan of 2007 (2014, 2013,
2012, 2011, 2010)
|
Cash
Flow |
2014 |
2013 |
2012 |
2011 |
2010 |
|
|
Cash
Flow over Sales: |
-0,06 % |
-0,15 % |
0,09 % |
-0,08 % |
-0,12 % |
|
|
EBITDA
over Sales: |
11,13 % |
0,78 % |
-9,36 % |
0,96 % |
4,18 % |
|
|
Cash
Flow Yield: |
-0,03 % |
-0,05 % |
0,04 % |
-0,04 % |
-0,07 % |
|
|
Profitability |
2014 |
2013 |
2012 |
2011 |
2010 |
|
|
Operating
economic profitability: |
10,98 % |
-0,20 % |
-7,72 % |
-0,24 % |
4,01 % |
|
|
Total
economic profitability: |
5,59 % |
8,12 % |
-5,33 % |
0,14 % |
2,14 % |
|
|
Financial
profitability: |
16,39 % |
146,38 % |
-60,96 % |
-10,39 % |
8,38 % |
|
|
Margin:
|
9,69 % |
-0,33 % |
-11,26 % |
-0,32 % |
4,11 % |
|
|
Mark-up:
|
6,55 % |
18,22 % |
-15,45 % |
-2,98 % |
0,71 % |
|
|
Solvency |
2014 |
2013 |
2012 |
2011 |
2010 |
|
|
Liquidity:
|
0,12 |
0,11 |
0,21 |
0,18 |
0,23 |
|
|
Acid
Test: |
0,75 |
0,81 |
1,02 |
1,16 |
1,13 |
|
|
Working
Capital / Investment: |
-0,08 |
-0,02 |
0,10 |
0,19 |
0,18 |
|
|
Solvency:
|
1,02 |
1,07 |
1,22 |
1,38 |
1,30 |
|
|
Indebtedness |
2014 |
2013 |
2012 |
2011 |
2010 |
|
|
Indebtedness
level: |
5,20 |
12,78 |
7,63 |
4,89 |
4,44 |
|
|
Borrowing
Composition: |
0,41 |
0,28 |
0,33 |
0,42 |
0,27 |
|
|
Repayment
Ability: |
-25,86 |
-17,18 |
23,16 |
-19,21 |
-10,95 |
|
|
Warranty:
|
1,20 |
1,08 |
1,14 |
1,22 |
1,22 |
|
|
Generated
resources / Total creditors: |
0,03 |
0,09 |
-0,04 |
-0,01 |
0,03 |
|
|
Efficiency |
2014 |
2013 |
2012 |
2011 |
2010 |
|
|
Productivity:
|
2,61 |
1,07 |
-0,29 |
1,14 |
1,90 |
|
|
Turnover
of Collection Rights : |
2,38 |
1,29 |
1,26 |
1,23 |
1,68 |
|
|
Turnover
of Payment Entitlements: |
1,10 |
0,74 |
1,24 |
1,14 |
1,30 |
|
|
Stock
rotation: |
8,31 |
3,79 |
5,86 |
5,74 |
7,90 |
|
|
Assets
turnover: |
1,13 |
0,62 |
0,69 |
0,77 |
0,98 |
|
|
Borrowing
Cost: |
2,19 |
1,65 |
1,55 |
2,08 |
2,05 |
|
COMPARATIVE
SECTORIAL BALANCE
|
Sector-based
Comparison under the rules of the New General Accounting Plan.
|
|
Variación - |
|
|
|
Empresa |
Sector |
|
|
Variación - |
|
|
|
Empresa |
Sector |
|
|
Variación - |
|
|
|
Empresa |
Sector |
|
News
|
|
Noticias
de Gipuzkoa |
20/11/2015 |
|
Anulado
el ERE de Gamesa en Altsasu |
|
|
Companies
related |
|
|
|
|
|
El
Periódico de Aragón |
12/02/2015 |
|
30
empleados de Gamesa Tauste optan por recolocarse |
|
|
Companies
related |
|
|
|
|
|
Public
Tenders and Works Won
|
No Public Tenders assigned to the
name of the company.
|
Detail
of Subsidies appearing in Balances Memories
|
|
Entity |
ORGANISMO NO ESPECIFICADO |
|
Subsidy Concept |
Subvenciones de capital |
|
Status |
CONCEDIDA |
|
Amount Granted |
418.000,00 |
|
Entity |
GOBIERNO DE NAVARRA. |
|
Subsidy Concept |
Subvención de capital. |
|
Status |
CONCEDIDA |
|
Amount Granted |
4.164.000,00 |
|
Notes |
Concesión 2011. |
|
Entity |
MINISTERIO DE INDUSTRIA, CIENCIA Y TECNOLOGIA. |
|
Subsidy Concept |
Subvención de capital. |
|
Status |
CONCEDIDA |
|
Amount Granted |
3.530.000,00 |
|
Notes |
Para la adquisición de elementos de inmovilizado.
El importe es el concedido en 2.007. |
|
Entity |
MINISTERIO DE ECONOMIA Y HACIENDA. |
|
Subsidy Concept |
Subvención de capital. |
|
Status |
CONCEDIDA |
|
Amount Granted |
3.450.000,00 |
|
Notes |
Para la adquisición de elementos de inmovilizado.
El importe es el concedido en 2.007. |
|
Entity |
MINISTERIO DE ECONOMIA Y HACIENDA |
|
Subsidy Concept |
Subvención de capital. |
|
Status |
CONCEDIDA |
|
Amount Granted |
2.096.000,00 |
|
Notes |
Para la adquisición de elementos de inmovilizado.
El importe es el concedido en 2.007. |
|
Entity |
AGENCIA DE DESARROLLO ECONOMICO DE CASTILLA Y
LEON |
|
Subsidy Concept |
Subvención de capital. |
|
Status |
CONCEDIDA |
|
Amount Granted |
1.719.000,00 |
|
Notes |
Para la adquisición de elementos de
inmovilizado.El importe es el concedido en 2.007. |
|
Entity |
MINISTERIO DE ECONOMIA Y HACIENDA |
|
Subsidy Concept |
Subvención de capital |
|
Status |
CONCEDIDA |
|
Amount Granted |
693.000,00 |
|
Notes |
Para la adquisición de elementos de inmovilizado.
Concedida en 2.002. |
|
Entity |
MINISTERIO DE ECONOMIA Y HACIENDA |
|
Subsidy Concept |
Subvención de capital. |
|
Status |
CONCEDIDA |
|
Amount Granted |
658.000,00 |
|
Notes |
Para la adquisición de elementos de inmovilizado.
El importe es el concedido en 2.006. |
|
Entity |
UNION EUROPEA |
|
Subsidy Concept |
Subvención de capital. |
|
Status |
CONCEDIDA |
|
Amount Granted |
267.000,00 |
|
Notes |
El importe es el concedido en 2.010. |
|
Entity |
MINISTERIO DE ECONOMIA Y HACIENDA. |
|
Subsidy Concept |
Subvención de capital. |
|
Status |
CONCEDIDA |
|
Amount Granted |
266.000,00 |
|
Notes |
Para la adquisición de elementos de inmovilizado.
El importe es el concedido en 2.009. |
|
Entity |
GOBIERNO DE NAVARRA. |
|
Subsidy Concept |
Subvención de capital. |
|
Status |
CONCEDIDA |
|
Amount Granted |
223.000,00 |
|
Notes |
Para la adquisición de elementos de inmovilizado.
El importe es el concedido en 2.007. |
|
Entity |
GOBIERNO DE NAVARRA. |
|
Subsidy Concept |
Subvención de capital. |
|
Status |
CONCEDIDA |
|
Amount Granted |
222.000,00 |
|
Notes |
Para la adquisición de elementos de inmovilizado.
El importe es el concedido en 2.008. |
|
Entity |
XUNTA DE GALICIA. |
|
Subsidy Concept |
Subvención de capital. |
|
Status |
CONCEDIDA |
|
Amount Granted |
221.000,00 |
|
Notes |
Para la adquisición de elementos de inmovilizado.
El importe es el concedido en 2.007. |
|
Entity |
GOBIERNO DE NAVARRA. |
|
Subsidy Concept |
Subvención de capital. |
|
Status |
CONCEDIDA |
|
Amount Granted |
145.000,00 |
|
Notes |
Para la adquisición de elementos de inmovilizado.
El importe es el concedido en 2.009. |
|
Entity |
INSTITUTO GALLEGO DE PROMOCION EMPRESARIAL. |
|
Subsidy Concept |
Subvención de capital. |
|
Status |
CONCEDIDA |
|
Amount Granted |
88.000,00 |
|
Notes |
Concesión 2012. |
|
Entity |
DEPARTAMENTO DE INDUSTRIA, INNOVACION, COMERCIO Y
TURISMO DE GOBIERNO VASCO |
|
Subsidy Concept |
Subvención de capital . |
|
Status |
CONCEDIDA |
|
Amount Granted |
70.000,00 |
|
Notes |
Concesión 2011. |
|
Entity |
DEPARTAMENTO DE INDUSTRIA INNOVACION COMERCIO Y
TURISMO DEL GOBIERNO VASCO |
|
Subsidy Concept |
Subvención de capital. |
|
Status |
CONCEDIDA |
|
Amount Granted |
19.000,00 |
|
Notes |
Concesión 2010. |
|
Entity |
MINISTERIO DE ECONOMIA Y HACIENDA |
|
Subsidy Concept |
Subvención de capital |
|
Status |
CONCEDIDA |
|
Amount Granted |
2.116.000,00 |
|
Notes |
Para la adquisición de elementos de inmovilizado.
Concedida en 2.007. |
|
Entity |
MINISTERIO DE ECONOMIA Y HACIENDA |
|
Subsidy Concept |
Subvención de capital. |
|
Status |
CONCEDIDA |
|
Amount Granted |
266.000,00 |
|
Notes |
Para la adquisición de elementos de inmovilizado.
El importe es el concedido en 2.009. |
|
Entity |
DEPARTAMENTO DE INDUSTRIA INNOVACION COMERCIO Y
TURISMO DEL GOBIERNO VASCO |
|
Subsidy Concept |
Subvención de capital. |
|
Status |
CONCEDIDA |
|
Amount Granted |
70.000,00 |
|
Notes |
Concesión 2011. |
|
Entity |
DEPARTAMENTO DE INDUSTRIA, INNOVACION, COMERCIO Y
TURISMO DE GOBIERNO VASCO |
|
Subsidy Concept |
Subvención de capital . |
|
Status |
CONCEDIDA |
|
Amount Granted |
19.000,00 |
|
Notes |
El importe es el concedido en 2.010. |
|
Entity |
UNION EUROPEA |
|
Subsidy Concept |
Subvención de capital |
|
Status |
CONCEDIDA |
|
Project |
Soporte técnico y desarrollo de pruebas a
realizar en los parques eólicos |
|
Amount Granted |
267.000,00 |
|
Notes |
El importe es el concedido en 2.010 |
|
Entity |
DEPARTAMENTO DE INDUSTRIA, INNOVACION, COMERCIO Y
TURISMO DE GOBIERNO VASCO |
|
Subsidy Concept |
Subvención de capital |
|
Status |
CONCEDIDA |
|
Project |
Proyecto de desarrollo tecnológico e innovación |
|
Amount Granted |
19.000,00 |
|
Notes |
El importe es el concedido en 2.010 |
|
Entity |
AGENCIA DE DESARROLLO ECONOMICO DE CASTILLA Y
LEON |
|
Subsidy Concept |
Subvención de capital |
|
Status |
CONCEDIDA |
|
Amount Granted |
1.719.000,00 |
|
Research
Summary
|
|
This company was
incorporated in 2006 and it's engaged in the design, manufacture and sale of
wind turbines and their components. It develops its activity at a national
and international level. It's part of the group GAMESA, one of the main wind
turbine producers worldwide. It's part of the exclusive group forming IBEX
35. There is nothing against registered among the sources consulted. For all
these reasons, we consider the company to keep being related in terms of risk
operations in keeping with its size. |
FOREIGN EXCHANGE RATES
|
Currency |
Unit
|
Indian Rupees |
|
US Dollar |
1 |
Rs.66.81 |
|
|
1 |
Rs.100.37 |
|
Euro |
1 |
Rs.70.68 |
|
EUR |
1 |
Rs.70.41 |
Note :
Above are approximate rates obtained from sources believed to be correct
INFORMATION DETAILS
|
Analysis Done by
: |
HNA |
|
|
|
|
Report Prepared
by : |
ANK |
RATING EXPLANATIONS
|
RATING |
STATUS |
PROPOSED CREDIT LINE |
|
|
>86 |
Aaa |
Possesses an extremely sound financial base with the strongest capability
for timely payment of interest and principal sums |
Unlimited |
|
71-85 |
Aa |
Possesses adequate working capital. No caution needed for credit
transaction. It has above average (strong) capability for payment of interest
and principal sums |
Large |
|
56-70 |
A |
Financial & operational base are regarded healthy. General
unfavourable factors will not cause fatal effect. Satisfactory capability for
payment of interest and principal sums |
Fairly Large |
|
41-55 |
Ba |
Overall operation is considered normal. Capable to meet normal
commitments. |
Satisfactory |
|
26-40 |
B |
Capability to overcome financial difficulties seems comparatively
below average. |
Small |
|
11-25 |
Ca |
Adverse factors are apparent. Repayment of interest and principal sums
in default or expected to be in default upon maturity |
Limited with
full security |
|
<10 |
C |
Absolute credit risk exists. Caution needed to be exercised |
Credit not
recommended |
|
-- |
NB |
New Business |
-- |
This score serves as a reference to assess
SC’s credit risk and to set the amount of credit to be extended. It is calculated
from a composite of weighted scores obtained from each of the major sections of
this report. The assessed factors and their relative weights (as indicated
through %) are as follows:
Financial
condition (40%) Ownership
background (20%) Payment record
(10%)
Credit history
(10%) Market trend (10%) Operational size
(10%)
This report is issued at your request without any
risk and responsibility on the part of MIRA INFORM PRIVATE LIMITED (MIPL)
or its officials.