MIRA INFORM REPORT
|
Report No. : |
352506 |
|
Report Date : |
08.12.2015 |
IDENTIFICATION DETAILS
|
Name : |
CHEMO IBERICA SA |
|
|
|
|
Registered Office : |
Gran Via Carlos Iii, 98 7ª Planta - Barcelona - 08028 - Madrid |
|
|
|
|
Country : |
Spain |
|
|
|
|
Financials (as on) : |
2014 |
|
|
|
|
Date of Incorporation : |
23.06.1977 |
|
|
|
|
Legal Form : |
Public Company |
|
|
|
|
Line of Business : |
Wholesale of Chemical Products. |
|
|
|
|
No. of Employees : |
Not Available |
RATING & COMMENTS
|
MIRA’s Rating : |
Ba |
|
RATING |
STATUS |
PROPOSED CREDIT LINE |
|
|
41-55 |
Ba |
Overall operation is considered normal. Capable to meet normal
commitments. |
Satisfactory |
|
Status : |
Satisfactory |
|
Payment Behaviour : |
No Complaints |
|
Litigation : |
Exist |
NOTES:
Any query related to this report can be made
on e-mail: infodept@mirainform.com
while quoting report number, name and date.
ECGC Country Risk Classification List – March 31, 2015
|
Country Name |
Previous Rating (31.12.2014) |
Current Rating (31.03.2015) |
|
Spain |
A1 |
A1 |
|
Risk Category |
ECGC
Classification |
|
Insignificant |
A1 |
|
Low |
A2 |
|
Moderate |
B1 |
|
High |
B2 |
|
Very High |
C1 |
|
Restricted |
C2 |
|
Off-credit |
D |
SPAIN - ECONOMIC OVERVIEW
After experiencing a prolonged recession in the wake of the global financial crisis that began in 2008, in 2014 Spain marked the first full year of positive economic growth in seven years, largely due to increased private consumption. At the onset of the global financial crisis Spain's GDP contracted by 3.7% in 2009, ending a 16-year growth trend, and continued contracting through most of 2013. In 2013 the government successfully shored up struggling banks - exposed to the collapse of Spain's depressed real estate and construction sectors - and in January 2014 completed an EU-funded restructuring and recapitalization program.
Until 2014, credit contraction in the private sector, fiscal austerity, and high unemployment weighed on domestic consumption and investment. The unemployment rate rose from a low of about 8% in 2007 to more than 26% in 2013, but labor reforms prompted a modest reduction to 23.7% in 2014. High unemployment strained Spain's public finances, as spending on social benefits increased while tax revenues fell. Spain’s budget deficit peaked at 11.4% of GDP in 2010, but Spain gradually reduced the deficit to just under 7% of GDP in 2013-14, slightly above the 6.5% target negotiated between Spain and the EU. Public debt has increased substantially – from 60.1% of GDP in 2010 to more than 97% in 2014.
Exports were resilient throughout the economic downturn and helped to bring Spain's current account into surplus in 2013 for the first time since 1986, where it remained in 2014. Rising labor productivity and an internal devaluation resulting from moderating labor costs and lower inflation have helped to improve foreign investor interest in the economy and positive FDI flows have been restored.
The government's efforts to implement labor, pension, health, tax, and education reforms - aimed at supporting investor sentiment - have become overshadowed by political activity in 2015 in anticipation of the national parliamentary elections in November. Spain’s 2015 budget, published in September 2014, rolls back some recently imposed taxes in advance of the elections and leaves untouched the country’s value-added tax (VAT) regime, which continues to generate significantly lower revenue than the EU average. Spain’s borrowing costs are dramatically lower since their peak in mid-2012, and despite the recent uptic in economic activity, inflation has dropped sharply, from 1.5% in 2013 to nearly flat in 2014.
|
Source
: CIA |
EXECUTIVE
SUMMARY
|
|
Name: |
CHEMO IBERICA SA |
|
NIF / Fiscal code: |
A08460990 |
|
Status: |
ACTIVE |
|
Incorporation Date: |
23/06/1977 |
|
Register Data |
Register Section 8 Sheet 30063 |
|
Last Publication
in BORME: |
21/04/2015 [Appointments] |
|
Last Published Account Deposit: |
2014 |
|
Share Capital: |
601.012,10 |
|
|
|
|
Localization: |
Gran Via Carlos Iii, 98 7ª Planta - Barcelona - 08028 - Madrid |
|
Telephone - Fax - Email - Website: |
Telephone. 913 534 400 Website. www.chemogroup.com |
|
Number of Branches |
3 |
|
|
|
|
Activity: |
|
|
NACE: |
4675 - Wholesale of chemical products |
|
Registered Trademarks: |
|
|
Audited / Opinion: |
Si / |
|
Tenders and Awards: |
|
|
Subsidies: |
0 for a total cost of 0 |
|
Quality Certificate: |
No |
|
|
|
|
Defaults, Legal
Claims and Insolvency Proceedings : |
|
|
|
|
|
|
|
Number |
Amount (€) |
Most Recent
Entry |
|
Insolvency Proceedings, Bankruptcy and Suspension of Payments |
|
Unpublished |
--- |
--- |
|
Defaults on debt with Financial Institutions and Large Companies |
|
None |
--- |
--- |
|
Judicial Claims (Notices, Executive Proceedings, Attachments,
Auctions, Bad Debt) |
|
1 |
0 |
--- |
|
Proceedings heard by the Civil Court |
|
Unpublished |
0 |
--- |
|
Proceedings heard by the Labour Court |
|
Unpublished |
0 |
--- |
Partners
|
|
CHEMO HOLDING SL |
100 % |
|
|
Shares: |
1 |
|
|
Other Links: |
4 |
|
|
No. of Active Corporate Bodies: |
|
|
|
Ratios |
2014 |
2013 |
Change |
|
|
|
|
|
Guarantees: |
|
|
Properties Registered: |
Company NO, Administrator NO |
|
Financing / Guarantee Sources : |
Sources YES, Guarantees YES |
|
|
|
|
INVESTIGATION SUMMARY |
|
|
The corporation was established many years ago, and it has experience
in the sector of activities it carries out, though its invoicing has
decreased with a percentage of 2,05% in 2014, in comparison to the previous
year. It complies regularly with its payment obligations. |
|
|
Interviewed Person: |
|
Enquiry
Details
|
|
|
Business address
regime: |
Rent |
Identification
|
|
|
Social
Denomination: |
CHEMO IBERICA SA |
|
NIF / Fiscal
code: |
A08460990 |
|
Corporate
Status: |
ACTIVE |
|
Start of
activity: |
1977 |
|
Registered
Office: |
GRAN VIA CARLOS III, 98 7ª PLANTA |
|
Locality: |
BARCELONA |
|
Province: |
MADRID |
|
Postal Code: |
08028 |
|
Telephone: |
913 534 400 |
|
Fax: |
917 668 963 |
|
Website: |
www.chemogroup.com |
|
Interviewed
Person: |
Empleado |
Branch
Offices
|
|
Address |
Postal Code |
City |
Province |
|
GRAN VIA CALLE GRAN VIA CARLES III 98 7 |
08028 |
BARCELONA |
BARCELONA |
|
CALLE CORTS 23 |
08028 |
BARCELONA |
BARCELONA |
|
Av. Burgos, 113 |
28050 |
MADRID |
MADRID |
Activity
|
|
|
NACE: |
4675 |
|
CNAE Obtaining
Source: |
4675 |
|
Legal Form: |
PURCHASE AND SALE, IMPORTATION AND EXPORTATION OF CHEMICAL AND PHARMACEUTICAL
PRODUCTS AND FOOD, INCLUDING THE HUMAN SANITARY APPLICATIONS, ANIMAL OR
VEGETAL, AS WELL AS MACHINERY, EQUIPS AND TOOLS FOR ITS PRODUCTION. THE
MANAGEMENT OF VALUES OF NON-PRESIDENT ENTITIES. MANUFACTURING OF CHEMICAL
PRODUCTS, PHARMACEUTICAL AND FOOD. |
|
Additional
Information: |
It is dedicated to the purchase and sale of raw materials for
pharmaceutical industry and solutions for immediate applications in all the
cycle of vital products, from its development and registry to the manufacturing
and its direct or indirect handling. |
|
Additional
Address: |
GRAN VIA CARLOS III, 98 7ª PLANTA 08028 BARCELONA , registered office
C/ QUINTANAPALLA, 2 4ª PLANTA 28050 MADRID , registered office and offices. |
|
Import / export: |
IMPORTS / EXPORTS |
|
Future
Perspective: |
Consolidation |
|
Industry
situation: |
Maturity |
Chronological
Summary
|
|||
|
|
Year |
Act |
|
|
|
1991 |
Accounts deposit (year 1989, 1990) Appointments/ Re-elections (3) Cessations/
Resignations/ Reversals (1) |
|
|
|
1992 |
Accounts deposit (year 1991) Adaptation to Law (1) Appointments/
Re-elections (3) Cessations/ Resignations/ Reversals (1) Correction (2)
Statutory Modifications (1) |
|
|
|
1993 |
Accounts deposit (year 1992 consolidated, 1992) Appointments/
Re-elections (2) Capital Reduction (1) Cessations/ Resignations/ Reversals
(2) Increase of Capital (1) |
|
|
|
1994 |
Accounts deposit (year 1993) Appointments/ Re-elections (2) Cessations/
Resignations/ Reversals (1) |
|
|
|
1995 |
Accounts deposit (year 1994) |
|
|
|
1996 |
Accounts deposit (year 1995) Appointments/ Re-elections (3)
Cessations/ Resignations/ Reversals (2) Change of Social Purpose (1) Other Concepts/
Events (1) Statutory Modifications (1) |
|
|
|
1997 |
Accounts deposit (year 1996) Appointments/ Re-elections (1) |
|
|
|
1998 |
Accounts deposit (year 1997) Appointments/ Re-elections (1) |
|
|
|
1999 |
Appointments/ Re-elections (1) |
|
|
|
2000 |
Accounts deposit (year 1998) Appointments/ Re-elections (4)
Cessations/ Resignations/ Reversals (1) |
|
|
|
2001 |
Accounts deposit (year 1999, 2000) Appointments/ Re-elections (2) Change
of Social Purpose (1) |
|
|
|
2002 |
Appointments/ Re-elections (2) Cessations/ Resignations/ Reversals (1) |
|
|
|
2003 |
Accounts deposit (year 2001, 2002) Appointments/ Re-elections (4)
Cessations/ Resignations/ Reversals (5) |
|
|
|
2004 |
Accounts deposit (year 2003) Appointments/ Re-elections (2) |
|
|
|
2005 |
Appointments/ Re-elections (4) Cessations/ Resignations/ Reversals (1)
Declaration of Sole Propietorship (1) Other Concepts/ Events (1) |
|
|
|
2006 |
Accounts deposit (year 2004, 2005) Appointments/ Re-elections (7)
Cessations/ Resignations/ Reversals (1) |
|
|
|
2007 |
Accounts deposit (year 2006) Appointments/ Re-elections (5)
Cessations/ Resignations/ Reversals (4) |
|
|
|
2008 |
Accounts deposit (year 2007) Appointments/ Re-elections (4)
Cessations/ Resignations/ Reversals (4) |
|
|
|
2009 |
Accounts deposit (year 2008) Appointments/ Re-elections (9)
Cessations/ Resignations/ Reversals (7) |
|
|
|
2010 |
Accounts deposit (year 2009) Appointments/ Re-elections (2) |
|
|
|
2011 |
Accounts deposit (year 2010) Appointments/ Re-elections (4)
Cessations/ Resignations/ Reversals (3) |
|
|
|
2012 |
Accounts deposit (year 2011) Appointments/ Re-elections (5)
Cessations/ Resignations/ Reversals (5) |
|
|
|
2013 |
Appointments/ Re-elections (1) Cessations/ Resignations/ Reversals (1)
Change of Social Purpose (1) |
|
|
|
2014 |
Accounts deposit (year 2012) Appointments/ Re-elections (4)
Cessations/ Resignations/ Reversals (3) Declaration of Sole Propietorship (1)
Other Concepts/ Events (1) |
|
|
|
2015 |
Accounts deposit (year 2013, 2014) Appointments/ Re-elections (2) Cessations/
Resignations/ Reversals (1) |
|
Main
Historic Changes
|
|||
|
Concept |
Publication |
Act |
Date |
|
Corporate Purpose Changes: |
LA COMPRA Y VENTA, IMPORT-EXPORT., DE PRODUCTOS QUIMICOS FARMACEUTICOS
Y ALIMENTICIOS, INCLUIDOS LOS DE APLICACION EN SANIDAD HUMANA, ANIMAL O
VEGETAL, ASICOMO DE MAQUINARIA, EQUIPOS Y UTILLAJES PARA SU PRODUCCION. LA
GESTIONDE VALORES DE ENTIDADES NO RESIDENTES |
Corporate Purpose Change |
01/06/2001 |
|
|
LA COMPRA Y VENTA, IMPORT-EXPORT., DE PRODUCTOS QUIMICOS FARMACEUTICOS
Y ALIMENTICIOS, INCLUIDOS LOS DE APLICACION EN SANIDAD HUMANA, ANIMAL O
VEGETAL, ASICOMO DE MAQUINARIA, EQUIPOS Y UTILLAJES PARA SU PRODUCCION. |
Corporate Purpose Change |
31/05/1996 |
Breakdown
of Owners' Equity
|
|
|
Registered
Capital: |
601.012,10 |
|
Paid up capital: |
601.012,10 |
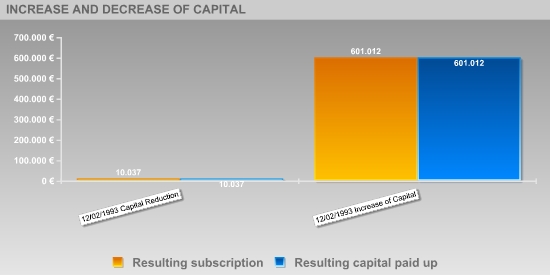
Updated
Evolution of the Subscribed and Paid-in Capital
|
|||||
|
|
|||||
|
|
|
|
|
|
|
|
Publishing Date |
Registration
Type |
Capital
Subscribed |
Paid up capital |
Underwritten
result |
Disbursed Result |
|
12/02/1993 |
Capital Reduction |
-590.975 |
-590.975 |
10.037 |
10.037 |
|
12/02/1993 |
Increase of Capital |
590.975 |
590.975 |
601.012 |
601.012 |
Active
Social Bodies
|
|
Post published |
Social Body's
Name |
Appointment Date |
Other Positions
in this Company |
|
SINGLE PARTNER |
CHEMO HOLDING SL |
11/03/2014 |
1 |
|
PRESIDENT |
ROMERO CAMACHO SILOS CARLOS |
10/04/2015 |
4 |
|
VICE CHAIRMAN |
PONCE GUTIERREZ IGNACIO |
20/08/2014 |
6 |
|
MEMBER OF THE BOARD |
ROMERO CAMACHO SILOS CARLOS |
10/04/2015 |
4 |
|
|
PONCE GUTIERREZ IGNACIO |
20/08/2014 |
6 |
|
|
MARTIN MORAN SANDRA |
20/08/2014 |
2 |
|
SECRETARY |
MARTIN MORAN SANDRA |
20/08/2014 |
2 |
|
NON CONSELLOR ASSISTANT SECRETARY |
GARCIA MARINA LAURA |
20/08/2014 |
2 |
|
ACCOUNTS' AUDITOR / HOLDER |
KPMG AUDITORES SL |
18/02/2015 |
5 |
Historical
Social Bodies
|
|
Social Body's
Name |
Post published |
End Date |
Other Positions
in this Company |
|
ALCALDE GIRAUDO ISABEL |
NON CONSELLOR SECRETARY |
29/08/1996 |
23 |
|
|
NON CONSELLOR SECRETARY |
08/09/1997 |
|
|
|
NON CONSELLOR SECRETARY |
20/10/1998 |
|
|
|
NON CONSELLOR SECRETARY |
18/09/1999 |
|
|
|
NON CONSELLOR SECRETARY |
12/09/2000 |
|
|
|
NON CONSELLOR SECRETARY |
15/09/2001 |
|
|
|
NON CONSELLOR SECRETARY |
21/10/2002 |
|
|
|
NON CONSELLOR SECRETARY |
13/08/2003 |
|
|
|
NON CONSELLOR SECRETARY |
30/08/2004 |
|
|
|
NON CONSELLOR SECRETARY |
31/08/2005 |
|
|
|
NON CONSELLOR SECRETARY |
02/08/2006 |
|
|
|
NON CONSELLOR SECRETARY |
16/08/2007 |
|
|
|
NON CONSELLOR SECRETARY |
08/08/2008 |
|
|
|
NON CONSELLOR SECRETARY |
14/08/2009 |
|
|
|
NON CONSELLOR SECRETARY |
27/08/2010 |
|
|
|
NON CONSELLOR SECRETARY |
09/08/2011 |
|
|
|
NON CONSELLOR SECRETARY |
20/08/2014 |
|
|
|
NON CONSELLOR SECRETARY |
05/10/2012 |
|
|
|
NON CONSELLOR SECRETARY |
12/08/2013 |
|
|
CAGNI GONZALEZ CARLOS ALBERTO |
MEMBER OF THE BOARD |
27/02/1996 |
8 |
|
|
NON CONSELLOR SECRETARY |
26/03/1992 |
|
|
|
SECRETARY |
27/02/1996 |
|
|
CANTERO CID EDUARDO |
MEMBER OF THE BOARD |
30/08/2004 |
23 |
|
|
MEMBER OF THE BOARD |
31/08/2005 |
|
|
|
MEMBER OF THE BOARD |
02/08/2006 |
|
|
|
MEMBER OF THE BOARD |
16/08/2007 |
|
|
|
MEMBER OF THE BOARD |
08/08/2008 |
|
|
|
MEMBER OF THE BOARD |
14/08/2009 |
|
|
|
MEMBER OF THE BOARD |
27/08/2010 |
|
|
|
MEMBER OF THE BOARD |
09/08/2011 |
|
|
|
MEMBER OF THE BOARD |
05/10/2012 |
|
|
|
MEMBER OF THE BOARD |
12/08/2013 |
|
|
|
MEMBER OF THE BOARD |
20/08/2014 |
|
|
CARSI ZEGRI SANTIAGO MIGUEL |
MEMBER OF THE BOARD |
13/08/2003 |
13 |
|
|
MEMBER OF THE BOARD |
15/09/2001 |
|
|
|
MEMBER OF THE BOARD |
29/08/1996 |
|
|
|
MEMBER OF THE BOARD |
21/10/2002 |
|
|
|
MEMBER OF THE BOARD |
18/09/1999 |
|
|
|
MEMBER OF THE BOARD |
12/09/2000 |
|
|
|
MEMBER OF THE BOARD |
08/09/1997 |
|
|
|
MEMBER OF THE BOARD |
20/10/1998 |
|
|
CHEMO ESPAÑA SL |
SINGLE PARTNER |
11/03/2014 |
1 |
|
COOPERS AND LYBRAND SA |
ACCOUNTS' AUDITOR / HOLDER |
07/04/1992 |
3 |
|
|
CONSOLIDATED ACCOUNTS' AUDITOR |
28/02/1994 |
|
|
|
CONSOLIDATED ACCOUNTS' AUDITOR |
05/04/2000 |
|
|
DE ANDRES REBOLLO PEDRO |
MEMBER OF THE BOARD |
31/08/2005 |
26 |
|
|
MEMBER OF THE BOARD |
02/08/2006 |
|
|
|
PRESIDENT |
12/08/2013 |
|
|
|
PRESIDENT |
09/08/2011 |
|
|
|
PRESIDENT |
27/08/2010 |
|
|
|
MEMBER OF THE BOARD |
12/08/2013 |
|
|
|
MEMBER OF THE BOARD |
30/08/2004 |
|
|
|
MEMBER OF THE BOARD |
09/08/2011 |
|
|
|
MEMBER OF THE BOARD |
05/10/2012 |
|
|
|
MEMBER OF THE BOARD |
14/08/2009 |
|
|
|
PRESIDENT |
14/08/2009 |
|
|
|
MEMBER OF THE BOARD |
27/08/2010 |
|
|
|
MEMBER OF THE BOARD |
16/08/2007 |
|
|
|
MEMBER OF THE BOARD |
08/08/2008 |
|
|
|
PRESIDENT |
05/10/2012 |
|
|
ERNST & YOUNG SL |
ACCOUNTS' AUDITOR / HOLDER |
09/02/2007 |
1 |
|
GERMANO ALBERTI |
MEMBER OF THE BOARD |
29/08/1996 |
7 |
|
|
MEMBER OF THE BOARD |
08/09/1997 |
|
|
|
MEMBER OF THE BOARD |
20/10/1998 |
|
|
|
MEMBER OF THE BOARD |
18/09/1999 |
|
|
|
MEMBER OF THE BOARD |
12/09/2000 |
|
|
|
MEMBER OF THE BOARD |
21/10/2002 |
|
|
|
MEMBER OF THE BOARD |
15/09/2001 |
|
|
GUSTAVO DANIEL LORENZO PELIZZARI |
MEMBER OF THE BOARD |
27/08/2010 |
22 |
|
|
MEMBER OF THE BOARD |
09/08/2011 |
|
|
|
MEMBER OF THE BOARD |
12/08/2013 |
|
|
|
MEMBER OF THE BOARD |
05/10/2012 |
|
|
|
MEMBER OF THE BOARD |
20/08/2014 |
|
|
|
PRESIDENT |
20/08/2014 |
|
|
|
MEMBER OF THE BOARD |
10/04/2015 |
|
|
|
PRESIDENT |
10/04/2015 |
|
|
KENNETH CAMERON |
MEMBER OF THE BOARD |
26/03/1992 |
2 |
|
|
MEMBER OF THE BOARD |
27/02/1996 |
|
|
KPMG AUDITORES SL |
ACCOUNTS' AUDITOR / HOLDER |
23/12/2010 |
5 |
|
|
ACCOUNTS' AUDITOR / HOLDER |
03/02/2011 |
|
|
|
ACCOUNTS' AUDITOR / HOLDER |
18/02/2015 |
|
|
|
ACCOUNTS' AUDITOR / HOLDER |
13/01/2014 |
|
|
LORENZO PELIZZARI GUSTAVO DANIEL |
MEMBER OF THE BOARD |
14/08/2009 |
1 |
|
MARIANO BAÑADO CARLOS |
MEMBER OF THE BOARD |
27/08/2010 |
5 |
|
|
MEMBER OF THE BOARD |
14/08/2009 |
|
|
|
MEMBER OF THE BOARD |
09/08/2011 |
|
|
|
MEMBER OF THE BOARD |
05/10/2012 |
|
|
MORAN IMAZ FRANCISCO JAVIER |
NON CONSELLOR ASSISTANT SECRETARY |
05/10/2012 |
8 |
|
|
VICE SECRETARY |
12/08/2013 |
|
|
|
MEMBER OF THE BOARD |
12/08/2013 |
|
|
|
NON CONSELLOR ASSISTANT SECRETARY |
09/08/2011 |
|
|
|
NON CONSELLOR ASSISTANT SECRETARY |
27/08/2010 |
|
|
|
NON CONSELLOR ASSISTANT SECRETARY |
14/08/2009 |
|
|
|
MEMBER OF THE BOARD |
20/08/2014 |
|
|
|
VICE SECRETARY |
20/08/2014 |
|
|
PAOLO OLIGERI |
MEMBER OF THE BOARD |
16/03/2007 |
10 |
|
|
MEMBER OF THE BOARD |
16/08/2007 |
|
|
|
MEMBER OF THE BOARD |
18/03/2008 |
|
|
|
MEMBER OF THE BOARD |
01/06/2006 |
|
|
PEREZ CARLOS FRANCESC |
PRESIDENT |
02/08/2006 |
16 |
|
|
MEMBER OF THE BOARD |
02/08/2006 |
|
|
|
MEMBER OF THE BOARD |
31/08/2005 |
|
|
|
PRESIDENT |
31/08/2005 |
|
|
|
PRESIDENT |
30/08/2004 |
|
|
|
MEMBER OF THE BOARD |
30/08/2004 |
|
|
|
PRESIDENT |
08/08/2008 |
|
|
|
MEMBER OF THE BOARD |
08/08/2008 |
|
|
|
MEMBER OF THE BOARD |
16/08/2007 |
|
|
|
PRESIDENT |
16/08/2007 |
|
|
|
MEMBER OF THE BOARD |
02/12/2008 |
|
|
|
PRESIDENT |
02/12/2008 |
|
|
PICORNELL DARDER CARLOS |
MEMBER OF THE BOARD |
27/02/1996 |
30 |
|
|
MEMBER OF THE BOARD |
29/08/1996 |
|
|
|
MEMBER OF THE BOARD |
08/09/1997 |
|
|
|
MEMBER OF THE BOARD |
20/10/1998 |
|
|
|
MEMBER OF THE BOARD |
18/09/1999 |
|
|
|
MEMBER OF THE BOARD |
12/09/2000 |
|
|
|
MEMBER OF THE BOARD |
15/09/2001 |
|
|
|
MEMBER OF THE BOARD |
21/10/2002 |
|
|
|
MEMBER OF THE BOARD |
13/08/2003 |
|
|
|
MEMBER OF THE BOARD |
22/12/2003 |
|
|
|
PRESIDENT |
27/02/1996 |
|
|
|
PRESIDENT |
29/08/1996 |
|
|
|
PRESIDENT |
08/09/1997 |
|
|
|
PRESIDENT |
20/10/1998 |
|
|
|
PRESIDENT |
18/09/1999 |
|
|
|
PRESIDENT |
12/09/2000 |
|
|
|
PRESIDENT |
15/09/2001 |
|
|
|
PRESIDENT |
21/10/2002 |
|
|
|
PRESIDENT |
13/08/2003 |
|
|
|
PRESIDENT |
22/12/2003 |
|
|
PRICE WATERHOUSE COOPERS AUDITORES SL |
ACCOUNTS' AUDITOR / HOLDER |
07/02/2005 |
4 |
|
|
ACCOUNTS' AUDITOR / HOLDER |
15/09/2001 |
|
|
|
ACCOUNTS' AUDITOR / HOLDER |
21/10/2002 |
|
|
|
ACCOUNTS' AUDITOR / HOLDER |
20/01/2004 |
|
|
PRICE WATERHOUSE COOPERS SL |
ACCOUNTS' AUDITOR / HOLDER |
12/09/2000 |
1 |
|
SANZ SANCHEZ EDUARDO CARLOS |
MEMBER OF THE BOARD |
23/04/2009 |
3 |
|
SIGMAN GOLD LEANDRO MARTIN |
MEMBER OF THE BOARD |
13/08/2003 |
2 |
Defaults,
Legal Claims and Insolvency Proceedings
|
Section enabling assessment of the degree of compliance of the company
queried with its payment obligations. It provides information on the existence
and nature of all stages of Insolvency and Legal Proceedings published with
reference to the Company in the country's various Official Bulletins and
national newspapers, as well Defaults Registered in the main national credit
bureaus (ASNEF Industrial and RAI ).
> Summary
Chronological
summary
|
|
|
Number of
Publications |
Amount (_) |
Start date |
End date |
|
Insolvency Proceedings, Bankruptcy and Suspension of Payments |
|
Unpublished |
--- |
--- |
--- |
|
Request/Declaration |
|
0 |
--- |
date |
|
|
Proceedings |
|
--- |
--- |
|
--- |
|
Resolution |
|
--- |
--- |
|
--- |
|
Defaults on debt with Financial Institutions and Large Companies |
Bank and Commercial Delinquency |
None |
0 |
|
|
|
Status: Friendly |
|
--- |
|
|
|
|
Status: Pre-Litigation |
|
--- |
|
|
|
|
Status: Litigation |
|
--- |
|
|
|
|
Status: Non-performing |
|
--- |
|
|
|
|
Status: insolvency proceedings, bankruptcy and suspension of payments |
|
--- |
|
|
|
|
Other status |
|
--- |
|
|
|
|
Legal and Administrative Proceedings |
|
1 |
--- |
02/03/2012 |
02/03/2012 |
|
Notices of defaults and enforcement |
|
1 |
--- |
|
--- |
|
Seizures |
|
--- |
--- |
|
--- |
|
Auctions |
|
--- |
--- |
|
--- |
|
Declarations of insolvency and bad debt |
|
--- |
--- |
|
--- |
|
Proceedings heard by the Civil Court |
|
Unpublished |
--- |
|
|
|
Proceedings heard by the Labour Court |
|
Unpublished |
--- |
|
|
Probability of default
|
> Estimated Probability of Default for the next 12 months:
0.245 %
|
Sector in which comparison is carried out: 467 Other specialised wholesale |
|
|
Relative Position:
|
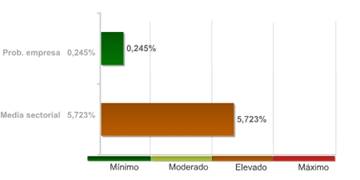
The company's comparative analysis with the rest of the companies that
comprise the sector, shows the company holds a better position with regard to
the probability of non-compliance.
The 99.00% of the companies of the sector CHEMO IBERICA SA belongs to
show a higher probability of non-compliance.
The probability of the company's non-compliance with its payment
obligations within deadlines estimated by our qualifications models is 0.245%.
In the event they fail to comply with the payment, the seriousness of
the loss will depend on factors such as the promptness of the commencement of
the charging management, the existence of executive documents which match the
credit or the existence of guarantees and free debt assets under the name of
the debtor. Therefore, the probability of non-compliance should not be solely
interpreted as the total loss of the owed amount.
LEGAL CLAIMS
|
|
Summary of Judicial Claims |
|
|
|
|
|
|
|
|
||
|
|
|
No se han publicado |
|
|
|
|
No se han publicado |
|
|
|
|
||
|
|
|
No se han publicado |
|
|
|
|
No se han publicado |
|
|
|
|
No se han publicado |
|
|
|
|
|
|
|
|
|
||
|
|
|
No se han publicado |
|
|
|
|
No se han publicado |
|
|
|
|
||
|
|
|
No se han publicado |
|
|
Incidences Detailed |
|
Incidences with the Local Administration |
|
|
|
Last Published Stage: |
EXECUTION NOTIFICATION |
|
Record Number: |
12058024834 |
|
Amount of the incidence: |
0,00 E |
|
Requested by: |
ADMINISTRACION LOCAL |
|
Published domicile: |
(DESCONOCIDA) |
|
Source: |
BOLETIN OFICIAL DEL AYUNTAMIENTO DE MADRID Nº6638, 2012 PAGINA 41 |
Link
List
|
|
IS RELATED WITH: |
4 Entities |
|
PARTICIPATES IN: |
1 Entities |
|
SHAREHOLDERS: |
1 Entities |
> Shareholders
|
Relationship |
Entity |
Province |
Shareholding stake |
|
SHAREHOLDERS |
CHEMO HOLDING SL |
MADRID |
100 |
|
PARTICIPATES IN |
MAPRIMED, SOCIEDAD ANONIMA, (ARGENTINA) |
|
50 |
> Other relationships
|
Relationship |
Entity |
Province |
Shareholding stake |
|
IS RELATED WITH |
| | |
|
|
|
|
CHEMO ESPAÑA SL |
MADRID |
|
|
|
EXELTIS PATICIPAÇOES LTDA |
|
|
|
|
MERCK SHARP & DOHME DE ESPAÑA SAE |
MADRID |
|
|
|
QUIMICA SINTETICA SA |
BARCELONA |
|
Turnover
|
|
|
Total Sales 2014 |
47.220.130 |
The sales data is from the latest available financial statements in
axesor. Failing that, are estimates data calculated by statistical methods.
Financial
Accounts and Balance Sheets
|
Financial Years
Presented
|
Ejercicio |
Tipo de Cuentas
Anuales |
Fecha
Presentacion |
|
2014 |
Normales |
July 2015 |
|
2013 |
Normales |
February 2015 |
|
2012 |
Normales |
January 2014 |
|
2011 |
Normales |
October 2012 |
|
2010 |
Normales |
August 2011 |
|
2009 |
Normales |
September 2010 |
|
2008 |
Normales |
November 2009 |
|
2007 |
Normales |
October 2008 |
|
2006 |
Normales |
September 2007 |
|
2005 |
Normales |
August 2006 |
|
2004 |
Normales |
November 2005 |
|
2003 |
Normales |
September 2004 |
|
2002 |
Normales |
October 2003 |
|
2001 |
Normales |
May 2003 |
|
2000 |
Normales |
August 2001 |
|
1999 |
Normales |
March 2001 |
|
1998 |
Normales |
December 1999 |
|
1997 |
Normales |
October 1998 |
|
1996 |
Normales |
July 1997 |
|
1995 |
Normales |
July 1996 |
|
1994 |
Normales |
July 1995 |
|
1993 |
Normales |
September 1994 |
|
1992 |
Consolidadas |
September 1993 |
|
1992 |
Normales |
August 1993 |
|
1991 |
Normales |
September 1992 |
|
1990 |
Normales |
September 1991 |
|
1989 |
Normales |
December 1990 |
The data in the
report regarding the last Company Accounts submitted by the company is taken from
the TRADE REGISTER serving the region in which the company's address is located
31/12/2014
> Normal format Balance in accordance with the New Accounting
Plan 2007
Information
corresponding to the fiscal year
2014 2013 2012 2011 2010 is taken from information
submitted to the TRADE REGISTER. Data corresponding to fiscal years before
2014 2013 2012 2011 2010 has been compiled based on
the equivalence criteria stipulated in Act JUS/206/2009. Where the provisions
of the Act did not establish relevant equivalence criteria, such criteria using
its own methodology. To view details on the methodology.
|
|
ORIGINAL |
ORIGINAL |
ORIGINAL |
ORIGINAL |
ORIGINAL |
|
|
Assets |
2014 |
2013 |
2012 |
2011 |
2010 |
|
|
A) NON-CURRENT ASSETS: 11000 |
35.749.616,00 |
43.133.492,00 |
63.704.323,00 |
33.826.131,00 |
51.678.137,00 |
|
|
I. Intangible fixed assets : 11100 |
17.401,00 |
20.967,00 |
23.957,00 |
13.487,00 |
580,00 |
|
|
1. Development: 11110 |
0,00 |
0,00 |
0,00 |
0,00 |
0,00 |
|
|
2. Concessions: 11120 |
0,00 |
0,00 |
0,00 |
0,00 |
0,00 |
|
|
3. Patents, licencing, trade
marks and similar: 11130 |
0,00 |
0,00 |
0,00 |
0,00 |
0,00 |
|
|
4. Goodwill: 11140 |
0,00 |
0,00 |
0,00 |
0,00 |
0,00 |
|
|
5. IT applications:
11150 |
17.401,00 |
20.967,00 |
23.957,00 |
13.487,00 |
580,00 |
|
|
6. Investigation:
11160 |
0,00 |
0,00 |
0,00 |
0,00 |
0,00 |
|
|
7. Intellectual property:
11180 |
0,00 |
0,00 |
0,00 |
0,00 |
0,00 |
|
|
8. Greenhouse gas emission
allowance: 11190 |
0,00 |
0,00 |
0,00 |
0,00 |
0,00 |
|
|
9. Other intangible fixed
assets. : 11170 |
0,00 |
0,00 |
0,00 |
0,00 |
0,00 |
|
|
II. Tangible fixed assets : 11200 |
373.867,00 |
353.996,00 |
341.922,00 |
347.624,00 |
213.580,00 |
|
|
1. Land and buildings:
11210 |
0,00 |
0,00 |
2.720,00 |
10.021,00 |
16.692,00 |
|
|
2. Technical installations
and other tangible fixed assets: 11220 |
373.867,00 |
353.996,00 |
339.202,00 |
337.603,00 |
196.888,00 |
|
|
3. Tangible asset in progress
and advances: 11230 |
0,00 |
0,00 |
0,00 |
0,00 |
0,00 |
|
|
III. Real estate investment: 11300 |
0,00 |
0,00 |
0,00 |
0,00 |
0,00 |
|
|
1. Land: 11310 |
0,00 |
0,00 |
0,00 |
0,00 |
0,00 |
|
|
2. Buildings: 11320 |
0,00 |
0,00 |
0,00 |
0,00 |
0,00 |
|
|
IV. Long-term investments in Group companies and
associates : 11400 |
35.352.700,00 |
42.758.529,00 |
63.338.444,00 |
33.465.020,00 |
51.463.977,00 |
|
|
1. Equity instruments:
11410 |
0,00 |
5.505.829,00 |
2.940.744,00 |
2.940.744,00 |
2.940.744,00 |
|
|
2. Credits to businesses:
11420 |
35.350.000,00 |
37.250.000,00 |
60.395.000,00 |
30.500.000,00 |
48.500.000,00 |
|
|
3. Debt securities:
11430 |
0,00 |
0,00 |
0,00 |
0,00 |
0,00 |
|
|
4. Derivatives : 11440 |
0,00 |
0,00 |
0,00 |
0,00 |
0,00 |
|
|
5. Other financial assets :
11450 |
2.700,00 |
2.700,00 |
2.700,00 |
24.276,00 |
23.233,00 |
|
|
6. Other investments:
11460 |
0,00 |
0,00 |
0,00 |
0,00 |
0,00 |
|
|
V. Long-term financial investments: 11500 |
0,00 |
0,00 |
0,00 |
0,00 |
0,00 |
|
|
1. Equity instruments:
11510 |
0,00 |
0,00 |
0,00 |
0,00 |
0,00 |
|
|
2. Credits to third parties
: 11520 |
0,00 |
0,00 |
0,00 |
0,00 |
0,00 |
|
|
3. Debt securities:
11530 |
0,00 |
0,00 |
0,00 |
0,00 |
0,00 |
|
|
4. Derivatives : 11540 |
0,00 |
0,00 |
0,00 |
0,00 |
0,00 |
|
|
5. Other financial assets :
11550 |
0,00 |
0,00 |
0,00 |
0,00 |
0,00 |
|
|
6. Other investments:
11560 |
0,00 |
0,00 |
0,00 |
0,00 |
0,00 |
|
|
VI. Assets for deferred tax : 11600 |
5.648,00 |
0,00 |
0,00 |
0,00 |
0,00 |
|
|
VII. Non-current trade debts : 11700 |
0,00 |
0,00 |
0,00 |
0,00 |
0,00 |
|
|
B) CURRENT ASSETS: 12000 |
13.715.751,00 |
15.538.333,00 |
11.611.465,00 |
35.001.984,00 |
10.443.542,00 |
|
|
I. Non-current assets held for sale : 12100 |
0,00 |
0,00 |
0,00 |
0,00 |
0,00 |
|
|
II. Stocks: 12200 |
238.225,00 |
1.043.829,00 |
263.166,00 |
382.366,00 |
561.908,00 |
|
|
1. Commercial: 12210 |
216.666,00 |
1.020.844,00 |
228.740,00 |
278.502,00 |
415.085,00 |
|
|
2. Primary material and
other supplies: 12220 |
0,00 |
0,00 |
0,00 |
0,00 |
0,00 |
|
|
3. Work in progress:
12230 |
0,00 |
0,00 |
0,00 |
0,00 |
0,00 |
|
|
a) Of
long-term production cycle : 12231 |
0,00 |
0,00 |
0,00 |
0,00 |
0,00 |
|
|
b) Of
short-term production cycle : 12232 |
0,00 |
0,00 |
0,00 |
0,00 |
0,00 |
|
|
4. Finished goods:
12240 |
0,00 |
0,00 |
0,00 |
0,00 |
0,00 |
|
|
a) Of
long-term production cycle : 12241 |
0,00 |
0,00 |
0,00 |
0,00 |
0,00 |
|
|
b) Of
short-term production cycle : 12242 |
0,00 |
0,00 |
0,00 |
0,00 |
0,00 |
|
|
5. By-products, residues and
recycled materials: 12250 |
0,00 |
0,00 |
0,00 |
0,00 |
0,00 |
|
|
6. Advances to suppliers:
12260 |
21.559,00 |
22.985,00 |
34.426,00 |
103.864,00 |
146.823,00 |
|
|
III. Trade debtors and others receivable
accounts: 12300 |
12.114.407,00 |
14.063.665,00 |
10.252.229,00 |
15.767.584,00 |
8.963.470,00 |
|
|
1. Trade debtors / accounts
receivable: 12310 |
11.935.056,00 |
11.332.991,00 |
9.680.359,00 |
12.922.289,00 |
7.697.687,00 |
|
|
a)
Long-term receivables from sales and services supplied : 12311 |
0,00 |
0,00 |
0,00 |
0,00 |
0,00 |
|
|
b) Customers
for sales and provisions of services : 12312 |
11.935.056,00 |
11.332.991,00 |
9.680.359,00 |
12.922.289,00 |
7.697.687,00 |
|
|
2. Customers, Group
companies and associates : 12320 |
128.716,00 |
2.594.376,00 |
493.323,00 |
2.748.815,00 |
1.165.449,00 |
|
|
3. Other accounts
receivable: 12330 |
0,00 |
0,00 |
0,00 |
0,00 |
0,00 |
|
|
4. Personnel: 12340 |
50.635,00 |
23.642,00 |
78.547,00 |
93.992,00 |
55.174,00 |
|
|
5. Assets for deferred tax:
12350 |
0,00 |
0,00 |
0,00 |
0,00 |
0,00 |
|
|
6. Other debtors, including
tax and social security: 12360 |
0,00 |
112.656,00 |
0,00 |
2.488,00 |
45.160,00 |
|
|
7. Called up share capital: 12370 |
0,00 |
0,00 |
0,00 |
0,00 |
0,00 |
|
|
IV. Short-term investments in Group companies and
associates: 12400 |
1.012.017,00 |
68.965,00 |
703.715,00 |
18.000.000,00 |
297.953,00 |
|
|
1. Equity instruments:
12410 |
0,00 |
0,00 |
0,00 |
0,00 |
0,00 |
|
|
2. Credits to businesses:
12420 |
1.012.017,00 |
68.965,00 |
703.715,00 |
18.000.000,00 |
297.953,00 |
|
|
3. Debt securities:
12430 |
0,00 |
0,00 |
0,00 |
0,00 |
0,00 |
|
|
4. Derivatives : 12440 |
0,00 |
0,00 |
0,00 |
0,00 |
0,00 |
|
|
5. Other financial assets :
12450 |
0,00 |
0,00 |
0,00 |
0,00 |
0,00 |
|
|
6. Other investments:
12460 |
0,00 |
0,00 |
0,00 |
0,00 |
0,00 |
|
|
V. Short-term financial investments : 12500 |
200.000,00 |
200.000,00 |
200.000,00 |
200.000,00 |
200.000,00 |
|
|
1. Equity instruments:
12510 |
0,00 |
0,00 |
0,00 |
0,00 |
0,00 |
|
|
2. Credits to businesses:
12520 |
0,00 |
0,00 |
0,00 |
0,00 |
0,00 |
|
|
3. Debt securities:
12530 |
0,00 |
0,00 |
0,00 |
0,00 |
0,00 |
|
|
4. Derivatives : 12540 |
0,00 |
0,00 |
0,00 |
0,00 |
0,00 |
|
|
5. Other financial assets :
12550 |
200.000,00 |
200.000,00 |
200.000,00 |
200.000,00 |
200.000,00 |
|
|
6. Other investments:
12560 |
0,00 |
0,00 |
0,00 |
0,00 |
0,00 |
|
|
VI. Short-term accruals: 12600 |
20.595,00 |
34.949,00 |
16.364,00 |
16.085,00 |
44.328,00 |
|
|
VII. Cash and other equivalent liquid assets :
12700 |
130.507,00 |
126.925,00 |
175.991,00 |
635.949,00 |
375.883,00 |
|
|
1. Treasury: 12710 |
30.507,00 |
126.925,00 |
175.991,00 |
139.740,00 |
75.883,00 |
|
|
2. Other equivalent liquid
assets: 12720 |
100.000,00 |
0,00 |
0,00 |
496.209,00 |
300.000,00 |
|
|
TOTAL ASSETS (A + B) : 10000 |
49.465.367,00 |
58.671.825,00 |
75.315.788,00 |
68.828.115,00 |
62.121.679,00 |
|
|
|
ORIGINAL |
ORIGINAL |
ORIGINAL |
ORIGINAL |
ORIGINAL |
|
|
Liabilities and
Net Worth |
2014 |
2013 |
2012 |
2011 |
2010 |
|
|
A) NET WORTH: 20000 |
35.373.339,00 |
28.247.185,00 |
41.254.236,00 |
44.329.732,00 |
50.152.039,00 |
|
|
A-1) Shareholders' equity: 21000 |
35.373.339,00 |
28.247.185,00 |
41.254.236,00 |
44.329.732,00 |
50.152.039,00 |
|
|
I. Capital: 21100 |
601.000,00 |
601.000,00 |
601.000,00 |
601.000,00 |
601.000,00 |
|
|
1. Registered capital :
21110 |
601.000,00 |
601.000,00 |
601.000,00 |
601.000,00 |
601.000,00 |
|
|
2. (Uncalled capital):
21120 |
0,00 |
0,00 |
0,00 |
0,00 |
0,00 |
|
|
II. Share premium: 21200 |
147.744,00 |
147.744,00 |
147.744,00 |
147.744,00 |
147.744,00 |
|
|
III. Reserves: 21300 |
27.498.441,00 |
25.505.492,00 |
28.580.988,00 |
31.403.294,00 |
37.877.424,00 |
|
|
1. Legal and statutory:
21310 |
120.202,00 |
120.202,00 |
120.202,00 |
120.202,00 |
120.202,00 |
|
|
2. Other reserves:
21320 |
27.378.239,00 |
25.385.290,00 |
28.460.786,00 |
31.283.092,00 |
37.757.222,00 |
|
|
3. Revaluation reserves:
21330 |
0,00 |
0,00 |
0,00 |
0,00 |
0,00 |
|
|
IV. (Common stock equity): 21400 |
0,00 |
0,00 |
0,00 |
0,00 |
0,00 |
|
|
V. Results from previous periods: 21500 |
0,00 |
0,00 |
0,00 |
0,00 |
0,00 |
|
|
1. Brought forward:
21510 |
0,00 |
0,00 |
0,00 |
0,00 |
0,00 |
|
|
2. (Negative results from
previous periods): 21520 |
0,00 |
0,00 |
0,00 |
0,00 |
0,00 |
|
|
VI. Other shareholders' contributions:
21600 |
0,00 |
0,00 |
0,00 |
0,00 |
0,00 |
|
|
VII. Result of the period: 21700 |
7.126.154,00 |
1.992.949,00 |
11.924.504,00 |
12.177.694,00 |
11.525.871,00 |
|
|
VIII. (Interim dividend): 21800 |
0,00 |
0,00 |
0,00 |
0,00 |
0,00 |
|
|
IX. Other net worth instruments: 21900 |
0,00 |
0,00 |
0,00 |
0,00 |
0,00 |
|
|
A-2) Adjustments due to changes in value:
22000 |
0,00 |
0,00 |
0,00 |
0,00 |
0,00 |
|
|
I. Financial assets held for sale: 22100 |
0,00 |
0,00 |
0,00 |
0,00 |
0,00 |
|
|
II. Hedge operations: 22200 |
0,00 |
0,00 |
0,00 |
0,00 |
0,00 |
|
|
III. Linked non-current assets and liabilities
held for sale : 22300 |
0,00 |
0,00 |
0,00 |
0,00 |
0,00 |
|
|
IV. Exchange rate difference: 22400 |
0,00 |
0,00 |
0,00 |
0,00 |
0,00 |
|
|
V. Other: 22500 |
0,00 |
0,00 |
0,00 |
0,00 |
0,00 |
|
|
A-3) Received subsidies, donations and legacies:
23000 |
0,00 |
0,00 |
0,00 |
0,00 |
0,00 |
|
|
B) NON-CURRENT LIABILITIES: 31000 |
443.215,00 |
7.499.266,00 |
19.585.652,00 |
740.761,00 |
921.635,00 |
|
|
I. Long-term provisions: 31100 |
0,00 |
0,00 |
123.692,00 |
740.761,00 |
739.177,00 |
|
|
1. Long-term employee
benefits liability: 31110 |
0,00 |
0,00 |
0,00 |
0,00 |
0,00 |
|
|
2. Environmental actions:
31120 |
0,00 |
0,00 |
0,00 |
0,00 |
0,00 |
|
|
3. Restructuring provisions:
31130 |
0,00 |
0,00 |
0,00 |
0,00 |
0,00 |
|
|
4. Other provisions:
31140 |
0,00 |
0,00 |
123.692,00 |
740.761,00 |
739.177,00 |
|
|
II Long-term creditors: 31200 |
128.233,00 |
7.116.832,00 |
19.311.962,00 |
0,00 |
0,00 |
|
|
1. Liabilities and other
securities: 31210 |
0,00 |
0,00 |
0,00 |
0,00 |
0,00 |
|
|
2. Amounts owed to credit
institutions: 31220 |
0,00 |
7.000.000,00 |
19.311.962,00 |
0,00 |
0,00 |
|
|
3. Creditors from financial leasing:
31230 |
0,00 |
0,00 |
0,00 |
0,00 |
0,00 |
|
|
4. Derivatives : 31240 |
128.233,00 |
116.832,00 |
0,00 |
0,00 |
0,00 |
|
|
5. Other financial
liabilities : 31250 |
0,00 |
0,00 |
0,00 |
0,00 |
0,00 |
|
|
III. Long-term debts with Group companies and
associates: 31300 |
0,00 |
0,00 |
0,00 |
0,00 |
0,00 |
|
|
IV. Liabilities for deferred tax: 31400 |
314.982,00 |
382.434,00 |
149.998,00 |
0,00 |
182.458,00 |
|
|
V. Long-term accruals: 31500 |
0,00 |
0,00 |
0,00 |
0,00 |
0,00 |
|
|
VI. Non-current trade creditors : 31600 |
0,00 |
0,00 |
0,00 |
0,00 |
0,00 |
|
|
VII. Special long-term debts : 31700 |
0,00 |
0,00 |
0,00 |
0,00 |
0,00 |
|
|
C) CURRENT LIABILITIES : 32000 |
13.648.813,00 |
22.925.374,00 |
14.475.900,00 |
23.757.622,00 |
11.048.005,00 |
|
|
I. Liabilities linked to non-current assets held
for sale: 32100 |
0,00 |
0,00 |
0,00 |
0,00 |
0,00 |
|
|
II. Short-term provisions: 32200 |
0,00 |
10.373.283,00 |
0,00 |
0,00 |
0,00 |
|
|
1. Provisions from
greenhouse gas emission allowance: 32210 |
0,00 |
0,00 |
0,00 |
0,00 |
0,00 |
|
|
2. Other provisions:
32220 |
0,00 |
10.373.283,00 |
0,00 |
0,00 |
0,00 |
|
|
III. Short-term creditors : 32300 |
0,00 |
2.909.271,00 |
702.847,00 |
622.536,00 |
45.542,00 |
|
|
1. Liabilities and other
securities: 32310 |
0,00 |
0,00 |
0,00 |
0,00 |
0,00 |
|
|
2. Amounts owed to credit
institutions: 32320 |
0,00 |
2.909.271,00 |
702.847,00 |
622.536,00 |
45.542,00 |
|
|
3. Creditors from financial
leasing: 32330 |
0,00 |
0,00 |
0,00 |
0,00 |
0,00 |
|
|
4. Derivatives : 32340 |
0,00 |
0,00 |
0,00 |
0,00 |
0,00 |
|
|
5. Other financial
liabilities : 32350 |
0,00 |
0,00 |
0,00 |
0,00 |
0,00 |
|
|
IV. Short-term debts with Group companies and
associates: 32400 |
0,00 |
16,00 |
0,00 |
6.076.824,00 |
0,00 |
|
|
V. Trade creditors and other accounts payable:
32500 |
13.648.813,00 |
9.642.804,00 |
13.773.053,00 |
17.058.262,00 |
11.002.463,00 |
|
|
1. Suppliers: 32510 |
2.809.086,00 |
837.285,00 |
549.467,00 |
808.163,00 |
981.898,00 |
|
|
a)
Long-term debts : 32511 |
0,00 |
0,00 |
0,00 |
0,00 |
0,00 |
|
|
b)
Short-term debts : 32512 |
2.809.086,00 |
837.285,00 |
549.467,00 |
808.163,00 |
981.898,00 |
|
|
2. Suppliers, Group
companies and associates: 32520 |
9.867.625,00 |
7.877.999,00 |
12.260.318,00 |
15.580.838,00 |
8.449.272,00 |
|
|
3. Other creditors:
32530 |
533.218,00 |
600.163,00 |
548.242,00 |
359.022,00 |
322.615,00 |
|
|
4. Personnel (remuneration
due): 32540 |
205.636,00 |
208.620,00 |
221.955,00 |
212.920,00 |
344.952,00 |
|
|
5. Liabilities for current
tax: 32550 |
0,00 |
0,00 |
0,00 |
0,00 |
0,00 |
|
|
6. Other accounts payable to
Public Administrations.: 32560 |
122.296,00 |
86.630,00 |
193.071,00 |
97.319,00 |
43.014,00 |
|
|
7. Advances from clients:
32570 |
110.952,00 |
32.107,00 |
0,00 |
0,00 |
860.712,00 |
|
|
VI. Short-term accruals: 32600 |
0,00 |
0,00 |
0,00 |
0,00 |
0,00 |
|
|
VII. Special short-term debts : 32700 |
0,00 |
0,00 |
0,00 |
0,00 |
0,00 |
|
|
TOTAL NET WORTH AND LIABILITIES (A + B + C) : 30000 |
49.465.367,00 |
58.671.825,00 |
75.315.788,00 |
68.828.115,00 |
62.121.679,00 |
|
|
|
ORIGINAL |
ORIGINAL |
ORIGINAL |
ORIGINAL |
ORIGINAL |
|
|
Profit and
Loss |
2014 |
2013 |
2012 |
2011 |
2010 |
|
|
1. Net turnover: 40100 |
47.220.130,00 |
48.207.298,00 |
56.071.779,00 |
64.453.012,00 |
52.714.431,00 |
|
|
a) Sales: 40110 |
47.220.130,00 |
48.207.298,00 |
56.071.779,00 |
64.453.012,00 |
52.714.431,00 |
|
|
b) Rendering of services: 40120 |
0,00 |
0,00 |
0,00 |
0,00 |
0,00 |
|
|
c) Income of financial nature of holding
companies: 40130 |
0,00 |
0,00 |
0,00 |
0,00 |
0,00 |
|
|
2. Changes in stocks of finished goods and work in progress:
40200 |
0,00 |
0,00 |
0,00 |
0,00 |
0,00 |
|
|
3. Works carried out by the company for its assets: 40300 |
0,00 |
0,00 |
0,00 |
0,00 |
0,00 |
|
|
4. Supplies : 40400 |
-37.804.660,00 |
-37.267.599,00 |
-42.480.180,00 |
-51.089.151,00 |
-42.700.307,00 |
|
|
a) Stock consumption: 40410 |
-36.890.354,00 |
-37.259.355,00 |
-42.480.180,00 |
-51.089.151,00 |
-42.733.540,00 |
|
|
b) Consumption of raw materials and miscellaneous
consumable ones: 40420 |
0,00 |
0,00 |
0,00 |
0,00 |
0,00 |
|
|
c) Works carried out by other companies:
40430 |
0,00 |
0,00 |
0,00 |
0,00 |
0,00 |
|
|
d) Impairment of stock, primary material and
other supplies: 40440 |
-914.306,00 |
-8.244,00 |
0,00 |
0,00 |
33.233,00 |
|
|
5. Other operating income: 40500 |
12.156.166,00 |
13.542.415,00 |
14.487.577,00 |
12.773.725,00 |
11.920.839,00 |
|
|
a) Auxiliary income and other from current
management: 40510 |
12.151.486,00 |
13.538.741,00 |
14.484.914,00 |
12.773.725,00 |
11.898.217,00 |
|
|
b) Operation subsidies included in the
Period's result: 40520 |
4.680,00 |
3.674,00 |
2.663,00 |
0,00 |
22.622,00 |
|
|
6. Personnel costs: 40600 |
-2.098.819,00 |
-2.187.646,00 |
-2.048.757,00 |
-1.893.269,00 |
-2.046.668,00 |
|
|
a) Wages, salaries et al.: 40610 |
-1.756.937,00 |
-1.833.290,00 |
-1.747.451,00 |
-1.599.309,00 |
-1.769.946,00 |
|
|
b) Social security costs: 40620 |
-341.882,00 |
-354.356,00 |
-301.306,00 |
-293.960,00 |
-276.722,00 |
|
|
c) Provisions : 40630 |
0,00 |
0,00 |
0,00 |
0,00 |
0,00 |
|
|
7. Other operating costs: 40700 |
-7.895.530,00 |
-8.734.534,00 |
-8.822.088,00 |
-7.607.057,00 |
-7.465.710,00 |
|
|
a) External services: 40710 |
-7.589.405,00 |
-8.701.386,00 |
-8.220.663,00 |
-7.592.722,00 |
-7.286.778,00 |
|
|
b) Taxes: 40720 |
-274.871,00 |
0,00 |
-47.455,00 |
-42.401,00 |
-50.864,00 |
|
|
c) Losses, impairments and variation in
provisions from trade operations : 40730 |
-31.254,00 |
-33.148,00 |
-553.970,00 |
28.066,00 |
-128.068,00 |
|
|
d) Other current management expenditure :
40740 |
0,00 |
0,00 |
0,00 |
0,00 |
0,00 |
|
|
e) Expenses due to greenhouse gas emissions:
40750 |
0,00 |
0,00 |
0,00 |
0,00 |
0,00 |
|
|
8. Amortisation of fixed assets: 40800 |
-94.426,00 |
-81.226,00 |
-84.978,00 |
-65.870,00 |
-63.513,00 |
|
|
9. Allocation of subsidies of non-financial fixed assets and other:
40900 |
0,00 |
0,00 |
0,00 |
0,00 |
0,00 |
|
|
10. Excess provisions : 41000 |
0,00 |
0,00 |
0,00 |
0,00 |
0,00 |
|
|
11. Impairment and result of transfers of fixed assets: 41100 |
3.637,00 |
0,00 |
2.733,00 |
-241,00 |
-35.876,00 |
|
|
a) Impairment and losses : 41110 |
0,00 |
0,00 |
0,00 |
0,00 |
0,00 |
|
|
b) Results for transfers and other : 41120 |
3.637,00 |
0,00 |
2.733,00 |
-241,00 |
-35.876,00 |
|
|
c) Impairment and profit due to disposals of
assets of holding companies: 41130 |
0,00 |
0,00 |
0,00 |
0,00 |
0,00 |
|
|
12. Negative difference in combined businesses: 41200 |
0,00 |
0,00 |
0,00 |
0,00 |
0,00 |
|
|
13. Other results : 41300 |
9.496.887,00 |
-10.249.591,00 |
617.069,00 |
20.532,00 |
2.395.794,00 |
|
|
A.1) OPERATING INCOME (1 + 2 + 3 + 4 + 5 + 6 + 7 + 8 + 9 + 10 + 11 +
12 + 13) : 49100 |
20.983.385,00 |
3.229.117,00 |
17.743.155,00 |
16.591.681,00 |
14.718.990,00 |
|
|
14. Financial income : 41400 |
1.369.497,00 |
1.150.390,00 |
1.549.927,00 |
1.520.408,00 |
527.695,00 |
|
|
a) Of shares in equity instruments : 41410 |
0,00 |
0,00 |
0,00 |
0,00 |
0,00 |
|
|
a 1) In Group companies and
associates: 41411 |
0,00 |
0,00 |
0,00 |
0,00 |
0,00 |
|
|
a 2) In third parties:
41412 |
0,00 |
0,00 |
0,00 |
0,00 |
0,00 |
|
|
b) From negotiable securities and other financial
instruments : 41420 |
1.369.497,00 |
1.150.390,00 |
1.549.927,00 |
1.520.408,00 |
527.695,00 |
|
|
b 1) From Group companies
and associates : 41421 |
638.845,00 |
1.150.390,00 |
1.483.120,00 |
1.520.140,00 |
527.077,00 |
|
|
b 2) From third parties :
41422 |
730.652,00 |
0,00 |
66.807,00 |
268,00 |
618,00 |
|
|
c) Allocation of financial subsidies, donations
and legacies : 41430 |
0,00 |
0,00 |
0,00 |
0,00 |
0,00 |
|
|
15. Financial expenditure: 41500 |
-502.384,00 |
-1.163.684,00 |
-599.259,00 |
-52.622,00 |
-37.364,00 |
|
|
a) Amounts owed to Group companies and associates
: 41510 |
0,00 |
0,00 |
0,00 |
0,00 |
0,00 |
|
|
b) For debts with third parties : 41520 |
-502.384,00 |
-1.163.684,00 |
-599.259,00 |
-30.506,00 |
-17.117,00 |
|
|
c) Stock renewal : 41530 |
0,00 |
0,00 |
0,00 |
-22.116,00 |
-20.247,00 |
|
|
16. Changes in fair value of financial instruments : 41600 |
-11.401,00 |
-116.832,00 |
0,00 |
0,00 |
0,00 |
|
|
a) Trading book and other : 41610 |
0,00 |
0,00 |
0,00 |
0,00 |
0,00 |
|
|
b) Allocation of financial assets held for sale
to the result for the period: 41620 |
0,00 |
-116.832,00 |
0,00 |
0,00 |
0,00 |
|
|
17. Exchange rate differences : 41700 |
598.007,00 |
-284.943,00 |
-368.532,00 |
-662.016,00 |
1.222.855,00 |
|
|
18. Impairment and result for transfers of financial instruments:
41800 |
-8.717.465,00 |
0,00 |
0,00 |
0,00 |
0,00 |
|
|
a) Impairment and losses : 41810 |
-8.717.465,00 |
0,00 |
0,00 |
0,00 |
0,00 |
|
|
b) Results for transfers and other : 41820 |
0,00 |
0,00 |
0,00 |
0,00 |
0,00 |
|
|
19. Other financial income and expenditure: 42100 |
0,00 |
0,00 |
0,00 |
0,00 |
0,00 |
|
|
a) Incorporation of financial expenditure to
assets: 42110 |
0,00 |
0,00 |
0,00 |
0,00 |
0,00 |
|
|
b) Financial income from arrangement with
creditors: 42120 |
0,00 |
0,00 |
0,00 |
0,00 |
0,00 |
|
|
c) Other income and expenditure: 42130 |
0,00 |
0,00 |
0,00 |
0,00 |
0,00 |
|
|
A.2) FINANCIAL REVENUE (14+15+16+17+18+19) : 49200 |
-7.263.746,00 |
-415.069,00 |
582.136,00 |
805.770,00 |
1.713.186,00 |
|
|
A.3) NET RESULT BEFORE TAXES (A.1+A.2) : 49300 |
13.719.639,00 |
2.814.048,00 |
18.325.291,00 |
17.397.451,00 |
16.432.176,00 |
|
|
20. Income taxes: 41900 |
-6.593.485,00 |
-821.099,00 |
-6.400.787,00 |
-5.219.757,00 |
-4.906.305,00 |
|
|
A.4) PROFIT AFTER TAXES (A.3+20) : 49400 |
7.126.154,00 |
1.992.949,00 |
11.924.504,00 |
12.177.694,00 |
11.525.871,00 |
|
|
21. Result of the year coming from interrupted operations :
42000 |
0,00 |
0,00 |
0,00 |
0,00 |
0,00 |
|
|
A.5) RESULT OF THE PERIOD (A.4+21) : 49500 |
7.126.154,00 |
1.992.949,00 |
11.924.504,00 |
12.177.694,00 |
11.525.871,00 |
|
> Normal Balance Sheet under the rules of the 1990 General Accounting
Plan (repealed since 1st January of 2008)
Information corresponding
to the fiscal year 2014 2013 2012 2011 2010 has been
compiled based on the equivalence criteria stipulated in Act JUS/206/2009.
Where the provisions of the Act did not establish relevant equivalence
criteria, such criteria using its own methodology. To view details on the
methodology 2014 2013 2012 2011 2010 is taken from
information submitted to the TRADE REGISTER.
|
|
EQUIVALENCIA |
EQUIVALENCIA |
EQUIVALENCIA |
EQUIVALENCIA |
EQUIVALENCIA |
|
|
ASSETS |
2014 |
2013 |
2012 |
2011 |
2010 |
|
|
A) SHAREHOLDERS (PARTNERS) BY UNCALLED SUSCRIBED CAPITAL: |
0,00 |
0,00 |
0,00 |
0,00 |
0,00 |
|
|
B) FIXED ASSETS: |
35.743.968,00 |
43.133.492,00 |
63.704.323,00 |
33.826.131,00 |
51.678.137,00 |
|
|
I. Formation expenses: |
0,00 |
0,00 |
0,00 |
0,00 |
0,00 |
|
|
II. Intangible fixed assets: |
17.401,00 |
20.967,00 |
23.957,00 |
13.487,00 |
580,00 |
|
|
1. Research and development
costs: |
0,00 |
0,00 |
0,00 |
0,00 |
0,00 |
|
|
2. Concessions, patents,
licences, trademarks et al.: |
0,00 |
0,00 |
0,00 |
0,00 |
0,00 |
|
|
3. Goodwill: |
0,00 |
0,00 |
0,00 |
0,00 |
0,00 |
|
|
4. Key money paid for
premises: |
0,00 |
0,00 |
0,00 |
0,00 |
0,00 |
|
|
5. Software: |
17.401,00 |
20.967,00 |
23.957,00 |
13.487,00 |
580,00 |
|
|
6. Assets under capital
leases: |
0,00 |
0,00 |
0,00 |
0,00 |
0,00 |
|
|
7. Payments on account:
|
0,00 |
0,00 |
0,00 |
0,00 |
0,00 |
|
|
8. Provisions: |
0,00 |
0,00 |
0,00 |
0,00 |
0,00 |
|
|
9. Accumulated depreciation:
|
0,00 |
0,00 |
0,00 |
0,00 |
0,00 |
|
|
III. Tangible fixed assets: |
373.867,00 |
353.996,00 |
341.922,00 |
347.624,00 |
213.580,00 |
|
|
1. Land and construction:
|
0,00 |
0,00 |
2.720,00 |
10.021,00 |
16.692,00 |
|
|
2. Technical installations and
machinery: |
0,00 |
0,00 |
0,00 |
0,00 |
0,00 |
|
|
3. Other installations,
tools and furniture: |
172.015,00 |
162.872,00 |
156.066,00 |
155.330,00 |
90.587,00 |
|
|
4. Payments on account and tangible
fixed assets under construction: |
0,00 |
0,00 |
0,00 |
0,00 |
0,00 |
|
|
5. Other tangible assets:
|
201.852,00 |
191.124,00 |
183.136,00 |
182.273,00 |
106.301,00 |
|
|
6. Provisions: |
0,00 |
0,00 |
0,00 |
0,00 |
0,00 |
|
|
7. Accumulated depreciation:
|
0,00 |
0,00 |
0,00 |
0,00 |
0,00 |
|
|
IV. Financial investments: |
35.352.700,00 |
42.758.529,00 |
63.338.444,00 |
33.465.020,00 |
51.463.977,00 |
|
|
1. Equity investments in
group companies: |
0,00 |
5.505.829,00 |
2.940.744,00 |
2.940.744,00 |
2.940.744,00 |
|
|
2. Receivables from group
companies: |
35.350.000,00 |
37.250.000,00 |
60.395.000,00 |
30.500.000,00 |
48.500.000,00 |
|
|
3. Equity investment in
associated companies: |
0,00 |
0,00 |
0,00 |
0,00 |
0,00 |
|
|
4. Credits to associated
companies: |
0,00 |
0,00 |
0,00 |
0,00 |
0,00 |
|
|
5. Long-term securities
portfolio: |
0,00 |
0,00 |
0,00 |
0,00 |
0,00 |
|
|
6. Other receivables: |
0,00 |
0,00 |
0,00 |
0,00 |
0,00 |
|
|
7. Long term guarantees and
deposits: |
2.700,00 |
2.700,00 |
2.700,00 |
24.276,00 |
23.233,00 |
|
|
8. Provisions: |
0,00 |
0,00 |
0,00 |
0,00 |
0,00 |
|
|
9. Long-term receivables
from public bodies: |
0,00 |
0,00 |
0,00 |
0,00 |
0,00 |
|
|
V. Own shares: |
0,00 |
0,00 |
0,00 |
0,00 |
0,00 |
|
|
VI. Long-term trade receivables: |
0,00 |
0,00 |
0,00 |
0,00 |
0,00 |
|
|
C) Deferred expenses: |
0,00 |
0,00 |
0,00 |
0,00 |
0,00 |
|
|
D) CURRENT ASSETS: |
13.721.399,00 |
15.538.333,00 |
11.611.465,00 |
35.001.984,00 |
10.443.542,00 |
|
|
I. Called-up share capital (not paid): |
0,00 |
0,00 |
0,00 |
0,00 |
0,00 |
|
|
II. Stocks: |
238.225,00 |
1.043.829,00 |
263.166,00 |
382.366,00 |
561.908,00 |
|
|
1. Goods for resale: |
216.666,00 |
1.020.844,00 |
228.740,00 |
278.502,00 |
415.085,00 |
|
|
2. Raw materials and other
consumables: |
0,00 |
0,00 |
0,00 |
0,00 |
0,00 |
|
|
3. Goods in process and semifinished
ones: |
0,00 |
0,00 |
0,00 |
0,00 |
0,00 |
|
|
4. Finished products: |
0,00 |
0,00 |
0,00 |
0,00 |
0,00 |
|
|
5. Byproducts, scrap and
recovered materials: |
0,00 |
0,00 |
0,00 |
0,00 |
0,00 |
|
|
6. Payments on account:
|
21.559,00 |
22.985,00 |
34.426,00 |
103.864,00 |
146.823,00 |
|
|
7. Provisions: |
0,00 |
0,00 |
0,00 |
0,00 |
0,00 |
|
|
III. Debtors: |
12.120.055,00 |
14.063.665,00 |
10.252.229,00 |
15.767.584,00 |
8.963.470,00 |
|
|
1. Trade debtors / accounts
receivable: |
11.935.056,00 |
11.332.991,00 |
9.680.359,00 |
12.922.289,00 |
7.697.687,00 |
|
|
2. Accounts receivable,
Group companies: |
128.716,00 |
2.594.376,00 |
493.323,00 |
2.748.815,00 |
1.165.449,00 |
|
|
3. Accounts receivable,
associated companies: |
0,00 |
0,00 |
0,00 |
0,00 |
0,00 |
|
|
4. Other debtors: |
0,00 |
0,00 |
0,00 |
0,00 |
0,00 |
|
|
5. Staff: |
50.635,00 |
23.642,00 |
78.547,00 |
93.992,00 |
55.174,00 |
|
|
6. Public bodies: |
5.648,00 |
112.656,00 |
0,00 |
2.488,00 |
45.160,00 |
|
|
7. Provisions: |
0,00 |
0,00 |
0,00 |
0,00 |
0,00 |
|
|
IV. Short-term investments: |
1.312.017,00 |
268.965,00 |
903.715,00 |
18.696.209,00 |
797.953,00 |
|
|
1. Equity investments in
group companies: |
0,00 |
0,00 |
0,00 |
0,00 |
0,00 |
|
|
2. Receivables from group
companies: |
1.012.017,00 |
68.965,00 |
703.715,00 |
18.000.000,00 |
297.953,00 |
|
|
3. Equity investment in
associated companies: |
0,00 |
0,00 |
0,00 |
0,00 |
0,00 |
|
|
4. Credits to associated
companies: |
0,00 |
0,00 |
0,00 |
0,00 |
0,00 |
|
|
5. Short term securities
portfolio: |
100.000,00 |
0,00 |
0,00 |
496.209,00 |
300.000,00 |
|
|
6. Other receivables: |
0,00 |
0,00 |
0,00 |
0,00 |
0,00 |
|
|
7. Shor term guarantees and
deposits: |
200.000,00 |
200.000,00 |
200.000,00 |
200.000,00 |
200.000,00 |
|
|
8. Provisions: |
0,00 |
0,00 |
0,00 |
0,00 |
0,00 |
|
|
V. Short-term treasury shares: |
0,00 |
0,00 |
0,00 |
0,00 |
0,00 |
|
|
VI. Cash at bank and in hand: |
30.507,00 |
126.925,00 |
175.991,00 |
139.740,00 |
75.883,00 |
|
|
VII. Prepayments and accrued income: |
20.595,00 |
34.949,00 |
16.364,00 |
16.085,00 |
44.328,00 |
|
|
GENERAL TOTAL (A + B + C + D): |
49.465.367,00 |
58.671.825,00 |
75.315.788,00 |
68.828.115,00 |
62.121.679,00 |
|
MERCANTILE
REGISTRY.
|
|
EQUIVALENCIA |
EQUIVALENCIA |
EQUIVALENCIA |
EQUIVALENCIA |
EQUIVALENCIA |
|
|
LIABILITIES |
2014 |
2013 |
2012 |
2011 |
2010 |
|
|
A) EQUITY: |
35.501.572,00 |
28.364.017,00 |
41.254.236,00 |
44.329.732,00 |
50.152.039,00 |
|
|
I. Subscribed capital: |
601.000,00 |
601.000,00 |
601.000,00 |
601.000,00 |
601.000,00 |
|
|
II. Share premium: |
147.744,00 |
147.744,00 |
147.744,00 |
147.744,00 |
147.744,00 |
|
|
III. Revaluation reserves: |
0,00 |
0,00 |
0,00 |
0,00 |
0,00 |
|
|
IV. Reserves: |
27.626.674,00 |
25.622.324,00 |
28.580.988,00 |
31.403.294,00 |
37.877.424,00 |
|
|
1. Legal reserve: |
120.202,00 |
120.202,00 |
120.202,00 |
120.202,00 |
120.202,00 |
|
|
2. Reserves for own shares:
|
0,00 |
0,00 |
0,00 |
0,00 |
0,00 |
|
|
3. Reserves for shares of
the controlling company: |
0,00 |
0,00 |
0,00 |
0,00 |
0,00 |
|
|
4. Statutory reserves:
|
0,00 |
0,00 |
0,00 |
0,00 |
0,00 |
|
|
5. Miscellaneous reserves:
|
27.506.472,00 |
25.502.122,00 |
28.460.786,00 |
31.283.092,00 |
37.757.222,00 |
|
|
6. Differences due to
capital adjustment to euros: |
0,00 |
0,00 |
0,00 |
0,00 |
0,00 |
|
|
V. Profit or loss brought forward: |
0,00 |
0,00 |
0,00 |
0,00 |
0,00 |
|
|
1. Retained earnings: |
0,00 |
0,00 |
0,00 |
0,00 |
0,00 |
|
|
2. Prior year losses: |
0,00 |
0,00 |
0,00 |
0,00 |
0,00 |
|
|
3. Partners'
contributions so as to compensate losses: |
0,00 |
0,00 |
0,00 |
0,00 |
0,00 |
|
|
VI. Profit or loss for the financial year: |
7.126.154,00 |
1.992.949,00 |
11.924.504,00 |
12.177.694,00 |
11.525.871,00 |
|
|
VII. Interim dividend paid: |
0,00 |
0,00 |
0,00 |
0,00 |
0,00 |
|
|
VIII. Own shares for capital reduction: |
0,00 |
0,00 |
0,00 |
0,00 |
0,00 |
|
|
B) Deferred income: |
0,00 |
0,00 |
0,00 |
0,00 |
0,00 |
|
|
1. Capital grants: |
0,00 |
0,00 |
0,00 |
0,00 |
0,00 |
|
|
2. Unrealised exchange
gains: |
0,00 |
0,00 |
0,00 |
0,00 |
0,00 |
|
|
3. Other deferred income:
|
0,00 |
0,00 |
0,00 |
0,00 |
0,00 |
|
|
4. Public revenues to
distribute in several financial years: |
0,00 |
0,00 |
0,00 |
0,00 |
0,00 |
|
|
C) PROVISIONS FOR LIABILITIES AND CHARGES: |
0,00 |
0,00 |
123.692,00 |
740.761,00 |
739.177,00 |
|
|
1. Provisions for pension
fund and other similar obligations: |
0,00 |
0,00 |
0,00 |
0,00 |
0,00 |
|
|
2. Provisions for taxes:
|
0,00 |
0,00 |
0,00 |
0,00 |
0,00 |
|
|
3. Other provisions: |
0,00 |
0,00 |
123.692,00 |
740.761,00 |
739.177,00 |
|
|
4. Reversion fund: |
0,00 |
0,00 |
0,00 |
0,00 |
0,00 |
|
|
D) LONG TERM LIABILITIES: |
314.982,00 |
7.382.434,00 |
19.461.960,00 |
0,00 |
182.458,00 |
|
|
I. Issued debentures and other marketable
securities: |
0,00 |
0,00 |
0,00 |
0,00 |
0,00 |
|
|
1. Non-convertible
debentures: |
0,00 |
0,00 |
0,00 |
0,00 |
0,00 |
|
|
2. Convertible debentures:
|
0,00 |
0,00 |
0,00 |
0,00 |
0,00 |
|
|
3. Other debt securities:
|
0,00 |
0,00 |
0,00 |
0,00 |
0,00 |
|
|
II. Amounts owed to credit institutions: |
0,00 |
7.000.000,00 |
19.311.962,00 |
0,00 |
0,00 |
|
|
1. Loans and other
liabilities: |
0,00 |
7.000.000,00 |
19.311.962,00 |
0,00 |
0,00 |
|
|
2. Long-term liabilities
from capital leases: |
0,00 |
0,00 |
0,00 |
0,00 |
0,00 |
|
|
III. Debts with companies of the group and affiliated
ones: |
0,00 |
0,00 |
0,00 |
0,00 |
0,00 |
|
|
1. Amounts owed to group
companies: |
0,00 |
0,00 |
0,00 |
0,00 |
0,00 |
|
|
2. Amounts owed to
associated companies: |
0,00 |
0,00 |
0,00 |
0,00 |
0,00 |
|
|
IV. Other creditors: |
314.982,00 |
382.434,00 |
149.998,00 |
0,00 |
182.458,00 |
|
|
1. Long-term bills of
exchange payable: |
0,00 |
0,00 |
0,00 |
0,00 |
0,00 |
|
|
2. Other creditors: |
0,00 |
0,00 |
0,00 |
0,00 |
0,00 |
|
|
3. Long term guarantees and
deposits received: |
0,00 |
0,00 |
0,00 |
0,00 |
0,00 |
|
|
4. Long term payables to
public bodies: |
314.982,00 |
382.434,00 |
149.998,00 |
0,00 |
182.458,00 |
|
|
V. Unpaid portion of equity investment: |
0,00 |
0,00 |
0,00 |
0,00 |
0,00 |
|
|
1. Group companies: |
0,00 |
0,00 |
0,00 |
0,00 |
0,00 |
|
|
2. Associated companies:
|
0,00 |
0,00 |
0,00 |
0,00 |
0,00 |
|
|
3. Third parties: |
0,00 |
0,00 |
0,00 |
0,00 |
0,00 |
|
|
VI. Long term trade creditors: |
0,00 |
0,00 |
0,00 |
0,00 |
0,00 |
|
|
E) SHORT TERM CREDITORS: |
13.648.813,00 |
12.552.091,00 |
14.475.900,00 |
23.757.622,00 |
11.048.005,00 |
|
|
I. Issued debentures and other marketable
securities: |
0,00 |
0,00 |
0,00 |
0,00 |
0,00 |
|
|
1. Non-convertible
debentures: |
0,00 |
0,00 |
0,00 |
0,00 |
0,00 |
|
|
2. Convertible debentures:
|
0,00 |
0,00 |
0,00 |
0,00 |
0,00 |
|
|
3. Other debt securities:
|
0,00 |
0,00 |
0,00 |
0,00 |
0,00 |
|
|
4. Accrued interest on
debentures and other debt securities: |
0,00 |
0,00 |
0,00 |
0,00 |
0,00 |
|
|
II. Amounts owed to credit institutions: |
0,00 |
2.909.271,00 |
702.847,00 |
622.536,00 |
45.542,00 |
|
|
1. Loans and other
liabilities: |
0,00 |
2.909.271,00 |
702.847,00 |
622.536,00 |
45.542,00 |
|
|
2. Accrued interest on
liabilities with credit institutions: |
0,00 |
0,00 |
0,00 |
0,00 |
0,00 |
|
|
3. Short-term liabilities
from capital leases: |
0,00 |
0,00 |
0,00 |
0,00 |
0,00 |
|
|
III. Short-term amounts owed to group and
associated companies: |
9.867.625,00 |
7.878.015,00 |
12.260.318,00 |
21.657.662,00 |
8.449.272,00 |
|
|
1. Amounts owed to group
companies: |
9.867.625,00 |
7.878.015,00 |
12.260.318,00 |
21.657.662,00 |
8.449.272,00 |
|
|
2. Amounts owed to
associated companies: |
0,00 |
0,00 |
0,00 |
0,00 |
0,00 |
|
|
IV. Trade creditors: |
3.453.256,00 |
1.469.555,00 |
1.097.709,00 |
1.167.185,00 |
2.165.225,00 |
|
|
1. Advanced payments from
customers: |
110.952,00 |
32.107,00 |
0,00 |
0,00 |
860.712,00 |
|
|
2. Amounts owed for
purchases of goods or services: |
3.342.304,00 |
1.437.448,00 |
1.097.709,00 |
1.167.185,00 |
1.304.513,00 |
|
|
3. Debts represented by
notes payable: |
0,00 |
0,00 |
0,00 |
0,00 |
0,00 |
|
|
V. Other creditors: |
327.932,00 |
295.250,00 |
415.026,00 |
310.239,00 |
387.966,00 |
|
|
1. Public bodies: |
122.296,00 |
86.630,00 |
193.071,00 |
97.319,00 |
43.014,00 |
|
|
2. Bills of exchange
payable: |
0,00 |
0,00 |
0,00 |
0,00 |
0,00 |
|
|
3. Miscellaneous debts:
|
0,00 |
0,00 |
0,00 |
0,00 |
0,00 |
|
|
4. Wages and salaries
payable: |
205.636,00 |
208.620,00 |
221.955,00 |
212.920,00 |
344.952,00 |
|
|
5. Guarantees and deposits
received at short term: |
0,00 |
0,00 |
0,00 |
0,00 |
0,00 |
|
|
VI. Provisions: |
0,00 |
0,00 |
0,00 |
0,00 |
0,00 |
|
|
VII. Prepayments and accrued income: |
0,00 |
0,00 |
0,00 |
0,00 |
0,00 |
|
|
F) SHORT-TERM PROVISIONS FOR LIABILITIES AND CHARGES: |
0,00 |
10.373.283,00 |
0,00 |
0,00 |
0,00 |
|
|
GENERAL TOTAL (A + B + C + D + E + F): |
49.465.367,00 |
58.671.825,00 |
75.315.788,00 |
68.828.115,00 |
62.121.679,00 |
|
MERCANTILE
REGISTRY.
|
|
EQUIVALENCIA |
EQUIVALENCIA |
EQUIVALENCIA |
EQUIVALENCIA |
EQUIVALENCIA |
|
|
DEBIT |
2014 |
2013 |
2012 |
2011 |
2010 |
|
|
A) CHARGES (A.1 to A.15): |
63.718.170,00 |
60.907.154,00 |
60.804.581,00 |
66.589.983,00 |
57.255.743,00 |
|
|
A.1. Stock reduction of both
manufactured goods and the ones in process: |
0,00 |
0,00 |
0,00 |
0,00 |
0,00 |
|
|
A.2. Supplies: |
36.890.354,00 |
37.259.355,00 |
42.480.180,00 |
51.089.151,00 |
42.733.540,00 |
|
|
a)
Stock consumption: |
36.890.354,00 |
37.259.355,00 |
42.480.180,00 |
51.089.151,00 |
42.733.540,00 |
|
|
b)
Consumption of raw materials and miscellaneous consumable ones: |
0,00 |
0,00 |
0,00 |
0,00 |
0,00 |
|
|
c) Miscellaneous
external expenditure: |
0,00 |
0,00 |
0,00 |
0,00 |
0,00 |
|
|
A.3. Staff costs: |
2.098.819,00 |
2.187.646,00 |
2.048.757,00 |
1.893.269,00 |
2.046.668,00 |
|
|
a)
Wages, salaries et al.: |
1.756.937,00 |
1.833.290,00 |
1.747.451,00 |
1.599.309,00 |
1.769.946,00 |
|
|
b)
Social security costs: |
341.882,00 |
354.356,00 |
301.306,00 |
293.960,00 |
276.722,00 |
|
|
A.4. Depreciation expense:
|
94.426,00 |
81.226,00 |
84.978,00 |
65.870,00 |
63.513,00 |
|
|
A.5. Variation of trade
provisions and losses of unrecovered receivables: |
945.560,00 |
41.392,00 |
553.970,00 |
-28.066,00 |
94.835,00 |
|
|
a) Stock
provision variation: |
914.306,00 |
8.244,00 |
0,00 |
0,00 |
-33.233,00 |
|
|
b)
Variation in provision and bad debt losses: |
0,00 |
0,00 |
0,00 |
0,00 |
0,00 |
|
|
c) Variation
of other trade provisions: |
31.254,00 |
33.148,00 |
553.970,00 |
-28.066,00 |
128.068,00 |
|
|
A.6. Other operating
charges: |
7.864.276,00 |
8.701.386,00 |
8.268.118,00 |
7.635.123,00 |
7.337.642,00 |
|
|
a)
External services: |
7.589.405,00 |
8.701.386,00 |
8.220.663,00 |
7.592.722,00 |
7.286.778,00 |
|
|
b)
Taxes: |
274.871,00 |
0,00 |
47.455,00 |
42.401,00 |
50.864,00 |
|
|
c) Other
operating expenses: |
0,00 |
0,00 |
0,00 |
0,00 |
0,00 |
|
|
d)
Allocation to revision fund: |
0,00 |
0,00 |
0,00 |
0,00 |
0,00 |
|
|
A.I. OPERATING BENEFITS
(B.1+B.2+B.3+B.4-A.1-A.2-A.3-A.4-A.5-A.6): |
11.482.861,00 |
13.478.708,00 |
17.123.353,00 |
16.571.390,00 |
12.359.072,00 |
|
|
A.7. Financial and similar
charges: |
502.384,00 |
1.163.684,00 |
599.259,00 |
52.622,00 |
37.364,00 |
|
|
a) Due to
liabilities with companies of the group: |
0,00 |
0,00 |
0,00 |
0,00 |
0,00 |
|
|
b) Due
to liabilities with associated companies: |
0,00 |
0,00 |
0,00 |
0,00 |
0,00 |
|
|
c) Due
to other debts.: |
502.384,00 |
1.163.684,00 |
599.259,00 |
52.622,00 |
37.364,00 |
|
|
d)
Losses from financial investments: |
0,00 |
0,00 |
0,00 |
0,00 |
0,00 |
|
|
A.8. Changes in financial
investment provisions: |
8.728.866,00 |
116.832,00 |
0,00 |
0,00 |
0,00 |
|
|
A.9. Exchange losses: |
0,00 |
284.943,00 |
368.532,00 |
662.016,00 |
0,00 |
|
|
A.II. NET FINANCIAL INCOME
(B.5+B.6+B.7+B.8-A.7-A.8-A.9): |
0,00 |
0,00 |
582.136,00 |
805.770,00 |
1.713.186,00 |
|
|
A.III. PROFIT FROM ORDINARY ACTIVITIES
(A.I+A.II-B.I-B.II): |
4.219.115,00 |
13.063.639,00 |
17.705.489,00 |
17.377.160,00 |
14.072.258,00 |
|
|
A.10. Changes in provisions for
intangible, tangible and securities portfolio: |
0,00 |
0,00 |
0,00 |
0,00 |
0,00 |
|
|
A.11. Losses from tangible
and intangible fixed assets and securities portfolio: |
0,00 |
0,00 |
0,00 |
241,00 |
35.876,00 |
|
|
A.12. Losses from
transactions with own shares and debentures: |
0,00 |
0,00 |
0,00 |
0,00 |
0,00 |
|
|
A.13. Extraordinary
expenses: |
0,00 |
10.249.591,00 |
0,00 |
0,00 |
0,00 |
|
|
A.14. Expenses and losses of
former financial years: |
0,00 |
0,00 |
0,00 |
0,00 |
0,00 |
|
|
A.IV. EXTRAORDINARY PROFIT
(B.9+B.10+B.11+B.12+B.13-A.10-A.11-A.12-A.13-A.14): |
9.500.524,00 |
0,00 |
619.802,00 |
20.291,00 |
2.359.918,00 |
|
|
A.V. PROFIT BEFORE TAXES (A.III+A.IV-B.III-B.IV):
|
13.719.639,00 |
2.814.048,00 |
18.325.291,00 |
17.397.451,00 |
16.432.176,00 |
|
|
A.15. Corporation tax:
|
6.593.485,00 |
821.099,00 |
6.400.787,00 |
5.219.757,00 |
4.906.305,00 |
|
|
A.16. Miscellaneous taxes:
|
0,00 |
0,00 |
0,00 |
0,00 |
0,00 |
|
|
A.VI. FINANCIAL YEAR RESULTS (PROFIT)
(A.V-A.15-A.16): |
7.126.154,00 |
1.992.949,00 |
11.924.504,00 |
12.177.694,00 |
11.525.871,00 |
|
MERCANTILE
REGISTRY.
|
|
EQUIVALENCIA |
EQUIVALENCIA |
EQUIVALENCIA |
EQUIVALENCIA |
EQUIVALENCIA |
|
|
CREDIT |
2014 |
2013 |
2012 |
2011 |
2010 |
|
|
B) INCOME ( B.1 to B.13): |
70.844.324,00 |
62.900.103,00 |
72.729.085,00 |
78.767.677,00 |
68.781.614,00 |
|
|
B.1. Net total sales: |
47.220.130,00 |
48.207.298,00 |
56.071.779,00 |
64.453.012,00 |
52.714.431,00 |
|
|
a)
Sales: |
47.220.130,00 |
48.207.298,00 |
56.071.779,00 |
64.453.012,00 |
52.714.431,00 |
|
|
b)
Rendering of services: |
0,00 |
0,00 |
0,00 |
0,00 |
0,00 |
|
|
Returns
and Rappel on sales: |
0,00 |
0,00 |
0,00 |
0,00 |
0,00 |
|
|
B.2. Stock increase of
manufactured goods and products in process: |
0,00 |
0,00 |
0,00 |
0,00 |
0,00 |
|
|
B.3. Works performed by the
company for fixed assets: |
0,00 |
0,00 |
0,00 |
0,00 |
0,00 |
|
|
B.4. Miscellaneous operating
income: |
12.156.166,00 |
13.542.415,00 |
14.487.577,00 |
12.773.725,00 |
11.920.839,00 |
|
|
a)
Auxiliary income and other from current management: |
12.151.486,00 |
13.538.741,00 |
14.484.914,00 |
12.773.725,00 |
11.898.217,00 |
|
|
b)
Grants: |
4.680,00 |
3.674,00 |
2.663,00 |
0,00 |
22.622,00 |
|
|
c)
Liabilities and charges provisions surplus: |
0,00 |
0,00 |
0,00 |
0,00 |
0,00 |
|
|
B.I. PÉRDIDAS DE EXPLOTACIÓN
(A.1+A.2+A.3+A.4+A.5-A.6-B.1-B.2-B.3-B.4): |
0,00 |
0,00 |
0,00 |
0,00 |
0,00 |
|
|
B.5. Income from equity
investment: |
0,00 |
0,00 |
0,00 |
0,00 |
0,00 |
|
|
a) In companies
of the group: |
0,00 |
0,00 |
0,00 |
0,00 |
0,00 |
|
|
b) In
associated companies: |
0,00 |
0,00 |
0,00 |
0,00 |
0,00 |
|
|
c)
Third parties: |
0,00 |
0,00 |
0,00 |
0,00 |
0,00 |
|
|
B.6. Income from other
marketable securities and long-term receivables: |
0,00 |
0,00 |
0,00 |
0,00 |
0,00 |
|
|
a) From
companies of the group: |
0,00 |
0,00 |
0,00 |
0,00 |
0,00 |
|
|
b) From
associated companies: |
0,00 |
0,00 |
0,00 |
0,00 |
0,00 |
|
|
c) From
companies out of the group: |
0,00 |
0,00 |
0,00 |
0,00 |
0,00 |
|
|
B.7. Miscellaneous interests
or similar income: |
1.369.497,00 |
1.150.390,00 |
1.549.927,00 |
1.520.408,00 |
527.695,00 |
|
|
a) From
companies of the group: |
638.845,00 |
1.150.390,00 |
1.483.120,00 |
1.520.140,00 |
527.077,00 |
|
|
b) From
associated companies: |
0,00 |
0,00 |
0,00 |
0,00 |
0,00 |
|
|
c)
Miscellaneous interests: |
730.652,00 |
0,00 |
66.807,00 |
268,00 |
618,00 |
|
|
d)
Profit on financial investment: |
0,00 |
0,00 |
0,00 |
0,00 |
0,00 |
|
|
B.8. Exchange positive
differences: |
598.007,00 |
0,00 |
0,00 |
0,00 |
1.222.855,00 |
|
|
B.II. NEGATIVE FINANCIAL RESULTS
(A.7+A.8+A.9-B.5-B.6-B.7-B.8): |
7.263.746,00 |
415.069,00 |
0,00 |
0,00 |
0,00 |
|
|
B.III. LOSSES ON ORDINARY ACTIVITIES ( B.I + B.II
- A.I - A.II ): |
0,00 |
0,00 |
0,00 |
0,00 |
0,00 |
|
|
B.9.Profit on disposal of
both tangible and intangible fixed assets and securities portfolio: |
3.637,00 |
0,00 |
2.733,00 |
0,00 |
0,00 |
|
|
B.10. Profit on transactions
with own shares and debentures: |
0,00 |
0,00 |
0,00 |
0,00 |
0,00 |
|
|
B.11. Capital grants
transferred to profit and loss: |
0,00 |
0,00 |
0,00 |
0,00 |
0,00 |
|
|
B.12. Extraordinary income:
|
9.496.887,00 |
0,00 |
617.069,00 |
20.532,00 |
2.395.794,00 |
|
|
B.13. Income and profit of
former financial years: |
0,00 |
0,00 |
0,00 |
0,00 |
0,00 |
|
|
B.IV. NEGATIVE EXTRAORDINARY RESULTS
(A.10+A.11+A.12+A.13+A.14-B.9-B.10-B.11-B.12-B.13): |
0,00 |
10.249.591,00 |
0,00 |
0,00 |
0,00 |
|
|
B.V. LOSSES BEFORE TAXES (B.III+B.IV-A.III-A.IV):
|
0,00 |
0,00 |
0,00 |
0,00 |
0,00 |
|
|
B.VI. RESULT OF THE PERIOD (LOSSES)
(B.V+A.15+A.16): |
0,00 |
0,00 |
0,00 |
0,00 |
0,00 |
|
MERCANTILE
REGISTRY.
CASHFLOW
STATEMENT
|
Model: Normal
> Source of information: Data contained in this section is taken from
the information declared in the Annual Accounts submitted to the Trade
Register.
|
|
2014 |
2013 |
2012 |
2011 |
2010 |
|
|
1. Fiscal year result before taxes.: 61100 |
13.719.639,00 |
2.814.048,00 |
18.325.291,00 |
17.397.451,00 |
16.432.176,00 |
|
|
2. Results adjustments.: 61200 |
-1.196.819,00 |
10.689.551,00 |
-563.466,00 |
-833.244,00 |
-3.920.786,00 |
|
|
a) Fixed Assets Amortization (+).: 61201 |
94.426,00 |
81.226,00 |
84.978,00 |
65.870,00 |
63.513,00 |
|
|
b) Obsolescence Allowances (+/-). : 61202 |
945.560,00 |
-56.335,00 |
553.494,00 |
-28.821,00 |
129.299,00 |
|
|
c) Variation in Provision (+/-). : 61203 |
-9.496.887,00 |
10.249.591,00 |
-617.069,00 |
-42.648,00 |
-2.416.041,00 |
|
|
e) Results on disposal of fixed assets (+/-). :
61205 |
-3.637,00 |
0,00 |
-2.733,00 |
241,00 |
35.876,00 |
|
|
g) Financial income (-).: 61207 |
-1.369.524,00 |
-1.150.390,00 |
-1.549.927,00 |
-1.520.408,00 |
-527.695,00 |
|
|
h) Financial Expenses (+). : 61208 |
502.384,00 |
1.163.684,00 |
599.259,00 |
30.506,00 |
17.117,00 |
|
|
i) Exchange differences (+/-). : 61209 |
-598.007,00 |
284.943,00 |
368.532,00 |
662.016,00 |
-1.222.855,00 |
|
|
j) Reasonable Value Variation in Financial
Instruments (+/-).: 61210 |
11.401,00 |
116.832,00 |
0,00 |
0,00 |
0,00 |
|
|
k) Other income and expense (-/+). : 61211 |
8.717.465,00 |
0,00 |
0,00 |
0,00 |
0,00 |
|
|
3. Changes in current capital equity.: 61300 |
-696.842,00 |
-3.037.701,00 |
503.489,00 |
26.572.838,00 |
-825.339,00 |
|
|
a) Stock (+/-).: 61301 |
-108.702,00 |
-788.907,00 |
119.676,00 |
180.297,00 |
-360.710,00 |
|
|
d) Debtors and other accounts receivable (+/-). :
61302 |
2.286.416,00 |
-3.475.882,00 |
4.545.544,00 |
10.281.696,00 |
5.346.479,00 |
|
|
c) Other current assets (+/-). : 61303 |
14.354,00 |
-18.585,00 |
-279,00 |
28.243,00 |
-11.654,00 |
|
|
d) Creditors and other accounts payable (+/-). :
61304 |
-2.012.514,00 |
1.245.673,00 |
-4.333.026,00 |
16.221.871,00 |
-5.829.042,00 |
|
|
f) Other non-current assets and liabilities
(+/-).: 61306 |
-876.396,00 |
0,00 |
171.574,00 |
-139.269,00 |
29.588,00 |
|
|
4. Other cash flows for operating activities.: 61400 |
41.581,00 |
-6.177.097,00 |
-4.269.089,00 |
-1.820.253,00 |
-1.363.552,00 |
|
|
a) Interest payments (-). : 61401 |
-502.384,00 |
-1.078.997,00 |
-599.259,00 |
-30.506,00 |
-17.117,00 |
|
|
c) Interest collection (+). : 61403 |
1.369.524,00 |
1.150.390,00 |
1.549.927,00 |
1.520.408,00 |
527.695,00 |
|
|
d) Income tax payment collection (payments) (+/-).:
61404 |
0,00 |
0,00 |
0,00 |
-3.310.155,00 |
-1.874.130,00 |
|
|
e) Other payments (payment collection) (-/+) :
61405 |
-825.559,00 |
-6.248.490,00 |
-5.219.757,00 |
0,00 |
0,00 |
|
|
5. Operating activity cash flows (1 + 2 + 3 + 4) : 61500 |
11.867.559,00 |
4.288.801,00 |
13.996.225,00 |
41.316.792,00 |
10.322.499,00 |
|
|
6. Payments for investment (-).: 62100 |
-1.422.367,00 |
-2.655.395,00 |
-12.705.772,00 |
-40.813.101,00 |
-13.613.240,00 |
|
|
a) Companies of the group and affiliates. :
62101 |
-1.311.636,00 |
-2.565.085,00 |
-12.598.715,00 |
-40.600.039,00 |
-14.274.738,00 |
|
|
b) Intangible fixed assets. : 62102 |
-2.650,00 |
-2.650,00 |
-13.771,00 |
-13.499,00 |
-711,00 |
|
|
c) Fixed assets. : 62103 |
-108.081,00 |
-87.660,00 |
-93.286,00 |
-199.563,00 |
662.209,00 |
|
|
7. Divestment payment collection (+). : 62200 |
-939.415,00 |
23.779.750,00 |
20.044,00 |
0,00 |
0,00 |
|
|
a) Companies of the group and affiliates. :
62201 |
-943.052,00 |
23.779.750,00 |
0,00 |
0,00 |
0,00 |
|
|
c) Fixed assets. : 62203 |
3.637,00 |
0,00 |
20.044,00 |
0,00 |
0,00 |
|
|
8. Investment activity cash flows (6 + 7) minus Amortization:
62300 |
-2.361.782,00 |
21.124.355,00 |
-12.685.728,00 |
-40.813.101,00 |
-13.613.240,00 |
|
|
9. Payment collection and payments for equity instruments. :
63100 |
0,00 |
0,00 |
0,00 |
0,00 |
0,00 |
|
|
10. Payment collection and payments for financial liabilities
instruments.: 63200 |
-9.909.287,00 |
-10.190.209,00 |
13.315.449,00 |
576.994,00 |
-1.457.919,00 |
|
|
a) Issuance : 63201 |
0,00 |
9.809.791,00 |
19.392.273,00 |
0,00 |
0,00 |
|
|
2. Debts incurred with credit institutions (+). :
63203 |
0,00 |
9.809.775,00 |
19.392.273,00 |
0,00 |
0,00 |
|
|
3. Debts incurred with companies of the group and
affiliates (+).: 63204 |
0,00 |
16,00 |
0,00 |
0,00 |
0,00 |
|
|
b) Repayment and amortization of : 63207 |
-9.909.287,00 |
-20.000.000,00 |
-6.076.824,00 |
576.994,00 |
-1.457.919,00 |
|
|
2. Debts incurred with credit institutions (-).:
63209 |
-9.909.271,00 |
-20.000.000,00 |
-6.076.824,00 |
576.994,00 |
-1.457.919,00 |
|
|
3. Debts incurred with companies of the group and
affiliates (-). : 63210 |
-16,00 |
0,00 |
0,00 |
0,00 |
0,00 |
|
|
11. Payments from dividends and remunerations from other assets
instruments. : 63300 |
0,00 |
-15.000.000,00 |
-15.000.000,00 |
0,00 |
0,00 |
|
|
a) Dividends (-).: 63301 |
0,00 |
-15.000.000,00 |
-15.000.000,00 |
0,00 |
0,00 |
|
|
12. Cash flows for financing activities (9+10+11).: 63400 |
-9.909.287,00 |
-25.190.209,00 |
-1.684.551,00 |
576.994,00 |
-1.457.919,00 |
|
|
D) EFFECT OF EXCHANGE RATE CHANGES: 64000 |
407.092,00 |
-272.013,00 |
-85.904,00 |
-820.619,00 |
1.449.226,00 |
|
|
E) NET INCREASE/DECREASE OF CASH OR EQUIVALENT ASSETS
(+/-5+/-8+/12+/-D) : 65000 |
3.582,00 |
-49.066,00 |
-459.958,00 |
260.066,00 |
-3.299.434,00 |
|
|
Cash or equivalent assets as of beginning of the fiscal
year.: 65100 |
126.925,00 |
175.991,00 |
635.949,00 |
375.883,00 |
3.675.317,00 |
|
|
Cash or equivalent assets as of end of the fiscal
year.: 65200 |
130.507,00 |
126.925,00 |
175.991,00 |
635.949,00 |
375.883,00 |
|
FINANCIAL
DIAGNOSIS
|
> Economic-Financial Comparative Analysis
Data used in the following ratios and indicators is taken from the
Annual Accounts submitted by the company to the TRADE REGISTER.
> Comparison within the Sector
|
Cash Flow |
2014 |
2013 |
Variación 2014 -
2013 |
|
|||
|
|
Empresa |
Sector |
Empresa |
Sector |
Empresa |
Sector |
|
|
Cash Flow over Sales: |
0,00 % |
0,01 % |
0,00 % |
0,01 % |
|
-49,25 % |
|
|
EBITDA over Sales: |
24,52 % |
11,83 % |
28,13 % |
11,53 % |
-12,84 % |
2,65 % |
|
|
Cash Flow Yield: |
0,00 % |
0,00 % |
0,00 % |
0,01 % |
|
-42,36 % |
|
|
Profitability |
2014 |
2013 |
Variación 2014 -
2013 |
|
|||
|
|
Empresa |
Sector |
Empresa |
Sector |
Empresa |
Sector |
|
|
Operating economic profitability: |
89,04 % |
8,61 % |
86,16 % |
7,03 % |
3,34 % |
22,40 % |
|
|
Total economic profitability: |
28,75 % |
5,09 % |
6,78 % |
3,70 % |
324,09 % |
37,48 % |
|
|
Financial profitability: |
20,15 % |
7,81 % |
7,06 % |
4,06 % |
185,53 % |
92,47 % |
|
|
Margin: |
19,35 % |
7,37 % |
21,83 % |
6,87 % |
-11,37 % |
7,20 % |
|
|
Mark-up: |
7,11 % |
6,87 % |
21,16 % |
4,51 % |
-66,38 % |
52,21 % |
|
|
Solvency |
2014 |
2013 |
Variación 2014 -
2013 |
|
|||
|
|
Empresa |
Sector |
Empresa |
Sector |
Empresa |
Sector |
|
|
Liquidity: |
0,01 |
0,14 |
0,01 |
0,13 |
-5,44 |
7,15 |
|
|
Acid Test: |
0,99 |
0,89 |
1,15 |
0,87 |
-14,41 |
2,74 |
|
|
Working Capital / Investment: |
0,00 |
0,03 |
-0,13 |
0,05 |
101,07 |
-35,51 |
|
|
Solvency: |
1,01 |
1,22 |
1,24 |
1,18 |
-18,79 |
3,80 |
|
|
Indebtedness |
2014 |
2013 |
Variación 2014 -
2013 |
|
|||
|
|
Empresa |
Sector |
Empresa |
Sector |
Empresa |
Sector |
|
|
Indebtedness level: |
0,40 |
1,31 |
0,71 |
1,38 |
-43,88 |
-5,44 |
|
|
Borrowing Composition: |
0,03 |
1,11 |
0,60 |
1,00 |
-94,56 |
10,41 |
|
|
Repayment Ability: |
3.934,12 |
168,21 |
-408,66 |
99,21 |
1.062,69 |
69,55 |
|
|
Warranty: |
3,51 |
1,77 |
2,93 |
1,73 |
19,96 |
2,33 |
|
|
Generated resources / Total creditors: |
1,20 |
0,09 |
0,10 |
0,08 |
1.051,50 |
7,94 |
|
|
Efficiency |
2014 |
2013 |
Variación 2014 -
2013 |
|
|||
|
|
Empresa |
Sector |
Empresa |
Sector |
Empresa |
Sector |
|
|
Productivity: |
6,52 |
1,98 |
7,20 |
1,86 |
-9,48 |
6,20 |
|
|
Turnover of Collection Rights : |
4,90 |
5,38 |
4,39 |
4,99 |
11,63 |
7,91 |
|
|
Turnover of Payment Entitlements: |
3,35 |
3,82 |
4,77 |
3,62 |
-29,81 |
5,48 |
|
|
Stock rotation: |
201,04 |
8,39 |
46,24 |
7,32 |
334,74 |
14,68 |
|
|
Assets turnover: |
4,60 |
1,17 |
3,95 |
1,02 |
16,61 |
14,18 |
|
|
Borrowing Cost: |
3,57 |
2,88 |
5,80 |
2,88 |
-38,57 |
0,12 |
|
> Trend of indicators under the General Accounting Plan of 2007
(2014, 2013, 2012, 2011, 2010)
|
Cash Flow |
2014 |
2013 |
2012 |
2011 |
2010 |
|
|
Cash Flow over Sales: |
0,00 % |
0,00 % |
-0,01 % |
0,00 % |
-0,06 % |
|
|
EBITDA over Sales: |
24,52 % |
28,13 % |
30,69 % |
25,81 % |
23,57 % |
|
|
Cash Flow Yield: |
0,00 % |
0,00 % |
-0,01 % |
0,00 % |
-0,05 % |
|
|
Profitability |
2014 |
2013 |
2012 |
2011 |
2010 |
|
|
Operating economic profitability: |
89,04 % |
86,16 % |
154,66 % |
96,55 % |
121,29 % |
|
|
Total economic profitability: |
28,75 % |
6,78 % |
25,13 % |
25,35 % |
26,51 % |
|
|
Financial profitability: |
20,15 % |
7,06 % |
28,90 % |
27,47 % |
22,98 % |
|
|
Margin: |
19,35 % |
21,83 % |
24,27 % |
21,46 % |
19,07 % |
|
|
Mark-up: |
7,11 % |
21,16 % |
25,10 % |
22,50 % |
21,72 % |
|
|
Solvency |
2014 |
2013 |
2012 |
2011 |
2010 |
|
|
Liquidity: |
0,01 |
0,01 |
0,01 |
0,03 |
0,03 |
|
|
Acid Test: |
0,99 |
1,15 |
0,78 |
1,46 |
0,89 |
|
|
Working Capital / Investment: |
0,00 |
-0,13 |
-0,04 |
0,16 |
-0,01 |
|
|
Solvency: |
1,01 |
1,24 |
0,80 |
1,47 |
0,95 |
|
|
Indebtedness |
2014 |
2013 |
2012 |
2011 |
2010 |
|
|
Indebtedness level: |
0,40 |
0,71 |
0,82 |
0,53 |
0,22 |
|
|
Borrowing Composition: |
0,03 |
0,60 |
1,34 |
0,00 |
0,02 |
|
|
Repayment Ability: |
3.934,12 |
-408,66 |
-73,78 |
91,35 |
-3,40 |
|
|
Warranty: |
3,51 |
2,93 |
2,22 |
2,90 |
5,53 |
|
|
Generated resources / Total creditors: |
1,20 |
0,10 |
0,35 |
0,52 |
1,03 |
|
|
Efficiency |
2014 |
2013 |
2012 |
2011 |
2010 |
|
|
Productivity: |
6,52 |
7,20 |
9,40 |
9,79 |
7,07 |
|
|
Turnover of Collection Rights : |
4,90 |
4,39 |
6,88 |
4,90 |
7,21 |
|
|
Turnover of Payment Entitlements: |
3,35 |
4,77 |
3,72 |
3,44 |
4,56 |
|
|
Stock rotation: |
201,04 |
46,24 |
203,05 |
158,63 |
93,03 |
|
|
Assets turnover: |
4,60 |
3,95 |
6,37 |
4,50 |
6,36 |
|
|
Borrowing Cost: |
3,57 |
5,80 |
1,77 |
0,22 |
0,33 |
|
COMPARATIVE SECTORIAL BALANCE
|
Sector-based Comparison
under the rules of the New General Accounting Plan.
|
|
Variación - |
|
|
|
Empresa |
Sector |
|
|
Variación - |
|
|
|
Empresa |
Sector |
|
|
Variación - |
|
|
|
Empresa |
Sector |
News
|
|
elEconomista.es |
24/05/2014 |
|
Grupo Chemo
compra la biotecnológica leonesa Genhelix |
|
|
Companies
related |
|
|
GH GENHELIX SOCIEDAD ANONIMA |
|
Public
Tenders and Works Won
|
No Public Tenders assigned to the name of the company.
Research
Summary
|
|
The corporation was established many years ago, and it has experience
in the sector of activities it carries out, though its invoicing has
decreased with a percentage of 2,05% in 2014, in comparison to the previous
year. It complies regularly with its payment obligations. |
Sources
|
|
Registry of Commerce's Official Gazette. Own and external data bases
Company References |
FOREIGN EXCHANGE RATES
|
Currency |
Unit
|
Indian Rupees |
|
US Dollar |
1 |
Rs.66.63 |
|
|
1 |
Rs.100.65 |
|
Euro |
1 |
Rs.72.40 |
|
EUR |
1 |
Rs.72.43 |
Note :
Above are approximate rates obtained from sources believed to be correct
INFORMATION DETAILS
|
Analysis Done by
: |
KIN |
|
|
|
|
Report Prepared
by : |
TPT |
RATING EXPLANATIONS
|
RATING |
STATUS |
PROPOSED CREDIT LINE |
|
|
|
>86 |
Aaa |
Possesses an extremely sound financial base with the strongest
capability for timely payment of interest and principal sums |
Unlimited |
|
|
71-85 |
Aa |
Possesses adequate working capital. No caution needed for credit
transaction. It has above average (strong) capability for payment of interest
and principal sums |
Large |
|
|
56-70 |
A |
Financial & operational base are regarded healthy. General unfavourable
factors will not cause fatal effect. Satisfactory capability for payment of
interest and principal sums |
Fairly Large |
|
|
41-55 |
Ba |
Overall operation is considered normal. Capable to meet normal
commitments. |
Satisfactory |
|
|
26-40 |
B |
Capability to overcome financial difficulties seems comparatively
below average. |
Small |
|
|
11-25 |
Ca |
Adverse factors are apparent. Repayment of interest and principal sums
in default or expected to be in default upon maturity |
Limited with
full security |
|
|
<10 |
C |
Absolute credit risk exists. Caution needed to be exercised |
Credit not
recommended |
|
|
-- |
NB |
New Business |
-- |
|
This score serves as a reference to assess SC’s
credit risk and to set the amount of credit to be extended. It is calculated
from a composite of weighted scores obtained from each of the major sections of
this report. The assessed factors and their relative weights (as indicated
through %) are as follows:
Financial
condition (40%) Ownership
background (20%) Payment
record (10%)
Credit history
(10%) Market trend (10%) Operational size
(10%)
This report is issued at your request without any
risk and responsibility on the part of MIRA INFORM PRIVATE LIMITED (MIPL) or
its officials.