MIRA INFORM REPORT
|
Report No. : |
352839 |
|
Report Date : |
15.12.2015 |
IDENTIFICATION DETAILS
|
Name : |
FASHION LINQ B.V. |
|
|
|
|
Registered Office : |
Databankweg 20 3821AL Amersfoort |
|
|
|
|
Country : |
Netherlands |
|
|
|
|
Financials (as on) : |
31.12.2014 |
|
|
|
|
Date of Incorporation : |
15.08.1989 |
|
|
|
|
Com. Reg. No.: |
30093002 |
|
|
|
|
Legal Form : |
Private company |
|
|
|
|
Line of Business : |
|
|
|
|
|
No. of Employee : |
63 |
RATING & COMMENTS
|
MIRA’s Rating : |
A |
|
RATING |
STATUS |
PROPOSED CREDIT LINE |
|
|
56-70 |
A |
Financial & operational base are regarded healthy. General
unfavourable factors will not cause fatal effect. Satisfactory capability for
payment of interest and principal sums |
Fairly Large |
|
Status : |
Good |
|
|
|
|
Payment Behaviour : |
Regular |
|
|
|
|
Litigation : |
Clear |
NOTES :
Any query related to this report can be made
on e-mail : infodept@mirainform.com
while quoting report number, name and date.
ECGC Country Risk Classification List – March 31, 2015
|
Country Name |
Previous Rating (31.12.2014) |
Current Rating (31.03.2015) |
|
Netherlands |
A1 |
A1 |
|
Risk Category |
ECGC
Classification |
|
Insignificant |
A1 |
|
Low |
A2 |
|
Moderate |
B1 |
|
High |
B2 |
|
Very High |
C1 |
|
Restricted |
C2 |
|
Off-credit |
D |
NETHERLANDS - ECONOMIC
OVERVIEW
The Netherlands, the sixth-largest economy in the European Union, plays an important role as a European transportation hub, with a persistently high trade surplus, stable industrial relations, and moderate unemployment. Industry focuses on food processing, chemicals, petroleum refining, and electrical machinery. A highly mechanized agricultural sector employs only 2% of the labor force but provides large surpluses for food-processing and underpins the country’s status as the world’s second largest agricultural exporter. The Netherlands is part of the Eurozone, and as such, its monetary policy is controlled by the European Central Bank. The Dutch financial sector is highly concentrated, with four commercial banks possessing over 90% of banking assets. The sector suffered as a result of the global financial crisis and required billions of dollars of government support, but the European Banking Authority completed stringent reviews in 2014 and deemed Dutch banks to be well-capitalized. To address the 2009 and 2010 economic downturns, the government sought to stimulate the domestic economy by accelerating infrastructure programs, offering corporate tax breaks for employers to retain workers, and expanding export credits. The stimulus programs and bank bailouts, however, resulted in a government budget deficit of 5.3% of GDP in 2010 that contrasted sharply with a surplus of 0.7% in 2008. The government of Prime Minister Mark RUTTE has since implemented significant austerity measures to improve public finances and has instituted broad structural reforms in key policy areas, including the labor market, the housing sector, the energy market, and the pension system. As a result, the government budget deficit at the end of 2014 dropped to 1.8% of GDP. Following a protracted recession during which unemployment doubled to 7.4% and household consumption contracted for nearly three consecutive years, the year 2014 saw fragile GDP growth of 0.8 percent and a rise in most economic indicators. Drivers of growth included increased exports and business investments, as well as newly invigorated household consumption.
|
Source
: CIA |
Summary
Company name Fashion
Linq B.V.
Operative address Databankweg
20
3821AL Amersfoort
Netherlands
Legal form Besloten
Vennootschap
Registration number KvK-nummer:
30093002
VAT-number 009407510
|
Year |
2014 |
Mutation |
2013 |
Mutation |
2012 |
|
Fixed assets |
|
-100,00 |
230.000 |
-35,39 |
356.000 |
|
Total receivables |
5.489.000 |
45,29 |
3.778.000 |
-42,24 |
6.541.000 |
|
Total equity |
6.447.000 |
47,90 |
4.359.000 |
180,78 |
-5.396.000 |
|
Short term liabilities |
8.568.000 |
-7,88 |
9.301.000 |
-48,44 |
18.040.000 |
|
Net result |
2.843.000 |
276,56 |
755.000 |
-15,07 |
889.000 |
|
Working capital |
6.726.000 |
48,41 |
4.532.000 |
186,74 |
-5.225.000 |
|
Quick ratio |
0,90 |
-8,16 |
0,98 |
127,91 |
0,43 |
Contact
information
Company name Fashion
Linq B.V.
Trade names Fashion
Linq B.V.
Fashion
Linq
Operative address Databankweg
20
3821AL Amersfoort
Netherlands
Correspondence address Databankweg
20
3821AL Amersfoort
Netherlands
Telephone number 0337523232
Fax number 0337523131
Email address info@fashionlinq.com
Website www.fashion-linq.nl
| www.fashion-linq.com | www.fashionlinq.com
Registration
Registration number KvK-nummer:
30093002
Branch number 000018236073
VAT-number 009407510
Status Active
First registration company register 1990-03-28
Memorandum 1990-03-16
Establishment date 1989-08-15
Legal form Besloten
Vennootschap
Legal person since 1990-03-16
Last proposed admendment 2014-06-11
Issued placed capital EUR
21.600
Paid up share capital EUR
21.600
Activities
SBI 46421:
Wholesale of outerwear
46429: Wholesale of textile
products
46761: Wholesale of textile basic
materials and textile semi-finished products
Exporter Yes
Importer Yes
Goal De im-
en export en (groot)handel in textiele goederen, kleding, accessoires en
aanverwante artikelen, alsmede holdingactiviteiten
Relations
Shareholders Low
Land Fashion Group B.V.
Databankweg 20-22
3821AL AMERSFOORT
Netherlands
Registration number: 17022381
Percentage: 100%
Companies on same address A&Q
Fashion B.V.
Registration
number: 32070060
Exclusive Networks B.V.
Registration number: 27374554
BilancioBudget B.V.
Registration number: 59890045
Stichting Administratiekantoor
HVEG Investments
Registration number: 55819494
Tbex Beheer B.V.
Registration number: 61070394
Financial Academy Bilancio Workx
Registration number: 60050357
Liability statements HVEG
Investments B.V.
Databankweg 20-22
3821AL AMERSFOORT
Netherlands
Registration number: 27291562
date of issue: 2013-02-05
Starting date: 2013-01-31
End date: 2013-05-16
Management
Active management Low
Land Fashion Group B.V.
Databankweg 20-22
3821AL AMERSFOORT
Netherlands
Registration number: 17022381
Competence: Fully authorized
Function: Manager
Starting date: 2014-06-23
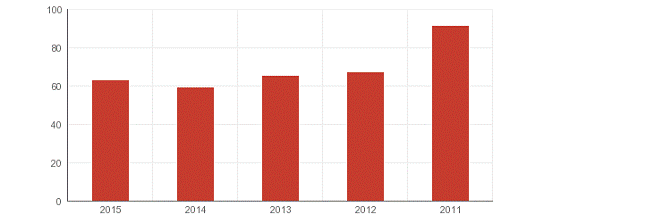
Employees
Total according to the Chamber of Commerce 63
Year 2015
2014 2013
2012 2011
Total 63
59 65 67 91
Payments
Description The
payments are regular
Key
figures
|
Year |
2014 |
2013 |
2012 |
2011 |
|
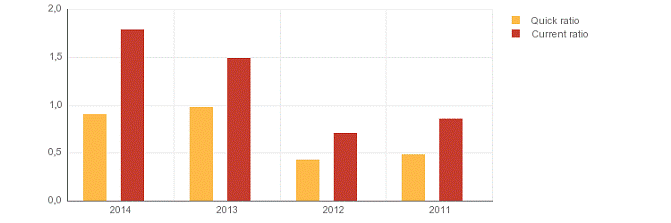
Quick ratio |
0,90 |
0,98 |
0,43 |
0,48 |
|
Current ratio |
1,79 |
1,49 |
0,71 |
0,86 |
|
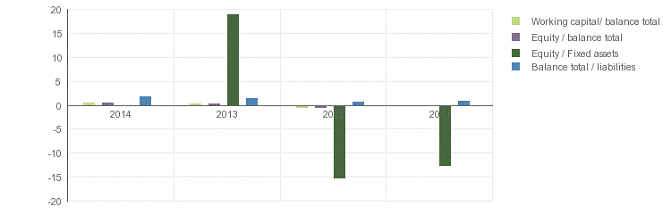
Working capital/ balance
total |
0,44 |
0,32 |
-0,40 |
-0,16 |
|
Equity / balance
total |
0,42 |
0,31 |
-0,41 |
-0,30 |
|
Equity / Fixed
assets |
|
18,95 |
-15,16 |
-12,48 |
|
Equity / liabilities |
0,73 |
0,45 |
-0,29 |
-0,23 |
|
Balance total /
liabilities |
1,73 |
1,45 |
0,71 |
0,77 |
|
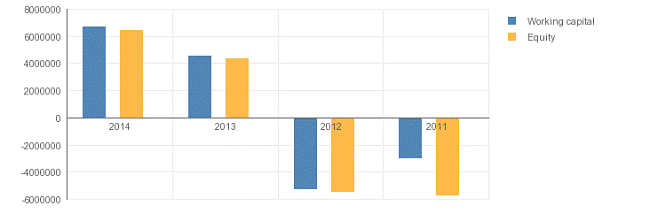
Working capital |
6.726.000 |
4.532.000 |
-5.225.000 |
-2.967.000 |
|
Equity |
6.447.000 |
4.359.000 |
-5.396.000 |
-5.693.000 |
|
Mutation equity |
47,90 |
180,78 |
5,22 |
|
|
Mutation short term
liabilities |
-7,88 |
-48,44 |
-15,03 |
|
|
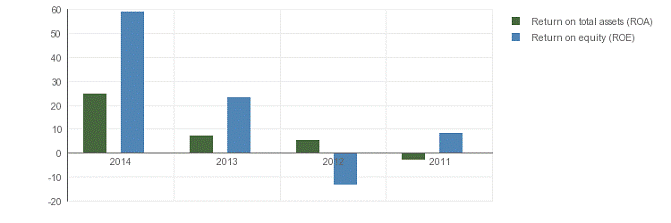
Return on total
assets (ROA) |
24,83 |
7,21 |
5,36 |
-2,55 |
|
Return on equity
(ROE) |
58,91 |
23,26 |
-13,08 |
8,38 |
|
Gross margin |
13.952.000 |
11.219.000 |
12.604.000 |
14.759.000 |
|
Operating result |
4.101.000 |
1.541.000 |
1.656.000 |
859.000 |
|
Net result after
taxes |
2.843.000 |
755.000 |
889.000 |
-110.000 |
|
Cashflow |
2.948.000 |
886.000 |
1.068.000 |
156.000 |
|
EBIT |
4.101.000 |
1.541.000 |
1.656.000 |
859.000 |
|
EBITDA |
4.206.000 |
1.672.000 |
1.835.000 |
1.125.000 |
Summary
The
2014 financial result structure is a postive working captial of 6.726.000 euro,
which is in agreement with 44 % of the total assets of the company. The working
capital has increased with 48.41 % compared to previous year. The ratio, with
respect to the total assets of the company has however, increased. The
improvement between 2013 and 2014 has mainly been caused by an increase of the
current assets. The current ratio of the company in 2014 was 1.79. A company
with a current ratio between 1.5 and 3.0 generally indicates good short-term
financial strength. The quick ratio in 2014 of the company was 0.9. A company
with a Quick Ratio of less than 1 cannot currently pay back its current
liabilities. The 2013 financial result structure is a postive working captial
of 4.532.000 euro, which is in agreement with 32 % of the total assets of the company.
The working capital has increased with 186.74 % compared to previous year. The
ratio, with respect to the total assets of the company has however, increased.
The improvement between 2012 and 2013 has mainly been caused by an increase of
the current assets. The current ratio of the company in 2013 was 1.49. When the
current ratio is below 1.5, the company may have problems meeting its
short-term obligations. The quick ratio in 2013 of the company was 0.98. A
company with a Quick Ratio of less than 1 cannot currently pay back its current
liabilities.
Financial
statement
Last annual account 2014
Remark annual account The
company is obliged to file its financial statements.
Type of annual account Corporate
Annual account Fashion
Linq B.V.
Databankweg 20
3821AL Amersfoort
Netherlands
Registration number: 30093002
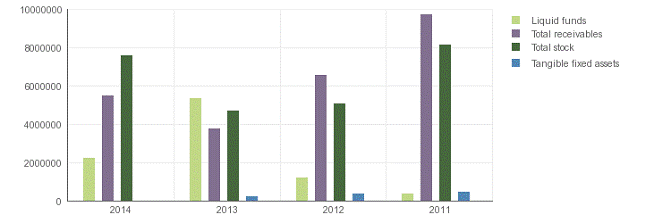
Balance
|
Year |
2014 |
2013 |
2012 |
2011 |
|
End date |
2014-12-31 |
2013-12-31 |
2012-12-31 |
2011-12-31 |
|
Tangible fixed assets |
|
230.000 |
356.000 |
456.000 |
|
Fixed assets |
|
230.000 |
356.000 |
456.000 |
|
Total stock |
7.573.000 |
4.687.000 |
5.059.000 |
8.162.000 |
|
Accounts receivable |
4.089.000 |
2.379.000 |
4.213.000 |
8.038.000 |
|
Other receivables |
1.400.000 |
1.399.000 |
2.328.000 |
1.684.000 |
|
Total receivables |
5.489.000 |
3.778.000 |
6.541.000 |
9.722.000 |
|
Liquid funds |
2.232.000 |
5.368.000 |
1.215.000 |
379.000 |
|
Current assets |
15.294.000 |
13.833.000 |
12.815.000 |
18.263.000 |
|
Total assets |
15.294.000 |
14.063.000 |
13.171.000 |
18.719.000 |
|
Issued capital |
22.000 |
22.000 |
21.000 |
22.000 |
|
Share premium reserve |
|
9.000.000 |
|
|
|
Other reserves |
6.425.000 |
-4.663.000 |
-5.417.000 |
-5.715.000 |
|
Total reserves |
6.425.000 |
4.337.000 |
-5.417.000 |
-5.715.000 |
|
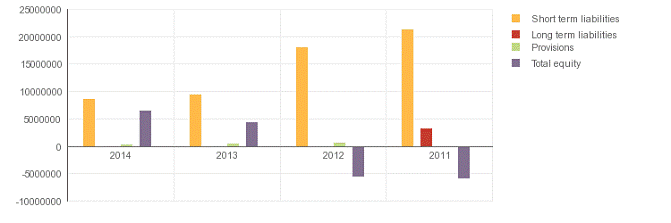
Total equity |
6.447.000 |
4.359.000 |
-5.396.000 |
-5.693.000 |
|
Provisions |
279.000 |
403.000 |
527.000 |
|
|
Long term interest
yielding debt |
|
|
|
3.182.000 |
|
Long term liabilities |
|
|
|
3.182.000 |
|
Accounts payable |
|
|
1.261.000 |
633.000 |
|
Other short term
liabilities |
|
|
16.779.000 |
20.597.000 |
|
Short term liabilities |
8.568.000 |
9.301.000 |
18.040.000 |
21.230.000 |
|
Total short and
long term liabilities |
8.847.000 |
9.704.000 |
18.567.000 |
24.412.000 |
|
Total liabilities |
15.294.000 |
14.063.000 |
13.171.000 |
18.719.000 |
Summary
The total
assets of the company increased with 8.75 % between 2013 and 2014. The assets
growth has been financed by a Net Worth increase of 47.9%. The company's net
increase has also covered a reduction of -8.83% of the company's indebtedness.
The total assets of the company increased with 6.77 % between 2012 and 2013.
Despite the assets growth, the non current assets decreased with -35.39%. The
assets growth has been financed by a Net Worth increase of 180.78%. The
company's net increase has also covered a reduction of -47.74 % of the
company's indebtedness. In 2013 the assets of the company were 1.64% composed
of fixed assets and 98.36% by current assets. The assets are being financed by
an equity of 31%, and total debt of 69%.
Profit
and loss
|
Year |
2014 |
2013 |
2012 |
2011 |
|
Gross margin |
13.952.000 |
11.219.000 |
12.604.000 |
14.759.000 |
|
Wages and salaries |
3.182.000 |
3.281.000 |
3.991.000 |
5.582.000 |
|
Amorization and depreciation |
105.000 |
131.000 |
179.000 |
266.000 |
|
other operating costs |
6.564.000 |
6.266.000 |
6.778.000 |
8.052.000 |
|
Operating expenses |
9.851.000 |
9.678.000 |
10.948.000 |
13.900.000 |
|
Operating result |
4.101.000 |
1.541.000 |
1.656.000 |
859.000 |
|
Financial income |
180.000 |
25.000 |
|
|
|
Financial expenses |
483.000 |
552.000 |
950.000 |
1.336.000 |
|
Financial result |
-303.000 |
-527.000 |
-950.000 |
-1.336.000 |
|
Result on ordinary
operations before taxes |
3.798.000 |
1.014.000 |
706.000 |
-477.000 |
|
Taxation on the
result of ordinary
activities |
955.000 |
260.000 |
289.000 |
-367.000 |
|
Result of ordinary
activities after taxes |
2.843.000 |
754.000 |
417.000 |
-110.000 |
|
Result subsidiaries after
taxes |
|
1.000 |
472.000 |
|
|
Net result |
2.843.000 |
755.000 |
889.000 |
-110.000 |
Summary
The gross
profit of the company grew with 24.36 % between 2013 and 2014. The operating
result of the company grew with 166.13 % between 2013 and 2014. This evolution
implies an increase of the company's economic profitability. The result of
these changes is an increase of the company's Economic Profitability of 244.38%
of the analysed period, being equal to 24.83 in the year 2014. The Net Result
of the company increased by 276.56 % between 2013 and 2014. The company's
Financial Profitability has been positively affected by the financial
activities in comparison to the EBITs behaviour. The result of these variations
is a profitability increase of 153.27% of the analysed period, being 58.91 in
the year 2014. The company's financial structure has slowed down its financial
profitability. The gross profit of the company decreased by -10.99 % between
2012 and 2013. The operating result of the company declined with -6.94 %
between 2012 and 2013. This evolution implies an decrease of the company's
economic profitability. The result of these changes is an increase of the
company's Economic Profitability of 34.51% of the analysed period, being equal
to 7.21 in the year 2013. The Net Result of the company decreased by -15.07 %
between 2012 and 2013. The company's Financial Profitability has been
negatively affected by the financial activities in comparison to the EBITs
behaviour. The result of these variations is a profitability reduction of
277.83% of the analysed period, being 23.26 in the year 2013. The company's
financial structure has slowed down its financial profitability.
Analysis
Branch (SBI) Wholesale
trade (no motor vehicles and motorcycles) (SBI code 46)
Region Oostelijk
Utrecht
Summary In the
Netherlands 109662 of the companies are registered with the SBI code 46
In the region Oostelijk Utrecht
4173 of the companies are registered with the SBI code 46
In the Netherlands 2387 of the
bankrupcties are published within this sector
In the region Oostelijk Utrecht 61
of the bankruptcies are published within this sector
The risk of this specific sector
in the Netherlands is normal
The risk of this specific sector in the region Oostelijk
Utrecht is normal
Publications
Liability statements 22-05-2013:
Per 16-05-2013 is een aansprakelijkheidsverklaring door HVEG Investments
B.V. ingetrokken.
07-02-2013: Per 05-02-2013 is
een aansprakelijkheidsverklaring door HVEG Investments
B.V. gedeponeerd.
17-07-2012: Per 16-07-2012 is
een aansprakelijkheidsverklaring door HVEG Investments
B.V. ingetrokken.
Deposits 22-04-2015:
De jaarrekening over 2014 is gepubliceerd.
24-04-2014: De jaarrekening over
2013 is gepubliceerd.
26-04-2013: De jaarrekening over
2012 is gepubliceerd.
Functions
30-06-2014:
Per 23-06-2014 is bestuurder 17022381 Low Land Fashion Group B.V. in functie
getreden.
30-06-2014:
Per 23-06-2014 is bestuurder 27291562 HVEG Investments B.V. uit functie
getreden.
Amendments
13-06-2014:
Per 11-6-2014 statuten gewijzigd. Zetel gewijzigd in: Amersfoort.
Company
structure
Relations 9
Company Registration
number
HVEG Investments B.V. (AMERSFOORT) 27291562
| - - Low Land Fashion Group B.V. (AMERSFOORT) 17022381
| - - | - - Fashion Linq B.V. (Amersfoort) 30093002
| - - | - - | - - Horpro B.V. (AMERSFOORT) 30146543
| - - | - - Brams Paris B.V. (AMERSFOORT) 30147499
| - - Wink
Accessories B.V. (Eindhoven) 17140950
| - - Belt Fashion Industries B.V. (EINDHOVEN) 17086505
| - - | - - Belt Fashion Eindhoven B.V. (EINDHOVEN) 17086504
| - - A&Q Fashion B.V. (AMERSFOORT) 32070060
FOREIGN EXCHANGE RATES
|
Currency |
Unit
|
Indian Rupees |
|
US Dollar |
1 |
Rs.66.99 |
|
|
1 |
Rs.101.78 |
|
Euro |
1 |
Rs.73.47 |
|
NLG |
1 |
Rs.37.46 |
Note :
Above are approximate rates obtained from sources believed to be correct
INFORMATION DETAILS
|
Analysis Done by
: |
DIV |
|
|
|
|
Report Prepared
by : |
TRU |
RATING EXPLANATIONS
|
RATING |
STATUS |
PROPOSED CREDIT LINE |
|
|
>86 |
Aaa |
Possesses an extremely sound financial base with the strongest
capability for timely payment of interest and principal sums |
Unlimited |
|
71-85 |
Aa |
Possesses adequate working capital. No caution needed for credit
transaction. It has above average (strong) capability for payment of interest
and principal sums |
Large |
|
56-70 |
A |
Financial & operational base are regarded healthy. General
unfavourable factors will not cause fatal effect. Satisfactory capability for
payment of interest and principal sums |
Fairly Large |
|
41-55 |
Ba |
Overall operation is considered normal. Capable to meet normal
commitments. |
Satisfactory |
|
26-40 |
B |
Capability to overcome financial difficulties seems comparatively below
average. |
Small |
|
11-25 |
Ca |
Adverse factors are apparent. Repayment of interest and principal sums
in default or expected to be in default upon maturity |
Limited with
full security |
|
<10 |
C |
Absolute credit risk exists. Caution needed to be exercised |
Credit not
recommended |
|
-- |
NB |
New Business |
-- |
This score serves as a reference to assess SC’s
credit risk and to set the amount of credit to be extended. It is calculated
from a composite of weighted scores obtained from each of the major sections of
this report. The assessed factors and their relative weights (as indicated
through %) are as follows:
Financial
condition (40%) Ownership
background (20%) Payment
record (10%)
Credit history
(10%) Market trend (10%) Operational size
(10%)
This report is issued at your request without any
risk and responsibility on the part of MIRA INFORM PRIVATE LIMITED (MIPL)
or its officials.