MIRA INFORM REPORT
|
Report No. : |
355847 |
|
Report Date : |
22.12.2015 |
IDENTIFICATION DETAILS
|
Name : |
THE SHIPPING CORPORATION OF INDIA LIMITED |
|
|
|
|
Registered
Office : |
Shipping House, 245, |
|
Tel. No.: |
91-22-22853556 |
|
|
|
|
Country : |
India |
|
|
|
|
Financials (as
on) : |
31.03.2015 |
|
|
|
|
Date of
Incorporation : |
24.03.1950 |
|
|
|
|
Com. Reg. No.: |
11-008033 |
|
|
|
|
Capital Investment
/ Paid-up Capital : |
Rs.4657.990 Million |
|
|
|
|
CIN No.: [Company Identification
No.] |
L63030MH1950GOI008033 |
|
|
|
|
IEC No.: |
0388075970 |
|
|
|
|
TAN No.: [Tax Deduction &
Collection Account No.] |
Not Available |
|
|
|
|
PAN No.: [Permanent Account No.] |
AAACT1542F |
|
|
|
|
Legal Form : |
A Public Limited Liability Company. The Company’s Shares are Listed on
the Stock Exchanges. |
|
|
|
|
Line of Business
: |
Subject owns, operates and manages a fleet of bulk carriers, international container service, liquid/dry bulk service, tankers, passenger vessels and offshore supply vessels. The Company's fleet transports primarily crude oil. (From Indirect Source) |
|
|
|
|
No. of Employees
: |
Information declined by the management |
RATING & COMMENTS
|
MIRA’s Rating : |
A (62) |
|
RATING |
STATUS |
PROPOSED CREDIT LINE |
|
|
56-70 |
A |
Financial & operational base are regarded healthy. General unfavourable
factors will not cause fatal effect. Satisfactory capability for payment of
interest and principal sums |
Fairly Large |
|
Status : |
Good |
|
|
|
|
Payment Behaviour : |
Regular |
|
|
|
|
Litigation : |
Clear |
|
|
|
|
Comments : |
Subject is a Government of India Company. It is well established
company incorporated in the year 1950. The company possesses strong revenue base marked by fair profit
margin. It has been successful in wiping off its previous year loss. Rating also takes into consideration the company’s long track record
in shipping business and decent net worth of the company. Trade relations are reported as fair. Business is active. Payments
terms are regular and as per commitments. In view of Government Company with long history of business
operations, the company can be considered for business dealings at usual
trade terms and conditions. |
NOTES :
Any query related to this report can be made
on e-mail : infodept@mirainform.com
while quoting report number, name and date.
EXTERNAL AGENCY RATING
|
Rating Agency Name |
ICRA |
|
Rating |
Issue Rating = “Ir AA-“ |
|
Rating Explanation |
High degree of safety and very low credit risk. |
|
Date |
September, 2014 |
|
Rating Agency Name |
ICRA |
|
Rating |
Short term debt Programme (A1+) |
|
Rating Explanation |
Very strong degree of safety and carry lowest credit risk. |
|
Date |
September, 2014 |
RBI DEFAULTERS’ LIST STATUS
Subject’s name is not enlisted as a defaulter
in the publicly available RBI Defaulters’ list.
EPF (Employee Provident Fund) DEFAULTERS’ LIST STATUS
Subject’s name is not enlisted as a defaulter
in the publicly available EPF (Employee Provident Fund) Defaulters’ list as of
31-03-2015.
INFORMATION DENIED BY
|
Name : |
Mr. Harjeet Kaur Joshi |
|
Designation : |
Chief Financial Officer |
|
Contact No.: |
91-22-22853556 |
|
Date : |
19.12.2015 |
LOCATIONS
|
Registered Office : |
Shipping House, 245, Madame Cama Road, Mumbai – 400021, Maharashtra,
India |
|
Tel. No.: |
91-22-22853556 / 22026666 |
|
Fax No.: |
91-22-22833772/ 22026905 |
|
E-Mail : |
|
|
Website : |
|
|
|
|
|
Technical and Offshore
Division 1: |
5th floor, Shipping House, 245, Madame Cama Road Mumbai 400 021, Maharashtra, India |
|
Tel. No.: |
91-22-2202 6666 / 22-2277 2164/ 65 |
|
Fax No.: |
91-22-2285 4790 |
|
E-Mail : |
|
|
|
|
|
Technical and
Offshore Division 2 : |
17th floor, Shipping house, Mumbai, Maharashtra, India |
|
Tel. No.: |
91-22-2283 2082 / 22-2277 2542 |
|
E-Mail : |
|
|
|
|
|
Technical and Offshore Division 3 : |
4th floor, Shipping house, Mumbai, Maharashtra, India |
|
Tel. No.: |
91-22-2282 1497 / 22-2277 2131 |
|
E-Mail : |
DIRECTORS
As on 31.03.2015
|
Name : |
Mr. Kelath Devadas |
|
Designation : |
Whole-Time Director |
|
Address : |
A-43 Twin Towers Premises CHS, Off Veer Savarkar Marg, Prabhadevi, Mumbai - 400025, Maharashtra, India |
|
Qualifications : |
· Marine Engineer from Marine Engineering Training College, Kolkata · Member of Institute of Engineers · Fellow Member of Institute of Marine Engineers · Fellow Member of Narottam Morarjee Institute of Shipping |
|
Expertise in
Specific functional areas : |
Vast experience and knowledge in shipping management and technical
execution of projects. |
|
Date of Appointment : |
26.09.2014 |
|
DIN No.: |
06887951 |
|
|
|
|
Name : |
Harjeet Kaur Joshi |
|
Designation : |
Whole-Time Director |
|
Address : |
C-4/ 64, Ongc Colony, Bandra Reclamation,, Bandra (West), Mumbai - 400050, Maharashtra, India |
|
Date of Appointment : |
05.02.2015 |
|
DIN No.: |
07085755 |
|
|
|
|
Name : |
Mr. Arun Kumar Gupta |
|
Designation : |
Managing Director |
|
Address : |
34, Chitrakoot, Altamount Road, Mumbai - 400026, Maharashtra, India |
|
Date of Appointment : |
25.10.2010 |
|
DIN No.: |
03310218 |
|
|
|
|
Name : |
Mr. Shrikant Vasant Kher |
|
Designation : |
Additional Director |
|
Address : |
E-3, Satya Premises CHS, Gokhale Road, Naupada, Thana West - 400602, Maharashtra, India |
|
Date of Appointment : |
01.10.2015 |
|
DIN No.: |
07286348 |
|
|
|
|
Name : |
Bipin Bihari Sinha |
|
Designation : |
Whole-Time Director |
|
Address : |
22/24, Vijay Apartment, 16, Carmichael Road, Mumbai - 400026, Maharashtra, India |
|
Qualifications : |
· Diploma in Shipping Management · Master (FG) · Life Member Company of Master Mariners |
|
Expertise in
Specific functional areas : |
Vast experience and knowledge in Shipping management, Bulk
carrier, tankers, chemicals, LPG and LNG operations. |
|
Date of Appointment : |
01.01.2013 |
|
DIN No.: |
06477074 |
|
|
|
|
Name : |
Mr. Sarveen Narula |
|
Designation : |
Whole-Time Director |
|
Address : |
93, Cuffe Parade, 116 Satnam Apartments, Colaba, Mumbai - 400005, Maharashtra, India |
|
Qualification : |
Master Mariner |
|
Expertise in Specific
functional areas : |
More than 35 years of Maritime Experience both afloat and ashore. More than 7 years command experience on several types of ships including Tankers, Bulk Carriers, Cargo ships and Container ships. |
|
Date of Appointment : |
07.07.2014 |
|
DIN No.: |
06903085 |
|
|
|
|
Name : |
Mr. Sanjeev Ranjan |
|
Designation : |
Nominee Director |
|
Address : |
Agartala Circuit House, Agartala - 799001, Tripura, India |
|
Date of Appointment : |
21.09.2015 |
|
DIN No.: |
02977371 |
|
|
|
|
Name : |
Mr. Barun Mitra |
|
Designation : |
Nominee Director |
|
Address : |
D1/33,, Rabindra Nagar, New Delhi - 110003, India |
|
Date of Appointment : |
21.01.2015 |
|
DIN No.: |
07012558 |
KEY EXECUTIVES
|
Name : |
Mr. Harjeet Kaur Joshi |
|
Designation : |
Chief Financial Officer |
|
Address : |
C-4/ 64, Ongc Colony, Bandra Reclamation,, Bandra (West), Mumbai - 400050, Maharashtra, India |
|
Date of Appointment : |
05.02.2015 |
|
PAN No.: |
ABAPJ7871R |
|
|
|
|
Name : |
Mr. Dipankar Haldar |
|
Designation : |
Secretary |
|
Address : |
Flat 1103, Kanchan Tower Plot - 9, Sector-25, Nerul, Navi Mumbai, Mumbai - 400706, Maharashtra, India |
|
Date of Appointment : |
01.11.2001 |
|
PAN NO.: |
ABHPH2605J |
MAJOR SHAREHOLDERS / SHAREHOLDING PATTERN
As on 30.09.2015
|
Category of
Shareholder |
Total No. of
Shares |
Total
Shareholding as a % of Total No. of Shares |
|
As a
% of (A+B) |
||
|
(A)
Shareholding of Promoter and Promoter Group |
||
|
|
|
|
|
|
296942977 |
63.75 |
|
|
296942977 |
63.75 |
|
|
|
|
|
Total
shareholding of Promoter and Promoter Group (A) |
296942977 |
63.75 |
|
(B)
Public Shareholding |
||
|
|
|
|
|
|
3066394 |
0.66 |
|
|
6976393 |
1.50 |
|
|
79739447 |
17.12 |
|
|
11261991 |
2.42 |
|
|
732282 |
0.16 |
|
|
732282 |
0.16 |
|
|
101776507 |
21.85 |
|
|
|
|
|
|
11866918 |
2.55 |
|
|
|
|
|
|
38085247 |
8.18 |
|
|
13064116 |
2.80 |
|
|
4063245 |
0.87 |
|
|
482565 |
0.10 |
|
|
3575330 |
0.77 |
|
|
5250 |
0.00 |
|
|
100 |
0.00 |
|
|
67079526 |
14.40 |
|
Total
Public shareholding (B) |
168856033 |
36.25 |
|
Total
(A)+(B) |
465799010 |
100.00 |
|
(C)
Shares held by Custodians and against which Depository Receipts have been
issued |
0 |
0.00 |
|
|
0 |
0.00 |
|
|
0 |
0.00 |
|
|
0 |
0.00 |
|
Total
(A)+(B)+(C) |
465799010 |
0.00 |

Shareholding of
securities (including shares, warrants, convertible securities) of persons
belonging to the category Promoter and Promoter Group
|
Sl.No. |
Name of the Shareholder |
Details of Shares held |
Total shares (including underlying shares
assuming full conversion of warrants and convertible securities) as a % of
diluted share capital |
|
|
No. of Shares held |
As a % of grand total (A)+(B)+(C) |
|||
|
1 |
President of India |
29,69,42,977 |
63.75 |
63.75 |
|
|
Total |
29,69,42,977 |
63.75 |
63.75 |
Shareholding of
securities (including shares, warrants, convertible securities) of persons belonging
to the category Public and holding more than 1% of the total number of shares
|
Sl. No. |
Name of the
Shareholder |
No. of Shares held |
Shares as % of
Total No. of Shares |
Total shares (including
underlying shares assuming full conversion of warrants and convertible
securities) as a % of diluted share capital |
|
|
1 |
Life Insurance Corporation of
India |
65796899 |
14.13 |
14.13 |
|
|
2 |
General Insurance Corporation
of India |
5246302 |
1.13 |
1.13 |
|
|
3 |
The New India Assurance Company
Limited |
4958095 |
1.06 |
1.06 |
|
|
|
Total |
76001296 |
16.32 |
16.32 |
Shareholding of
securities (including shares, warrants, convertible securities) of persons (together
with PAC) belonging to the category “Public” and holding more than 5% of the
total number of shares of the company
|
Sl. No. |
Name(s) of the
shareholder(s) and the Persons Acting in Concert (PAC) with them |
No. of Shares |
Shares as % of Total
No. of Shares |
Total shares
(including underlying shares assuming full conversion of warrants and
convertible securities) as a % of diluted share capital |
|
|
1 |
Life Insurance Corporation of
India |
65796899 |
14.13 |
14.13 |
|
|
|
Total |
65796899 |
14.13 |
14.13 |
BUSINESS DETAILS
|
Line of Business : |
Subject owns, operates and manages a fleet of bulk carriers, international container service, liquid/dry bulk service, tankers, passenger vessels and offshore supply vessels. The Company's fleet transports primarily crude oil. (From Indirect Source) |
|
|
|
|
Products : |
Not Divulged |
|
|
|
|
Brand Names : |
Not Divulged |
|
|
|
|
Agencies Held : |
Not Divulged |
|
|
|
|
Exports : |
Not Divulged |
|
|
|
|
Imports : |
Not Divulged |
|
|
|
|
Terms : |
Not Divulged |
PRODUCTION STATUS NOT AVAILABLE
GENERAL INFORMATION
|
Suppliers : |
|
||||||||||||||||||||||||||||||
|
|
|
||||||||||||||||||||||||||||||
|
Customers : |
|
||||||||||||||||||||||||||||||
|
|
|
||||||||||||||||||||||||||||||
|
No. of Employees : |
Information declined by the management |
||||||||||||||||||||||||||||||
|
|
|
||||||||||||||||||||||||||||||
|
Bankers : |
|
||||||||||||||||||||||||||||||
|
|
|
||||||||||||||||||||||||||||||
|
Facilities : |
|
||||||||||||||||||||||||||||||
|
Statutory Auditors 1 : |
|
|
Name : |
GMJ and Company Chartered Accountants |
|
Address : |
Mumbai, Maharashtra, India |
|
|
|
|
Statutory
Auditors 2 : |
|
|
Name : |
MKPS and Associates Chartered Accountants |
|
Address : |
Mumbai, Maharashtra, India |
|
|
|
|
Memberships : |
Not Available |
|
|
|
|
Collaborators : |
Not Available |
|
|
|
|
Joint Venture
Companies: |
|
CAPITAL STRUCTURE
As on 31.03.2015
Authorised Capital :
|
No. of Shares |
Type |
Value |
Amount |
|
|
|
|
|
|
1000000000 |
Equity Shares |
Rs.10/- each |
Rs. 10000.000 Million |
|
|
|
|
|
Issued, Subscribed & Paid-up Capital :
|
No. of Shares |
Type |
Value |
Amount |
|
|
|
|
|
|
465799010 |
Equity Shares |
Rs.10/- each |
Rs. 4658.000
Million |
|
|
|
|
|
Reconciliation of
Equity Shares
|
Particular |
As at 31st March, 2015 |
|
|
|
No. of shares |
Amount in Rs. Million |
|
Opening Balance |
465799010 |
4657.990 |
|
Add : Bonus Shares Issued during the Year |
-- |
-- |
|
Less : Shares bought back |
-- |
-- |
|
Closing Balance |
465799010 |
4657.990 |
Details of
shareholders holding more than 5% shares
|
Name of Shareholder |
As at 31st March, 2015 |
|
|
|
No. of shares |
% of Holding |
|
President of India |
296939920 |
63.75 |
|
Life Insurance Corporation of India |
65796899 |
14.13 |
Rights/Preference/Restriction
attached to Equity Shares
The Company has only one class of Equity Shares having par value of ` 10. Each shareholder of equity shares is entitled to one vote per share. In the event of liquidation of the Company, the holder of equity shares will be entitled to receive the remaining assets of the company after distribution of all preferential allotment in proportion to their shareholding. The dividend whenever proposed by the Board of Directors is subject to the approval of the shareholders in the ensuing Annual General Meeting. The Company is a standalone company and does not have any holding company.
FINANCIAL DATA
[all figures are
in Rupees Million]
ABRIDGED
BALANCE SHEET
|
SOURCES OF FUNDS |
31.03.2015 |
31.03.2014 |
31.03.2013 |
|
I.
EQUITY
AND LIABILITIES |
|
|
|
|
(1)Shareholders' Funds |
|
|
|
|
(a) Share Capital |
4658.000 |
4658.000 |
4658.000 |
|
(b) Reserves & Surplus |
60678.000 |
58740.200 |
61503.500 |
|
(c) Money
received against share warrants |
0.000 |
0.000 |
0.000 |
|
|
|
|
|
|
(2) Share Application money pending
allotment |
0.000 |
0.000 |
0.000 |
|
Total
Shareholders’ Funds (1) + (2) |
65336.000 |
63398.200 |
66161.500 |
|
|
|
|
|
|
(3)
Non-Current Liabilities |
|
|
|
|
(a) long-term borrowings |
55699.400 |
65707.400 |
68226.400 |
|
(b) Deferred tax liabilities (Net) |
0.000 |
0.000 |
0.000 |
|
(c) Other long term
liabilities |
4.100 |
3.600 |
84.100 |
|
(d) long-term
provisions |
1379.700 |
1242.700 |
1089.900 |
|
Total Non-current
Liabilities (3) |
57083.200 |
66953.700 |
69400.400 |
|
|
|
|
|
|
(4)
Current Liabilities |
|
|
|
|
(a) Short
term borrowings |
350.000 |
5845.400 |
4570.400 |
|
(b) Trade
payables |
12574.200 |
13193.100 |
8035.800 |
|
(c) Other current
liabilities |
16279.700 |
15451.900 |
11963.700 |
|
(d) Short-term
provisions |
425.700 |
473.100 |
761.600 |
|
Total Current
Liabilities (4) |
29629.600 |
34963.500 |
25331.500 |
|
|
|
|
|
|
TOTAL |
152048.800 |
165315.400 |
160893.400 |
|
|
|
|
|
|
II.
ASSETS |
|
|
|
|
(1)
Non-current assets |
|
|
|
|
(a) Fixed
Assets |
|
|
|
|
(i)
Tangible assets |
114323.700 |
119111.500 |
115065.100 |
|
(ii)
Intangible Assets |
120.900 |
235.800 |
332.700 |
|
(iii)
Capital work-in-progress |
4909.300 |
628.800 |
1894.500 |
|
(iv)
Intangible assets under development |
0.000 |
0.000 |
4.700 |
|
(v) Assets Retired from Active use |
0.000 |
0.000 |
1.700 |
|
(b) Non-current Investments |
130.600 |
130.600 |
0.000 |
|
(c) Deferred tax assets (net) |
0.000 |
0.000 |
0.000 |
|
(d) Long-term Loan and Advances |
4447.200 |
15913.400 |
16718.500 |
|
(e) Other
Non-current assets |
121.500 |
44.600 |
51.100 |
|
Total Non-Current
Assets |
124053.200 |
136064.700 |
134068.300 |
|
|
|
|
|
|
(2) Current
assets |
|
|
|
|
(a)
Current investments |
770.800 |
1004.300 |
1176.900 |
|
(b)
Inventories |
919.300 |
1904.500 |
1834.600 |
|
(c) Trade
receivables |
7878.200 |
10599.900 |
8864.100 |
|
(d) Cash
and cash equivalents |
12561.600 |
10189.300 |
12647.800 |
|
(e)
Short-term loans and advances |
4840.600 |
3993.800 |
1472.700 |
|
(f) Other
current assets |
1025.100 |
1558.900 |
829.000 |
|
Total
Current Assets |
27995.600 |
29250.700 |
26825.100 |
|
|
|
|
|
|
TOTAL |
152048.800 |
165315.400 |
160893.400 |
PROFIT
& LOSS ACCOUNT
|
|
PARTICULARS |
31.03.2015 |
31.03.2014 |
31.03.2013 |
|
|
|
SALES |
|
|
|
|
|
|
|
Income |
41864.400 |
42318.000 |
41956.900 |
|
|
|
Other Income |
4011.700 |
3072.000 |
2388.500 |
|
|
|
TOTAL (A) |
45876.100 |
45390.000 |
44345.400 |
|
|
|
|
|
|
|
|
Less |
EXPENSES |
|
|
|
|
|
|
|
Cost of Materials Consumed |
27941.600 |
31123.400 |
32739.100 |
|
|
|
Employees benefits expense |
4136.300 |
4110.600 |
4450.700 |
|
|
|
Other expenses |
1405.000 |
1215.800 |
2233.900 |
|
|
|
Income / (Expenses) pertaining to Prior Period |
0.000 |
0.000 |
-2997.400 |
|
|
|
Extraordinary Item |
137.100 |
529.100 |
-619.800 |
|
|
|
TOTAL (B) |
33620.000 |
36978.900 |
35806.500 |
|
|
|
|
|
|
|
|
|
PROFIT/
(LOSS) BEFORE INTEREST, TAX,
DEPRECIATION AND AMORTISATION (C) |
12256.100 |
8411.100 |
8538.900 |
|
|
|
|
|
|
|
|
|
Less |
FINANCIAL EXPENSES (D) |
1793.300 |
2060.600 |
1618.200 |
|
|
|
|
|
|
|
|
|
|
PROFIT / (LOSS) BEFORE TAX, DEPRECIATION AND AMORTISATION
(C-D) (E) |
10462.800 |
6350.500 |
6920.700 |
|
|
|
|
|
|
|
|
|
Less/ Add |
DEPRECIATION/ AMORTISATION (F) |
7701.500 |
8564.400 |
7605.200 |
|
|
|
|
|
|
|
|
|
|
PROFIT/ (LOSS) BEFORE
TAX (E-F) (G) |
2761.300 |
(2213.900) |
(684.500) |
|
|
|
|
|
|
|
|
|
Less |
TAX (H) |
752.000 |
532.700 |
458.600 |
|
|
|
|
|
|
|
|
|
|
PROFIT/ (LOSS)
AFTER TAX (G-H) (I) |
2009.300 |
(2746.600) |
(1143.100) |
|
|
|
|
|
|
|
|
|
Add |
PREVIOUS
YEARS’ BALANCE BROUGHT FORWARD |
(2284.600) |
462.000 |
1617.100 |
|
|
|
|
|
|
|
|
|
Less |
APPROPRIATIONS |
|
|
|
|
|
|
|
Depreciation Adjustment |
56.800 |
0.000 |
0.000 |
|
|
|
Tonnage Tax Reserve |
5.000 |
0.000 |
0.000 |
|
|
|
Staff Welfare Fund |
10.100 |
0.000 |
12.000 |
|
|
BALANCE CARRIED
TO THE B/S |
(347.200) |
(2284.600) |
462.000 |
|
|
|
|
|
|
|
|
|
|
Earnings / (Loss) Per Share (Rs.) |
|
|
|
|
|
|
Basic and Diluted
(including extraordinary items) |
4.31 |
(5.90) |
(2.45) |
|
|
|
Basic and Diluted
(excluding extraordinary items net of Tax) |
4.31 |
(5.90) |
(8.89) |
|
CURRENT MATURITIES OF LONG TERM DEBT DETAILS
|
Particulars |
31.03.2015 |
31.03.2014 |
31.03.2013 |
|
Current Maturities of Long term debt |
12282.100 |
11016.700 |
8847.600 |
|
Cash generated from operations |
21904.000 |
9688.000 |
8266.300 |
|
Net Cash from Operating Activities |
20995.800 |
8382.100 |
8086.900 |
QUARTERLY
RESULTS
|
Particulars |
|
30.06.2015 (Unaudited) |
30.09.2015 (Unaudited) |
|
|
|
1st Quarter |
2nd
Quarter |
|
Net Sales |
|
10564.600 |
10850.200 |
|
Total Expenditure |
|
7306.200 |
7722.300 |
|
PBIDT (Excl OI) |
|
3258.400 |
3127.900 |
|
Other Income |
|
338.700 |
535.500 |
|
Operating Profit |
|
3597.100 |
3663.400 |
|
Interest |
|
401.500 |
410.100 |
|
Exceptional Items |
|
NA |
NA |
|
PBDT |
|
3195.600 |
3253.300 |
|
Depreciation |
|
1400.200 |
1451.200 |
|
Profit Before Tax |
|
1795.400 |
1802.100 |
|
Tax |
|
160.000 |
190.000 |
|
Provisions and
contingencies |
|
NA |
NA |
|
Profit After Tax |
|
1635.400 |
1612.100 |
|
Extraordinary Items |
|
NA |
NA |
|
Prior Period Expenses |
|
NA |
NA |
|
Other Adjustments |
|
NA |
NA |
|
Net Profit |
|
1635.400 |
1612.100 |
KEY
RATIOS
|
PARTICULARS |
|
31.03.2015 |
31.03.2014 |
31.03.2013 |
|
Net Profit Margin (PAT / Sales) |
(%) |
4.80 |
(6.49) |
(2.72) |
|
|
|
|
|
|
|
Operating Profit Margin (PBIDT/Sales) |
(%) |
29.28 |
19.88 |
20.35 |
|
|
|
|
|
|
|
Return on Total Assets (PBT/Total Assets} |
(%) |
1.88 |
(1.35) |
(0.43) |
|
|
|
|
|
|
|
Return on Investment (ROI) (PBT/Networth) |
|
0.04 |
(0.03) |
(0.01) |
|
|
|
|
|
|
|
Debt Equity Ratio (Total Debt /Networth) |
|
1.05 |
1.30 |
1.23 |
|
|
|
|
|
|
|
Current Ratio (Current Asset/Current Liability) |
|
0.94 |
0.84 |
1.06 |
STOCK
PRICES
|
Face Value |
Rs.10/- |
|
Market Value |
Rs.98.35/- |
FINANCIAL ANALYSIS
[all figures are
in Rupees Million]
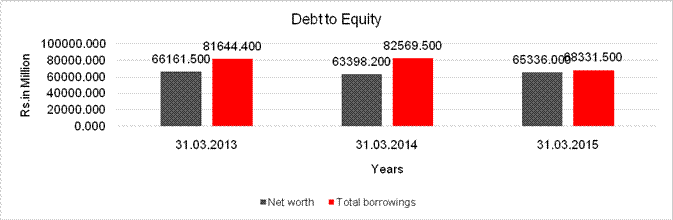
DEBT EQUITY RATIO
|
Particular |
31.03.2013 |
31.03.2014 |
31.03.2015 |
|
|
(Rs.
In Million) |
(Rs.
In Million) |
(Rs.
In Million) |
|
Share Capital |
4658.000 |
4658.000 |
4658.000 |
|
Reserves & Surplus |
61503.500 |
58740.200 |
60678.000 |
|
Net
worth |
66161.500 |
63398.200 |
65336.000 |
|
|
|
|
|
|
long-term borrowings |
68226.400 |
65707.400 |
55699.400 |
|
Short term borrowings |
4570.400 |
5845.400 |
350.000 |
|
Current maturities of
long-term debts |
8847.600 |
11016.700 |
12282.100 |
|
Total
borrowings |
81644.400 |
82569.500 |
68331.500 |
|
Debt/Equity
ratio |
1.234 |
1.302 |
1.046 |
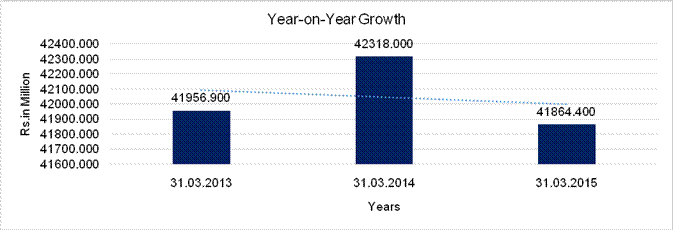
YEAR-ON-YEAR GROWTH
|
Year
on Year Growth |
31.03.2013 |
31.03.2014 |
31.03.2015 |
|
|
(Rs.
In Million) |
(Rs.
In Million) |
(Rs.
In Million) |
|
Sales |
41956.900 |
42318.000 |
41864.400 |
|
|
|
0.861 |
(1.072) |
NET PROFIT MARGIN
|
Net
Profit Margin |
31.03.2013 |
31.03.2014 |
31.03.2015 |
|
|
(Rs.
In Million) |
(Rs.
In Million) |
(Rs.
In Million) |
|
Sales |
41956.900 |
42318.000 |
41864.400 |
|
Profit |
(1143.100) |
(2746.600) |
2009.300 |
|
|
(2.72%) |
(6.49%) |
4.80% |

LOCAL AGENCY FURTHER INFORMATION
|
Sr. No. |
Check list by
info agents |
Available in
Report (Yes/No) |
|
1 |
Year of establishment |
Yes |
|
2 |
Constitution of the entity -Incorporation
details |
Yes |
|
3 |
Locality of the entity |
Yes |
|
4 |
Premises details |
No |
|
5 |
Buyer visit details |
-- |
|
6 |
Contact numbers |
Yes |
|
7 |
Name of the person contacted |
Yes |
|
8 |
Designation of contact person |
Yes |
|
9 |
Promoter’s background |
Yes |
|
10 |
Date of Birth of Proprietor / Partners /
Directors |
Yes |
|
11 |
Pan Card No. of Proprietor / Partners |
No |
|
12 |
Voter Id Card No. of Proprietor / Partners |
No |
|
13 |
Type of business |
Yes |
|
14 |
Line of Business |
Yes |
|
15 |
Export/import details (if applicable) |
No |
|
16 |
No. of employees |
No |
|
17 |
Details of sister concerns |
Yes |
|
18 |
Major suppliers |
No |
|
19 |
Major customers |
No |
|
20 |
Banking Details |
Yes |
|
21 |
Banking facility details |
Yes |
|
22 |
Conduct of the banking account |
-- |
|
23 |
Financials, if provided |
Yes |
|
24 |
Capital in the business |
Yes |
|
25 |
Last accounts filed at ROC, if applicable |
Yes |
|
26 |
Turnover of firm for last three years |
Yes |
|
27 |
Reasons for variation <> 20% |
-- |
|
28 |
Estimation for coming financial year |
No |
|
29 |
Profitability for last three years |
Yes |
|
30 |
Major shareholders, if available |
Yes |
|
31 |
External Agency Rating, if available |
Yes |
|
32 |
Litigations that the firm/promoter
involved in |
Yes |
|
33 |
Market information |
-- |
|
34 |
Payments terms |
No |
|
35 |
Negative Reporting by Auditors in the
Annual Report |
No |
LITIGATION DETAILS
|
HIGH COURT OF
BOMBAY |
||||
|
CASE DETAILS BENCH: BOMBAY |
||||
|
Presentation Date:- 10.08.2015 |
||||
|
Stamp No.: CAFST/22534/2015 |
Filing Date: 19.08.2015 |
|
||
|
Stamp No.: FAST/22532/20145
Main Matter |
||||
|
Petitioner: THE BOARD OF
TRUSTEES OF THE PORT OF BOMBAY |
Respondent: THE SHIPPING CORPORATION OF INDIA LIMITED |
|||
|
Petn. Adv: MOTIWALLA AND COMPANY |
||||
|
|
|
|||
|
District: MUMBAI |
||||
|
|
||||
|
Bench: SINGLE
Status: Pre-Admission Last Date:- 26.08.2015 Last Coram:- REGISTRAR(JUDICIAL) |
Category: CONDONATION OF DELAY Stage:- |
|||
|
Act: C.P.C. (Non-Interlocutory Order) |
Under Section:- 96 |
|||
FINANCIALS:
They have finally steadied the ship and turned around to report a net profit of Rs. 2009.300 Million for the year ended 31st March 2015. This is against a net loss of Rs. 2746.600 Million in the previous year. It is heartening to note that all the three business segments of SCI have reported profits in the last quarter and also on annual basis. The losses due to unprecedented downturn in the dry bulk markets have been partially offset by the rally in the tanker market since early 2015.
While the net income from operations has almost remained flat, the appreciable decrease in various expenses, impact of judicious cancellation of new ship building orders, rally in tanker freights (basically attributed to fall in crude prices) and sale of old vessels have contributed to the positive results. The overall financial health of the company has improved, their borrowings are reduced, lenders are more comfortable and their creditability in the market is maintained.
OPERATIONS:
The United States, once the largest importer of Crude Oil from the middle-eastern markets has over the years turned into a net exporter due to the shale revolution in the North American continent. This has drastically changed the dynamics of the crude tanker trade. Led by Saudi Arabia, the OPEC countries have maintained their production levels despite the fall in crude oil prices, triggering a price war with non-OPEC nations. Surprisingly the entire production and the surplus are being absorbed by the market. It is now understood that a part of the output is going towards built up of strategic petroleum reserves of various countries and also towards floating storage. Cost of storage of oil, even though minuscule has played its part in the marginal recovery in tanker trade. Saudi Arabia is in a transition phase in becoming the world’s largest refiner. China is now the larger importer of crude oil and even India’s appetite for import of crude is ever increasing. As a result of all above, there was an unseasonal sunshine in the tanker market since beginning of 2015 and SCI was able to take advantage of the rally. The successful conclusion of talks between Iran and P5+1 nations and the resultant thawing of relations between Iran & the West, has created positive signals. However, it may take some more time for the Iranian oil to start flowing into the market. The impact of the ban slapped on 100+ VLCCs by Nigeria’s state oil company NNPC is significant however its influence on the rates is yet to be ascertained.
The dry bulk trade has indeed tested the nerves of most players in the industry. The Baltic Dry Index (BDI) had touched an all time low of 509 on 18th February, 2015 and continues to hover around 1000 levels. At this rate the owners / operators of dry bulk carriers can’t even breakeven their daily standing charges. Already a record number of 71 Capesize bulk carriers have been sold for scrap this year. Still, some companies with deep pockets continue to take deliveries of VLOC / Valemaxes. However, overall efforts are there to cut capacity in this segment but seeing the order book in the pipeline a revival in the dry bulk market is not expected in the near future
‘Economies of scale to survive’ says the industry and container trade is no different. There was a time when SCI’s
4400 TEU vessels were called large vessels. Now, a couple of 19,000 TEU vessels are trading in the market. The container business across the world is dominated by a few players due to which they are in a position to dictate terms for doing business. SCI is dependent on her agents and consortium partners for the container trade. However SCI has been able to prevail upon their consortium partners for restructuring and rationalization of port calls. SCI has imposed tighter controls over agents, reduced container inventories and cut down on various cargo handling expenses. These efforts, though small, have significantly contributed to the overall results. The merger of two big Chinese players and devaluation of the Yuan is likely to play a major role in the days to come.
SCI’s Offshore has been the consistent horse, giving steady and firm revenues over the years. This year was no different. SCI aims to expand in this segment; however they need to tread cautiously. The offshore market is a little depressed due to fall in crude oil prices and the resultant slowdown in E and P activities.
Appropriations:
The working results for the company for the year 2014-15 after considering prior period adjustments show a profit of Rs. 2009.300 Million. An amount of Rs. 5.000 Million has been transferred to Tonnage Tax Reserve u/s 115VT of the Income Tax Act, 1961. Further an amount of Rs. 56.800 Million has been debited on account of depreciation adjustment (Refer Note 38) The Directors propose to make appropriations of Rs. 10.100 Million for FY 2014-15 under Staff Welfare Fund. After adjusting an opening debit balance of Rs. 2284.600 Million (being balance profit and loss account brought forward from previous year), there is a debit balance in Profit and Loss A/c of Rs. 347.200 Million.
Brief Analysis of
Financial Performance:
SCI has reported a profit of Rs. 2009.300 Million for the financial year 2014-15 after incurring losses for three consecutive financial years. All the segments (Liner, Bulk & Technical and Offshore) have reported profit before Tax and Interest. The tanker market has shown some improvement which has partly offset the losses of the bulk carrier. The judicious cancellation of contracts and control of costs especially the Cargo Handling Expenses and Repairs and Maintenance expenses coupled with lower bunker prices have positively impacted the results.
MANAGEMENT DISCUSSION
AND ANALYSIS
INDUSTRY STRUCTURE
AND DEVELOPMENTS
WORLD SCENARIO
The world GDP grew by an average of 3.3% in 2014, with growth estimates for 2015 and 2016 at 3.5% and 3.8% respectively. The year 2014 witnessed uneven global recovery on the back of falling oil and commodity prices, and strengthening of the US Dollar in particular while geopolitical tensions weighed heavily on the downside risk limiting upside prospects. The US in particular gained from lower commodity prices and currency gains while Europe and Japan continued to struggle with deflationary pressures. China fared well in the process of managing the slowdown, while unable to settle on an equilibrium growth rate commensurate with central planning and private investment. The prospects for the year 2015, rests largely on the developing Asian economies, mainly China and India. The growth pattern in Europe is expected to be volatile. Global GDP
According to IMF, Global GDP growth has been 3.3% in 2014 and expected to be around 3.5% in 2015. The decline in commodity prices especially crude oil is expected to boost world GDP by shifting ‘real income’ from producing to consuming nations such as the US, China and India. The US economy is riding on the advantages of a strong currency and lower commodity prices, where growth is expected to exceed 3% in 2015-16.
Amongst the emerging economies the growth is projected to be broadly stable at 4.5% - 4.7%, although China continues to face hurdles in stimulating domestic demand with lagging export opportunities and is expected to grow at 6.8%. On the other hand India is expected to surpass China with a growth rate of 7.5% driven mainly by a stable and pro reform Government and radical policy changes.
IMF’s World Economic Outlook states that global output will expand by 3.5% in 2015 and increase further to 3.8% in 2016, as against 3.4% in 2014.The economy of developed nations is expected to improve by 2.4% in 2015 and 2016. The report forecasts global trade to grow from 3.4% in 2014 to 3.7% and 4.7% in 2015 and 2016 respectively, on the back of increasing demand from developing economies for commodities and demand stability from developed economies, although growth is expected to be moderate and uneven in distribution amongst individual countries.
The global GDP growth directly affects the international trade (export and imports) and in turn affects the shipping industry as about 80% of the international trade by volume is carried out by shipping.
Seaborne Trade, Fleet
and Market
Globally, the oil trade (i.e ‘Crude Oil’ and ‘Products’ segments) growth rose marginally by 0.7% compared to 1.4% growth in 2013. In the ‘oil’ trade segment, the global ‘Crude oil’ imports was almost stagnant at 2.10 billion tons, whereas global ‘Products’ imports were 0.92 billion tons, increasing by 4.4%. The tanker fleet expanded by 1.4% in 2014 as compared to 2.5% during the previous year. Overall for most crude tanker owners, 2014 was an optimistic year with earnings across segments at levels above operating costs for most of the year.
The dry bulk trade increased by more than 8% in volume over the course of the year but oversupply of tonnage continued to plague the markets and earnings. Although time charter rates improved on the backdrop of falling commodity prices leading to long hauls, the spot and trip charter rates remained low and volatile due to local over supply of tonnage. The deceleration in fleet growth continued to about 5.3% from 5.6% in 2013 but the fleet growth is expected to clock an average 5% annually for the next couple of years limiting the prospects for a reversal in the supply demand gap. Most of the gains in demand during 2014 came from the iron ore, and coal trades. China followed by developing nations such as India was the key driver of the increase in demand.
The container trade in 2014 was around 159 million TEUs registering an improvement in growth at 4.9% over 2013 as compared to 4.2% in year 2013 and 2.5% in 2012. The improvement was mainly attributed to resurgence of European import growth and a strong expansion in US imports propelled by a fast expanding economy and retail demand. The Chinese containers exports to Europe and US posted strongest gains since 2010 though the overall export growth stagnated near 6% mark. Fleet growth remained steady in 2014 despite rising new building volumes, due to moderation of delivery slippages and disposals having remained high, keeping fleet expansion under control.
iv] OUTLOOK
As the prospects for global economy point to improved growth at about 3.5%-3.8% in 2015-16, oil trade demand (both crude and product) will gain support from low oil prices and changing trade patterns are expected to absorb the modest growth in fleet lending support to positive earnings. This would allow the tanker market to remain buoyant over the coming year with rates and prices for both crude and product tankers moving up, on average compared to 2014. Most indicators are likely to stabilize in 2015 and from 2016-18, crude tanker indicators would hold steady over this period, while product tanker rates and prices may come under some pressure due to excessive fleet growth. In the dry bulk segment freight rates are expected to undergo severe volatility over the course of next five years. More specifically, freight rates for Cape, Panamax, and small bulkers are projected to increase in 2015 before coming down in 2016-18 due to surge in the fleet growth.
In the container segment, freight rates in the east-west, north-south and intra-area markets averaged 1% lower in 2014 than 2013 levels, and despite losing some ground towards the year-end, freight rates remained at or slightly below earlier levels. This was a positive development considering that the fuel prices averaged much lower than prices prevailing a year before, allowing for a significant cushion. Improving market sentiments based on the forecast of an improving economy in Europe and robust trade growth to US would help in strengthening the resolve of liner companies to push for rate restoration in 2015. Cementing of the operating positions and services of the four major alliances in the east-west trades early 2015 is expected to lead to market discipline returning in the premier markets with fewer incidents of rate undercutting and a more orderly approach towards rate restoration. Charter market fundamentals are also expected to improve steadily in 2015 with a further upgrade predicted in 2016.
DISCUSSION ON
FINANCIAL PERFORMANCE WITH RESPECT TO OPERATIONAL PERFORMANCE
The financial performance of the tanker segment has been largely influenced by earnings on the VLCC, Suezmax and Aframax segments where SCI has had a mix of cross trade charters, Contract of Affreightments and Time charter businesses to effectively hedge employment and earnings risks. One the smaller segment product carriers and LR I dirty carriers; the employment was mainly to meet the domestic product and indigenous crude movements on long term contracts and time charter business. The mix of employment types and geographical concentration in niche coastal business segments has ensured returns in line with market trends.
The dry bulk segment was subject to severe tonnage over capacity worldwide and loss of key cargoes such as Iron ore from India resulting in non profitable ballast voyage legs thereby reducing earnings. Very few profitable trades emerged during the year under consideration and the situation is expected to remain depressed with earnings remaining under pressure.
LINER AND PASSENGER
SERVICES
LINER SERVICES
World Scenario
The liner industry presented a mixed bag of operating results for the calendar year 2014 with the operating earnings weakening towards the year end due to softening of freight rates and volumes in the last quarter of the year 2014. The sharp decline in bunker prices and a strong dollar helped support the liner shipping lines. For the year as a whole, however, improvement in operating performance took place averaging 1% below year-earlier levels which was the first positive annual performance since 2010. This was attributed mainly to increasing cost savings as a result of lower unit costs as the industry continued to optimize its trading networks and upsize its fleet to larger, fuel-efficient vessels.
The vessel utilization in both Asia-Europe West Bound (WB) and in the Transpacific East Bound (EB) arterial lanes, moved higher as compared to the previous year as robust trade growth exceeded capacity gains. Cascading of smaller vessels to other routes alleviated the burden of new building additions and slow-steaming helped to accommodate the extra capacity. Rates in the North-South lanes however slid as capacity gains overtook demand growth though the intra-Asia rates remained at par with 2013 averages. Fleet growth remained steady in 2014 and despite rising new building volumes, container-capable fleet growth remained at 5.3% similar to 5.2% pace in 2013 with disposal at 2013-high levels which kept fleet expansion under control.
b) Indian Scenario
The volume of export and import containers handled at major ports in India rose by 6.71 percent in 2014-15 from the year ago levels and total cargo tonnage inched up 4.65 percent, according to the tentative estimates of Indian Ports Association. Cumulative yearly traffic totaled nearly 8 million TEUs in April 2014 through March 2015 period, up from 7.46 million TEUs in the previous year. Jawaharlal Nehru port, India’s busiest container gateway located near Mumbai, handled 4.47 million TEUs and 63.80 million tons of cargo in the year 2014-15 as compared to 4.16 million TEUs and 62.33 million tons in 2013 registering a 7.5 percent increase in TEUs handled even as congestion continued to trouble the port.
OUTLOOK
An improving global economy and accelerating trade growth especially in the North American and European markets is expected to lead to better fleet utilization, liner profitability and charter rates in 2015. The freight rate restoration would depend upon the market discipline observed by the shipping lines by avoiding undercutting and the temptation of speeding up the fleet regardless of the low fuel prices which could aggravate the capacity surplus, coupled with an orderly introduction of new tonnage. Continued strong growth in containerized trade is expected for Asia-Europe West Bound and Transpacific East Bound trade routes though the North-South markets may remain suppressed this year. Intra-Asia markets are expected to continue to accelerate in 2015-16. Liner fleet utilization is likely to level off in 2015 but is expected to grow strong in 2016-17 as market fundamentals are set to improve.
TECHNICAL AND
OFFSHORE SERVICES
World scenario
The offshore support vessels industry is dependent on utilization of rigs, oil fields and other crude oil E and P activity, which in turn depends upon strategic decisions of energy security by oil and gas producers, shifts in Government policies and long term crude oil price trends. The world’s primary energy consumption is projected to grow at an average of 1.4% p.a. with major part of the growth is in non-OECD countries, with Asian countries like China and India accounting for nearly half the growth. During FY 2014-15, Brent crude price touched a low of US$45/barrel in March 2015, after a fall in price from US$ 105/bbl in FY 13-14. It can be observed from the rig data that out of the total available rigs worldwide only about 70% were operational during FY 14-15. In line with the same, the worldwide AHTS utilization declined from 75% at the start of FY14-15 to 67% during end of FY 14-15 and PSV utilization declined from 85% at the start of FY14-15 to 75% during end of FY 14-15.
As on July 2015, only about 65% of total available rigs worldwide are operational. In absence of rigs in operation and due to oversupply of offshore vessels in world market the freight / charter hire market for offshore vessels has also been under pressure.
Indian scenario
Historically, India’s domestic production of oil and gas has fallen short of its burgeoning energy requirements, compelling their country to rely on imports. India’s crude oil imports bill forms one-third of the total value of imports, thereby widening India’s current account deficit. The declining international Brent Curde Oil price during 2014-15, has reduced the burden of importing crude oil by over 35% in terms of value in their country.
The global decline in prices of crude oil has however not significantly impacted the performance of Indian E and P industry, and the activities of this sector during 2014-15 have been more or less similar to that of the previous year. In order to ensure energy security and attract investments in E and P, the Indian Government had initiated New Exploration Licensing Policy (NELP). In the first nine rounds of NELP (NELP-I to NELP-IX), the Government awarded 254 E and P blocks, of which 140 were offshore/deep water blocks. In the tenth round of NELP, 46 blocks shall be offered, of which 29 are offshore blocks.
It may be noted that the average utilization of the OSVs in India during 2014-15 was in range of 85%~95%. Further, 89% Indian offshore fleet has been active during the financial year 2014-15.
Outlook
World Outlook
The world energy consumption is expected to continue to increase over the coming decades. The crude oil prices are showing downward trend and are expected to remain under pressure during FY 2015-16. The excessive oil supplies from Saudi Arabia have impacted the crude oil prices. Further, as per industry reports, Iran is expected to start their oil production by November 2015 which may create pressure on global crude oil prices.
Considering the sluggish demand and the present over supply of crude oil, the exploration activities are not expected to be pickup during next one to two years. As a consequence demand for rigs is projected to decline which may directly affect the requirements of offshore vessels to some extent. Accordingly the international freight / charter hire market for offshore vessels is expected to be under pressure for at least next 1-2 years.
Indian Outlook
As stated earlier, India’s domestic production of hydrocarbon products falls far short of meeting the ever-rising energy demand and thus India would continue to import crude oil to bridge the demand and supply gap. Although the reduction of global crude oil prices would have positive impact on growing Indian economy, self reliance on crude oil production is necessary to insulate India against unforeseen market volatility as well as from energy security point of view.
Nevertheless the Indian Government has been taking steps to boost the domestic E and P sector as around 56% of India’s oil reserves and 66% of natural gas reserves are in offshore blocks. According to industry experts, increasing number of finds coupled with higher acreage being made available for exploration under NELP would drive domestic E and P activities in the long term. According to industry body PHD Chamber of Commerce and Ernst and Young, India’s national oil companies are likely to spend about Rs. 1,250 billion on exploration and production during 2015-17. PSU oil companies like ONGC, IOC are planning to invest around Rs. 760000.000 Million on the project expansion during 2015-16, up 5 per cent over the previous fiscal year. In the backdrop as above, SCI expects that the domestic demand for offshore vessels would continue to be stable in India.
The competitive market environment has however provided an opportunity to invest into the offshore fleet as the new building/ resale prices of vessels have softened. The situation is also favorable for venturing into specialized segments like well stimulation which command higher charter rates by acquiring/ converting suitable offshore vessels. SCI has been closely monitoring the developments in the offshore segment and plans to take advantage of suitable opportunities for increasing its market share as well as to diversify its activities in this segment.
The market scenario of offshore vessel segment in India has been very competitive in recent years as many foreign flag offshore vessels are entering Indian market. However, the Indian flagged vessels get protection against the foreign flagged vessels in terms of Right of First Refusal, with which most of these vessels are assured of employment in the Indian oil fields. SCI with a fleet of modern and fuel efficient offshore vessels is well equipped to take on the competition in the offshore segment.
UNSECURED LOAN
|
PARTICULARS |
31.03.2015 (Rs.
in Million) |
31.03.2014 (Rs.
in Million) |
|
Short-term
borrowings |
|
|
|
-from Banks repayable on demand |
0.000 |
2564.000 |
|
|
|
|
|
Total |
0.000 |
2564.000 |
INDEX
OF CHARGES
|
S.No. |
Charge ID |
Date of Charge Creation/Modification |
Charge amount secured |
Charge Holder |
Address |
Service Request Number (SRN) |
|
1 |
10510574 |
03/07/2014 |
13,844,019,000.00 |
MIZUHO BANK (USA) |
1251 Avenue of the Americas, New York, - 10020, U |
C12478350 |
|
2 |
10494962 |
22/05/2014 |
125,402,914.00 |
SUMITOMO MITSUI BANKING CORPORATION |
1-1-2, MARUNOUCHI, CHIYODA-KU, TOKYO, - 1000005, |
C04612198 |
|
3 |
10475399 |
12/02/2014 * |
1,490,000,000.00 |
STATE BANK OF INDIA |
OVERSEAS BRANCH, WORLD TRADE CENTRE, CUFFE PARADE, MUMBAI, Maharashtra
- 400005, INDIA |
C00769919 |
|
4 |
10474583 |
02/12/2013 |
1,260,000,000.00 |
BNP PARIBAS |
16, Boulevard desItaliens, Paris, -75009, FRANCE |
B95078499 |
|
5 |
10433212 |
20/06/2013 |
4,500,000,000.00 |
SBICAP TRUSTEE COMPANY LIMITED |
202, MAKER TOWER, 'E', CUFFE PARADE, COLABA, MUMBAI, Maharashtra -
400005, INDIA |
B78036290 |
|
6 |
10425970 |
27/03/2013 |
9,627,822,000.00 |
Sumitomo Mitsui Banking Corporation |
1-2-3 Otemachi, Chiyoda-Ku, Tokyo, - 1000004, JAPAN |
B75214072 |
|
7 |
10410389 |
18/01/2013 |
1,550,000,000.00 |
SBICAP TRUSTEE COMPANY LIMITED |
202, MAKER TOWER, 'E', CUFFE PARADE,, COLABA, MUMBAI, Maharashtra -
400005, INDIA |
B70244173 |
|
8 |
10395793 |
27/11/2013 * |
5,232,000,000.00 |
Standard Chartered Bank |
5th Floor, 1 Basinghall Avenue, London, - EC2V5D |
B90815473 |
|
9 |
10393562 |
13/12/2012 |
1,892,240,000.00 |
DVB Group Merchant Bank (Asia) Limited |
77 Robinson Road, #30-02, Singapore, - 068896, SINGAPORE |
B64735004 |
|
10 |
10393653 |
04/04/2013 * |
4,734,400,000.00 |
SBICAP TRUSTEE COMPANY LIMITED |
202, MAKER TOWER, 'E', CUFFE PARADE, COLABA, MUMBAI, Maharashtra -
400005, INDIA |
B75186965 |
UNAUDITED STANDALONE FINANCIAL RESULTS FOR THE QUARTER AND HALF YEAR
ENDED 30TH SEPTEMBER, 2015
(Rs. In Million)
|
|
Particulars |
Three Months Ended |
Six Months Ended |
|||||
|
|
30.09.2015 |
30.06.2015 |
30.09.2015 |
|||||
|
|
(Unaudited) |
(Unaudited) |
(Unaudited) |
|||||
|
1 |
Income from
Operations |
|
|
|
||||
|
|
a. Income from Operation |
10771.800 |
10457.700 |
21229.500 |
||||
|
|
b. Other Operating Income |
78.400 |
107.200 |
185.600 |
||||
|
|
c. Profit on Sales of Ships |
0.000 |
0.000 |
0.000 |
||||
|
|
Total Income from Operations |
10850.200 |
10564.900 |
21415.100 |
||||
|
2 |
Expenditure |
|
|
|
||||
|
|
Employees Cost (Shore and
Floating) |
1166.200 |
1029.400 |
2195.600 |
||||
|
|
Bunker |
1896.200 |
1811.100 |
3707.300 |
||||
|
|
Port dues |
739.900 |
914.900 |
1654.800 |
||||
|
|
Cargo Handling Expenses |
477.100 |
354.100 |
831.200 |
||||
|
|
Repairs and Maintenance |
762.600 |
588.800 |
1351.400 |
||||
|
|
Charter Hire |
1577.300 |
1388.800 |
2966.100 |
||||
|
|
Provisions |
67.200 |
15.100 |
82.300 |
||||
|
|
Depreciation |
1451.200 |
1400.200 |
2851.400 |
||||
|
|
Other Expenses |
1035.800 |
1204.300 |
2240.100 |
||||
|
|
Total Expenses |
9173.500 |
8706.700 |
17880.200 |
||||
|
3 |
Profit/ (Loss) from operations before other income and
finance costs and Exceptional Items |
1676.700 |
1858.200 |
3534.900 |
||||
|
4 |
Interest Income |
269.200 |
317.800 |
587.000 |
||||
|
|
Other Income |
266.300 |
20.900 |
287.200 |
||||
|
5 |
Profit/ (Loss) from
ordinary activities before finance costs and Exceptional Items |
2212.200 |
2196.900 |
4409.100 |
||||
|
6 |
Finance Costs |
410.100 |
401.500 |
811.600 |
||||
|
7 |
Profit/ (Loss)
before tax |
1802.100 |
1795.400 |
3597.500 |
||||
|
8 |
Tax Expense |
0.000 |
0.000 |
0.000 |
||||
|
9 |
Net Profit for the period (9-10) |
1802.100 |
1795.400 |
3597.500 |
||||
|
10 |
Paid up Equity Share Capital (Face Value of Re.10/- Each) |
4658.000 |
4658.000 |
4658.000 |
||||
|
11 |
Reserves excluding Revaluation Reserves |
|
|
|
||||
|
12 |
Earnings Per Share (Rs.) |
|
|
|
||||
|
|
Basic EPS for the period (Not Annualised) |
3.46 |
3.51 |
6.97 |
||||
|
|
Diluted EPS for the period (Not Annualised) |
3.46 |
3.51 |
6.97 |
||||
|
|
|
|
|
|
||||
|
PART - II SELECT INFORMATION FOR THE QUARTER AND
SIX MONTHS ENDED 30TH SEPTEMBER 2015 |
||||||||
|
A |
PARTICULARS OF
SHAREHOLDING |
|
|
|
|||
|
1 |
Public shareholding |
|
|
|
|||
|
|
a. |
Number of shares |
168856033 |
168856033 |
168856033 |
||
|
|
b. |
Percentage of shareholding |
36.25% |
36.25% |
36.25% |
||
|
2 |
Promoters and promoter group shareholding |
|
|
|
|||
|
|
a. |
Pledged/Encumbered |
|
|
|
||
|
|
Number of shares (in Crore) |
-- |
-- |
-- |
|||
|
|
|
Percentage of shares (as a % of the total shareholding of promoter and promoter group) |
-- |
-- |
-- |
||
|
|
|
Percentage of shares (as a % of the total share capital of the Company) |
-- |
-- |
-- |
||
|
|
b. |
Non-encumbered |
|
|
|
||
|
|
Number of shares |
296942977 |
296942977 |
296942977 |
|||
|
|
|
Percentage of shares (as a % of the total shareholding of promoter and promoter group) |
100.00% |
100.00% |
100.00% |
||
|
|
|
Percentage of shares (as a % of the total share capital of the Company) |
63.75% |
63.75% |
63.75% |
||
|
|
Particulars |
Quarter ended 30.09.2015 |
|
B |
Investor Complaints |
|
|
|
Pending at the beginning of the quarter |
0 |
|
|
Received during the quarter |
1 |
|
|
Disposed of during the quarter |
1 |
|
|
Remaining unresolved at the end of the
quarter |
0 |
STATEMENT
OF ASSETS AND LIABILITIES AS ON 30.09.2015
(Rs.
In Million)
|
SOURCES
OF FUNDS |
30.09.2015 |
|
|
|
|
I.
EQUITY AND LIABILITIES |
|
|
(1)Shareholders' Funds |
|
|
(a) Share Capital |
4658.000 |
|
(b) Reserves & Surplus |
63921.800 |
|
(c) Money received against
share warrants |
0.000 |
|
|
|
|
(2) Share Application money
pending allotment |
0.000 |
|
Total
Shareholders’ Funds (1) + (2) |
68579.800 |
|
|
|
|
(3) Non-Current Liabilities |
|
|
(a) long-term borrowings |
52108.800 |
|
(b) Deferred tax liabilities
(Net) |
0.000 |
|
(c) Other long term
liabilities |
1.600 |
|
(d) long-term provisions |
1448.900 |
|
Total
Non-current Liabilities (3) |
53559.300 |
|
|
|
|
(4) Current Liabilities |
|
|
(a) Short term borrowings |
0.000 |
|
(b) Trade payables |
9351.300 |
|
(c) Other current liabilities |
19812.500 |
|
(d) Short-term provisions |
446.000 |
|
Total
Current Liabilities (4) |
29609.800 |
|
|
|
|
TOTAL |
151748.900 |
|
|
|
|
II.
ASSETS |
|
|
(1) Non-current assets |
|
|
(a) Fixed Assets |
|
|
(i) Tangible assets |
119761.800 |
|
(ii) Intangible Assets |
60.800 |
|
(iii) Capital work-in-progress |
37.200 |
|
(iv) Intangible assets under
development |
0.000 |
|
(b) Non-current Investments |
273.800 |
|
(c) Deferred tax assets (net) |
0.000 |
|
(d) Long-term Loan and Advances |
4455.600 |
|
(e) Other Non-current assets |
118.800 |
|
Total
Non-Current Assets |
124708.000 |
|
|
|
|
(2) Current assets |
|
|
(a) Current investments |
2193.100 |
|
(b) Inventories |
840.400 |
|
(c) Trade receivables |
8141.900 |
|
(d) Cash and cash equivalents |
10854.300 |
|
(e) Short-term loans and
advances |
3613.300 |
|
(f) Other current assets |
1397.900 |
|
Total
Current Assets |
27040.900 |
|
|
|
|
TOTAL |
151748.900 |
SEGMENT WISE REVENUE,
RESULTS AND CAPITAL EMPLOYED FOR THE QUARTER ENDED 30TH SEPTEMBER
2015
|
Particulars |
quarter ended 30.09.2015 |
quarter ended 30.06.2015 |
Half year ended 30.09.2015 |
|
Particulars |
|||
|
Segment Revenue |
|
|
|
|
a)Liner Segment |
1372.300 |
1658.000 |
3030.300 |
|
b) Bulk Segment |
8504.500 |
8055.900 |
16560.400 |
|
c) Technical and Offshore Segment |
920.900 |
835.000 |
1755.900 |
|
d) Others |
52.500 |
16.000 |
68.500 |
|
Total |
10850.200 |
10564.900 |
21415.100 |
|
Less: Unallocated Revenue |
266.300 |
20.900 |
287.200 |
|
Total |
11116.500 |
10585.800 |
21702.300 |
|
|
|
|
|
|
Segment Results |
|
|
|
|
Profit/(Loss) before Tax .Exceptional items and Interest |
|
|
|
|
from each segment |
|
|
|
|
a)Liner Segment |
(323.600) |
(206.700) |
(530.300) |
|
b) Bulk Segment |
1595.300 |
1779.600 |
3374.900 |
|
c) Technical and Offshore Segment |
359.000 |
286.400 |
645.400 |
|
d) Others |
47.800 |
9.000 |
56.800 |
|
Total |
1678.500 |
1868.300 |
3546.800 |
|
Less: Unallocated Revenue (Net of Expenditure) |
264.500 |
10.800 |
275.300 |
|
Profit before interest and tax |
1943.000 |
1879.100 |
3822.100 |
|
Less: Interest Expenses |
410.100 |
401.500 |
811.600 |
|
Add: Interest
Income |
269.200 |
317.800 |
587.000 |
|
Profit before Tax |
1802.100 |
1795.400 |
3597.500 |
|
|
|
|
|
|
Capital Employed |
|
|
|
|
(Segment assets - Segment Liabilities) |
|
|
|
|
a)Liner Segment |
(472.300) |
2728.200 |
(472.300) |
|
b) Bulk Segment |
106523.800 |
102964.200 |
106523.800 |
|
c) Technical and Offshore Segment |
12441.000 |
13202.200 |
12441.000 |
|
d) Others |
(3.800) |
(9.100) |
(3.800) |
|
Total Capital Employed in Segment |
118488.700 |
118885.500 |
118488.700 |
|
Unallocated Capital Employed |
3613.100 |
2241.600 |
3613.100 |
|
Total Capital
Employed in Company |
122101.800 |
121127.100 |
122101.800 |
CONTINGENT
LIABILITIES:
(Rs. in million)
|
PARTICULARS |
31.03.2015 |
31.03.2014 |
|
Contingent
Liabilities and Commitments (to the extent not provided for) |
|
|
|
i Claim against the
company not acknowledged as debts – |
|
|
|
A Claim made by M/s. Chokhani International Ltd. towards dry dock expenses pending before High Court, Chennai |
466.200 |
444.300 |
|
B Cargo Loss, Freight, Demurrage, Slot Payments, Fuel Cost, other operational claims and Custom duty disputed demand. (As certified by the Management) |
508.300 |
592.700 |
|
C Disputed demand
of Statutory Dues (As certified by the Management) |
1897.200 |
1851.800 |
|
a) Income Tax & Sales Tax |
1897.000 |
1851.200 |
|
b) Service Tax |
0.200 |
0.200 |
|
ii Guarantees given
by the Banks |
|
|
|
on behalf of the Company |
474.500 |
421.600 |
|
on behalf of the Joint Venture to the extent of the Company’s share. |
673.500 |
645.800 |
|
iii Undertaking cum Indemnity given by Company |
0.000 |
100.000 |
|
iv Cargo Claims covered by P&I Club |
839.600 |
34.600 |
|
v Bonds/Undertakings given by the Company to Customs Authorities. |
2563.500 |
1767.700 |
|
vi Corporate Guarantees/Undertakings |
|
|
|
A In respect of Joint Ventures |
Not Ascertained |
Not Ascertained |
|
B Others |
582.000 |
545.700 |
|
Total |
9902.000 |
8255.600 |
FIXED ASSETS
- Fleet
- Ownership
- Containers
- Freehold Land
- Buildings
- Ownership Flats and Residential
- Buildings
CMT REPORT (Corruption, Money Laundering & Terrorism]
The Public Notice information has been collected from various sources
including but not limited to: The Courts,
1] INFORMATION ON
DESIGNATED PARTY
No exist designating subject or any of its beneficial owners,
controlling shareholders or senior officers as terrorist or terrorist
organization or whom notice had been received that all financial transactions
involving their assets have been blocked or convicted, found guilty or against
whom a judgement or order had been entered in a proceedings for violating
money-laundering, anti-corruption or bribery or international economic or
anti-terrorism sanction laws or whose assets were seized, blocked, frozen or
ordered forfeited for violation of money laundering or international
anti-terrorism laws.
2] Court Declaration :
No exist to suggest that subject is or was
the subject of any formal or informal allegations, prosecutions or other
official proceeding for making any prohibited payments or other improper
payments to government officials for engaging in prohibited transactions or
with designated parties.
3] Asset Declaration :
No records exist to suggest that the property or assets of the subject
are derived from criminal conduct or a prohibited transaction.
4] Record on Financial
Crime :
Charges or conviction
registered against subject: None
5] Records on Violation of
Anti-Corruption Laws :
Charges or
investigation registered against subject: None
6] Records on Int’l
Anti-Money Laundering Laws/Standards :
Charges or
investigation registered against subject: None
7] Criminal Records
No
available information exist that suggest that subject or any of its principals
have been formally charged or convicted by a competent governmental authority
for any financial crime or under any formal investigation by a competent
government authority for any violation of anti-corruption laws or international
anti-money laundering laws or standard.
8] Affiliation with
Government :
No record
exists to suggest that any director or indirect owners, controlling
shareholders, director, officer or employee of the company is a government
official or a family member or close business associate of a Government official.
9] Compensation Package :
Our market
survey revealed that the amount of compensation sought by the subject is fair
and reasonable and comparable to compensation paid to others for similar
services.
10] Press Report :
No press reports / filings exists on
the subject.
CORPORATE GOVERNANCE
MIRA INFORM as part of its Due Diligence do provide comments on
Corporate Governance to identify management and governance. These factors often
have been predictive and in some cases have created vulnerabilities to credit
deterioration.
Our Governance Assessment focuses principally on the interactions
between a company’s management, its Board of Directors, Shareholders and other
financial stakeholders.
CONTRAVENTION
Subject is not known to have contravened any existing local laws,
regulations or policies that prohibit, restrict or otherwise affect the terms
and conditions that could be included in the agreement with the subject.
FOREIGN EXCHANGE RATES
|
Currency |
Unit
|
Indian Rupees |
|
US Dollar |
1 |
Rs.66.32 |
|
|
1 |
Rs.98.98 |
|
Euro |
1 |
Rs.72.13 |
INFORMATION DETAILS
|
Information
Gathered by : |
PRP |
|
|
|
|
Analysis Done by
: |
AMT |
|
|
|
|
Report Prepared
by : |
SUJ / JTY K |
SCORE & RATING EXPLANATIONS
|
SCORE FACTORS |
RANGE |
POINTS |
|
HISTORY |
1~10 |
7 |
|
PAID-UP CAPITAL |
1~10 |
7 |
|
OPERATING SCALE |
1~10 |
8 |
|
FINANCIAL
CONDITION |
|
|
|
--BUSINESS SCALE |
1~10 |
7 |
|
--PROFITABILITY |
1~10 |
6 |
|
--LIQUIDITY |
1~10 |
6 |
|
--LEVERAGE |
1~10 |
6 |
|
--RESERVES |
1~10 |
8 |
|
--CREDIT LINES |
1~10 |
7 |
|
--MARGINS |
-5~5 |
-- |
|
DEMERIT POINTS |
|
|
|
--BANK CHARGES |
YES/NO |
YES |
|
--LITIGATION |
YES/NO |
YES |
|
--OTHER ADVERSE INFORMATION |
YES/NO |
NO |
|
MERIT POINTS |
|
|
|
--SOLE DISTRIBUTORSHIP |
YES/NO |
NO |
|
--EXPORT ACTIVITIES |
YES/NO |
NO |
|
--AFFILIATION |
YES/NO |
YES |
|
--LISTED |
YES/NO |
NO |
|
--OTHER MERIT FACTORS |
YES/NO |
YES |
|
DEFAULTER |
|
|
|
--RBI |
YES/NO |
NO |
|
--EPF |
YES/NO |
NO |
|
TOTAL |
|
62 |
This score serves as a reference to assess
SC’s credit risk and to set the amount of credit to be extended. It is
calculated from a composite of weighted scores obtained from each of the major sections
of this report. The assessed factors and their relative weights (as indicated
through %) are as follows:
Financial
condition (40%) Ownership
background (20%) Payment
record (10%)
Credit history
(10%) Market trend (10%) Operational size
(10%)
RATING EXPLANATIONS
|
RATING |
STATUS |
PROPOSED CREDIT LINE |
|
|
>86 |
Aaa |
Possesses an extremely sound financial base with the strongest
capability for timely payment of interest and principal sums |
Unlimited |
|
71-85 |
Aa |
Possesses adequate working capital. No caution needed for credit
transaction. It has above average (strong) capability for payment of interest
and principal sums |
Large |
|
56-70 |
A |
Financial & operational base are regarded healthy. General
unfavourable factors will not cause fatal effect. Satisfactory capability for
payment of interest and principal sums |
Fairly Large |
|
41-55 |
Ba |
Overall operation is considered normal. Capable to meet normal
commitments. |
Satisfactory |
|
26-40 |
B |
Capability to overcome financial difficulties seems comparatively
below average. |
Small |
|
11-25 |
Ca |
Adverse factors are apparent. Repayment of interest and principal sums
in default or expected to be in default upon maturity |
Limited with
full security |
|
<10 |
C |
Absolute credit risk exists. Caution needed to be exercised |
Credit not
recommended |
|
-- |
NB |
New Business |
-- |
This report is issued at your request without any
risk and responsibility on the part of MIRA INFORM PRIVATE LIMITED (MIPL) or
its officials.