MIRA INFORM REPORT
|
Report No. : |
356519 |
|
Report Date : |
25.12.2015 |
IDENTIFICATION DETAILS
|
Name : |
PARAME COLD STORAGE CO., LTD. |
|
|
|
|
Formerly Known As : |
PARAGON ARCTIC
COLD STORAGE CO.,
LTD. |
|
|
|
|
Registered Office : |
133 Moo 5, T. Fahham, A. Muang, Chiangmai 50000 |
|
|
|
|
Country : |
Thailand |
|
|
|
|
Financials (as on) : |
30.09.2014 |
|
|
|
|
Date of Incorporation : |
25.10.2002 |
|
|
|
|
Com. Reg. No.: |
0505545004101 |
|
|
|
|
Legal Form : |
Private
Limited Company |
|
|
|
|
Line of Business : |
The subject
is engaged in
providing cold storage
services for frozen
foods products with 24
hour service, as
well as importing
and distributing frozen
Mackerel. |
|
|
|
|
No. of Employee : |
12 |
RATING & COMMENTS
|
MIRA’s Rating : |
B |
|
RATING |
STATUS |
PROPOSED CREDIT LINE |
|
|
26-40 |
B |
Capability to overcome financial difficulties seems comparatively
below average. |
Small |
|
Status : |
Moderate |
|
|
|
|
Payment Behaviour : |
Slow but correct |
|
|
|
|
Litigation : |
Clear |
NOTES :
Any query related to this report can be made
on e-mail : infodept@mirainform.com
while quoting report number, name and date.
ECGC Country Risk Classification List – March 31, 2015
|
Country Name |
Previous Rating (31.12.2014) |
Current Rating (31.03.2015) |
|
Thailand |
B1 |
A2 |
|
Risk Category |
ECGC
Classification |
|
Insignificant |
A1 |
|
Low |
A2 |
|
Moderate |
B1 |
|
High |
B2 |
|
Very High |
C1 |
|
Restricted |
C2 |
|
Off-credit |
D |
THAILAND - ECONOMIC
OVERVIEW
With a well-developed infrastructure, a free-enterprise economy, and generally pro-investment policies Thailand has historically had a strong economy due in part to competitive industrial and agriculture exports - mostly electronics, agricultural commodities, automobiles and parts, and processed foods. The economy experienced slow growth and declining exports in 2014, in part due to domestic political turmoil and sluggish global demand. With full employment, Thailand attracts an estimated 2-4 million migrant workers from neighboring countries, and faces labor shortages. Following the May 2014 coup d'etat, tourism decreased 6-7% but is beginning to recover. The household debt to GDP ratio is over 80%. The Thai government in 2013 implemented a nation-wide 300 baht ($10) per day minimum wage policy and deployed new tax reforms designed to lower rates on middle-income earners. The Thai baht has remained stable.
|
Source
: CIA |
Company
name
PARAME COLD
STORAGE CO., LTD.
[FORMER :
PARAGON ARCTIC COLD
STORAGE CO., LTD.]
SUMMARY
BUSINESS ADDRESS : 133
MOO 5, T. FAHHAM,
A. MUANG,
CHIANGMAI 50000,
THAILAND
TELEPHONE
: [66] 53
241-600, 53 854-800,
089 700-4442
FAX :
[66] 53
241-700
E-MAIL ADDRESS : parame@paramegroup.com
REGISTRATION ADDRESS : SAME
AS BUSINESS ADDRESS
ESTABLISHED : 2002
REGISTRATION NO. : 0505545004101
TAX ID NO. : 3030760944
CAPITAL REGISTERED : BHT.
10,000,000
CAPITAL PAID-UP
: BHT.
10,000,000
SHAREHOLDER’S PROPORTION : THAI : 100%
FISCAL YEAR CLOSING DATE : SEPTEMBER 30
LEGAL STATUS : PRIVATE LIMITED
COMPANY
EXECUTIVE
: MS. NATCHA SURADITANGWARA, THAI
MANAGING DIRECTOR
NO. OF
STAFF : 12
LINES OF
BUSINESS : COLD
STORAGE SERVICE
CORPORATE PROFILE
OPERATING TREND : STABLE
PRESENT SITUATION : OPERATING NORMALLY
REPUTATION : FAIR
WITH NORMAL BUSINESS
ENGAGEMENT
MANAGEMENT STANDARD : MANAGEMENT WITH
FAIR PERFORMANCE
HISTORY
The subject
was established on
October 25, 2002
as a private limited
company under the originally
registered name “Thai Mark
Keeper Co., Ltd.” by
Thai group. On November 19, 2004, its
registered name was changed to “Parada Coldstorage Co.,
Ltd.”, and changed
to “Paragon Arctic
Cold Storage Co.,
Ltd.” on September
24, 2007. Eventually,
it was changed
to PARAME COLD STORAGE CO., LTD., on November 11, 2009.
Its business objective
is to provide
cold storage service,
as well as
import and distribute
frozen Mackerel. It
currently employs 12
staff.
The subject is a member of the Parame Group of companies,
with the core
business is logistics and
transportation services, mainly
for frozen food
products.
The subject’s
registered address is 133
Moo 5, T. Fahham, A. Muang,
Chiangmai 50000, and
this is the
subject’s current operation
address.
THE BOARD
OF DIRECTOR
|
Name |
|
Nationality |
Age |
|
|
|
|
|
|
Ms. Natcha
Suraditangwara |
|
Thai |
45 |
AUTHORIZED PERSON
The above director
signs on behalf
of the subject
with company’s affixed.
MANAGEMENT
Ms. Natcha
Suraditangwara
is the Managing
Director.
She is Thai
nationality with the
age of 45
years old.
BUSINESS OPERATIONS
The subject
is engaged in
providing cold storage
services for frozen
foods products with 24
hour service, as
well as importing
and distributing frozen
Mackerel.
Its facilities
are located in two Northern
provinces, comprising 5,200 square
meters of total
space with the
temperature of -18oC located in
Chiangmai province, and
1,465 square meters
of total space
with the temperature
of -18oC in
Phitsanuloke province.
PURCHASE
Most of the
products
are imported from
Indonesia, India, Republic
of China, Malaysia,
Vietnam, Myanmar, Oman,
Bangladesh and Pakistan,
the remaining is
purchased from local
suppliers.
SALES/SERVICES
100% of the
products is sold
and serviced locally
to wholesalers and
end-users.
RELATED AND
AFFILIATED COMPANIES
The Parame Group
consists of:
Parame Southern Co.,
Ltd.
Business Type :
Cold storage service
Parame Logistics Co.,
Ltd.
Business Type :
Logistics service
LITIGATION
Bankruptcy and Receivership
There are no
litigation on bankruptcy
and receivership cases
filed against the
subject found at
Legal Execution Department
for the past
five years.
Others
There are no
legal suits filed
against the subject
according for the
past two years.
CREDIT
Services are by
cash or on
the credits term
of 30-60 days.
Local bills are
paid by cash
or on the
credits term of
30-60 days.
Imports are by
L/C at sight
or T/T.
BANKING
Islamic Bank
of Thailand : Chiangmai Branch
EMPLOYMENT
The subject
currently employs 12 staff.
LOCATION DETAILS
The premise
is owned for
administrative office and
cold storage at
the heading address.
Premise is located
in the Northern
region.
Branches [Cold Storage]:
- 29/111 Singhawat
Road, T. Naimuang,
A. Muang, Phitsanuloke
65000
- 204/204 Moo 6,
T. Fahham, A. Muang, Chiangmai
50000
COMMENT
The subject
was formed in 2002 providing cold storage
service for frozen food products
as well as
importing and distributing
frozen Mackerel. The
subject reported a
moderate sales in
the previous year,
while its business
performance this year
is promising.
FINANCIAL INFORMATION
The capital
was registered at
Bht. 10,000,000 divided into 1,000 shares of Bht. 10,000 each
with fully paid.
THE SHAREHOLDERS
LISTED WERE
[as at January 30, 2014]
|
NAME |
HOLDING |
% |
|
|
|
|
|
Ms. Natcha
Suraditangwara Nationality: Thai Address : 133
Moo 5, T. Fahham,
A. Muang,
Chiangmai |
950 |
95.00 |
|
Mr. Ramin
Suraditangwara Nationality: Thai Address : 204/204
Moo 6, T. Fahham,
A. Muang,
Chiangmai |
40 |
4.00 |
|
Parame
Logistics Co., Ltd. Nationality: Thai Address : 133
Moo 5, T. Fahham,
A. Muang,
Chiangmai |
5 |
0.50 |
|
Sea Again Co.,
Ltd. Nationality: Thai Address : 148/31
Kallapapuek Road, Banghwa,
Pasicharoen, Bangkok |
4 |
0.40 |
|
Mr. Choeng Muangmai Nationality: Thai Address : 229
Moo 3, T.
Maefaek, A. Sansai,
Chiangmai |
1 |
0.10 |
Total
Shareholders : 5
Share Structure [as at January
30, 2014]
|
Nationality |
Shareholders |
No.
of Share |
% Shares |
|
|
|
|
|
|
Thai |
5 |
1,000 |
100.00 |
|
Foreign |
- |
- |
- |
|
Total |
5 |
1,000 |
100.00 |
NAME OF
AUDITOR & CERTIFIED
PUBLIC ACCOUNTANT NO.
Ms. Nalinrat
Thimcharas No. 7335
BALANCE
SHEET [BAHT]
The latest financial figures published as at
September 30, 2014,
2013 & 2012
were:
ASSETS
|
Current
Assets |
2014 |
2013 |
2012 |
|
|
|
|
|
|
Cash and Cash
Equivalents |
1,172,878.41 |
527,435.80 |
1,595,155.27 |
|
Trade Accounts & Other Receivable |
14,348,129.95 |
452,869.89 |
181,502.33 |
|
Inventories |
1,072,321.75 |
4,812,809.05 |
5,514,664.10 |
|
Withholding Income
Tax |
- |
231,063.52 |
102,272.58 |
|
|
|
|
|
|
Total Current Assets |
16,593,330.11 |
6,024,178.26 |
7,393,594.28 |
|
|
|
|
|
|
Cash at Bank pledged as a Collateral |
- |
- |
5,252,000.00 |
|
Fixed Assets |
39,001,109.79 |
40,376,337.18 |
41,129,201.70 |
|
Intangible Assets |
- |
- |
636,000.00 |
|
Total Assets |
55,594,439.90 |
46,400,515.44 |
54,410,795.98 |
LIABILITIES
& SHAREHOLDERS’ EQUITY [BAHT]
|
Current
Liabilities |
2014 |
2013 |
2012 |
|
|
|
|
|
|
Bank Overdraft & Short-term Loan From Financial
Institutions |
26,870,593.31 |
22,096,007.68 |
26,808,134.12 |
|
Current
Portion of Long-term Loans |
3,360,000.00 |
3,360,000.00 |
4,818,000.00 |
|
Trade Accounts & Other Payable |
13,765,712.34 |
6,587,412.94 |
8,344,693.90 |
|
|
|
|
|
|
Total Current Liabilities |
43,996,305.65 |
32,043,420.62 |
39,970,828.02 |
|
|
|
|
|
|
Long-term Loan from Financial
Institutions |
8,337,778.24 |
12,198,991.76 |
11,834,355.27 |
|
Total Liabilities |
52,334,083.89 |
44,242,412.38 |
51,805,183.29 |
|
|
|
|
|
|
Shareholders' Equity |
|
|
|
|
|
|
|
|
|
Share capital :
Baht 10,000 par
value authorized, and
issued share capital
1,000 shares |
10,000,000.00 |
10,000,000.00 |
10,000,000.00 |
|
|
|
|
|
|
Capital Paid |
10,000,000.00 |
10,000,000.00 |
10,000,000.00 |
|
Retained Earning
- Unappropriated [Deficit] |
[6,739,643.99] |
[7,841,896.94] |
[7,394,387.31] |
|
Total
Shareholders' Equity |
3,260,356.01 |
2,158,103.06 |
2,605,612.69 |
|
Total Liabilities
& Shareholders' Equity |
55,594,439.90 |
46,400,515.44 |
54,410,795.98 |
PROFIT &
LOSS ACCOUNT
|
Revenue |
2014 |
2013 |
2012 |
|
|
|
|
|
|
Sales & Services Income |
120,167,078.32 |
45,441,461.06 |
86,504,256.69 |
|
Other Income |
786.90 |
4,007.55 |
14,453.47 |
|
Total Revenues |
120,167,865.22 |
45,445,468.61 |
86,518,710.16 |
|
Expenses |
|
|
|
|
|
|
|
|
|
Cost of Goods
Sold & Service |
112,236,290.76 |
42,313,221.15 |
81,425,280.47 |
|
Administrative
Expenses |
1,498,848.13 |
1,568,539.51 |
1,383,018.00 |
|
Total Expenses |
113,735,138.89 |
43,881,760.66 |
82,808,298.47 |
|
|
|
|
|
|
Profit / [Loss]
before Financial Cost & Income
Tax |
6,432,726.33 |
1,563,707.95 |
3,710,411.69 |
|
Financial Cost |
[4,966,500.62] |
[2,011,217.58] |
[3,907,360.91] |
|
Profit / [Loss]
before Income Tax |
1,466,225.71 |
[447,509.63] |
[196,949.22] |
|
Income Tax |
[363,972.76] |
- |
- |
|
|
|
|
|
|
Net Profit / [Loss]
|
1,102,252.95 |
[447,509.63] |
[196,949.22] |
FINANCIAL ANALYSIS
|
ITEM |
UNIT |
2014 |
2013 |
2012 |
|
|
|
|
|
|
|
LIQUIDITY
RATIO |
|
|
|
|
|
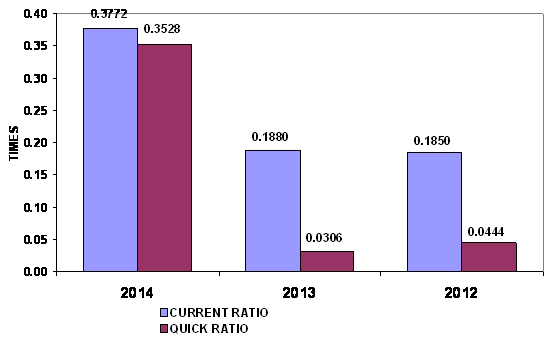
CURRENT RATIO |
TIMES |
0.38 |
0.19 |
0.18 |
|
QUICK RATIO |
TIMES |
0.35 |
0.03 |
0.04 |
|
|
|
|
|
|
|
ACTIVITY
RATIO |
|
|
|
|
|
FIXED ASSETS TURNOVER |
TIMES |
3.08 |
1.13 |
2.10 |
|
TOTAL ASSETS TURNOVER |
TIMES |
2.16 |
0.98 |
1.59 |
|
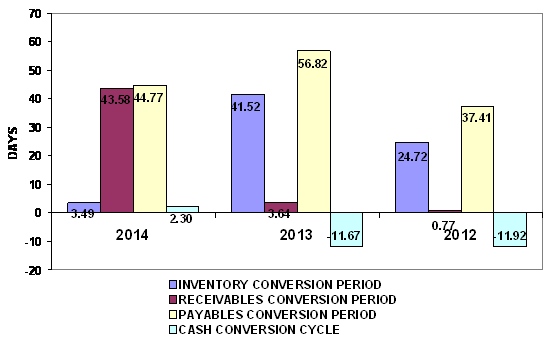
INVENTORY CONVERSION PERIOD |
DAYS |
3.49 |
41.52 |
24.72 |
|
INVENTORY TURNOVER |
TIMES |
104.67 |
8.79 |
14.77 |
|
RECEIVABLES CONVERSION PERIOD |
DAYS |
43.58 |
3.64 |
0.77 |
|
RECEIVABLES TURNOVER |
TIMES |
8.38 |
100.34 |
476.60 |
|
PAYABLES CONVERSION PERIOD |
DAYS |
44.77 |
56.82 |
37.41 |
|
CASH CONVERSION CYCLE |
DAYS |
2.30 |
(11.67) |
(11.92) |
|
|
|
|
|
|
|
PROFITABILITY
RATIO |
|
|
|
|
|
COST OF GOODS SOLD |
% |
93.40 |
93.12 |
94.13 |
|
SELLING & ADMINISTRATION |
% |
1.25 |
3.45 |
1.60 |
|
INTEREST |
% |
4.13 |
4.43 |
4.52 |
|
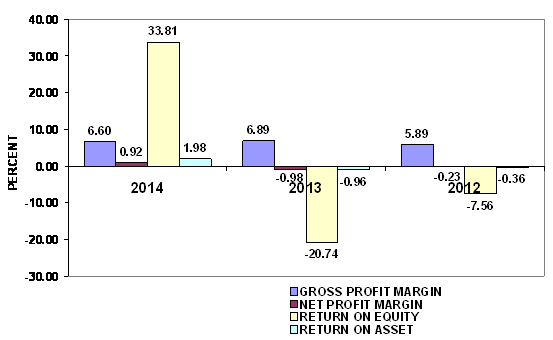
GROSS PROFIT MARGIN |
% |
6.60 |
6.89 |
5.89 |
|
NET PROFIT MARGIN BEFORE EX. ITEM |
% |
5.35 |
3.44 |
4.29 |
|
NET PROFIT MARGIN |
% |
0.92 |
(0.98) |
(0.23) |
|
RETURN ON EQUITY |
% |
33.81 |
(20.74) |
(7.56) |
|
RETURN ON ASSET |
% |
1.98 |
(0.96) |
(0.36) |
|
EARNING PER SHARE |
BAHT |
1,102.25 |
(447.51) |
(196.95) |
|
|
|
|
|
|
|
LEVERAGE
RATIO |
|
|
|
|
|
DEBT RATIO |
TIMES |
0.94 |
0.95 |
0.95 |
|
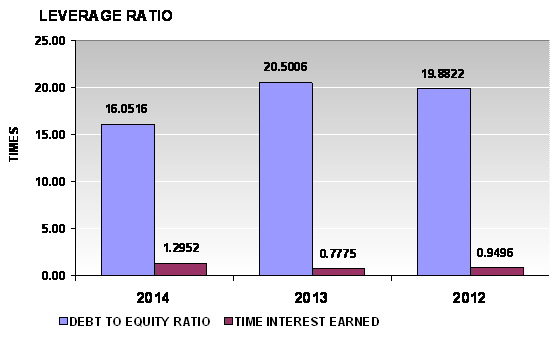
DEBT TO EQUITY RATIO |
TIMES |
16.05 |
20.50 |
19.88 |
|
TIME INTEREST EARNED |
TIMES |
1.30 |
0.78 |
0.95 |
|
|
|
|
|
|
|
ANNUAL
GROWTH |
|
|
|
|
|
SALES GROWTH |
% |
164.44 |
(47.47) |
|
|
OPERATING PROFIT |
% |
311.38 |
(57.86) |
|
|
NET PROFIT |
% |
346.31 |
(127.22) |
|
|
FIXED ASSETS |
% |
(3.41) |
(1.83) |
|
|
TOTAL ASSETS |
% |
19.81 |
(14.72) |
|
ANNUAL
GROWTH : IMPRESSIVE
An annual sales growth is 164.44%. Turnover has increased
from THB 45,441,461.06 in 2013 to THB 120,167,078.32 in 2014. While net profit
has increased from THB -447,509.63 in 2013 to THB 1,102,252.95 in 2014. And
total assets has increased from THB 46,400,515.44 in 2013 to THB 55,594,439.90
in 2014.
PROFITABILITY
: EXCELLENT
PROFITABILITY
RATIO
|
Gross Profit Margin |
6.60 |
Impressive |
Industrial
Average |
(4.48) |
|
Net Profit Margin |
0.92 |
Impressive |
Industrial
Average |
(1.09) |
|
Return on Assets |
1.98 |
Impressive |
Industrial
Average |
(2.71) |
|
Return on Equity |
33.81 |
Impressive |
Industrial
Average |
(16.20) |
Gross Profit Margin used to assess a firm's financial health
by revealing the proportion of money left over from revenues after accounting
for the cost of goods sold. Gross profit margin serves as the source for paying
additional expenses and future savings. The company’s figure is 6.6%. When compared with the industry
average, the ratio of the company was higher, indicated that company was more
profitable than the same industry.
Net Profit Margin is the indicator of the company's
efficiency in that net profit takes into consideration all expenses of the
company. A low profit margin indicates a low margin of safety, higher risk that
a decline in sales will erase profits and result in a net loss. The company’s
figure is 0.92%, higher figure when
compared with those of its average competitors in the same industry, indicated
that business was an efficient operator
in a dominant position within its industry.
Return on Assets measures how efficiently profits are being
generated from the assets employed in the business when compared with the
ratios of firms in a similar business. A low ratio in comparison with industry
averages indicates an inefficient use of business assets. Return on Assets ratio is 1.98%, higher figure when compared
with those of its average competitors in the same industry, indicated that
business was an efficient profit in a
dominant position within its industry.
Return on Equity indicates how profitable a company is by
comparing its net income to its average shareholders' equity, ROE measures how
much the shareholders earned for their investment in the company. Return on
Equity ratio is 33.81%, higher figure when compared with those of its average
competitors in the same industry, indicated that business was an efficient
profit in a dominant position within
its industry.
Trend
of the average competitors in the same industry for last 5 years
Return on Assets Downtrend
Return on Equity Downtrend
LIQUIDITY
: ACCEPTABLE
LIQUIDITY
RATIO
|
Current Ratio |
0.38 |
Risky |
Industrial
Average |
1.09 |
|
Quick Ratio |
0.35 |
|
|
|
|
Cash Conversion Cycle |
2.30 |
|
|
|
The Current Ratio is to ascertain whether a company's short-term
assets are readily available to pay off its short-term liabilities. The
company's figure is 0.38 times in 2014, increased from 0.19 times, then the
company may not be efficiently using its current assets. When compared with the
industry average, the ratio of the company was lower.
The Quick Ratio is a liquidity indicator that further
refines the current ratio by measuring the amount of the most liquid current
assets there are to cover current liabilities. The company's figure is 0.35
times in 2014, increased from 0.03 times, then the company has not enough
current assets that presumably can be quickly converted to cash for pay
financial obligations.
The Cash Conversion Cycle measures the number of days a
company's cash is tied up in the production and sales process of its operations
and the benefit from payment terms from its creditors. It meant the company
could survive when no cash inflow was received from sale for 3 days.
Trend
of the average competitors in the same industry for last 5 years
Current Ratio Uptrend
LEVERAGE
: ACCEPTABLE
LEVERAGE
RATIO
|
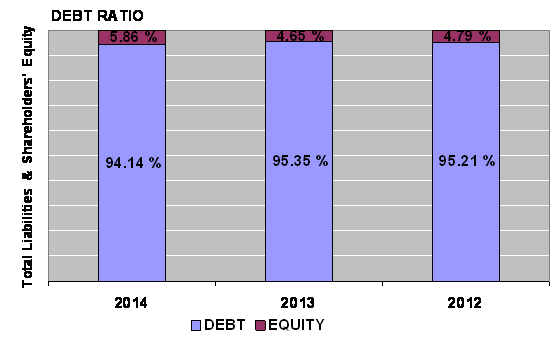
Debt Ratio |
0.94 |
Acceptable |
Industrial
Average |
0.89 |
|
Debt to Equity Ratio |
16.05 |
Risky |
Industrial
Average |
8.23 |
|
Times Interest Earned |
1.30 |
Impressive |
Industrial
Average |
- |
Debt to Equity Ratio a measurement of how much suppliers, lenders,
creditors and obligors have committed to the company versus what the
shareholders have committed. A higher the percentage means that the company is
using less equity and has stronger leverage position.
Times Interest Earned measuring a company's ability to meet
its debt obligations. Ratio is 1.3 higher than 1, so the company can pay
interest expenses on outstanding debt.
Debt Ratio shows the proportion of a company's assets which
are financed through debt. The company's figure is 0.94 greater than 0.5, most
of the company's assets are financed through debt.
Trend
of the average competitors in the same industry for last 5 years
Debt Ratio Uptrend
Times Interest Earned Stable
ACTIVITY
: IMPRESSIVE
ACTIVITY
RATIO
|
Fixed Assets Turnover |
3.08 |
Impressive |
Industrial
Average |
- |
|
Total Assets Turnover |
2.16 |
Satisfactory |
Industrial
Average |
2.48 |
|
Inventory Conversion Period |
3.49 |
|
|
|
|
Inventory Turnover |
104.67 |
Impressive |
Industrial
Average |
3.45 |
|
Receivables Conversion Period |
43.58 |
|
|
|
|
Receivables Turnover |
8.38 |
Impressive |
Industrial
Average |
5.18 |
|
Payables Conversion Period |
44.77 |
|
|
|
The company's Account Receivable Ratio is calculated as 8.38
and 100.34 in 2014 and 2013 respectively. This ratio measures the efficiency of
the company in managing its trade debtors to generate revenue. A lower ratio
may indicate over extension and collection problems. Conversely, a higher ratio
may indicate an overtly stringent policy. In this case, the company's A/R ratio
in 2014 decreased from 2013. This would suggest the company had deteriorated in
the management of its debt collections.
Inventory Turnover in Days Ratio indicates the liquidity of
inventory. It estimates the number of days that it will take to sell the
current inventory. Inventory is particularly sensitive to change in business
activities. The inventory turnover in days has decreased from 42 days at the
end of 2013 to 3 days at the end of 2014. This represents a positive trend. And
Inventory turnover has increased from 8.79 times in year 2013 to 104.67 times
in year 2014.
The company's Total Asset Turnover is calculated as 2.16
times and 0.98 times in 2014 and 2013 respectively. This ratio is determined by
dividing total assets into total sales turnover. The ratio measures the
activity of the assets and the ability of the firm to generate sales through
the use of the assets.
Trend
of the average competitors in the same industry for last 5 years
Fixed Assets Turnover Stable
Total Assets Turnover Downtrend
Inventory Turnover Downtrend
Receivables Turnover Uptrend
FOREIGN EXCHANGE RATES
|
Currency |
Unit
|
Indian Rupees |
|
US Dollar |
1 |
Rs.66.20 |
|
|
1 |
Rs.98.30 |
|
Euro |
1 |
Rs.72.41 |
|
THB |
1 |
Rs.1.83 |
Note :
Above are approximate rates obtained from sources believed to be correct
INFORMATION DETAILS
|
Analysis Done by
: |
HEE |
|
|
|
|
Report Prepared
by : |
TRU |
RATING EXPLANATIONS
|
RATING |
STATUS |
PROPOSED CREDIT LINE |
|
|
>86 |
Aaa |
Possesses an extremely sound financial base with the strongest
capability for timely payment of interest and principal sums |
Unlimited |
|
71-85 |
Aa |
Possesses adequate working capital. No caution needed for credit
transaction. It has above average (strong) capability for payment of interest
and principal sums |
Large |
|
56-70 |
A |
Financial & operational base are regarded healthy. General
unfavourable factors will not cause fatal effect. Satisfactory capability for
payment of interest and principal sums |
Fairly Large |
|
41-55 |
Ba |
Overall operation is considered normal. Capable to meet normal
commitments. |
Satisfactory |
|
26-40 |
B |
Capability to overcome financial difficulties seems comparatively below
average. |
Small |
|
11-25 |
Ca |
Adverse factors are apparent. Repayment of interest and principal sums
in default or expected to be in default upon maturity |
Limited with
full security |
|
<10 |
C |
Absolute credit risk exists. Caution needed to be exercised |
Credit not
recommended |
|
-- |
NB |
New Business |
-- |
This score serves as a reference to assess SC’s
credit risk and to set the amount of credit to be extended. It is calculated
from a composite of weighted scores obtained from each of the major sections of
this report. The assessed factors and their relative weights (as indicated
through %) are as follows:
Financial
condition (40%) Ownership
background (20%) Payment
record (10%)
Credit history
(10%) Market trend (10%) Operational size
(10%)
This report is issued at your request without any
risk and responsibility on the part of MIRA INFORM PRIVATE LIMITED (MIPL) or
its officials.