MIRA INFORM REPORT
|
Report No. : |
357391 |
|
Report Date : |
30.12.2015 |
IDENTIFICATION DETAILS
|
Name : |
SITI CABLE NETWORK LIMITED (w.e.f. 03.10.2012) |
|
|
|
|
Formerly Known
As : |
WIRE AND WIRELESS INDIA LIMITED |
|
|
|
|
Registered
Office : |
Continental Building, 135, Dr. Annie Besant Road, Worli, Mumbai –
400018, Maharashtra |
|
Tel. No.: |
91-120-4526700 |
|
|
|
|
Country : |
India |
|
|
|
|
Financials (as
on) : |
31.03.2015 |
|
|
|
|
Date of
Incorporation : |
24.03.2006 |
|
|
|
|
Com. Reg. No.: |
11-160733 |
|
|
|
|
Capital
Investment / Paid-up Capital : |
Rs.677.656 Million |
|
|
|
|
CIN No.: [Company Identification
No.] |
L64200MH2006PLC160733 |
|
|
|
|
IEC No.: |
0312058764 |
|
|
|
|
TAN No.: [Tax Deduction &
Collection Account No.] |
MUMW02947A |
|
|
|
|
PAN No.: [Permanent Account No.] |
AAACW6349M |
|
|
|
|
Legal Form : |
A Public Limited Liability Company. The Company’s Shares are Listed on
the Stock Exchanges. |
|
|
|
|
Line of Business
: |
Subject is engaged in distribution of television channels through analogue and digital cable distribution network, primary internet and allied services. (Registered activity) |
|
|
|
|
No. of Employees
: |
Information declined by the management |
RATING & COMMENTS
|
MIRA’s Rating : |
B (26) |
|
RATING |
STATUS |
PROPOSED CREDIT LINE |
|
|
26-40 |
B |
Capability to overcome financial difficulties seems comparatively
below average. |
Small |
|
Status : |
Moderate |
|
|
|
|
Payment Behaviour : |
Slow |
|
|
|
|
Litigation : |
Clear |
|
|
|
|
Comments : |
Siti Cable Network Limited (SCNL, earlier known as Wire and Wireless
Limited) is a part of the “Essel group”. Company is engaged in Distribution of
Television Channels through analogue and digital cable distribution network,
primary internet and allied services. The rating derive strength from the well-established promoters group
with a long track record in the media and entertainment industry and the
credit enhancement in the form of unconditional and irrevocable Corporate
Guarantee extended by Zee Entertainment Enterprise Limited to the lenders of
Siti Cable Network Limited. However, the above rating strengths are tempered by the volatile
nature of the main source of revenue which is sensitive to key economic
indicators and regulatory changes. Furthermore, the ratings also factor in
changing trends in the media sector, intense competition, and continued
losses in its business. However, business is active. Payments are reported to be slow. In view of well-established promoter group, the subject can be
considered for business dealings with some caution. |
NOTES :
Any query related to this report can be made
on e-mail : infodept@mirainform.com
while quoting report number, name and date.
EXTERNAL AGENCY RATING
|
Rating Agency Name |
CARE |
|
Rating |
Long-term Bank Facilities = AA (SO) (structured obligation) |
|
Rating Explanation |
High degree of safety and very low credit risk. |
|
Date |
September - 14 |
RBI DEFAULTERS’ LIST STATUS
Subject’s name is not enlisted as a defaulter
in the publicly available RBI Defaulters’ list.
EPF (Employee Provident Fund) DEFAULTERS’ LIST STATUS
Subject’s name is not enlisted as a defaulter
in the publicly available EPF (Employee Provident Fund) Defaulters’ list as of
31-03-2015.
INFORMATION DENIED BY
|
Name : |
Mr. Gushan Khandelwal |
|
Designation : |
Finance Department |
|
Contact No.: |
91-120-4526700 |
|
Date : |
28.12.2015 |
LOCATIONS
|
Registered Office : |
Continental Building, 135, Dr. Annie Besant Road, Worli, Mumbai –
400018, Maharashtra, India |
|
Tel. No.: |
91-22-24931930 |
|
Fax No.: |
91-22-24900302 / 24900213 |
|
E-Mail : |
|
|
Website : |
|
|
|
|
|
Corporate Office / Head Office: |
GYS Global, Tower A, 4th Floor, Sector – 125, Noida –
201301, Uttar Pradesh, India |
|
Tel. No.: |
91-120-4526700 |
|
|
|
|
Regional Office : |
Located at:
|
|
|
|
|
Overseas Office
: |
Located at:
|
DIRECTORS
As on 31.03.2015
|
Name : |
Mr. Brijendra Kumar Syngal |
|
Designation : |
Director |
|
Address : |
218, Mandakini Enclave, Alakananda, New Delhi - 110019, India |
|
Date of Appointment : |
05.12.2006 |
|
DIN No.: |
00002395 |
|
|
|
|
Name : |
Mr. Sureshkumar Phoolchand Agarwa |
|
Designation : |
Director |
|
Address : |
202, Lilou Ville, West Avenue,, Santacruz (West), Mumbai - 400054, Maharashtra, India |
|
Date of Appointment : |
01.06.2009 |
|
DIN No.: |
00773957 |
|
|
|
|
Name : |
Mr. Vinod Kumar Bakshi |
|
Designation : |
Director |
|
Address : |
102A, Court Green, Laburnum, Sushant Lok-I, Sector-28, Gurgaon - 122001, Haryana, India |
|
Date of Appointment : |
27.10.2010 |
|
DIN No.: |
00771934 |
|
|
|
|
Name : |
Mr. Vassdev Wadhwa |
|
Designation : |
Whole-Time Director |
|
Address : |
122 Third Floor, Jasola - 1, New Delhi - 110025, India |
|
Date of Appointment : |
12.08.2014 |
|
DIN No.: |
00439684 |
|
|
|
|
Name : |
Mrs. Kavita Anand Kapahi |
|
Designation : |
Director |
|
Address : |
91, Basant Apartments, Cuffe Parade, Mumbai - 400005, Maharashtra, India |
|
Date of Appointment : |
31.03.2015 |
|
DIN No.: |
02330706 |
KEY EXECUTIVES
|
Name : |
Mr. Gushan Khandelwal |
|
Designation : |
Finance Department |
|
|
|
|
Name : |
Mr. Suresh Kumar |
|
Designation : |
Secretary and Compliance Officer |
|
Address : |
I-127,Laxmi Nagar Extension, Delhi - 110092, India |
|
Date of Appointment : |
28.09.2010 |
|
PAN No.: |
AHGPK7016F |
|
|
|
|
Name : |
Mr. Vassdev Wadhwa |
|
Designation : |
Chief Executive Officer |
|
Address : |
122 Third Floor, Jasola - 1, New Delhi - 110025, India |
|
Date of Appointment : |
28.05.2014 |
|
PAN No.: |
AAAPW6798B |
|
|
|
|
Senior Management : |
|
|
Name : |
V. D.Wadhwa |
|
Designation : |
Executive Director and Chief Executive Officer |
|
|
|
|
Name : |
Vinay Chandhok |
|
Designation : |
Chief Operating Officer, Operations (Video) |
|
|
|
|
Name : |
Sanjeev Mahajan |
|
Designation : |
Chief Operating Officer, Operations (Broadband) |
|
|
|
|
Name : |
Anil Jain |
|
Designation : |
Head, Finance |
|
|
|
|
Name : |
Bibhash Jha |
|
Designation : |
Head, Content and Carriage |
|
|
|
|
Name : |
Anil Jhamb |
|
Designation : |
Chief Technology Officer, Broadband |
|
|
|
|
Name : |
Anil Malhotra |
|
Designation : |
Chief Operating Officer, Strategy and Compliances |
|
|
|
|
Name : |
Pankaj Dhingra |
|
Designation : |
Chief Human Resources Officer |
|
|
|
|
Name : |
Sanjay Jindal |
|
Designation : |
Head, Projects |
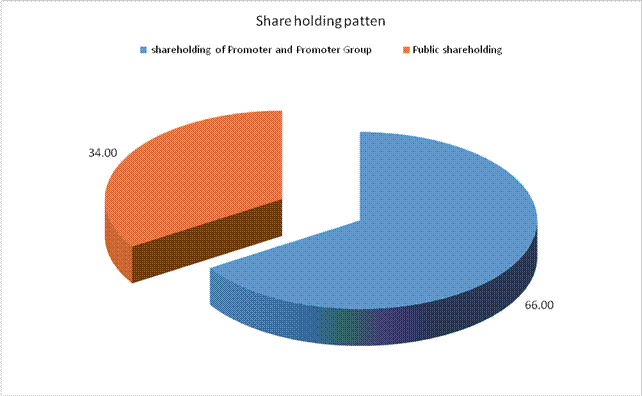
MAJOR SHAREHOLDERS / SHAREHOLDING PATTERN
As on 30.09.2015
|
Category of
Shareholder |
Total No. of
Shares |
Total
Shareholding as a % of Total No. of Shares |
|
|
||
|
(A)
Shareholding of Promoter and Promoter Group |
||
|
|
|
|
|
|
1021000 |
0.15 |
|
|
262040427 |
38.67 |
|
|
263061427 |
38.82 |
|
|
|
|
|
|
184181000 |
27.18 |
|
|
184181000 |
27.18 |
|
Total
shareholding of Promoter and Promoter Group (A) |
447242427 |
66.00 |
|
(B)
Public Shareholding |
||
|
|
|
|
|
|
51421793 |
7.59 |
|
|
104485 |
0.02 |
|
|
4001 |
0.00 |
|
|
94080182 |
13.88 |
|
|
145610461 |
21.49 |
|
|
|
|
|
|
18077251 |
2.67 |
|
|
|
|
|
|
41796724 |
6.17 |
|
|
17504279 |
2.58 |
|
|
7401993 |
1.09 |
|
|
75 |
0.00 |
|
|
7397190 |
1.09 |
|
|
4227 |
0.00 |
|
|
500 |
0.00 |
|
|
1 |
0.00 |
|
|
84780247 |
12.51 |
|
Total
Public shareholding (B) |
230390708 |
34.00 |
|
Total
(A)+(B) |
677633135 |
100.00 |
|
(C)
Shares held by Custodians and against which Depository Receipts have been
issued |
0 |
0.00 |
|
|
0 |
0.00 |
|
|
0 |
0.00 |
|
|
0 |
0.00 |
|
Total
(A)+(B)+(C) |
677633135 |
0.00 |
Shareholding of
securities (including shares, warrants, convertible securities) of persons
belonging to the category Promoter and Promoter Group
|
Sl.No. |
Name of the
Shareholder |
Details of
Shares held |
Encumbered
shares (*) |
Total shares
(including underlying shares assuming full conversion of warrants and
convertible securities) as a % of diluted share capital |
|||
|
No. of Shares
held |
As a % of grand
total (A)+(B)+(C) |
No |
As a percentage |
As a % of |
|||
|
1 |
Essel Media Ventures Ltd |
11,64,31,000 |
17.18 |
0 |
0.00 |
0.00 |
17.18 |
|
2 |
Direct Media Solutions Pvt Ltd |
8,87,50,000 |
13.10 |
73315000 |
82.61 |
10.82 |
13.10 |
|
3 |
Essel International Ltd |
6,77,50,000 |
10.00 |
0 |
0.00 |
0.00 |
10.00 |
|
4 |
Digital Satelite Holdings Pvt
Ltd |
6,15,69,898 |
9.09 |
48100000 |
78.12 |
7.10 |
9.09 |
|
5 |
Direct Media Solutions Pvt Ltd |
5,02,50,000 |
7.42 |
0 |
0.00 |
0.00 |
7.42 |
|
6 |
Bioscope Cinemas Pvt Ltd |
3,00,03,395 |
4.43 |
0 |
0.00 |
0.00 |
4.43 |
|
7 |
Bioscope Cinemas Pvt Ltd |
2,06,67,134 |
3.05 |
0 |
0.00 |
0.00 |
3.05 |
|
8 |
Digital Satelite Holdings Pvt
Ltd |
98,00,000 |
1.45 |
9552000 |
97.47 |
1.41 |
1.45 |
|
9 |
Ashok Mathai Kurien |
10,21,000 |
0.15 |
0 |
0.00 |
0.00 |
0.15 |
|
10 |
Direct Media Solutions Pvt Ltd |
10,00,000 |
0.15 |
0 |
0.00 |
0.00 |
0.15 |
|
|
Total |
44,72,42,427 |
66.00 |
130967000 |
29.28 |
19.33 |
66.00 |
Shareholding of securities
(including shares, warrants, convertible securities) of persons belonging to
the category Public and holding more than 1% of the total number of shares
|
Sl. No. |
Name of the Shareholder |
No. of Shares held |
Shares as % of Total No. of Shares |
Total shares (including underlying shares
assuming full conversion of warrants and convertible securities) as a % of
diluted share capital |
|
|
1 |
HDFC Trustee Company Ltd A/c
HDFC Equity Fund |
34609000 |
5.11 |
5.11 |
|
|
2 |
Polus Global Fund |
14949030 |
2.21 |
2.21 |
|
|
3 |
Morgan Stanley Asia
(Singapore) Pte |
24368347 |
3.60 |
3.60 |
|
|
4 |
Swiss Finance Corporation
(Mauritius) Ltd |
12708282 |
1.88 |
1.88 |
|
|
5 |
DSP Blackrock Micro Cap Fund |
11754575 |
1.73 |
1.73 |
|
|
6 |
Citigroup Global Markent
Mauritius Pvt Ltd |
7225119 |
1.07 |
1.07 |
|
|
|
Total |
105614353 |
15.59 |
15.59 |
Shareholding of
securities (including shares, warrants, convertible securities) of persons (together
with PAC) belonging to the category “Public” and holding more than 5% of the
total number of shares of the company
|
Sl. No. |
Name(s) of the shareholder(s) and the
Persons Acting in Concert (PAC) with them |
No. of Shares |
Shares as % of Total No. of Shares |
Total shares (including underlying shares
assuming full conversion of warrants and convertible securities) as a % of
diluted share capital |
|
|
1 |
HDFC Trustee Company Ltd A/C
HDFC Equity Fund |
34609000 |
5.11 |
5.11 |
|
|
|
Total |
34609000 |
5.11 |
5.11 |
BUSINESS DETAILS
|
Line of Business : |
Subject is engaged in distribution of television channels through analogue and digital cable distribution network, primary internet and allied services. (Registered activity) |
|
|
|
|
Products : |
Not Divulged |
|
|
|
|
Brand Names : |
Not Divulged |
|
|
|
|
Agencies Held : |
Not Divulged |
|
|
|
|
Exports : |
Not Divulged |
|
|
|
|
Imports : |
Not Divulged |
|
|
|
|
Terms : |
Not Divulged |
PRODUCTION STATUS NOT AVAILABLE
GENERAL INFORMATION
|
Suppliers : |
|
|||||||||||||||||||||||||||||||||
|
|
|
|||||||||||||||||||||||||||||||||
|
Customers : |
|
|||||||||||||||||||||||||||||||||
|
|
|
|||||||||||||||||||||||||||||||||
|
No. of Employees : |
Information declined by the management |
|||||||||||||||||||||||||||||||||
|
|
|
|||||||||||||||||||||||||||||||||
|
Bankers : |
|
|||||||||||||||||||||||||||||||||
|
|
|
|||||||||||||||||||||||||||||||||
|
Facilities : |
|
|||||||||||||||||||||||||||||||||
|
Auditors : |
|
|
Name : |
Walker, Chandiok and Company LLP (Formerly Walker Chandiok and Company) Chartered Accountants |
|
Address : |
Office At L-41, Connaught, Circus, New Delhi - 110001, India |
|
|
|
|
Offices : |
Located at :
|
|
|
|
|
Memberships : |
Not Available |
|
|
|
|
Collaborators : |
Not Available |
|
|
|
|
Subsidiaries : |
|
|
|
|
|
Associate company : |
Siti Chhattisgarh Multimedia Private Limited (Associate of Siti Bhatia Network Entertainment Private Limited) |
|
|
|
|
Enterprises owned
or significantly influenced by key management personnel or their relatives : |
|
CAPITAL STRUCTURE
As on 31.03.2015
Authorised Capital :
|
No. of Shares |
Type |
Value |
Amount |
|
|
|
|
|
|
1000000000 |
Equity Shares |
Re. 1/- each |
Rs. 1000.000 million |
|
10000000 |
Preference Shares |
Re. 1/- each |
Rs. 10.000
million |
|
|
Total |
|
Rs. 1010.000
million |
Issued Capital:
|
No. of Shares |
Type |
Value |
Amount |
|
|
|
|
|
|
678860258 |
Equity Shares |
Re. 1/- each |
Rs. 378.860 million |
|
|
Less:- Forfeiture Shares 1227122 Equity shares of Re. 1/- each |
|
Rs. 1.230 million |
|
23436 |
Preference Shares |
Re. 1/- each |
Rs. 0.020 million |
|
|
|
|
|
|
|
Total |
|
Rs. 677.650 million |
Subscribed & Paid-up Capital:
|
No. of Shares |
Type |
Value |
Amount |
|
|
|
|
|
|
Subscribed and Paid
up Capital |
|
|
|
|
|
|
|
|
|
677633135 |
Equity Shares |
Re. 1/- each |
Rs. 677.630 million |
|
23436 |
Preference Shares |
Re. 1/- each |
Rs. 0.020 million |
|
|
Shares Forfeiture Account |
|
Rs. 0.620 million |
|
|
|
|
|
|
|
Total |
|
Rs. 678.270 million |
(a) Reconciliation of
the shares outstanding at the beginning and at the end of the reporting period
|
Equity Shares |
31.03.2015 |
|
|
No of shares |
Rs. in million |
|
|
Outstanding at the beginning of the year |
520712915 |
520.710 |
|
Add: |
|
|
|
Issued on conversion of share warrants |
93500000 |
93.500 |
|
Issued during the year |
63174540 |
63.170 |
|
Issued on exercise of employee stock options |
245680 |
0.250 |
|
Outstanding at the
end of the year |
677633135 |
677.630 |
Preference shares
There is no movement in preference share capital in current year and previous year.
(b) Terms/ rights attached
to equity shares
The Company has only one class of equity shares having par value of Rs.1 per share. Each holder of equity shares is entitled to one vote per share.
In the event of liquidation of the Company, the holders of equity shares will be entitled to receive remaining assets of the Company, after distribution of all preferential amounts. The distribution will be in proportion to the number of equity shares held by the shareholders.
(c) Terms/ rights
attached to preference shares
The Company has only one class of 7.25% Noncumulative redeemable preference shares of Rs.1 each. The said preference shares were allotted to Zee Telefilms Limited (now Zee Entertainment Enterprises Limited) on December 29, 2006, pursuant to the scheme of arrangement for demerger of cable business undertaking of Zee Telefilms Limited approved by the Hon’ble Bombay High Court vide its order dated November 17, 2006. Initially, as per the terms of the issue and allotment, the said preference shares were due for redemption on December 29,
2008. However, with the written consent/approval of Zee Entertainment Enterprises Limited, the terms of the issue of said preference shares was varied by extending the period of redemption by another three years i.e. till December 29, 2011. Later on June 6, 2011 these shares were transferred to Churu Enterprises LLP by Zee Entertainment Enterprises Limited. Period for redemption of preference shares has been extended by another period of five years till December 29, 2016 by Churu Enterprises LLP. The preference shares are redeemable at par. In the event of liquidation of the Company before redemption of preference shares, the holders of preference shares will have priority over equity shares in the payment of dividend and repayment of capital.
Details of
shareholders holding more than 5% shares in the company
|
Particulars |
31.03.2015 |
|
|
No of shares |
Rs. in million |
|
|
Churu Enterprises LLP |
23436 |
100% |
|
Equity shares |
31.03.2015 |
|
|
No of shares |
% of Holding |
|
|
Bioscope Cinemas Private Limited |
50,670,529 |
7.48% |
|
Direct Media Solutions Private Limited |
140,000,000 |
20.66% |
|
Essel International Limited |
67,750,000 |
10.00% |
|
Essel Media Ventures Limited |
67,750,000 |
17.18% |
|
Digital Satellite Holdings Private Limited |
71,369,898 |
10.53% |
(e) Shares reserved
for issue under options
For details of shares reserved for issue under the employee stock option plan (ESOP) of the Company, refer note 32.
(f) Terms of securities
convertible into equity shares issued along with earliest date of conversion.
During the year ended March 31, 2013, the Company issued 162,000,000 convertible warrants on preferential basis upon payment of a consideration of Rs. 20 per warrant. Each convertible warrant was convertible into one equity share of Rs.1 each at a premium of Rs.19 per share. Holders of such warrants had the option to convert these warrants into equity shares upon payment of aforesaid consideration on or before eighteen months from the date of allotment of warrants, viz. March 19, 2013. During the year ended March 31, 2014 and March 31, 2015, 68,500,000 and 93,500,000 equity shares respectively have been allotted pursuant to the exercise of option.
(g) No shares have been issued for consideration other than cash or as bonus shares in the current reporting year and in last five years immediately preceeding the current reporting year.
FINANCIAL DATA
[all figures are
in Rupees Million]
ABRIDGED
BALANCE SHEET
|
SOURCES
OF FUNDS |
31.03.2015 |
31.03.2014 |
31.03.2013 |
|
|
|
|
|
|
I.
EQUITY AND LIABILITIES |
|
|
|
|
(1)Shareholders' Funds |
|
|
|
|
(a) Share Capital |
678.270 |
521.350 |
452.850 |
|
(b) Reserves & Surplus |
1087.060 |
(1587.530) |
(1844.890) |
|
(c) Money received against
share warrants |
0.000 |
1870.000 |
810.000 |
|
|
|
|
|
|
(2) Share Application money
pending allotment |
0.000 |
0.000 |
0.000 |
|
Total
Shareholders’ Funds (1) + (2) |
1765.330 |
803.820 |
(582.040) |
|
|
|
|
|
|
(3) Non-Current Liabilities |
|
|
|
|
(a) long-term borrowings |
9022.460 |
10351.640 |
7689.190 |
|
(b) Deferred tax liabilities
(Net) |
0.000 |
0.000 |
0.000 |
|
(c) Other long term
liabilities |
761.300 |
368.330 |
797.350 |
|
(d) long-term provisions |
32.470 |
25.320 |
22.580 |
|
Total
Non-current Liabilities (3) |
9816.230 |
10745.290 |
8509.120 |
|
|
|
|
|
|
(4) Current Liabilities |
|
|
|
|
(a) Short term borrowings |
344.100 |
473.870 |
244.850 |
|
(b) Trade payables |
2197.970 |
1562.800 |
1355.990 |
|
(c) Other current liabilities |
5472.640 |
2083.500 |
1406.970 |
|
(d) Short-term provisions |
1.170 |
1.100 |
0.570 |
|
Total
Current Liabilities (4) |
8015.880 |
4121.270 |
3008.380 |
|
|
|
|
|
|
TOTAL |
19597.440 |
15670.380 |
10935.460 |
|
|
|
|
|
|
II.
ASSETS |
|
|
|
|
(1) Non-current assets |
|
|
|
|
(a) Fixed Assets |
|
|
|
|
(i) Tangible assets |
3993.560 |
3248.460 |
2667.470 |
|
(ii) Intangible Assets |
626.670 |
253.250 |
217.110 |
|
(iii) Capital work-in-progress |
1307.920 |
1054.670 |
534.630 |
|
(iv) Intangible assets under
development |
0.000 |
0.000 |
0.000 |
|
(b) Non-current Investments |
2480.770 |
230.510 |
230.460 |
|
(c) Deferred tax assets (net) |
0.000 |
0.000 |
0.000 |
|
(d) Long-term Loan and Advances |
1077.110 |
2840.170 |
2904.350 |
|
(e) Other Non-current assets |
627.490 |
471.630 |
593.750 |
|
Total
Non-Current Assets |
10113.520 |
8098.690 |
7147.770 |
|
|
|
|
|
|
(2) Current assets |
|
|
|
|
(a) Current investments |
8.040 |
8.040 |
8.040 |
|
(b) Inventories |
103.290 |
59.880 |
47.220 |
|
(c) Trade receivables |
3511.850 |
2980.410 |
1672.740 |
|
(d) Cash and cash equivalents |
3940.010 |
3266.570 |
1102.720 |
|
(e) Short-term loans and advances |
1836.400 |
1098.210 |
917.730 |
|
(f) Other current assets |
84.330 |
158.580 |
39.240 |
|
Total
Current Assets |
9483.920 |
7571.690 |
3787.690 |
|
|
|
|
|
|
TOTAL |
19597.440 |
15670.380 |
10935.460 |
PROFIT
& LOSS ACCOUNT
|
|
PARTICULARS |
31.03.2015 |
31.03.2014 |
31.03.2013 |
|
|
SALES |
|
|
|
|
|
Revenue from Operations |
5991.550 |
5048.950 |
4160.120 |
|
|
Other Income |
141.610 |
116.980 |
132.530 |
|
|
TOTAL
(A) |
6133.160 |
5165.930 |
4292.650 |
|
|
|
|
|
|
|
Less |
EXPENSES |
|
|
|
|
|
Cost of Materials Consumed |
2.590 |
23.470 |
9.680 |
|
|
Purchases of Stock-in-Trade |
294.820 |
665.590 |
991.070 |
|
|
Changes in inventories of
finished goods, work-in-progress and Stock-in-Trade |
3327.030 |
2133.380 |
6.340 |
|
|
Carriage sharing, pay channel
and related costs |
0.000 |
0.000 |
1579.010 |
|
|
Employees benefits expense |
365.060 |
272.790 |
231.650 |
|
|
Other expenses |
1379.980 |
1335.370 |
834.720 |
|
|
TOTAL
(B) |
5369.480 |
4430.600 |
3652.470 |
|
|
|
|
|
|
|
Less |
PROFIT/
(LOSS) BEFORE INTEREST, TAX,
DEPRECIATION AND AMORTISATION (C) |
763.680 |
735.330 |
640.180 |
|
|
|
|
|
|
|
Less |
FINANCIAL
EXPENSES (D) |
1197.870 |
1179.920 |
862.080 |
|
|
|
|
|
|
|
|
PROFIT
/ (LOSS) BEFORE TAX, DEPRECIATION AND AMORTISATION (C-D) (E) |
(434.190) |
(444.590) |
(221.900) |
|
|
|
|
|
|
|
Less/
Add |
DEPRECIATION/
AMORTISATION (F) |
743.380 |
578.500 |
396.510 |
|
|
|
|
|
|
|
|
PROFIT/ (LOSS) BEFORE
TAX (E-F) (G) |
(1177.570) |
(1023.090) |
(618.410) |
|
|
|
|
|
|
|
Less |
TAX (H) |
0.000 |
0.000 |
0.000 |
|
|
|
|
|
|
|
|
PROFIT/ (LOSS)
AFTER TAX (G-H) (I) |
(1177.570) |
(1023.090) |
(618.410) |
|
|
|
|
|
|
|
|
EARNINGS
IN FOREIGN CURRENCY |
|
|
|
|
|
Carriage income |
18.260 |
16.540 |
15.810 |
|
|
TOTAL
EARNINGS |
18.260 |
16.540 |
15.810 |
|
|
|
|
|
|
|
|
IMPORTS |
|
|
|
|
|
Plant and machinery |
125.530 |
0.000 |
24.700 |
|
|
Set top boxes and viewing
cards |
1390.590 |
1107.050 |
2273.910 |
|
|
Components and Stores parts |
0.000 |
3.400 |
3.010 |
|
|
Software |
80.850 |
0.000 |
0.000 |
|
|
TOTAL
IMPORTS |
1596.970 |
1110.450 |
2301.620 |
|
|
|
|
|
|
|
|
Earnings
/ (Loss) Per Share (Rs.) |
(1.91) |
(2.26) |
(1.37) |
CURRENT MATURITIES OF LONG TERM DEBT DETAILS
|
Particulars |
31.03.2015 |
31.03.2014 |
31.03.2013 |
|
Current Maturities of Long term debt |
4107.320 |
1664.250 |
1063.510 |
|
Cash generated from operations |
1696.450 |
(2557.970) |
454.560 |
|
Net cash flow from operating activity |
1716.370 |
(2708.930) |
417.980 |
QUARTERLY RESULTS
|
Particulars |
30.06.2015 1st Quarter |
30.09.2015 2nd Quarter |
|
|
|
|
|
Audited / Unaudited |
Unaudited |
Unaudited |
|
Net Sales |
1482.280 |
1520.080 |
|
Total Expenditure |
1364.330 |
1360.650 |
|
PBIDT (Excl OI) |
117.950 |
159.430 |
|
Other Income |
70.050 |
80.620 |
|
Operating Profit |
188.000 |
240.050 |
|
Interest |
333.230 |
337.310 |
|
Exceptional Items |
(21.760) |
NA |
|
PBDT |
(166.990) |
(97.260) |
|
Depreciation |
201.330 |
214.490 |
|
Profit Before Tax |
(368.320) |
(311.750) |
|
Tax |
NA |
NA |
|
Provisions and contingencies |
NA |
NA |
|
Profit After Tax |
(368.320) |
(311.750) |
|
Extraordinary Items |
NA |
NA |
|
Prior Period Expenses |
NA |
NA |
|
Other Adjustments |
NA |
NA |
|
Net Profit |
(368.320) |
(311.750) |
KEY
RATIOS
|
PARTICULARS |
|
31.03.2015 |
31.03.2014 |
31.03.2013 |
|
Net Profit Margin (PAT / Sales) |
(%) |
(19.65) |
(20.26) |
(14.87) |
|
|
|
|
|
|
|
Operating Profit Margin (PBIDT/Sales) |
(%) |
12.75 |
14.56 |
15.39 |
|
|
|
|
|
|
|
Return on Total Assets (PBT/Total Assets} |
(%) |
(7.45) |
(7.11) |
(6.08) |
|
|
|
|
|
|
|
Return on Investment (ROI) (PBT/Networth) |
|
(0.67) |
(1.27) |
1.06 |
|
|
|
|
|
|
|
Debt Equity Ratio (Total Debt /Networth) |
|
7.63 |
15.54 |
(15.46) |
|
|
|
|
|
|
|
Current Ratio (Current Asset/Current Liability) |
|
1.18 |
1.84 |
1.26 |
STOCK
PRICES
|
Face Value |
Rs.1.00/- |
|
Market Value |
Rs.34.40/- |
FINANCIAL ANALYSIS
[all figures are
in Rupees Million]
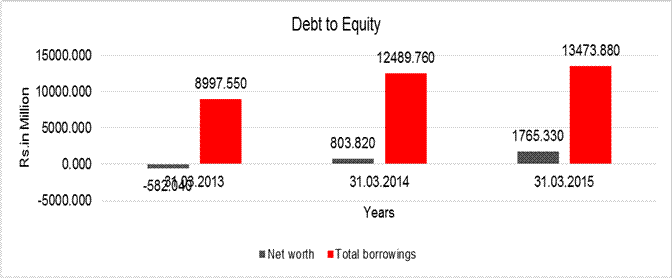
DEBT EQUITY RATIO
|
Particular |
31.03.2013 |
31.03.2014 |
31.03.2015 |
|
|
(Rs.
In Million) |
(Rs.
In Million) |
(Rs.
In Million) |
|
Share Capital |
452.850 |
521.350 |
678.270 |
|
Reserves & Surplus |
(1844.890) |
(1587.530) |
1087.060 |
|
Money received against share
warrants |
810.000 |
1870.000 |
0.000 |
|
Net
worth |
(582.040) |
803.820 |
1765.330 |
|
|
|
|
|
|
long-term borrowings |
7689.190 |
10351.640 |
9022.460 |
|
Short term borrowings |
244.850 |
473.870 |
344.100 |
|
Current Maturities Of
Long-Term Debts |
1063.510 |
1664.250 |
4107.320 |
|
Total
borrowings |
8997.550 |
12489.760 |
13473.880 |
|
Debt/Equity
ratio |
(15.459) |
15.538 |
7.632 |
YEAR-ON-YEAR GROWTH
|
Year
on Year Growth |
31.03.2013 |
31.03.2014 |
31.03.2015 |
|
|
(Rs.
In Million) |
(Rs.
In Million) |
(Rs.
In Million) |
|
Sales |
4160.120 |
5048.950 |
5991.550 |
|
|
|
21.365 |
18.669 |
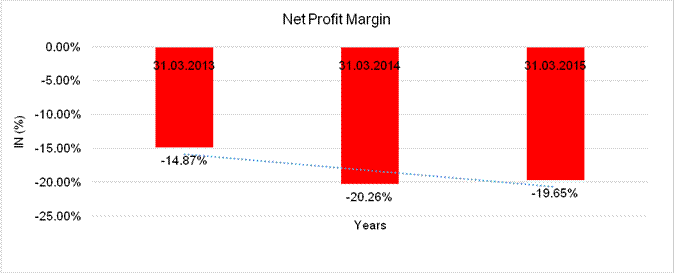
NET PROFIT MARGIN
|
Net
Profit Margin |
31.03.2013 |
31.03.2014 |
31.03.2015 |
|
|
(Rs.
In Million) |
(Rs.
In Million) |
(Rs.
In Million) |
|
Sales |
4160.120 |
5048.950 |
5991.550 |
|
Profit |
(618.410) |
(1023.090) |
(1177.570) |
|
|
(14.87%) |
(20.26%) |
(19.65%) |
LOCAL AGENCY FURTHER INFORMATION
|
Sr. No. |
Check list by
info agents |
Available in
Report (Yes/No) |
|
1 |
Year of establishment |
Yes |
|
2 |
Constitution of the entity -Incorporation
details |
Yes |
|
3 |
Locality of the entity |
Yes |
|
4 |
Premises details |
No |
|
5 |
Buyer visit details |
-- |
|
6 |
Contact numbers |
Yes |
|
7 |
Name of the person contacted |
Yes |
|
8 |
Designation of contact person |
Yes |
|
9 |
Promoter’s background |
Yes |
|
10 |
Date of Birth of Proprietor / Partners /
Directors |
Yes |
|
11 |
Pan Card No. of Proprietor / Partners |
No |
|
12 |
Voter Id Card No. of Proprietor / Partners |
No |
|
13 |
Type of business |
Yes |
|
14 |
Line of Business |
Yes |
|
15 |
Export/import details (if applicable) |
No |
|
16 |
No. of employees |
No |
|
17 |
Details of sister concerns |
Yes |
|
18 |
Major suppliers |
No |
|
19 |
Major customers |
No |
|
20 |
Banking Details |
Yes |
|
21 |
Banking facility details |
Yes |
|
22 |
Conduct of the banking account |
-- |
|
23 |
Financials, if provided |
Yes |
|
24 |
Capital in the business |
Yes |
|
25 |
Last accounts filed at ROC, if applicable |
Yes |
|
26 |
Turnover of firm for last three years |
Yes |
|
27 |
Reasons for variation <> 20% |
-- |
|
28 |
Estimation for coming financial year |
No |
|
29 |
Profitability for last three years |
Yes |
|
30 |
Major shareholders, if available |
Yes |
|
31 |
External Agency Rating, if available |
Yes |
|
32 |
Litigations that the firm/promoter
involved in |
-- |
|
33 |
Market information |
-- |
|
34 |
Payments terms |
No |
|
35 |
Negative Reporting by Auditors in the
Annual Report |
No |
BUSINESS OVERVIEW
The year started with the promise of digitization in Phase 3 areas and they were fully geared up to ensure that Subject was well placed to gain significant market share in the process. Although, the digitization drive got slowed down due to the extension in the Phase 3 digitization deadline by the Government of India, they were able to successfully seed 1.23 million STBs proactively in Phase-3 areas and expand their reach from 60 cities to 130 cities across India. Overall Siti Cable managed to close the year with over 5 Million digital subscribers and expand their cable universe to 10.5 Million. They will continue to digitize the remaining analogue subscriber base and also expand in select strategic geographies to consolidate their presence.
The company made new forays into the broadband space and currently is offering broadband at speeds upto 100
Mbps on state of the art DOCSIS 2/3 Technology in Delhi/ NCR. The Company has chalked out plans to expand broadband operations on all India basis and identified new markets for expansion in the next twelve months to increase its current subscriber base significantly.
Subject continued to work closely with the Sector Regulator and maintain a high-focus on adherence to regulatory compliances, in order to minimize regulatory risk and provide the end customer a quality service experience. The company has also been at the forefront of bringing together leading MSOs for policy advocacy and establishing the All India Digital Cable Federation (AIDCF), which is the recognized industry body for the sector.
The industry continues to face an excessive tax burden in the form of both service tax and entertainment tax incidence, which is unhealthy considering it is the most popular and accessible medium of entertainment for the common man. There is a need to bring down the tax burden in line with other industries such as multiplexes and make cable a more affordable medium
Subject continues to monetize the business better and harness the inherent operational leverage that the business possesses. They worked with their LCO business associates to train and equip them with regards to the rapidly changing digital environment and serve the customer more effectively. They built durable relationships with leading content providers to ensure their subscribers get the best of content and value added services.
Subject, as part of the Essel Group is working in consonance with other group companies to ensure economies of scale and derive synergies in various aspects of the value chain such as STB procurement, content cost and shared services.
They felt the need to bring in fresh talent from customer facing industries in line with their renewed focus on the end consumer and transition to a B2C business and have inducted the same at Senior Management and Middle management levels for their foray into broadband business on all India basis and also to drive execution capabilities. At the same time, processes and systems were further refined and streamlined to ensure the organization remains agile as it scales up.
In terms of overall perspective, FY2014-15 was a year of unique differentiation for the Company. The Company’s consolidated revenue grew by 32% to INR 9370 million from INR 7103 million in 2014. Core Revenue, excluding other income and activation grew even faster at 37% YoY to reach INR 8435 million.
The EBITDA also grew 34% to INR 1684 million compared to INR 1259 million last years. EBITDA, excluding other income and activation grew by a significant 132% YoY to reach INR 749 million, testimony to the inherent execution capabilities of the company. As an impact of successful digitization in phase I and II as well as proactive seeding in Phase 3, Subscription revenue grew by 57% over last fiscal.Carriage revenue grew by 9.6% YoY and broadband revenue grew by 53% YoY due to conscious decision by Management to use multiple growth levers and diversify revenue streams. Capital expenditure shall continue to be high this year as they strive for market expansion and establish their digital footprint to transform their business to a sustainable perpetual annuity with tremendous operating leverage which will generate a steady cash flow.
They continue to pursue expansion of their digital cable and broadband business in the current year, so that they are able to provide the consumer the best of the content in a platform neutral manner. Their eventual aim is to become a triple play service provider.
MANAGEMENT DISCUSSION
AND ANALYSIS
ECONOMIC REVIEW
In 2014-15, the Indian economy witnessed the first green shoots of tangible recovery. The year saw perceptible improvement in business confidence, foreign inflows and stability of key macroeconomic indicators. GDP growth (at market prices) improved to 7.3% in 2014-15 compared to 6.9% in the previous year (Source: CSO). This was on the back of a stronger growth in the manufacturing and services sectors. India is a net importer of global commodities, such as crude and benefited from their steep global price correction. The commodity meltdown helped the Government and Reserve Bank of India (RBI) stabilise key macroeconomic indicators such as inflation, current account deficit and fiscal deficit, all of which had deviated from their desirable levels in the preceding years. With new policy initiatives, these are all now trending towards the desired levels. The commodity price correction is also expected to have a strong positive impact on savings and discretionary spending.
The Government, over the past year has taken several initiatives to create a strong foundation for a sustainable and inclusive growth. Some of these include the introduction of the GST Bill, the Pradhan Mantri Jan Dhan Yojna (PMJDY) to promote financial inclusion, the Smart Cities programme to facilitate urban renewal, and the Digital India campaign to drive a digitally empowered future. These and other initiatives are collectively expected to invite and incentivize domestic and foreign investments into India.
India’s strong demographic profile, large consumer base and fast growing middle class have attracted the interest of many global investors and multinational corporations. During 2014-15, a decisive government, and an improving macroeconomic and regulatory environment further enhanced their interest.
INDUSTRY REVIEW
Media and
Entertainment Industry
In the year 2014, the Indian Media and Entertainment (M and E) industry grew 11.7% and crossed Rs. 1 trillion, for the first time ever. TV, the largest segment in the M and E industry grew by a strong 13.8% to Rs. 475 billion. Digital Advertising (grew 44.5% to Rs. 43.5 billion) and Gaming (grew 22.4% to ` 23.5 billion) were the fastest growing segments during the year.
TV Industry
The TV industry has grown at a CAGR of 13% over the last 5 years and today forms over 46% of the M and E Industry. It is expected to grow by 14.3% to Rs. 543 billion in 2015. Over the 5 year period, between 2014 to 2019, the TV Industry is expected to have an even stronger CAGR of 15.5%. This is significantly higher than the projected overall M&E CAGR of 13.9% during the same period. Looked at another way, the TV industry is projected to add more revenue to the M&E industry going forward, than all other sub sectors put together.
Subscription revenue grew by 13.9% to Rs. 320 billion in 2014. Over the next five years (by 2019), it is expected to grow at a CAGR of 16.1% to Rs. 676 billion. Advertising revenue on the other hand grew by 13.9% during the year and is expected to grow at a CAGR of 14% to ` 299 billion by 2019. Subscription is expected to account for 71% of the total incremental increase projected in TV Industry revenue over the next five years, whereas the contribution of advertisement will be under 30%. In 2014, the overall TV penetration in India increased to 61% or 168 million households. India is the world’s second largest TV market after China.
INDUSTRY OUTLOOK
PAY TV: POTENTIAL USD
9-11 BILLION
INCREMENTAL ANNUAL
REVENUE OPPORTUNITY
OPPORTUNITY FOR EACH
OF TOP 3 MSOS
- The top 3 Indian MSOs together have over 35 million universe and can conservatively reach a 4-5 million potential broadband subscriber base.
- Cable reaches over 90 million households in India as compared to ~28 million households reached by wire line telephones, making it a much more potent medium for delivering broadband.
Digital technologies will continue to drive a high degree of convergence between entertainment, information and telecommunication. This will create a significantly enhanced viewership experience and will lead to new opportunities for all digital players in general and MSOs in particular. Digital cable, unlike most other technologies, allow two-way communication, have a localised nature of services and are more reliable, owing to the resilience of their infrastructure to harsh weather conditions.
India has one of the lowest pay television ARPU, globally. With the migration of existing analog subscribers to digital and the addition of new subscribers, the industry will witness greater transparency, subscriber oriented initiatives and a consistent increase in ARPU. ARPU growth will come from an increase in the base prices, healthy mix of package wise billing, increase in subscribers opting for value added services and also new due to launch of new services. Digitisation will also result in significant transfer of power and revenue share from LCOs to MSOs.
The broadband industry in India is at a very nascent stage. The percentage of users with over 4 Mbps connection as on December 2014, was 7.8% in India as compared to 27% in China, 88% in Japan and 95% in South Korea (Source: AKAMAI Q4 2014 Report). Only 1.5 users per 100 people in India use a wired broadband connection today. (Source: TRAI Q4 2014 Report)
Internet traffic in India is projected to grow 4.2x over the next 5 years to 3.0 Exabytes (EB) per month, while busy hour internet traffic is projected to grow to 5.6x over the same period. This growth is going to be led by significantly higher consumption of video traffic, which is projected to grow to 7x to 2.2 EB per month by 2019 compared to 326 PB in 2014. The total internet video traffic will increase to 74% of all internet traffic in 2019 compared to 46% in 2014. The Ultra HD, HD and SD will be 6.1%, 38.1% and 55.8% of internet video traffic in 2019, respectively, compared to 0.2%, 7.1%, 92.6%, respectively, in 2014. The internet-videoto- TV is projected to grow to 8x between 2014 and 2019. (Source: Cisco VNI Forecast)
The growth in data consumption will be supported by a growth in network speed. The average broadband speed is projected to grow by 2.9x to 11.6 Mbps between the years 2014 and 2019. In 2019, 46% of the fixed broadband connections will be faster than 5 Mbps as compared to 24% in 2014. Similarly 36% of the fixed broadband connections in 2019 will be faster than 10 Mbps compared to 11% in 2014. The internet traffic generated by an average internet household is projected to grow 3.4x to 40.8 GB in 2019 compared to 12.1 GB in 2014. The number of households generating more than 50 GB per month will grow 27x in 2019, or 27 million internet households, compared to 1 million households in 2014. (Source: Cisco VNI Forecast)
To tap the projected demand potential in the digital cable as well as the broadband segments, the Industry will need to keep up the pace of investments in infrastructure and network. In digital cable, this is likely to increase the pace of consolidation with the top MSOs controlling a major portion of the market share. With higher economies of scale, optimal use of modern technologies and better utilisation of the infrastructure, the industry is likely to witness significant improvement in its cost and capital efficiency parameters. (Source: FICCI KPMG Indian M&E 2015 Report)
COMPANY OVERVIEW
SITI Cable Network Limited (earlier known as Wire and Wireless (India) is one of India’s leading Multi System Operator (MSO). The Company is part of the USD 8 billion Essel Group that has a strong presence across the media industry and interests in infrastructure, education, packaging, precious metals, gaming, theme parks and health, lifestyle and wellness. The Group is one of the leading producers, content aggregators and distributors of Indian programming globally and has presence in over 169 countries. SITI Cable provides digital / analog cable TV and broadband services and has a subscriber base of over 10.5 million across India. Presently, the Company has 61 analog and 15 digital head ends and a network of more than 14,600 Kms of optical fibre and coaxial cable.
OPERATIONAL REVIEW
2014-15 was an important and successful year for SITI Cable. The total cable subscriber base was 10.5 million compared to 10 million in 2013-14. However, there was a significant increase in the digital subscriber base compared to 2013-14 – from 3.8 million to 5.38 million. They expanded their digital cable presence to 130 cities. Their internet subscriber base expanded to 70,100 at the end of the 2014-15, across 5 cities. This represents a nearly 80 per cent growth from the 38,600 subscribers they had at the beginning of the year.
During the year, they continued to expand their reach by entering into newer cities that were part of the Phase II rollout plan proposed by the Ministry of Information and Broadcasting (MIB). Together with this, they also carried out proactive seeding in cities and territories falling in Phase II and Phase III of the roll-out plan. They increased their focus towards monetising their existing infrastructure by bundling additional high margin services such as broadband and HD channels. As a result, their revenues grew by 32%, while EBITDA grew by 34% in 2014-15. Operating EBITDA grew even faster by 133.6% on a yearon- year basis, underscoring the increasing share of recurring revenue in the total.
OUTLOOK
During the last three years, they have aggressively invested to expand their reach across India. The inherent advantage of their business model enables us to leverage their existing infrastructure to offer dual play, viz. content and broadband, with very limited new investments. They will continue to invest in Digital Cable, DOCSIS 3.0 and EOC technologies to ensure they provide multiple options to the consumer to view content.
Viewers are rapidly shifting to non-linear content consumption, where the TV is one of the many platforms on which content is viewed. This is aided by the growing penetration of smart devices and internet enabled TVs. SITI Cable, through its high speed broadband services and other bundled VAS services is well positioned to suitably address this growing demand in its focus markets. Therefore, they shall be a platform for their customers to access the internet and television content from, anytime, anywhere. Their growth shall be aided by the inherent advantages of digital cable over other technologies. Together with this, they shall leverage the strong capabilities of their Group in the M&E industry, which allows us to provide a formidable combination of content, distribution platforms, service quality and value mix.
In the near-term, their investments will remain consistent as they further expand their digital cable network across India and launch broadband services in newer markets. Upon completion of this infrastructure creation, the routine operational and maintenance costs will be much lower, leading to recurring and stable cash flows (with a positive bias) and lower finance costs. With an expanded subscriber base, growing penetration of their broadband services and increasing demand of other value-added services, they anticipate a consistent improvement in their margins. They shall also benefit from the tailwind provided by the impending improvement in the economy that will boost discretionary spends. This in turn, will drive a higher demand for premium channels and HD channels among others, leading to a further growth in their ARPUs.
Therefore, SITI Cable is confident of its ability to deliver strong and sustainable stakeholder returns in the years to come.
INDEX
OF CHARGES
|
S.No. |
Charge ID |
Date of Charge Creation/Modification |
Charge amount secured |
Charge Holder |
Address |
Service Request Number (SRN) |
|
1 |
10547624 |
12/03/2015 * |
1,250,000,000.00 |
IDBI Bank Limited |
IDBI TOWERWTC COMPLEX, CUFFE PARADE, MUMBAI, Maharashtra - 400005,
INDIA |
C47795075 |
|
2 |
10543010 |
29/12/2014 |
500,000,000.00 |
ING VYSYA BANK LIMITED |
22, M G ROAD,BANGALORE, BANGALORE, Karnataka - 560001, INDIA |
C40425621 |
|
3 |
10543013 |
29/12/2014 |
250,000,000.00 |
ING VYSYA BANK LIMITED |
22, M G ROAD,BANGALORE, BANGALORE, Karnataka - 560001, INDIA |
C40426876 |
|
4 |
10505683 |
06/06/2014 |
1,000,000,000.00 |
Axis Bank Limited |
TRISHUL 3RD FLOOR OPP SAMARTHESHWAR TEMPLE, LAW G |
C09084021 |
|
5 |
10472075 |
23/12/2013 |
1,000,000,000.00 |
ING VYSYA BANK LIMITED |
NARIAN MANZIL, GROUND FLOOR,SHOP NO. G1 TO G5, I |
B94207305 |
|
6 |
10449725 |
29/08/2013 |
1,000,000,000.00 |
Axis Bank Limited |
TRISHUL 3RD FLOOR OPP SAMARTHESHWAR TEMPLE, LAW GARDEN ELLISBRIDGE,
AHMEDABAD, Gujarat - 380006, INDIA |
B85267177 |
|
7 |
10425197 |
10/06/2013 * |
2,521,200,000.00 |
Standard Chartered Bank |
23, Marain Manzil, Barakhamba Road,, New Delhi-110001, INDIA |
B77108736 |
|
8 |
10411292 |
13/03/2013 |
1,000,000,000.00 |
ICICI BANK LIMITED |
LANDMARKRACE COURCE CIRCLE, ALKAPURI, BARODA, Gujarat - 390015, INDIA |
B70611348 |
|
9 |
10382658 |
25/10/2012 |
2,200,000,000.00 |
ICICI BANK LIMITED |
LANDMARKRACE COURCE CIRCLE, ALKAPURI, BARODA, Gujarat - 390015, INDIA |
B60507852 |
|
10 |
10368881 |
26/09/2012 * |
600,000,000.00 |
IDBI TOWERWTC COMPLEX, CUFFE PARADE, MUMBAI, Maharashtra - 400005, INDIA |
B60460748 |
UNAUDITED FINANCIAL
RESULTS FOR THE QUARTER ENDED 30th SEPTEMBER 2015
(Rs. In Million)
|
|
|
Particulars |
quarter ended
30.09.2015 |
quarter ended
30.06.2015 |
Half year ended
30.09.2015 |
|
1 |
|
Income from
Operations |
|
|
|
|
|
|
Sales/Income from Operations (Gross) |
2315.400 |
2260.320 |
4575.720 |
|
|
|
b) Other Operating Income |
60.610 |
38.520 |
99.130 |
|
|
Total Income from
Operations (Net) |
1520.080 |
1482.280 |
3002.350 |
|
|
2 |
Expenses |
|
|
|
|
|
|
a) |
Cost of Materials consumed |
1.050 |
0.170 |
1.210 |
|
|
b) |
Purchase of Stock-in-trade |
138.920 |
16.870 |
155.790 |
|
|
c) |
Changes in inventories of finished goods, work-in-progress and
stock-in-trade |
0.000 |
0.000 |
0.000 |
|
|
d) |
Carriage, Pay Channel and related parties |
805.150 |
913.930 |
1719.080 |
|
|
e) |
Employee benefit expenses |
124.420 |
99.790 |
224.210 |
|
|
f) |
Depreciation and amortization expense |
214.490 |
201.330 |
415.820 |
|
|
g) |
Other expenses |
291.110 |
333.570 |
624.680 |
|
|
Total Expenses |
1575.140 |
1565.660 |
3140.790 |
|
|
|
|
|
|
|
|
|
3 |
|
Profit /(Loss) from
operations before other income, finance costs and exceptional items |
(55.060) |
(83.380) |
138.440 |
|
4 |
Other Income |
80.620 |
70.050 |
150.670 |
|
|
5 |
Profit /(Loss) from
ordinary activities before finance costs and exceptional items |
25.560 |
(13.330) |
12.230 |
|
|
6 |
Finance Costs |
337.310 |
333.230 |
670.540 |
|
|
7 |
Profit /(Loss) from
ordinary activities after finance costs but before exceptional items |
(311.750) |
(346.560) |
(658.310) |
|
|
8 |
Exceptional Items |
-- |
--- |
-- |
|
|
9 |
Profit /(Loss) from
ordinary activities before tax |
(311.750) |
(346.560) |
(658.310) |
|
|
10 |
Tax Expense |
-- |
--- |
-- |
|
|
11 |
Net Profit /(Loss)
from ordinary activities after tax |
(311.750) |
(346.560) |
(658.310) |
|
|
12 |
Prior period item |
-- |
21.760 |
21.760 |
|
|
13 |
Loss after tax and
Prior period item but before minority interest |
(311.750) |
(368.320) |
(680.070) |
|
|
14 |
Paid up equity share capital (Eq. shares of Rs.10/- each) |
677.630 |
677.630 |
677.630 |
|
|
15 |
Reserve excluding revaluation reserves |
|
|
|
|
|
16 |
|
Earnings per share (before/after extraordinary items) of Rs.10/- each |
|
|
|
|
|
|
Basic & Diluted |
(0.50) |
(0.50) |
(1.00) |
|
|
|
|
|
|
|
|
A |
|
PARTICULARS OF
SHAREHOLDING |
|
|
|
|
1 |
|
Public Shareholding |
|
|
|
|
|
|
- No. of Shares |
230.390 |
230.390 |
230.390 |
|
|
|
- Percentage of Shareholding |
34.00% |
34.00% |
34.00% |
|
2 |
|
Promoters and promoter group shareholding |
|
|
|
|
|
|
a) Pledged/Encumbered |
|
|
|
|
|
|
- Number of shares |
130.970 |
165.970 |
130.970 |
|
|
|
- Percentage of shares ( as a % of the total shareholding of the promoter and promoter group) |
29.3% |
37.1% |
29.3% |
|
|
|
- Percentage of shares (as a % of the total share capital of the Company) |
19.3% |
24.5% |
19.3% |
|
|
|
b) Non- encumbered |
|
|
|
|
|
|
- Number of shares |
316.270 |
281.270 |
316.270 |
|
|
|
- Percentage of shares ( as a % of the total shareholding of the promoter and promoter group) |
70.70 |
62.90 |
70.70 |
|
|
|
- Percentage of shares (as a % of the total share capital of the Company) |
46.7 |
41.5 |
46.7 |
|
Particulars |
Quarter Ended 30.09.2015 |
|
Pending at the beginning of the quarter |
Nil |
|
Received during the quarter |
Nil |
|
Disposed of during the quarter |
Nil |
|
Remaining unresolved at the end of the
quarter |
Nil |
STATEMENT OF ASSETS ANS LIABILITIES AS ON 30TH SEPTEMBER
2015
|
SOURCES
OF FUNDS |
30.09.2015 |
|
|
(Half
Year ended) |
|
|
|
|
I.
EQUITY AND LIABILITIES |
|
|
(1)Shareholders' Funds |
|
|
(a) Share Capital |
678.270 |
|
(b) Reserves & Surplus |
382.960 |
|
(c) Money received against
share warrants |
0.000 |
|
|
|
|
(2) Share Application money
pending allotment |
0.000 |
|
Total
Shareholders’ Funds (1) + (2) |
1061.230 |
|
|
|
|
(3) Non-Current Liabilities |
|
|
(a) long-term borrowings |
7373.880 |
|
(b) Deferred tax liabilities
(Net) |
0.000 |
|
(c) Other long term
liabilities |
764.290 |
|
(d) long-term provisions |
34.160 |
|
Total
Non-current Liabilities (3) |
8172.330 |
|
|
|
|
(4) Current Liabilities |
|
|
(a) Short term borrowings |
375.600 |
|
(b) Trade payables |
2312.830 |
|
(c) Other current liabilities |
5893.940 |
|
(d) Short-term provisions |
1.280 |
|
Total
Current Liabilities (4) |
8583.650 |
|
|
|
|
TOTAL |
17817.210 |
|
|
|
|
II.
ASSETS |
|
|
(1) Non-current assets |
|
|
(a) Fixed Assets |
|
|
(i) Tangible assets |
5807.540 |
|
(ii) Intangible Assets |
0.000 |
|
(iii) Capital work-in-progress |
0.000 |
|
(iv) Intangible assets under
development |
0.000 |
|
(b) Non-current Investments |
2510.870 |
|
(c) Deferred tax assets (net) |
0.000 |
|
(d) Long-term Loan and Advances |
1018.800 |
|
(e) Other Non-current assets |
686.520 |
|
Total
Non-Current Assets |
10023.730 |
|
|
|
|
(2) Current assets |
|
|
(a) Current investments |
8.040 |
|
(b) Inventories |
133.730 |
|
(c) Trade receivables |
4030.440 |
|
(d) Cash and cash equivalents |
1566.470 |
|
(e) Short-term loans and
advances |
1587.030 |
|
(f) Other current assets |
467.770 |
|
Total
Current Assets |
7793.480 |
|
|
|
|
TOTAL |
17817.210 |
Note:
1. SITI Cable Network Limited (the "Company") operates in single business segment of cable distribution in India. Hence there are no separate reportable business or geographical segments as per Accounting Standard on Segment Reporting (AS-17).
2. The above unaudited financial results for the quarter and six months ended
September 30, 2015 have been reviewed by the Audit Committee and were approved
by the Board of Directors in their meetings held on November 09, 2015.
3. The Statutory Auditors have carried out a "Limited review" of the
Standalone financial results for the quarter and six months ended September 30,
2015.
4. This statement of unaudited financial results has been prepared by applying
accounting policies as adopted in the last audited annual financial statements
for the year ended March 31, 2015.
5. The outstanding business advances amounting to Rs. 7,951 lacs given to two
subsidiaries (including a wholly owned subsidiary) for acquisition of
Multi-System Operators (MSOs)/ direct points, technological up gradation etc.
in near future, are considered good and recoverable, as Company has received
indemnity against the aforementioned balances from majority stake holders of
the Company.
6. The Audit Committee and the Board of Directors noted the utilisation of the
proceeds of qualified institutional placement (QIP) for the half year ended
September 30, 2015 which is in line with utilisation schedule as approved by
the Board of Directors. The unutilised amount as on September 30, 2015 is Rs.
1,950 lacs.
7. In view of the mandatory digital addressable system (DAS) regulation announced
by the Government of India, digitisation of cable networks has been implemented
in Phase 1 and Phase 2 cities effective November 1, 2012 and April 1, 2013
respectively. Owing to the initial delays in implementation of DAS in phase 1
cities and challenges faced by all the Multi-System Operators (MSOs) during
transition from analogue business to DAS, the Company is in the process of
implementation of revenue sharing contracts entered into with the local cable
operators (LCOs). Accordingly, the Company has invoiced and recognised
subscription revenue on the basis of certain estimates under the new DAS regime
amounting to Rs. 2,476 lacs (standalone Rs. 2,282 lacs) and Rs. 4,293 lacs
(standalone Rs. 4,208 lacs) for the quarter and six months ended September 30,
2015 respectively, Rs. 1,072 lacs (standalone Rs. 839 lacs) and Rs. 2,085 lacs
(standalone Rs. 1,689 lacs) for the quarter and six months ended September 30,
2014 respectively and Rs. 2,290 lacs (standalone Rs. 1,926 lacs) and Rs. 6,662
lacs (standalone Rs. 5,290 lacs) for the quarter ended June 30, 2015 and year
ended March 31, 2015 respectively, based on certain estimates derived from
market trends and ongoing discussion with the LCOs. Management is of the view
that the execution/implementation of such contracts will not have a significant
impact on the subscription revenue.
8. The Audit Committee and Board of Directors noted the utilisation of the
proceeds of Rights Issue for half year ended September 30, 2015 is in line with
utilisation schedule approved by the Board of Directors. The unutilised amount
from the proceeds of Rights Issue as on September 30, 2015 is Rs. 759 lacs.
9. The Company continued to incur cash losses on standalone basis, during six
months ended September 30, 2015 but in view of the present positive net worth,
expected substantial subscription revenue growth and continued financial
support from majority stake holders of the Company, the financial results
continue to be prepared on a going concern basis.
10. Prior period item relate to license fee of Rs. 217.6 lacs pertaining to
financial year 2014-2015 and recorded in the quarter ended June 30, 2015.
11. As approved by the Shareholders, on the basis of recommendation of
Nomination and Remuneration Committee, the remuneration paid to CEO and
Executive Director exceeds the prescribed limits under the Companies Act, 2013,
for which necessary representation for reconsidering the application has been
submitted before Central Government and approval is awaited for the same.
12. During the current quarter, the Company has acquired 51% equity share
capital in Panchsheel Digital Communication Network Private Limited and Siti
Prime Uttaranchal Communication Private Limited
13 Previous period's/year’s amounts have been regrouped and rearranged,
wherever necessary.
CONTINGENT
LIABILITIES:
i) Claims against the Company not acknowledged as debts Rs. 15.020 million (Previous year Rs. 49.200 million)
ii) Demands raised by the statutory authorities being contested by the Company Rs. 417.920 million (Previous year Nil)
FIXED ASSETS
- Building
- Plant and equipment
- Computers
- Office equipment
- Furniture and fixtures
- Air conditioners
- Studio equipment
- Vehicles
- Leasehold improvements
- Set top boxes
- IRD boxes
CMT REPORT (Corruption, Money Laundering & Terrorism]
The Public Notice information has been collected from various sources
including but not limited to: The Courts,
1] INFORMATION ON
DESIGNATED PARTY
No exist designating subject or any of its beneficial owners,
controlling shareholders or senior officers as terrorist or terrorist
organization or whom notice had been received that all financial transactions
involving their assets have been blocked or convicted, found guilty or against
whom a judgement or order had been entered in a proceedings for violating
money-laundering, anti-corruption or bribery or international economic or
anti-terrorism sanction laws or whose assets were seized, blocked, frozen or
ordered forfeited for violation of money laundering or international
anti-terrorism laws.
2] Court Declaration :
No exist to suggest that subject is or was
the subject of any formal or informal allegations, prosecutions or other
official proceeding for making any prohibited payments or other improper
payments to government officials for engaging in prohibited transactions or
with designated parties.
3] Asset Declaration :
No records exist to suggest that the property or assets of the subject
are derived from criminal conduct or a prohibited transaction.
4] Record on Financial
Crime :
Charges or conviction
registered against subject: None
5] Records on Violation of
Anti-Corruption Laws :
Charges or
investigation registered against subject: None
6] Records on Int’l
Anti-Money Laundering Laws/Standards :
Charges or
investigation registered against subject: None
7] Criminal Records
No
available information exist that suggest that subject or any of its principals have
been formally charged or convicted by a competent governmental authority for
any financial crime or under any formal investigation by a competent government
authority for any violation of anti-corruption laws or international anti-money
laundering laws or standard.
8] Affiliation with
Government :
No record
exists to suggest that any director or indirect owners, controlling
shareholders, director, officer or employee of the company is a government
official or a family member or close business associate of a Government
official.
9] Compensation Package :
Our market
survey revealed that the amount of compensation sought by the subject is fair
and reasonable and comparable to compensation paid to others for similar
services.
10] Press Report :
No press reports / filings exists on
the subject.
CORPORATE GOVERNANCE
MIRA INFORM as part of its Due Diligence do provide comments on
Corporate Governance to identify management and governance. These factors often
have been predictive and in some cases have created vulnerabilities to credit
deterioration.
Our Governance Assessment focuses principally on the interactions
between a company’s management, its Board of Directors, Shareholders and other
financial stakeholders.
CONTRAVENTION
Subject is not known to have contravened any existing local laws,
regulations or policies that prohibit, restrict or otherwise affect the terms
and conditions that could be included in the agreement with the subject.
FOREIGN EXCHANGE RATES
|
Currency |
Unit
|
Indian Rupees |
|
US Dollar |
1 |
Rs.66.37 |
|
|
1 |
Rs.98.91 |
|
Euro |
1 |
Rs.72.84 |
INFORMATION DETAILS
|
Information
Gathered by : |
SPR |
|
|
|
|
Analysis Done by
: |
KAS |
|
|
|
|
Report Prepared
by : |
SUJ |
SCORE & RATING EXPLANATIONS
|
SCORE FACTORS |
RANGE |
POINTS |
|
HISTORY |
1~10 |
4 |
|
PAID-UP CAPITAL |
1~10 |
3 |
|
OPERATING SCALE |
1~10 |
4 |
|
FINANCIAL
CONDITION |
|
|
|
--BUSINESS SCALE |
1~10 |
3 |
|
--PROFITABILITY |
1~10 |
- |
|
--LIQUIDITY |
1~10 |
3 |
|
--LEVERAGE |
1~10 |
3 |
|
--RESERVES |
1~10 |
3 |
|
--CREDIT LINES |
1~10 |
3 |
|
--MARGINS |
-5~5 |
-- |
|
DEMERIT POINTS |
|
|
|
--BANK CHARGES |
YES/NO |
YES |
|
--LITIGATION |
YES/NO |
NO |
|
--OTHER ADVERSE INFORMATION |
YES/NO |
NO |
|
MERIT POINTS |
|
|
|
--SOLE DISTRIBUTORSHIP |
YES/NO |
NO |
|
--EXPORT ACTIVITIES |
YES/NO |
NO |
|
--AFFILIATION |
YES/NO |
YES |
|
--LISTED |
YES/NO |
YES |
|
--OTHER MERIT FACTORS |
YES/NO |
YES |
|
DEFAULTER |
|
|
|
--RBI |
YES/NO |
NO |
|
--EPF |
YES/NO |
NO |
|
TOTAL |
|
26 |
This score serves as a reference to assess
SC’s credit risk and to set the amount of credit to be extended. It is
calculated from a composite of weighted scores obtained from each of the major
sections of this report. The assessed factors and their relative weights (as
indicated through %) are as follows:
Financial
condition (40%) Ownership
background (20%) Payment
record (10%)
Credit history
(10%) Market trend (10%) Operational size
(10%)
RATING EXPLANATIONS
|
RATING |
STATUS |
PROPOSED CREDIT LINE |
|
|
>86 |
Aaa |
Possesses an extremely sound financial base with the strongest
capability for timely payment of interest and principal sums |
Unlimited |
|
71-85 |
Aa |
Possesses adequate working capital. No caution needed for credit transaction.
It has above average (strong) capability for payment of interest and
principal sums |
Large |
|
56-70 |
A |
Financial & operational base are regarded healthy. General unfavourable
factors will not cause fatal effect. Satisfactory capability for payment of
interest and principal sums |
Fairly Large |
|
41-55 |
Ba |
Overall operation is considered normal. Capable to meet normal
commitments. |
Satisfactory |
|
26-40 |
B |
Capability to overcome financial difficulties seems comparatively
below average. |
Small |
|
11-25 |
Ca |
Adverse factors are apparent. Repayment of interest and principal sums
in default or expected to be in default upon maturity |
Limited with full
security |
|
<10 |
C |
Absolute credit risk exists. Caution needed to be exercised |
Credit not
recommended |
|
-- |
NB |
New Business |
-- |
This report is issued at your request without any
risk and responsibility on the part of MIRA INFORM PRIVATE LIMITED (MIPL) or
its officials.