MIRA INFORM REPORT
|
Report No. : |
349840 |
|
Report Date : |
25.11.2015 |
IDENTIFICATION DETAILS
|
Name : |
FAG
BEARINGS INDIA LIMITED |
|
|
|
|
Formerly Known
As : |
FAG PRECISION BEARINGS LIMITED |
|
|
|
|
Registered
Office : |
Nariman Bhavan, 8th
Floor, 227, Backbay Reclamation, Nariman Point, Mumbai – 400021, Maharashtra |
|
Tel. No.: |
91-22-6681 4444 to 66814499 |
|
|
|
|
Country : |
India |
|
|
|
|
Financials (as
on) : |
31.12.2014 |
|
|
|
|
Date of
Incorporation : |
27.04.1962 |
|
|
|
|
Com. Reg. No.: |
11-012340 |
|
|
|
|
Capital
Investment / Paid-up Capital : |
Rs.166.200
Million |
|
|
|
|
CIN No.: [Company Identification
No.] |
L29130MH1962PLC012340 |
|
|
|
|
TIN No.: |
Not Available |
|
|
|
|
IEC No.: |
0888007507 |
|
|
|
|
TAN No.: [Tax Deduction &
Collection Account No.] |
Not Available |
|
|
|
|
PAN No.: [Permanent Account No.] |
AAACF3357Q
|
|
|
|
|
Legal Form : |
A Public Limited Liability Company.
The Company’s Shares are Listed on the Stock Exchanges. |
|
|
|
|
Line of Business
: |
Manufacturer
and Seller of Ball and Roller Bearings and Related Components. |
|
|
|
|
No. of Employees
: |
1477 (Approximately) |
RATING & COMMENTS
|
MIRA’s Rating : |
Aa (77) |
|
RATING |
STATUS |
PROPOSED CREDIT LINE |
|
|
71-85 |
Aa |
Possesses adequate working capital. No caution needed for credit
transaction. It has above average (strong) capability for payment of interest
and principal sums |
Large |
|
Status : |
Good |
|
|
|
|
Payment Behaviour : |
Regular |
|
|
|
|
Litigation : |
Clear |
|
|
|
|
Comments : |
Subject is a subsidiary of ‘FAG Kugelfischer GmbH’, Germany. The company is engaged in manufacturing of machines equipment. It caters construction machinery, electrical engineering, fluid technology, conveying equipment, industrial gears, mining and cement, power generation, agricultural engineering, steel plants, motorcycles, textile machinery, machine tools, wind power, pulp and paper industry segments. For the financial year ended December 2014, company has reported 15.52% sales turnover growth as compared to previous sales turnover and it has maintained decent profitability margins at 9.37% during the year under a review. Rating takes into consideration company’s established track record of business operations marked by well experience management team and strong financial and managerial support that company receives from its parent entity. Rating also takes into account of its healthy financial profile marked by its adequate net worth base along with strong debt protection indicators and favorable liquidity position Trade relations are reported as fair. Business is active. Payment are
reported to be regular and as per commitment. The company can be considered good for business dealings at usual
trade terms and conditions. |
NOTES:
Any query related to this report can be made
on e-mail : infodept@mirainform.com
while quoting report number, name and date.
ECGC Country Risk Classification List – March 31, 2015
|
Country Name |
Previous Rating (31.12.2014) |
Current Rating (31.03.2015) |
|
India |
A1 |
A1 |
|
Risk Category |
ECGC
Classification |
|
Insignificant |
A1 |
|
Low |
A2 |
|
Moderate |
B1 |
|
High |
B2 |
|
Very High |
C1 |
|
Restricted |
C2 |
|
Off-credit |
D |
EXTERNAL AGENCY RATING
|
Rating Agency Name |
Not Available |
|
Rating |
Not Available |
|
Rating Explanation |
Not Available |
|
Date |
Not Available |
RBI DEFAULTERS’ LIST STATUS
Subject’s name is not enlisted as a defaulter
in the publicly available RBI Defaulters’ list.
EPF (Employee Provident Fund) DEFAULTERS’ LIST STATUS
Subject’s name is not enlisted as a defaulter
in the publicly available EPF (Employee Provident Fund) Defaulters’ list as of
31-03-2015.
INFORMATION DECLINED
Management non-cooperative: 91-265-6602000
LOCATIONS
|
Registered Office : |
Nariman Bhavan, 8th Floor, 227,
Backbay Reclamation, Nariman Point, Mumbai - 400021, Maharashtra, India |
|
Tel. No.: |
91-22-6681 4444 to 66814499 |
|
Fax No.: |
91-22-22027022 |
|
E-Mail : |
|
|
Website : |
|
|
|
|
|
Head Office / Factory 1: |
P.O. Maneja, Vadodara – 390013, Gujarat, India |
|
Tel. No.: |
91-265-6602000-2004 |
|
Fax No.: |
91-265-2638804 |
|
E-Mail : |
|
|
|
|
|
Factory 2 : |
Plot No.1
(Alindra), Savli, GIDC Phase - III, Taluka Savli, Vadodara – 391775, Gujarat,
India |
|
|
|
|
Postal Address : |
C.P. Patel Finance, J C Patel Estate, Block No. 176, Bharat Baug, NH
8, Rangoli Crossing, Po Dasrath, Vadodara – 391740, Gujarat, India |
|
|
|
|
Sales Offices
: |
Located At: ·
Bangalore ·
Bhubaneshwar ·
Chennai ·
Coimbatore ·
Jamshedpur ·
Kanpur ·
Kolkata ·
Mumbai ·
New Delhi ·
Pune ·
Secunderabad ·
Udaipur |
DIRECTORS
AS ON 31.03.2015
|
Name : |
Mr. Rajendra Jayantilal Anandpara |
|
Designation : |
Managing Director |
|
Address: |
304, Topaz Residency, 30, Urmi Society, Haveli BPC Road, Vadodara - 390007, Gujarat, India |
|
Date of Appointment: |
23.07.2009 |
|
DIN No.: |
02461259 |
|
|
|
|
Name : |
Mr. Avinash Parkash Gandhi |
|
Designation : |
Director |
|
Address: |
C-2/14, Safdarjung, Development Area, New Delhi - 110016, India |
|
Date of Birth/ Age : |
01.10.1938 |
|
Qualification : |
B.Sc. in Mechanical Engineering |
|
Date of Appointment : |
20.04.2006 |
|
DIN No.: |
00161107 |
|
|
|
|
Name : |
Mr. Klaus Rosenfeld |
|
Designation : |
Director |
|
Address: |
Liliencronstrasse 31, Frankfurt am Main, Frankfurt, 60320, Germany |
|
Date of Appointment: |
11.02.2015 |
|
DIN No.: |
07087975 |
|
|
|
|
Name : |
Mr. Dietmar Claus Heinrich |
|
Designation : |
Director |
|
Address: |
Wuerzburger Str. 9, 91074, Herzogenaurach, 91074, Germany |
|
Date of Appointment: |
11.02.2014 |
|
DIN No.: |
00928243 |
|
|
|
|
Name : |
Mr. Frank Huber |
|
Designation : |
Director |
|
Address: |
Landwehrgraben 10, 97456, Dittelbrunn, 97456, Germany |
|
Date of Appointment: |
20.04.2012 |
|
DIN No.: |
00689169 |
|
|
|
|
Name : |
Mr. Sampath Kumar Raman |
|
Designation : |
Director |
|
Address: |
204 Tower 2 Palms, South City 1, Gurgaon - 122001, Haryana, India |
|
Date of Appointment: |
20.04.2012 |
|
DIN No.: |
00495192 |
|
|
|
|
Name : |
Dr. Sanak Mishra |
|
Designation : |
Director |
|
Address: |
Flat No.341, Green Heavens Sail Co-Op, Housing, Society Plot No.35, Sector 4, Dwarka Phase - I, New Delhi - 110045, India |
|
Date of Appointment: |
06.11.2014 |
|
DIN No.: |
00027288 |
|
|
|
|
Name : |
Mrs. Renu Challu |
|
Designation : |
Director |
|
Address: |
A 34/1, Afochs, Sainikpuri, Secunderabad - 500094, Telangana, India |
|
Date of Appointment: |
06.11.2014 |
|
DIN No.: |
00157204 |
|
|
|
|
|
|
|
Name : |
Mr. Rakesh Jinsi |
|
Designation : |
Director |
|
Address: |
H.No.277, Sector 17-A, Gurgaon, 122001, Haryana, India |
|
Date of Appointment: |
11.02.2015 |
|
DIN No.: |
00182187 |
KEY EXECUTIVES
|
Name : |
Mr. Satish Chunibhai Patel |
|
Designation : |
Chief Financial Officer |
|
Address: |
12, Vicenza Highlands, B/H FGI Business Centre, Gotri - Sevasi Road, Vadodara - 391101, Gujarat, India |
|
Date of Appointment: |
31.07.2014 |
|
PAN No.: |
ABLPP9063A |
|
|
|
|
Name : |
Mr. Raj Kumar Sarraf |
|
Designation : |
Company secretary |
|
Address: |
37, Pranav Society, Manjalpur, Vadodara - 390013, Gujarat, India |
|
Date of Appointment: |
08.02.2007 |
|
PAN No.: |
AQSPS1507Q |
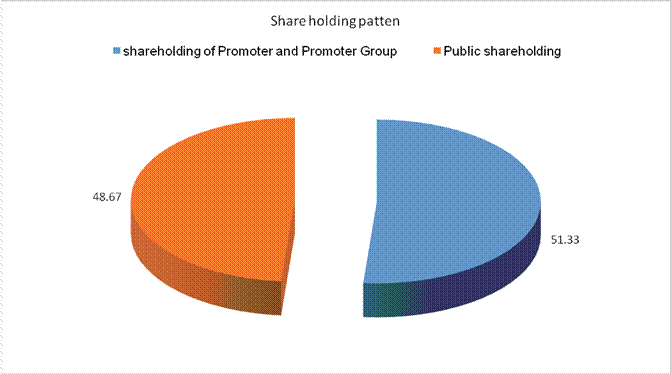
SHAREHOLDING PATTERN
AS ON 30.09.2015
|
Category of Shareholder |
Total No. of Shares |
Percentage of
Holding |
|
|
|
|
|
(A) Shareholding
of Promoter and Promoter Group |
||
|
|
|
|
|
|
|
|
|
|
8529183 |
51.33 |
|
|
8529183 |
51.33 |
|
Total
shareholding of Promoter and Promoter Group (A) |
8529183 |
51.33 |
|
(B) Public
Shareholding |
||
|
|
|
|
|
|
3214262 |
19.34 |
|
|
6192 |
0.04 |
|
|
174494 |
1.05 |
|
|
478350 |
2.88 |
|
|
3873298 |
23.31 |
|
|
|
|
|
|
1122983 |
6.76 |
|
|
|
|
|
|
1222854 |
7.36 |
|
|
227717 |
1.37 |
|
|
1641235 |
9.88 |
|
|
67250 |
0.40 |
|
|
22886 |
0.14 |
|
|
110 |
0.00 |
|
|
1550989 |
9.33 |
|
|
4214789 |
25.36 |
|
Total Public shareholding
(B) |
8088087 |
48.67 |
|
Total (A)+(B) |
16617270 |
100.00 |
|
(C) Shares held
by Custodians and against which Depository Receipts have been issued |
0 |
0.00 |
|
|
0 |
0.00 |
|
|
0 |
0.00 |
|
|
0 |
0.00 |
|
Total
(A)+(B)+(C) |
16617270 |
0.00 |
BUSINESS DETAILS
|
Line of Business : |
Manufacturer
and Seller of Ball and Roller Bearings and Related Components. |
|
|
|
|
Products : |
Ball
and Roller Bearings |
|
|
|
|
Brand Names : |
Not Available |
|
|
|
|
Agencies Held : |
Not Available |
|
|
|
|
Exports : |
Not Divulged |
|
|
|
|
Imports : |
Not Divulged |
|
|
|
|
Terms : |
|
|
Selling : |
Not Divulged |
|
|
|
|
Purchasing : |
Not Divulged |
PRODUCTION STATUS – NOT AVAILABLE
GENERAL INFORMATION
|
Suppliers : |
|
||||||||||||||||||||||
|
|
|||||||||||||||||||||||
|
Customers : |
|
||||||||||||||||||||||
|
|
|
||||||||||||||||||||||
|
No. of Employees : |
1477 (Approximately) |
||||||||||||||||||||||
|
|
|
||||||||||||||||||||||
|
Bankers : |
|
|
|
|
|
Auditors : |
|
|
Name : |
BSR and Company Chartered Accountants |
|
Address : |
|
|
|
|
|
Memberships : |
-- |
|
|
|
|
Collaborators : |
|
|
|
|
|
Holding Company : |
|
|
|
|
|
Fellow
Subsidiary / Associate Companies |
|
CAPITAL STRUCTURE
AS ON 31.12.2014
Authorised Capital :
|
No. of Shares |
Type |
Value |
Amount |
|
|
|
|
|
|
20000000 |
Equity Shares |
Rs.10/- each |
Rs.200.000
Million |
|
|
|
|
|
Issued Capital :
|
No. of Shares |
Type |
Value |
Amount |
|
|
|
|
|
|
16818270 |
Equity Shares |
Rs.10/- each |
Rs.168.200
Million |
|
|
|
|
|
Subscribed & Paid-up Capital :
|
No. of Shares |
Type |
Value |
Amount |
|
|
|
|
|
|
16617270 |
Equity Shares |
Rs.10/- each |
Rs.166.200
Million |
|
|
|
|
|
Ø
Reconciliation
of shares outstanding at the beginning and at the end of the year
|
Equity Shares |
Number of Shares |
Rs. In Million |
|
Shares outstanding at the beginning and at the end of the year |
16617270 |
166.200 |
- Rights, preferences and restrictions attached to equity shares
1. The Company has a single class of equity shares. Accordingly, all equity shares rank equally with regard to dividends and share in the Company’s residual assets. The equity shares are entitled to receive dividend as declared from time to time. The voting rights of shareholders are in proportion to its share of paid-up equity capital of the Company.
2. On winding up of the Company, the holders of equity shares will be entitled to receive the residual assets of the Company.
- Shares held by Holding / Ultimate Holding Company and/or their
Subsidiaries / Associates
|
Name of
Shareholder |
Number
of Shares |
% holding |
|
|
31.12.2014 |
|
|
|
|
|
|
FAG Kugelfischer GmbH (the holding Company) |
8529183 |
51.33 |
FINANCIAL DATA
[all figures are
in Rupees Million]
ABRIDGED
BALANCE SHEET
|
SOURCES OF FUNDS |
31.12.2014 |
31.12.2013 |
31.12.2012 |
|
I.
EQUITY
AND LIABILITIES |
|
|
|
|
(1)Shareholders' Funds |
|
|
|
|
(a) Share Capital |
166.200 |
166.200 |
166.200 |
|
(b) Reserves & Surplus |
10908.700 |
9729.300 |
8628.800 |
|
(c) Money
received against share warrants |
0.000 |
0.000 |
0.000 |
|
|
|
|
|
|
(2) Share Application money pending
allotment |
0.000 |
0.000 |
0.000 |
|
Total
Shareholders’ Funds (1) + (2) |
11074.900 |
9895.500 |
8795.000 |
|
|
|
|
|
|
(3)
Non-Current Liabilities |
|
|
|
|
(a) long-term borrowings |
0.000 |
0.000 |
0.000 |
|
(b) Deferred tax liabilities (Net) |
154.000 |
174.100 |
64.400 |
|
(c) Other long term
liabilities |
15.200 |
16.100 |
15.200 |
|
(d) long-term
provisions |
329.000 |
205.000 |
229.400 |
|
Total Non-current
Liabilities (3) |
498.200 |
395.200 |
309.000 |
|
|
|
|
|
|
(4)
Current Liabilities |
|
|
|
|
(a) Short
term borrowings |
0.000 |
0.000 |
0.000 |
|
(b) Trade
payables |
2160.600 |
2404.700 |
1786.100 |
|
(c) Other
current liabilities |
420.000 |
488.500 |
417.700 |
|
(d) Short-term
provisions |
188.200 |
148.800 |
128.800 |
|
Total Current
Liabilities (4) |
2768.800 |
3042.000 |
2332.600 |
|
|
|
|
|
|
TOTAL |
14341.900 |
13332.700 |
11436.600 |
|
|
|
|
|
|
II.
ASSETS |
|
|
|
|
(1)
Non-current assets |
|
|
|
|
(a) Fixed
Assets |
|
|
|
|
(i)
Tangible assets |
3699.400 |
3983.400 |
2782.200 |
|
(ii)
Intangible Assets |
3.000 |
5.500 |
9.400 |
|
(iii)
Capital work-in-progress |
201.200 |
134.300 |
1135.500 |
|
(iv)
Intangible assets under development |
0.000 |
0.000 |
0.000 |
|
(b) Non-current Investments |
43.500 |
43.500 |
43.500 |
|
(c) Deferred tax assets (net) |
0.000 |
0.000 |
0.000 |
|
(d) Long-term Loan and Advances |
999.400 |
1765.100 |
754.300 |
|
(e) Other
Non-current assets |
0.000 |
4.600 |
4.600 |
|
Total Non-Current Assets |
4946.500 |
5936.400 |
4729.500 |
|
|
|
|
|
|
(2)
Current assets |
|
|
|
|
(a)
Current investments |
0.000 |
0.000 |
0.000 |
|
(b)
Inventories |
1908.900 |
1705.800 |
1422.100 |
|
(c) Trade
receivables |
2900.500 |
2906.000 |
2547.100 |
|
(d) Cash
and cash equivalents |
3294.500 |
2376.600 |
1948.200 |
|
(e)
Short-term loans and advances |
1201.900 |
347.100 |
755.400 |
|
(f) Other
current assets |
89.600 |
60.800 |
34.300 |
|
Total
Current Assets |
9395.400 |
7396.300 |
6707.100 |
|
|
|
|
|
|
TOTAL |
14341.900 |
13332.700 |
11436.600 |
PROFIT
& LOSS ACCOUNT
|
|
PARTICULARS |
31.12.2014 |
31.12.2013 |
31.12.2012 |
||
|
|
SALES |
|
|
|
||
|
|
|
Income |
16321.500 |
14024.200 |
14466.500 |
|
|
|
|
Other Income |
409.500 |
458.600 |
446.300 |
|
|
|
|
TOTAL (A) |
16731.000 |
14482.800 |
14912.800 |
|
|
|
|
|
|
|
||
|
Less |
EXPENSES |
|
|
|
||
|
|
|
Cost of Materials Consumed |
6020.800 |
5036.800 |
4782.900 |
|
|
|
|
Purchase of Stock-in-trade |
3973.500 |
4256.100 |
4045.300 |
|
|
|
|
Changes in Inventories of finished goods, work-in-progress and
stock-in-trade |
(21.100) |
(322.000) |
247.700 |
|
|
|
|
Employee Benefits Expenses |
1379.400 |
1191.300 |
1128.900 |
|
|
|
|
Other Expenses |
2551.500 |
2026.100 |
2057.600 |
|
|
|
|
TOTAL (B) |
13904.100 |
12188.300 |
12262.400 |
|
|
|
|
|
|
|
||
|
|
PROFIT/(LOSS)
BEFORE INTEREST, TAX, DEPRECIATION AND AMORTISATION (A-B) (C) |
2826.900 |
2294.500 |
2650.400 |
||
|
|
|
|
|
|
||
|
Less |
FINANCIAL
EXPENSES (D) |
9.700 |
7.600 |
13.000 |
||
|
|
|
|
|
|
||
|
|
PROFIT/(LOSS)
BEFORE TAX, DEPRECIATION AND AMORTISATION (C-D)
(E) |
2817.200 |
2286.900 |
2637.400 |
||
|
|
|
|
|
|
||
|
Less |
DEPRECIATION/
AMORTISATION (F) |
493.500 |
432.500 |
302.700 |
||
|
|
|
|
|
|
||
|
|
PROFIT/(LOSS)
BEFORE TAX (E-F) (G) |
2323.700 |
1854.400 |
2334.700 |
||
|
|
|
|
|
|
||
|
Less |
TAX (H) |
794.900 |
636.100 |
742.900 |
||
|
|
|
|
|
|
||
|
|
PROFIT/(LOSS)
AFTER TAX (G-H) (I) |
1528.800 |
1218.300 |
1591.800 |
||
|
|
|
|
|
|
||
|
Add |
PREVIOUS
YEARS’ BALANCE BROUGHT FORWARD |
6490.300 |
5739.300 |
4594.000 |
||
|
|
|
|
|
|
||
|
Less |
APPROPRIATIONS |
|
|
|
||
|
|
|
Transfer to General Reserve |
400.000 |
350.000 |
350.000 |
|
|
|
|
Dividend |
124.600 |
99.700 |
83.100 |
|
|
|
|
Tax on Dividend |
21.200 |
17.600 |
13.400 |
|
|
|
BALANCE CARRIED
TO THE B/S |
7473.300 |
6490.300 |
5739.300 |
||
|
|
|
|
|
|
||
|
|
EARNINGS IN
FOREIGN CURRENCY |
|
|
|
||
|
|
|
Service income |
0.000 |
0.200 |
17.000 |
|
|
|
|
FOB value of exports |
2922.500 |
2219.400 |
2008.200 |
|
|
|
|
Others |
11.800 |
13.900 |
11.600 |
|
|
|
TOTAL EARNINGS |
2934.300 |
2233.500 |
2036.800 |
||
|
|
|
|
|
|
||
|
|
IMPORTS |
|
|
|
||
|
|
|
Raw Materials and components |
2414.100 |
1731.300 |
1711.600 |
|
|
|
|
Products Purchased for sale |
3126.900 |
3257.700 |
3008.600 |
|
|
|
|
Stores & Spares for maintenance of
machinery |
173.300 |
109.100 |
103.200 |
|
|
|
|
Capital Goods |
122.000 |
389.100 |
711.100 |
|
|
|
TOTAL IMPORTS |
5836.300 |
5487.200 |
5534.500 |
||
|
|
|
|
|
|
||
|
|
Earnings Per
Share (Rs.) |
92.00 |
73.32 |
95.79 |
||
KEY
RATIOS
|
PARTICULARS |
|
31.12.2014 |
31.12.2013 |
31.12.2012 |
|
Net Profit Margin PAT / Sales |
(%) |
9.37 |
8.69 |
11.00 |
|
|
|
|
|
|
|
Operating Profit Margin (PBDIT/Sales) |
(%) |
17.32 |
16.36 |
18.32 |
|
|
|
|
|
|
|
Return on Total Assets (PBT/Total Assets) |
(%) |
16.48 |
14.10 |
22.76 |
|
|
|
|
|
|
|
Return on Investment (ROI) (PBT/Networth) |
|
0.21 |
0.19 |
0.27 |
|
|
|
|
|
|
|
Debt Equity Ratio (Total Debt /Networth) |
|
0.00 |
0.00 |
0.00 |
|
|
|
|
|
|
|
Current Ratio (Current Asset/Current Liability) |
|
3.39 |
2.43 |
2.88 |
CURRENT MATURITIES OF LONG TERM DEBT DETAILS
|
Particulars |
31.03.2015 |
31.03.201 |
31.03.2013 |
|
Current Maturities of Long term debt |
NA |
NA |
NA |
|
Cash generated from operations |
1896.400 |
2115.600 |
2095.600 |
|
Net cash flow from operating activity |
1173.800 |
1620.700 |
1370.600 |
QUARTERLY
RESULTS
|
Particulars |
|
30.06.2015 (Unaudited) |
30.09.2015 (Unaudited) |
|
|
|
1st Quarter |
2nd Quarter |
|
Net Sales |
|
4321.20 |
4383.10 |
|
Total Expenditure |
|
3572.20 |
3627.10 |
|
PBIDT (Excl OI) |
|
749.00 |
756.00 |
|
Other Income |
|
147.10 |
150.10 |
|
Operating Profit |
|
896.10 |
906.10 |
|
Interest |
|
10.40 |
2.60 |
|
Exceptional Items |
|
NA |
NA |
|
PBDT |
|
885.70 |
903.50 |
|
Depreciation |
|
124.20 |
128.00 |
|
Profit Before Tax |
|
761.50 |
775.50 |
|
Tax |
|
268.80 |
269.50 |
|
Provisions and contingencies |
|
NA |
NA |
|
Profit After Tax |
|
492.70 |
506.00 |
|
Extraordinary Items |
|
NA |
NA |
|
Prior Period Expenses |
|
NA |
NA |
|
Other Adjustments |
|
NA |
NA |
|
Net Profit |
|
492.70 |
506.00 |
STOCK
PRICES
|
Face Value |
Rs.10.00/- |
|
Market Value |
Rs.3929.00/- |
FINANCIAL ANALYSIS
[all figures are
in Rupees Million]
DEBT EQUITY RATIO
|
Particular |
31.12.2012 |
31.12.2013 |
31.12.2014 |
|
|
Rs.
In Million |
Rs.
In Million |
Rs.
In Million |
|
Share Capital |
166.200 |
166.200 |
166.200 |
|
Reserves & Surplus |
8628.800 |
9729.300 |
10908.700 |
|
Net
worth |
8795.000 |
9895.500 |
11074.900 |
|
|
|
|
|
|
long-term borrowings |
0.000 |
0.000 |
0.000 |
|
Short term borrowings |
0.000 |
0.000 |
0.000 |
|
Total
borrowings |
0.000 |
0.000 |
0.000 |
|
Debt/Equity
ratio |
0.000 |
0.000 |
0.000 |
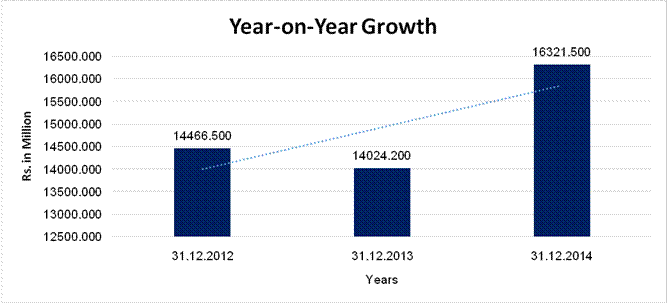
YEAR-ON-YEAR GROWTH
|
Year
on Year Growth |
31.12.2012 |
31.12.2013 |
31.12.2014 |
|
|
Rs.
In Million |
Rs.
In Million |
Rs.
In Million |
|
Sales |
14466.500 |
14024.200 |
16321.500 |
|
|
|
(3.057) |
16.381 |
NET PROFIT MARGIN
|
Net
Profit Margin |
31.12.2012 |
31.12.2013 |
31.12.2014 |
|
|
Rs.
In Million |
Rs.
In Million |
Rs.
In Million |
|
Sales
|
14466.500 |
14024.200 |
16321.500 |
|
Profit |
1591.800 |
1218.300 |
1528.800 |
|
|
11.00% |
8.69% |
9.37% |

LOCAL AGENCY FURTHER INFORMATION
|
Sr. No. |
Check list by
info agents |
Available in
Report (Yes/No) |
|
1 |
Year of establishment |
Yes |
|
2 |
Constitution of the entity -Incorporation
details |
Yes |
|
3 |
Locality of the entity |
Yes |
|
4 |
Premises details |
No |
|
5 |
Buyer visit details |
-- |
|
6 |
Contact numbers |
Yes |
|
7 |
Name of the person contacted |
No |
|
8 |
Designation of contact person |
No |
|
9 |
Promoter’s background |
Yes |
|
10 |
Date of Birth of Proprietor / Partners /
Directors |
Yes |
|
11 |
Pan Card No. of Proprietor / Partners |
No |
|
12 |
Voter Id Card No. of Proprietor / Partners |
No |
|
13 |
Type of business |
Yes |
|
14 |
Line of Business |
Yes |
|
15 |
Export/import details (if applicable) |
No |
|
16 |
No. of employees |
Yes |
|
17 |
Details of sister concerns |
Yes |
|
18 |
Major suppliers |
No |
|
19 |
Major customers |
No |
|
20 |
Banking Details |
Yes |
|
21 |
Banking facility details |
No |
|
22 |
Conduct of the banking account |
-- |
|
23 |
Financials, if provided |
Yes |
|
24 |
Capital in the business |
Yes |
|
25 |
Last accounts filed at ROC, if applicable |
Yes |
|
26 |
Turnover of firm for last three years |
Yes |
|
27 |
Reasons for variation <> 20% |
-- |
|
28 |
Estimation for coming financial year |
No |
|
29 |
Profitability for last three years |
Yes |
|
30 |
Major shareholders, if available |
Yes |
|
31 |
External Agency Rating, if available |
No |
|
32 |
Litigations that the firm/promoter
involved in |
-- |
|
33 |
Market information |
-- |
|
34 |
Payments terms |
No |
|
35 |
Negative Reporting by Auditors in the
Annual Report |
No |
FINANCIAL AND OPERATIONAL PERFORMANCE
ECONOMY
After
witnessing low GDP growth of 4.7 % in FY 2013-14, the year 2014 saw moderate
improvement in the country's economic climate. GDP growth in the first six months
of financial year 2014-15 improved to 5.5%. Service sector continued its strong
growth trend while Agriculture too, contributed through reasonable development.
Development of Industrial Production though remained very erratic as reflected
in the Index of Industrial Production (IIP) which grew very modestly at 1.5%
during the year 2014.
Inflation
remained in control as the Wholesale Price Index (WPI) continued the trend of
deceleration. A sharp drop in crude oil prices, pushed WPI trend further south
- from high of 6% in May 2014, WPI dropped to just 0.1% by December 2014.
After
the historic general elections in May 2014, a new majority government at the
Centre was formed in India. There are high expectations that a strong
government not constrained by coalition politics will usher in significant
reforms that can accelerate growth in the medium term.
Despite
positive sentiments, the year 2014 saw lackluster momentum in investment cycle.
RBI continued its conservative approach on interest rates and only marginally
reduced the repo rate by 25 bps in January 2015.
On the
Foreign Exchange Rate front, after a period of high volatility in year 2013,
Indian Rupee seems to have stabilized with respect to USD while it improved
considerably with respect to Euro.
INDUSTRY TREND AND DEMAND DEVELOPMENT
Against
the above backdrop, growth in demand of your Company's products both for
automotive and industrial sector remained moderate during the year 2014.
The two
wheeler sector surprised by notching up 2-digit growth. On other hand,
passenger cars and commercial vehicles did not grow as expected; while
production of agricultural tractors declined in 2014 after registering growth
in 2012 and 2013.
Due to
overall cash crunch and slow progress in implementation of infrastructure and
capacity increase in projects, demand from sectors such as Electric Motors,
Industrial Gearbox, Railways and Heavy Industries was sluggish throughout the
year 2014. Demand from Aftermarket was stable though the market saw intensified
competitive actions thus limiting scope for smart recovery in volume and
margins.
In the
exports markets, demand of your Company's products was strong.
PERFORMANCE
The
Company's Income for the year 2014, was placed at Rs.16731.000 million which is
15.5% higher than corresponding figures for the year 2013.
With
increase in production at Maneja and Savli plants, exports grew by 33%. Other sectors
of the Company's business viz. Automotive, Industry and Aftermarket - each
posted a good double digit growth. Profit from ordinary activities Before Tax
increased to Rs.2323.700 million (2013: Rs.1854.400 million); while Profit
after Tax increased to Rs.1528.800 million (2013: Rs.1218.300 million) given
modest economic environment, they consider the Company's performance as
encouraging.
OUTLOOK
As
they look ahead, effective implementation of economic agenda holds the key to
nation's progress. Industry indeed faces challenges of rigid labour laws, poor
infrastructure, to name a few. Yet there is growing optimism that the
government at the Centre is pushing reforms and will take actions to create a
positive climate where dream of 'Make in India' becomes a reality. In the short
term, economic and industrial growth will largely depend on revival of
investment cycle. The year 2015, may prove to be a year in transition before
the economy moves to fast-track mid and long-term growth.
The
Company has strong fundamentals, follows robust customer and innovation focused
strategy, emphasises on operational excellence and constantly empowers and
motivates its people to pursue higher goals. This gives us confidence that the
Company is capable of meeting growing customer expectations and is well
prepared to benefit from medium and long-term growth of Indian economy.
MANAGEMENT DISCUSSION AND ANALYSIS
MACRO-ECONOMIC ENVIRONMENT
During
the year 2014, the global economy struggled to gain momentum. According to World
Bank's Economic Prospects report released in January 2015, global growth in
year 2014 was placed at 2.6%. The report mentions rise in economic activity in
United States while Euro area continues to give mixed signals and China seems
to be undergoing a carefully managed slowdown. Sharp decline in oil prices
since mid-2014 is expected to support economic activity especially in oil
importing developing economies. Overall, the report expects global economic
growth in year 2015 at 3.0% that is only slightly higher than year 2014.
At
home in India, after slowing to sub 5% in financial year 2013- 14, Indian
economy is showing signs of moderate growth momentum during the current fiscal
year 2014-15.
STATEMENT
STANDALONE UNAUDITED FINANCIAL RESULTS FOR THE QUARTER AND NINE MONTHS ENDED
30TH SEPTEMBER, 2015
Standalone statement of profit and loss
(Rs. In Millions)
|
Sr. No |
Particulars |
Standalone |
||
|
Quarter Ended |
Six Month Ended |
|||
|
30.09.2015 |
30.06.2015 |
30.09.2015 |
||
|
Unaudited |
Unaudited |
Unaudited |
||
|
1 |
Income From
Operations |
|
|
|
|
|
a. Net Sales/ Income from Operations (Net of Excise Duty) |
4349.000 |
4287.700 |
12689.300 |
|
|
b. Other Operating Income |
34.100 |
33.500 |
105.400 |
|
|
Total Income from
Operations (Net) |
4383.100 |
4321.200 |
12794.700 |
|
2 |
Expenditure |
|
|
|
|
|
a. Cost of material Consumed |
1601.600 |
1507.000 |
4564.200 |
|
|
b. Purchase of Stock-in trade |
1010.700 |
995.100 |
2823.900 |
|
|
c. Changes in inventory of finished Goods, work- in-progress and Stock-in-trade |
(84.700) |
(64.400 |
64.400) |
|
|
d. Employees Benefit Expenses |
338.400 |
329.200 |
1007.300 |
|
|
e. Depreciation and Amortisation Expenses |
128.000 |
124.200 |
376.700 |
|
|
f. Other expenses |
781.100 |
805.300 |
2325.200 |
|
|
Total Expenses |
3755.100 |
3696.400 |
11032.900 |
|
3 |
Profit from
Operations before Other Income, Interest and Exceptional Items |
628.000 |
624.800 |
1761.800 |
|
4 |
Other Income |
150.100 |
147.100 |
425.400 |
|
5 |
Profit from
ordinary activities before finance cost & exceptional items |
778.100 |
771.900 |
2187.200 |
|
6 |
Finance Costs |
2.600 |
10.400 |
17.800 |
|
7 |
Profit from
ordinary activities after finance costs & exceptional items |
776.500 |
761.500 |
2169.400 |
|
8 |
Exceptional items |
- |
- |
- |
|
9 |
Profit from
ordinary activities before tax |
775.500 |
761.500 |
2169.400 |
|
10 |
Tax Expense |
269.500 |
268.800 |
756.700 |
|
11 |
Net Profit from
ordinary activity after tax |
508.000 |
492.700 |
1412.700 |
|
12 |
Extraordinary Items |
- |
- |
- |
|
13 |
Net Profit After
Tax |
508.000 |
492.700 |
1412.700 |
|
14 |
Paid-up equity share capital (face value of Rs.10 per share) |
166.200 |
166.200 |
166.200 |
|
15 |
Reserves excluding Revaluation Reserve as per balance sheet of previous accounting Year |
- |
- |
- |
|
16 |
Earning Per Share (of Rs.10 each) (not annualized) |
|
|
|
|
|
Basic EPS |
30.45 |
29.65 |
85.00 |
|
|
Diluted EPS |
30.45 |
29.65 |
85.00 |
|
A |
PARTICULARS OF
SHAREHOLDING |
|
|
|
|
17 |
Public Shareholding |
|
|
|
|
|
- No. of shares |
8088087 |
8088087 |
8088087 |
|
|
- Percentage of shareholding |
48.70 |
78.70 |
48.70 |
|
18 |
Promoter &
Promoter Group Shareholding |
|
|
|
|
|
a) Pledged/Encumbered |
|
|
|
|
|
- No. of shares |
Nil |
Nil |
Nil |
|
|
- Percentage of shareholding (as a % of the total shareholding of promoter and promoter group) |
Nil |
Nil |
Nil |
|
|
- Percentage of shareholding (as a % of the total share capital of the company) |
Nil |
Nil |
Nil |
|
|
b) Non-encumbered |
|
|
|
|
|
- No. of shares |
8529183 |
8529183 |
8529183 |
|
|
- Percentage of shareholding (as a % of the total shareholding of promoter and promoter group) |
100.00% |
100.00% |
100.00% |
|
|
- Percentage of shareholding (as a % of the total share capital of the company) |
51.30% |
51.30% |
51.30% |
|
|
Particulars |
Quarter ended 30.09.2015 |
|
B |
Investor Complaints |
|
|
|
Pending at the beginning of the quarter |
- |
|
|
Received during the quarter |
- |
|
|
Disposed off during the quarter |
- |
|
|
Remaining unresolved at the end of the
quarter |
- |
INDEX OF CHARGES: NO
CHARGES EXIST FOR THE COMPANY
FIXED ASSETS:
·
Land
·
Building
·
Plant and Machinery
·
Computer
·
Vehicles
·
Furniture and Fixture
CMT REPORT (Corruption, Money Laundering & Terrorism]
The Public Notice information has been collected from various sources
including but not limited to: The Courts, India Prisons Service,
Interpol, etc.
1] INFORMATION ON DESIGNATED
PARTY
No exist designating subject or any of its beneficial owners,
controlling shareholders or senior officers as terrorist or terrorist
organization or whom notice had been received that all financial transactions
involving their assets have been blocked or convicted, found guilty or against
whom a judgement or order had been entered in a proceedings for violating
money-laundering, anti-corruption or bribery or international economic or
anti-terrorism sanction laws or whose assets were seized, blocked, frozen or
ordered forfeited for violation of money laundering or international
anti-terrorism laws.
2] Court Declaration :
No exist to suggest that subject is or was
the subject of any formal or informal allegations, prosecutions or other
official proceeding for making any prohibited payments or other improper
payments to government officials for engaging in prohibited transactions or
with designated parties.
3] Asset Declaration :
No records exist to suggest that the property or assets of the subject
are derived from criminal conduct or a prohibited transaction.
4] Record on Financial
Crime :
Charges or conviction
registered against subject: None
5] Records on Violation of
Anti-Corruption Laws :
Charges or investigation
registered against subject: None
6] Records on Int’l
Anti-Money Laundering Laws/Standards :
Charges or
investigation registered against subject: None
7] Criminal Records
No
available information exist that suggest that subject or any of its principals
have been formally charged or convicted by a competent governmental authority
for any financial crime or under any formal investigation by a competent
government authority for any violation of anti-corruption laws or international
anti-money laundering laws or standard.
8] Affiliation with
Government :
No record
exists to suggest that any director or indirect owners, controlling
shareholders, director, officer or employee of the company is a government
official or a family member or close business associate of a Government
official.
9] Compensation Package :
Our market
survey revealed that the amount of compensation sought by the subject is fair
and reasonable and comparable to compensation paid to others for similar
services.
10] Press Report :
No press reports / filings exists on
the subject.
CORPORATE GOVERNANCE
MIRA INFORM as part of its Due Diligence do provide comments on
Corporate Governance to identify management and governance. These factors often
have been predictive and in some cases have created vulnerabilities to credit
deterioration.
Our Governance Assessment focuses principally on the interactions
between a company’s management, its Board of Directors, Shareholders and other
financial stakeholders.
CONTRAVENTION
Subject is not known to have contravened any existing local laws,
regulations or policies that prohibit, restrict or otherwise affect the terms
and conditions that could be included in the agreement with the subject.
FOREIGN EXCHANGE RATES
|
Currency |
Unit
|
Indian Rupees |
|
US Dollar |
1 |
Rs.66.38 |
|
UK Pound |
1 |
Rs.100.45 |
|
Euro |
1 |
Rs.70.55 |
INFORMATION DETAILS
|
Information
Gathered by : |
SUP |
|
|
|
|
Analysis Done by
: |
KAR |
|
|
|
|
Report Prepared
by : |
RKI |
SCORE & RATING EXPLANATIONS
|
SCORE FACTORS |
RANGE |
POINTS |
|
HISTORY |
1~10 |
8 |
|
PAID-UP CAPITAL |
1~10 |
8 |
|
OPERATING SCALE |
1~10 |
9 |
|
FINANCIAL
CONDITION |
|
-- |
|
--BUSINESS SCALE |
1~10 |
9 |
|
--PROFITABILITY |
1~10 |
8 |
|
--LIQUIDITY |
1~10 |
9 |
|
--LEVERAGE |
1~10 |
8 |
|
--RESERVES |
1~10 |
9 |
|
--CREDIT LINES |
1~10 |
9 |
|
--MARGINS |
-5~5 |
-- |
|
DEMERIT POINTS |
|
|
|
--BANK CHARGES |
YES/NO |
NO |
|
--LITIGATION |
YES/NO |
NO |
|
--OTHER ADVERSE INFORMATION |
YES/NO |
NO |
|
MERIT POINTS |
|
|
|
--SOLE DISTRIBUTORSHIP |
YES/NO |
NO |
|
--EXPORT ACTIVITIES |
YES/NO |
NO |
|
--AFFILIATION |
YES/NO |
YES |
|
--LISTED |
YES/NO |
YES |
|
--OTHER MERIT FACTORS |
YES/NO |
YES |
|
DEFAULTER
|
|
|
|
--RBI |
YES/NO |
NO |
|
--EPF |
YES/NO |
NO |
|
|
|
|
|
TOTAL |
|
77 |
This score serves as a reference to assess
SC’s credit risk and to set the amount of credit to be extended. It is
calculated from a composite of weighted scores obtained from each of the major
sections of this report. The assessed factors and their relative weights (as
indicated through %) are as follows:
Financial
condition (40%) Ownership
background (20%) Payment
record (10%)
Credit history
(10%) Market trend (10%) Operational size
(10%)
RAING EXPLANATIONS
|
RATING |
STATUS |
PROPOSED CREDIT LINE |
|
|
>86 |
Aaa |
Possesses an extremely sound financial base with the strongest
capability for timely payment of interest and principal sums |
Unlimited |
|
71-85 |
Aa |
Possesses adequate working capital. No caution needed for credit
transaction. It has above average (strong) capability for payment of interest
and principal sums |
Large |
|
56-70 |
A |
Financial & operational base are regarded healthy. General unfavourable
factors will not cause fatal effect. Satisfactory capability for payment of
interest and principal sums |
Fairly Large |
|
41-55 |
Ba |
Overall operation is considered normal. Capable to meet normal
commitments. |
Satisfactory |
|
26-40 |
B |
Capability to overcome financial difficulties seems comparatively
below average. |
Small |
|
11-25 |
Ca |
Adverse factors are apparent. Repayment of interest and principal sums
in default or expected to be in default upon maturity |
Limited with full
security |
|
<10 |
C |
Absolute credit risk exists. Caution needed to be exercised |
Credit not
recommended |
|
NB |
NEW BUSINESS |
||
This report is issued at your request without any
risk and responsibility on the part of MIRA INFORM PRIVATE LIMITED (MIPL) or
its officials.