MIRA INFORM REPORT
|
Report No. : |
306144 |
|
Report Date : |
05.02.2015 |
IDENTIFICATION DETAILS
|
Name : |
THE K C P LIMITED |
|
|
|
|
Registered
Office : |
“Ramakrishna
Buildings”, No.2, Dr. P.V. Cherian Crescent, Egmore, Chennai
– 600 008, Tamilnadu |
|
|
|
|
Country : |
India |
|
|
|
|
Financials (as
on) : |
31.03.2014 |
|
|
|
|
Date of
Incorporation : |
03.07.1941 |
|
|
|
|
Com. Reg. No.: |
18-001128 |
|
|
|
|
Capital
Investment / Paid-up Capital : |
Rs.208.921 millions |
|
|
|
|
CIN No.: [Company Identification
No.] |
L65991TN1941PLC001128 |
|
|
|
|
IEC No.: |
Not Available |
|
|
|
|
TAN No.: [Tax Deduction &
Collection Account No.] |
CHET00160G |
|
|
|
|
PAN No.: [Permanent Account No.] |
Not Available |
|
|
|
|
Legal Form : |
Public Limited Liability Company. The Company’s Shares are Listed on
the Stock Exchanges. |
|
|
|
|
Line of Business
: |
Subject manufactures and sells cement; and a range of heavy equipment for industries, such as power, oil and gas, refinery, power, bulk materials handling, mining and metals, sugar, cement, and other industries. It also generates power using hydel, wind, waste heat, and thermal plants. In addition, the company manufactures a range of natural coloring products comprising bixin, norbixin, curcumin, turmeric oleoresin, paprika oleoresin, and capsicum oleoresin for food, cosmetic, and pharmaceutical industries; and refined and white sugar. Further, it offers information technology and consulting services. |
|
|
|
|
No. of Employees
: |
Not Available |
RATING & COMMENTS
|
MIRA’s Rating : |
Ba (43) |
|
RATING |
STATUS |
PROPOSED CREDIT LINE |
|
|
41-55 |
Ba |
Overall operation is considered normal. Capable to meet normal
commitments. |
Satisfactory |
|
Maximum Credit Limit : |
USD 10383000 |
|
|
|
|
Status : |
Satisfactory |
|
|
|
|
Payment Behaviour : |
Usually Correct |
|
|
|
|
Litigation : |
Not Available |
|
|
|
|
Comments : |
Subject is an
established company having satisfactory track record. Sales turnover of
the company has declined which has resulted into sharp dip in profit of the
company during financial year 2014. However, the
rating takes into consideration company’s established track record in the
cement and engineering sectors supported by sound financial base and fair
liquidity position of the company. Trade relations
are fair. Business is active. Payment terms are reported to be usually
correct. The company can
be considered for business dealings at usual trade terms and condition. |
NOTES :
Any query related to this report can be made
on e-mail : infodept@mirainform.com
while quoting report number, name and date.
ECGC Country Risk Classification List – December 31, 2014
|
Country Name |
Previous Rating (30.09.2014) |
Current Rating (31.12.2014) |
|
India |
A1 |
A1 |
|
Risk Category |
ECGC
Classification |
|
Insignificant |
A1 |
|
Low |
A2 |
|
Moderate |
B1 |
|
High |
B2 |
|
Very High |
C1 |
|
Restricted |
C2 |
|
Off-credit |
D |
EXTERNAL AGENCY RATING
|
Rating Agency Name |
CRISIL |
|
Rating |
Long Term Rating: BBB+ |
|
Rating Explanation |
Moderate degree of safety and moderate credit risk. |
|
Date |
22.05.2014 |
|
Rating Agency Name |
CRISIL |
|
Rating |
Short Term Rating: A2 |
|
Rating Explanation |
Strong degree of safety and low credit risk. |
|
Date |
22.05.2014 |
RBI DEFAULTERS’ LIST STATUS
Subject’s name is not enlisted as a defaulter
in the publicly available RBI Defaulters’ list.
EPF (Employee Provident Fund) DEFAULTERS’ LIST STATUS
Subject’s name is not enlisted as a defaulter
in the publicly available EPF (Employee Provident Fund) Defaulters’ list as of
31-03-2014.
LOCATIONS
|
Registered Office/ Corporate Office : |
“Ramakrishna
Buildings”, No.2, Dr. P.V. Cherian Crescent, Egmore,
Chennai – 600 008, Tamilnadu, India |
|
Tel. No. : |
91-44-66772600 |
|
Fax No. : |
91-44-66772620 |
|
E-Mail : |
|
|
Website : |
|
|
|
|
|
Factory 1 : |
CEMENT Macherla
– 522 426, Guntur
District, Andhra Pradesh, India |
|
|
|
|
Factory 2 : |
CEMENT Krishna
District, Andhra Pradesh, India |
|
|
|
|
Factory 3 : |
HYDEL B.No.AE-1, NSP Colony, Nekarikallu, Guntur District – 522
615, Andhra Pradesh, India |
|
|
|
|
Factory 4 : |
THERMAL Macherla, Guntur District – 522 426, Andhra Pradesh, India |
|
|
|
|
Factory 5 : |
ENGINEERING Tiruvottiyur, Chennai – 600 019,
Tamilnadu, India |
|
|
|
|
Factory 6 : |
ENGINEERING Arakonam, Mosur Road, Ekhunagar – 631 004, Tamilnadu, India |
|
|
|
|
Factory 7 : |
WIND
POWER Uthumalai
Village, Tirunelveli District, Tamilnadu, India |
|
|
|
|
Factory 8 : |
BIOTECH Plot No.14, A.K. Park,
Genome Valley, Turkapally (Village), Shameerpet (Mandal), R.R. District – 500
078, Telangana,
India |
DIRECTORS
AS ON 31.03.2014
|
Name : |
Dr. V.L. Dutt |
|
Designation : |
Chairman
and Managing Director |
|
|
|
|
Name : |
Mrs. V.L. Indira Dutt |
|
Designation : |
Joint
Managing Director |
|
|
|
|
Name : |
Mrs. Kavitha D. Chitturi |
|
Designation : |
Executive
Director |
|
|
|
|
Name : |
Mr. V. Gandhi |
|
Designation : |
Technical
Director |
|
|
|
|
Name : |
Mr. O. Swaminatha Reddy |
|
Designation : |
Independent Director |
|
|
|
|
Name : |
Mr. V.H. Ramakrishnan |
|
Designation : |
Independent Director |
|
|
|
|
Name : |
Mr. Vijay Sankar |
|
Designation : |
Independent Director |
|
|
|
|
Name : |
Mr. P.S. Kumar |
|
Designation : |
Independent Director |
|
|
|
|
Name : |
Mr. M. Narasimhappa |
|
Designation : |
Independent Director |
KEY EXECUTIVES
|
Name : |
Mr. M.R. Ramachandran |
|
Designation : |
Chief Financial Officer |
|
|
|
|
Name : |
Mr. Y. Vijaya Kumar |
|
Designation : |
Company Secretary |
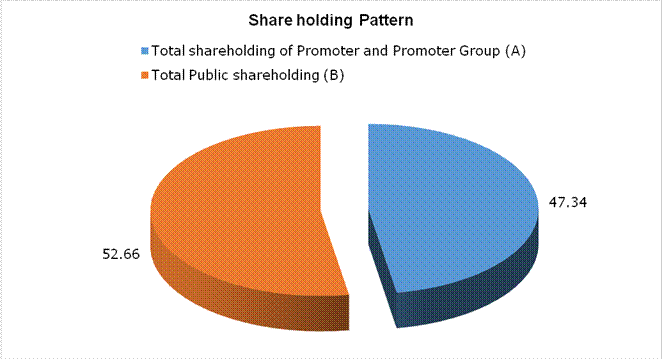
MAJOR SHAREHOLDERS / SHAREHOLDING PATTERN
AS ON 31.12.2014
|
Category of Shareholders |
No. of Shares |
Percentage of
holding |
|
(A)
Shareholding of Promoter and Promoter Group |
|
|
|
|
|
|
|
|
11974748 |
9.29 |
|
|
48813026 |
37.86 |
|
|
60787774 |
47.15 |
|
|
|
|
|
|
239050 |
0.19 |
|
|
239050 |
0.19 |
|
Total
shareholding of Promoter and Promoter Group (A) |
61026824 |
47.34 |
|
(B)
Public Shareholding |
|
|
|
|
|
|
|
|
14958093 |
11.60 |
|
|
46400 |
0.04 |
|
|
1302930 |
1.01 |
|
|
16307423 |
12.65 |
|
|
|
|
|
|
5001303 |
3.88 |
|
|
|
|
|
|
25790887 |
20.01 |
|
|
17927221 |
13.91 |
|
|
2867502 |
2.22 |
|
|
267996 |
0.21 |
|
|
2141113 |
1.66 |
|
|
66561 |
0.05 |
|
|
391832 |
0.30 |
|
|
51586913 |
40.01 |
|
Total
Public shareholding (B) |
67894336 |
52.66 |
|
Total
(A)+(B) |
128921160 |
100.00 |
|
(C)
Shares held by Custodians and against which Depository Receipts have been
issued |
0 |
0.00 |
|
|
0 |
0.00 |
|
|
0 |
0.00 |
|
|
0 |
0.00 |
|
Total
(A)+(B)+(C) |
128921160 |
0.00 |
BUSINESS DETAILS
|
Line of Business : |
Subject manufactures and sells cement; and a range of heavy equipment for industries, such as power, oil and gas, refinery, power, bulk materials handling, mining and metals, sugar, cement, and other industries. It also generates power using hydel, wind, waste heat, and thermal plants. In addition, the company manufactures a range of natural coloring products comprising bixin, norbixin, curcumin, turmeric oleoresin, paprika oleoresin, and capsicum oleoresin for food, cosmetic, and pharmaceutical industries; and refined and white sugar. Further, it offers information technology and consulting services. |
|
|
|
|
Products/ Services : |
|
|
|
|
|
Brand Names : |
Not Available |
|
|
|
|
Agencies Held : |
Not Available |
|
|
|
|
Exports : |
Not Available |
|
|
|
|
Imports : |
Not Available |
|
|
|
|
Terms : |
Not Available |
PRODUCTION STATUS –
NOT AVAILABLE
GENERAL INFORMATION
|
Suppliers : |
|
|||||||||||||||||||||||||||||||||||||||||||||||||||||||||
|
|
|
|||||||||||||||||||||||||||||||||||||||||||||||||||||||||
|
Customers : |
|
|||||||||||||||||||||||||||||||||||||||||||||||||||||||||
|
|
|
|||||||||||||||||||||||||||||||||||||||||||||||||||||||||
|
No. of Employees : |
Not Available |
|||||||||||||||||||||||||||||||||||||||||||||||||||||||||
|
|
|
|||||||||||||||||||||||||||||||||||||||||||||||||||||||||
|
Bankers : |
·
Bank of India, Chennai Corporate Banking Branch, IV Floor, Tarapore
Towers, 826, Anna Salai, Chennai – 600 002, Tamilnadu, India ·
Indian Overseas Bank, Mid Corporate Branch, 581, Navins Plaza,
Teynampet, Chennai – 600 006, Tamilnadu, India ·
Canara Bank, Mount Road Branch, 781-785, Anna Salai, Chennai – 600
002, Tamilnadu, India |
|||||||||||||||||||||||||||||||||||||||||||||||||||||||||
|
|
|
|||||||||||||||||||||||||||||||||||||||||||||||||||||||||
|
Facilities : |
Notes: LONG TERM
BORROWINGS Term loans from banks for
Cement plant at Muktyala are Secured by Paripassu First Charge on the Fixed
Assets, paripassu Second charge on the current assets and charge on the
leasehold rights of the leased Lands of the Muktyala Cement Division. The
rate of interest of the abovesaid loan ranges between Base Rate plus margin
2% to 3% The long Terms loans
obtained for Cement Plant at Muktyala are repayable in 28 Quarterly
Installments of Rs.72.600 millions each with effect from 30th June 2011. Term loan obtained for
Hotel project at Hyderabad is secured by First charge on the land, building
and other assets of the company at Somajiguda Hyderabad. The rate of interest
of the abovesaid loan is Base Rate plus margin 2%. The long term loan
obtained for Hotel project is repayable in 28 quarterly instalments of
Rs.16.100 millions with last instalment being Rs.15.300 millions with holiday
period of 39 months which includes construction period of 15 months and 24
months of gestation period. Additional Term loan of
Rs.147.300 millions obtained for Hotel Project is repayable in 28 quarterly
instalments of Rs.5.300 millions after holiday period of 18 months. First
instalment of both the loans for Hotel Project falls due in June 2015. Term Loan obtained for
the Captive Power Plant Muktyala is secured by the First Charge on the fixed
Assets of the Captive Power Plant Muktyala. The rate of interest of the
abovesaid loan is Base Rate plus margin 1.75% The long Term loans
obtained Captive Power Plant Muktyala are repayable in 32 Quarterly
Instalments of Rs.24.900 millions with the last instalment being Rs.24.500
millions each with an initial moratorium period of two years from the date of
first disbursement. First instalment falls due on March’ 2015. Term Loan obtained for
the Cement Plant Macherla is secured by the First Charge on the fixed Assets
(both present and proposed out of the loan) and second charge on the current
assets of the Cement Division at Macherla. The rate of interest of the
abovesaid loan is Base Rate plus margin 2%. The long Term loans
obtained for Cement Plant at Macherla are repayable in 28 Quarterly
Installments of Rs.7.500 millions each with an initial moratorium period of
two years from the date of first disbursement. First instalment falls due in
December 2014. Term Loan of Rs.120.000
millions obtained for working capital and business operations is secured by
Equitable Mortgage on properties at Visakhapatnam, Mumbai and Hyderabad. The
rate of interest of this loan is Base Rate plus margin 2%. This loan is repayable in
4 equal half yearly instalments of Rs.30.000 millions after 1 year
moratorium. Term Loan of Rs.560.000
millions obtained for shoring up working capital is secured by Exclusive
charge on land near Chennai. The rate of interest of the abovesaid loan is
Base Rate plus margin 2%. This
loan is repayable in 20 quarterly instalments of Rs.28.000 millions after 2
years moratorium. SHORT TERM BORROWINGS
|
|
Banking
Relations : |
-- |
|
|
|
|
Auditors : |
|
|
Name : |
Brahmayya and Company Chartered
Accountants |
|
Address : |
Vijayawada, Andhra
Pradesh, India |
|
|
|
|
Cost
Auditors : |
|
|
Name : |
Narasimhamurthy
and Company Cost Accountants |
|
Address : |
Hyderabad, Telangana,
India |
|
|
|
|
Name : |
S. Mahadevan and Company Cost Accountants |
|
Address : |
Chennai, Tamilnadu, India
|
|
|
|
|
Internal
Auditors : |
|
|
Name : |
R.G.N. Price and Company |
|
Address : |
Chennai, Tamilnadu, India
|
|
|
|
|
Name : |
M. Bhaskara Rao and Company |
|
Address : |
Hyderabad, Telangana,
India |
|
|
|
|
|
|
|
Memberships : |
Not Available |
|
|
|
|
Collaborators : |
Not Available |
|
|
|
|
Subsidiary
Company : |
KCP
Vietnam Industries Limited |
|
|
|
|
Joint
Venture Company : |
Fives
Cail KCP Limited |
|
|
|
|
Companies/ Trusts
controlled by Key Management Personnel/ Relatives : |
|
CAPITAL STRUCTURE
AS ON 31.03.2014
Authorised Capital :
|
No. of Shares |
Type |
Value |
Amount |
|
350000000 |
Equity Shares |
Re.10/- each |
Rs.350.000 millions |
|
20000000 |
12%
Redeemable Cumulative Non-Convertible Preference Shares |
Rs.10/- each |
Rs.200.000 millions |
|
|
Total
|
|
Rs.550.000 millions |
|
|
|
|
|
Issued Capital :
|
No. of Shares |
Type |
Value |
Amount |
|
128977480 |
Equity Shares |
Re.10/- each |
Rs.128.977 millions |
|
20000000 |
12% Redeemable Cumulative
Non-Convertible Preference Shares |
Rs.10/- each |
Rs.200.000 millions |
|
|
Total
|
|
Rs.328.977
millions |
|
|
|
|
|
Subscribed & Paid-up Capital :
|
No. of Shares |
Type |
Value |
Amount |
|
128921160 |
Equity Shares |
Re.10/- each |
Rs.128.921 millions |
|
8000000 |
12% Redeemable Cumulative
Non-Convertible Preference Shares |
Rs.10/- each |
Rs.80.000 millions |
|
|
Total
|
|
Rs.208.921
millions |
|
|
|
|
|
Notes:
Details of shareholders holding more than 5% share in the company:
1. V. Ramakrishna Sons Private
Limited - 38956326 equity shares of 1/- each fully paid - 30.22%
2. V.R.K. Grandsons
Investments Private Limited - 9578330 equity shares of 1/- each fully
paid-7.43%
3. SBI Emerging Business
Fund 8438792 equity shares of 1/- each fully paid up – 6.55%
4. Tata Capital Financial
Services Limited – 8000000 Preference shares of Rs.10/- each fully paid – 100%.
The reconciliation of the Opening and Closing balance of the Subscribed
and Paid-up equity and Preference shares of the company is set out below:
|
Particulars |
31.03.2014 (Rs. in
millions) |
|
Equity
Share Capital at the beginning of the Year |
128.921 |
|
12% Redeemable cumulative
Non-convertible Preference shares at the beginning of the year |
150.000 |
|
Less: 70,00,000 12% Redeemable cumulative
Non-convertible Preference shares of Rs.10 each redeemed during the year |
70.000 |
|
Issued Subscribed and
Fully paid up capital at the end of the year |
208.921 |
Preference Shares are redeemable within a period of five years but after
the expiry of two years of the completion date (i.e., share allotment date -
09/12/2009) in the following manner:
(i) In the third year
Rs.50.000 millions
(ii) In the fourth year
Rs.70.000 millions
(iii) In the fifth year
Rs.80.000 millions
During the year the company
has redeemed 7000000 12% Redeemable Cumulative, Non-Convertible of Rs.10 each
along with prorata interim dividend.
FINANCIAL DATA
[all figures are
in Rupees Millions]
ABRIDGED BALANCE
SHEET
|
SOURCES OF FUNDS |
31.03.2014 |
31.03.2013 |
31.03.2012 |
|
I.
EQUITY
AND LIABILITIES |
|
|
|
|
(1)
Shareholders' Funds |
|
|
|
|
(a) Share Capital |
208.921 |
278.921 |
328.921 |
|
(b) Reserves & Surplus |
3424.950 |
3445.826 |
3316.842 |
|
(c) Money
received against share warrants |
0.000 |
0.000 |
0.000 |
|
|
|
|
|
|
(2)
Share Application money pending allotment |
0.000 |
0.000 |
0.000 |
|
Total
Shareholders’ Funds (1) + (2) |
3633.871 |
3724.747 |
3645.763 |
|
|
|
|
|
|
(3) Non-Current
Liabilities |
|
|
|
|
(a) Long-term borrowings |
3125.185 |
1948.195 |
1762.658 |
|
(b) Trade payables |
4.526 |
2.608 |
3.329 |
|
(c) Deferred tax liabilities (Net) |
576.348 |
575.854 |
489.251 |
|
(d) Other long term
liabilities |
316.418 |
314.415 |
191.412 |
|
(e) Long-term provisions |
39.694 |
36.467 |
26.122 |
|
Total Non-current
Liabilities (3) |
4062.171 |
2877.539 |
2472.772 |
|
|
|
|
|
|
(4) Current Liabilities |
|
|
|
|
(a) Short
term borrowings |
890.251 |
1186.869 |
824.420 |
|
(b) Trade
payables |
570.361 |
540.187 |
371.711 |
|
(c) Other
current liabilities |
1149.662 |
1322.156 |
1500.645 |
|
(d) Short-term
provisions |
32.244 |
183.980 |
318.888 |
|
Total Current
Liabilities (4) |
2642.518 |
3233.192 |
3015.664 |
|
|
|
|
|
|
TOTAL |
10338.560 |
9835.478 |
9,134.199 |
|
|
|
|
|
|
II.
ASSETS |
|
|
|
|
(1) Non-current assets |
|
|
|
|
(a) Fixed Assets |
|
|
|
|
(i)
Tangible assets |
5138.937 |
5066.363 |
5209.909 |
|
(ii)
Intangible Assets |
2.389 |
0.000 |
0.000 |
|
(iii) Capital
work-in-progress |
1503.936 |
997.488 |
227.525 |
|
(iv)
Intangible assets under development |
0.000 |
0.000 |
0.000 |
|
(b) Non-current Investments |
288.981 |
288.981 |
288.960 |
|
(c) Deferred tax assets (net) |
0.000 |
0.000 |
0.000 |
|
(d) Long-term Loan and Advances |
506.189 |
543.712 |
141.793 |
|
(e)
Trade receivables |
15.393 |
11.714 |
11.247 |
|
(f) Other
Non-current assets |
8.257 |
4.506 |
0.000 |
|
Total Non-Current
Assets |
7464.082 |
6912.764 |
5879.434 |
|
|
|
|
|
|
(2) Current assets |
|
|
|
|
(a)
Current investments |
0.000 |
0.000 |
0.000 |
|
(b)
Inventories |
1235.272 |
1183.566 |
1483.955 |
|
(c) Trade
receivables |
451.829 |
482.099 |
743.756 |
|
(d) Cash
and cash equivalents |
196.036 |
525.818 |
350.405 |
|
(e)
Short-term loans and advances |
915.594 |
651.688 |
643.277 |
|
(f) Other
current assets |
75.747 |
79.543 |
33.372 |
|
Total
Current Assets |
2874.478 |
2922.714 |
3254.765 |
|
|
|
|
|
|
TOTAL |
10338.560 |
9835.478 |
9134.199 |
PROFIT & LOSS
ACCOUNT
|
|
PARTICULARS |
31.03.2014 |
31.03.2013 |
31.03.2012 |
|
|
|
SALES |
|
|
|
|
|
|
|
Revenue from operations (Net) |
6221.898 |
6997.054 |
6004.769 |
|
|
|
Other Income |
346.598 |
776.339 |
392.900 |
|
|
|
TOTAL |
6568.496 |
7773.393 |
6397.669 |
|
|
|
|
|
|
|
|
Less |
EXPENSES |
|
|
|
|
|
|
|
Cost of Raw Materials and Components consumed |
1326.489 |
1520.814 |
1313.610 |
|
|
|
[Increase]/Decrease in Inventories of finished goods,
Work-in-progress and traded goods |
144.382 |
(5.075) |
(111.165) |
|
|
|
Employee Benefits expense |
524.954 |
512.548 |
525.937 |
|
|
|
Other expenses |
3772.378 |
4560.850 |
3148.516 |
|
|
|
Exceptional Items (Net) |
0.000 |
49.319 |
0.000 |
|
|
|
TOTAL |
5768.203 |
6638.456 |
4876.898 |
|
|
|
|
|
|
|
|
|
PROFIT/
(LOSS) BEFORE INTEREST, TAX,
DEPRECIATION AND AMORTISATION |
800.293 |
1134.937 |
1520.771 |
|
|
|
|
|
|
|
|
|
Less |
FINANCIAL
EXPENSES |
447.342 |
381.234 |
379.498 |
|
|
|
|
|
|
|
|
|
|
PROFIT / (LOSS)
BEFORE TAX, DEPRECIATION AND AMORTISATION |
352.951 |
753.703 |
1141.273 |
|
|
|
|
|
|
|
|
|
Less/ Add |
DEPRECIATION/
AMORTISATION |
340.920 |
319.761 |
293.470 |
|
|
|
|
|
|
|
|
|
|
PROFIT/
(LOSS) BEFORE TAX |
12.031 |
433.942 |
847.803 |
|
|
|
|
|
|
|
|
|
Less |
TAX |
(0.734) |
129.388 |
232.469 |
|
|
|
|
|
|
|
|
|
|
PROFIT/
(LOSS) AFTER TAX |
12.765 |
304.554 |
615.334 |
|
|
|
|
|
|
|
|
|
|
EARNINGS IN
FOREIGN CURRENCY |
|
|
|
|
|
|
|
F.O.B. value of goods exported during the year |
313.322 |
114.030 |
49.220 |
|
|
|
Income from Service charge |
0.722 |
1.512 |
0.000 |
|
|
|
Income from Investments held in Foreign Companies |
150.444 |
438.952 |
284.142 |
|
|
TOTAL EARNINGS |
464.488 |
554.494 |
333.362 |
|
|
|
|
|
|
|
|
|
|
IMPORTS |
|
|
|
|
|
|
|
Raw Materials and Stock-in-Trade |
3.053 |
13.726 |
12.270 |
|
|
|
Components, Spares parts and Consumables |
884.356 |
745.099 |
689.130 |
|
|
|
Tools |
0.590 |
0.040 |
0.235 |
|
|
|
Capital goods |
8.560 |
17.590 |
8.304 |
|
|
TOTAL IMPORTS |
896.559 |
776.455 |
709.939 |
|
|
|
|
|
|
|
|
|
|
Earnings /
(Loss) Per Share (Rs.) |
0.04 |
2.16 |
4.56 |
|
QUARTERLY RESULTS
|
PARTICULARS |
|
30.06.2014 |
30.09.2014 |
|
Unaudited |
|
1st
Quarter |
2nd
Quarter |
|
Net
Sales |
|
1356.900 |
1485.700 |
|
Total
Expenditure |
|
1304.100 |
1167.900 |
|
PBIDT
(Excl OI) |
|
52.800 |
317.800 |
|
Other
Income |
|
39.300 |
9.600 |
|
Operating
Profit |
|
92.100 |
327.400 |
|
Interest |
|
116.000 |
119.500 |
|
Exceptional
Items |
|
0.000 |
0.000 |
|
PBDT |
|
(23.900) |
207.900 |
|
Depreciation |
|
85.300 |
88.100 |
|
Profit
Before Tax |
|
(109.200) |
119.800 |
|
Tax |
|
(33.800) |
30.400 |
|
Provisions
and contingencies |
|
0.000 |
0.000 |
|
Profit
After Tax |
|
(75.400) |
89.400 |
KEY RATIOS
|
PARTICULARS |
|
31.03.2014 |
31.03.2013 |
31.03.2012 |
|
Net Profit Margin (PAT/Sales) |
(%) |
0.21 |
4.35 |
10.25 |
|
|
|
|
|
|
|
Operating Profit Margin (PBDIT/ Sales) |
(%) |
12.86 |
16.22 |
25.33 |
|
|
|
|
|
|
|
Return on Total Assets (PBT/Total Assets} |
(%) |
0.14 |
5.08 |
9.85 |
|
|
|
|
|
|
|
Return on Investment (ROI) (PBT/Networth) |
|
0.00 |
0.12 |
0.23 |
|
|
|
|
|
|
|
Debt Equity Ratio (Total Debt/Networth) |
|
1.11 |
0.84 |
0.71 |
|
|
|
|
|
|
|
Current Ratio (Current Asset/Current Liability) |
|
1.09 |
0.90 |
1.08 |
FINANCIAL ANALYSIS
[all figures are
in Rupees Millions]
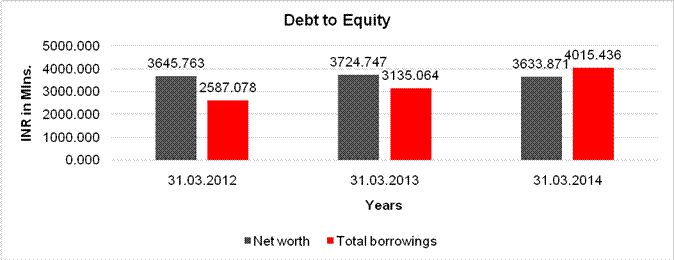
DEBT EQUITY RATIO
|
Particular |
31.03.2012 |
31.03.2013 |
31.03.2014 |
|
|
(INR in Mlns.) |
(INR in Mlns.) |
(INR in Mlns.) |
|
Share Capital |
328.921 |
278.921 |
208.921 |
|
Reserves & Surplus |
3316.842 |
3445.826 |
3424.950 |
|
Money received against share warrants |
0.000 |
0.000 |
0.000 |
|
Share Application money pending allotment |
0.000 |
0.000 |
0.000 |
|
Net worth |
3645.763 |
3724.747 |
3633.871 |
|
|
|
|
|
|
Long Term borrowings |
1762.658 |
1948.195 |
3125.185 |
|
Short Term borrowings |
824.420 |
1186.869 |
890.251 |
|
Total borrowings |
2587.078 |
3135.064 |
4015.436 |
|
Debt/Equity ratio |
0.710 |
0.842 |
1.105 |
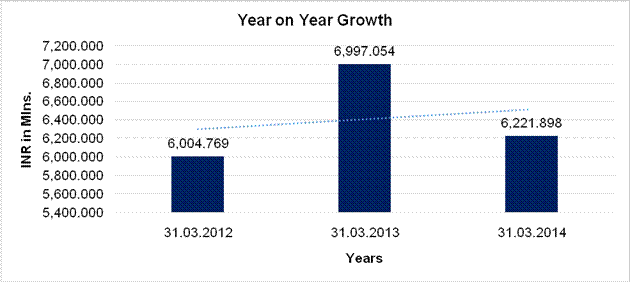
YEAR-ON-YEAR GROWTH
|
Year on Year Growth |
31.03.2012 |
31.03.2013 |
31.03.2014 |
|
|
(INR in Mlns) |
(INR in Mlns) |
(INR in Mlns) |
|
Revenue from operations (Net) |
6,004.769 |
6,997.054 |
6,221.898 |
|
|
|
16.525 |
(11.078) |
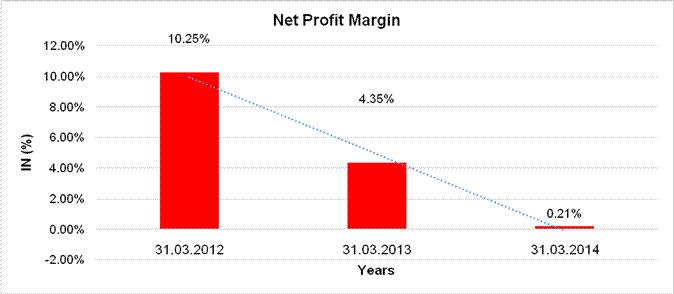
NET PROFIT MARGIN
|
Net Profit Margin |
31.03.2012 |
31.03.2013 |
31.03.2014 |
|
|
(INR in Mlns) |
(INR in Mlns) |
(INR in Mlns) |
|
Revenue from operations (Net) |
6,004.769 |
6,997.054 |
6,221.898 |
|
Profit |
615.334 |
304.554 |
12.765 |
|
|
10.25% |
4.35% |
0.21% |
LOCAL AGENCY FURTHER INFORMATION
|
Sr. No. |
Check List by Info Agents |
Available in
Report (Yes / No) |
|
1] |
Year of Establishment |
Yes |
|
2] |
Locality of the firm |
Yes |
|
3] |
Constitutions of the firm |
Yes |
|
4] |
Premises details |
No |
|
5] |
Type of Business |
Yes |
|
6] |
Line of Business |
Yes |
|
7] |
Promoter's background |
No |
|
8] |
No. of employees |
No |
|
9] |
Name of person contacted |
No |
|
10] |
Designation of contact
person |
No |
|
11] |
Turnover of firm for last
three years |
Yes |
|
12] |
Profitability for last
three years |
Yes |
|
13] |
Reasons for variation
<> 20% |
----- |
|
14] |
Estimation for coming
financial year |
No |
|
15] |
Capital in the business |
Yes |
|
16] |
Details of sister
concerns |
Yes |
|
17] |
Major suppliers |
No |
|
18] |
Major customers |
No |
|
19] |
Payments terms |
No |
|
20] |
Export / Import details
(if applicable) |
No |
|
21] |
Market information |
----- |
|
22] |
Litigations that the firm
/ promoter involved in |
----- |
|
23] |
Banking Details |
Yes |
|
24] |
Banking facility details |
Yes |
|
25] |
Conduct of the banking
account |
----- |
|
26] |
Buyer visit details |
----- |
|
27] |
Financials, if provided |
Yes |
|
28] |
Incorporation details, if
applicable |
Yes |
|
29] |
Last accounts filed at
ROC |
Yes |
|
30] |
Major Shareholders, if
available |
Yes |
|
31] |
Date of Birth of
Proprietor/Partner/Director, if available |
No |
|
32] |
PAN of Proprietor/Partner/Director,
if available |
No |
|
33] |
Voter ID No of
Proprietor/Partner/Director, if available |
No |
|
34] |
External Agency Rating,
if available |
Yes |
YEAR IN RETROSPECT:
Cement
·
The
cement despatches and the average price realization were lower than the
previous year, but economy in power cost and in the cost of logistics and
transportation and market distribution resulted in the company’s operations for
the year being considerably better than in the corresponding year.
·
Production
also was significantly lower than the previous year.
·
The
various incentives also contributed to the improvement in the operations though
the realization of the same have not yet materialized.
·
Wide
disparity witnessed in the price of cement across the geographical segments of
India resulted in highly skewed profitability.
·
Export
of cement to nearby countries commenced in a modest way.
Engineering:
·
The
slowdown of the global economy and the sluggishness of the Indian economy
resulted in the significant impact in the year. The company had to resort to
taking up low contributory sales for better utilization of the capacity Power:
Power:
·
All
the present captive power units reported gratifying results thanks to a good
monsoon and a reasonable wind pattern last year.
·
The
company erected and commissioned a Solar Power Plant of 1.15MW at Muktyala for
its captive use.
MANAGEMENT
DISCUSSION AND ANALYSIS REPORT:
Projects under
implementation:
·
The
Captive Power Plant with a capacity of 18MW was originally envisaged with a
total outlay of Rs.1130.000 millions. The revised project has gone up
marginally to Rs.1190.000 millions. Implementation of the same is nearing
completion and commissioning is expected in this quarter.
·
The
Hotel, on the other hand suffered overruns both in terms of commissioning time
and the cost due to various factors some outside the control of the company.
The project which was envisaged at Rs.650.000 millions is now estimated to cost
around Rs.850.000 millions.
Exit from Biotech Division
Further to the approval of
the shareholders on 31/01/2013 by way of Postal ballot, the company is in the
process of selling of its Fixed Assets in the Biotech business.
Overall
company Performance:
The overall operations of
the company were deeply affected by the following factors which cumulatively
impacted the profitability:
·
The
stagnant status of the demand for cement especially in the South coupled with
steep oversupply in the region resulted in pulling the prices of cement even
below the cost rendering whole operations unprofitable.
·
The
widely prevailing gloom in the economy both in the country and throughout the
world resulted in the Engineering Division’s marginal loss.
Notwithstanding the above
negativity, the following redeeming factors were however witnessed.
·
Power
Division however reflected a highly rewarding and profitable operation with all
segments like Hydel, Waste Heat Recovery and Wind Power performing creditably.
The small Solar plant commissioned during the year also contributed its mite in
making the Power Division’s operations satisfying.
·
Dividend
from the subsidiary was also beneficial in company achieving a break even in
its overall operations.
CEMENT DIVISION:
Operational
Performance:
The cement operations were
in fact a shade better than the previous year mainly on account of the
following factors:
·
Keeping
in mind the high logistical costs, cement despatches were so effected so as to
optimize on the logistics costs and also cater to the nearby markets to the
extent possible.
·
Following
a year of good monsoon, power cuts and load shedding were at a minimum scale
which led to lower power cost.
Overview:
Indian cement industry has a
pride of place, being the second largest cement producer in the world. It has
made rapid strides not only in terms of capacity addition but also in producing
world-class quality cement from state-of-the art technology. Indian cement
industry today accounts for about 7 per cent of the global production.
Cement, being a bulk
commodity, is a freight intensive industry and transporting it over long
distances can prove to be uneconomical. This has resulted in cement being
largely a regional play with the industry divided into five main regions viz.
north, south, west, east and the central region.
The Southern region of
India has the highest installed capacity, accounting for about one-third of the
country’s total installed cement capacity. Among the Southern States, Andhra
Pradesh where both the cement units of the company are situated, accounted for
a significant share of the enhanced capacity with a negative growth in demand.
This directly impacted the profitability of the local cement players.
Outlook:
In the midst of the
consolidation taking place, the outlook for the commodity would be influenced
by the following factors:
·
The
demand-supply situation is highly skewed with the latter being significantly
higher
·
High
capital costs and long gestation periods. Access to limestone reserves (key
input) also acts as a signify cant entry barrier.
·
Intense
competition with players expanding reach and achieving pan India presence. The
industry is a lot more consolidated than a couple of decades ago with a few
large players controlling substantial market share.
·
Cement,
in spite of being classified as a commodity is simultaneously witnessing few
brands commanding a premium on account of better quality perception.
The company is fully aware
of the challenges and is making all efforts to give out a better product with
distinctly featured properties. Export is an area that is being addressed in
order to fill in the capacity even though it hardly gives any contribution.
POWER DIVISION:
A) HYDEL POWER UNIT:
Operational
Performance:
The Macherla cement plant
has an assured supply of power from Hydel and Waste Heat Recovery plant while
the new cement plant is presently dependent on power from the grid. This power
inadequacy is being addressed by the Captive Power Plant which is presently
being implemented. This division reported gratifying results thanks to a
bountiful monsoon which enabled a good power generation during the period.
Overview:
It is a technology with
enormous potential, which could exploit the water resources to supply energy to
remote rural areas with little access to conventional energy sources. The
ecological impact of small-scale hydro is almost nil.
B) WASTE HEAT RECOVERY UNIT
Operational
Performance
The operations were better than
the than the previous year on account of higher price and lower expenditure on
maintenance works.
Overview:
The world is in an energy
crisis, which is only going to get worse. With the increase in fuel and
electricity costs, the cement industry is presented with both a problem and an
opportunity. The cement industry uses huge amounts of fuel and electrical
power, and is critically sensitive to price rises in both. The industry
worldwide is also vulnerable to power-cuts and reduction in power quality. There
are good medium-term and long-term prospects for WHR systems in the cement
industry. Electricity is becoming more expensive, CO2-emission regulations are
becoming more stringent and technologies for utilizing waste heat – also that
from modern kiln plants – are becoming better and more reliable.
C) WIND POWER GENERATING
UNIT:
Operational
Performance
Overview:
Wind power is the
conversion of wind energy into a useful form of energy, by using windmills for
generating mechanical power. Wind power is capital intensive, but has no fuel
costs. The price of wind power is therefore much more stable than the volatile
prices of fossil fuel sources. Compared to the environmental impact of
traditional energy sources, the environmental impact of wind power is relatively
minor in terms of pollution. Wind power consumes no fuel, and emits no air
pollution, unlike fossil fuel power sources.
ENGINEERING DIVISION
Operational
Performance:
Engineering division was
greatly impacted by the following factors:
·
Drop
in Sales by nearly 20% as compared to the previous year due to global meltdown
·
Low
contributory orders were accepted to fi ll in the capacity.
·
Increase
in input costs.
·
Increase
in cost of power.
·
Due
to lower capacity utilization, higher spread of fixed overheads
Overview:
The engineering sector is
the largest segment of the overall Indian industrial sector. India has a strong
engineering and capital goods base. The engineering industry has shown capacity
to manufacture large-size plants and equipment for various sectors like power,
fertilizer and cement. The performance of the engineering sector is linked to
the performance of the end user industries for this sector. Many factors
contribute to growth of engineering sector in India.
The key growth drivers
are:-
·
The
growth of the key end user sectors in India.
·
Government’s emphasis on
power and construction sector has increased for the past few years and thus
increasing the demand for capital goods.
·
Further, India is being
preferred by global manufacturing companies as an outsourcing destination due
to its lower labour cost and better designing capabilities. Engineering
companies thus have a huge potential for direct exports and outsourcing. Among
developing countries, India offers the best combination of low costs,
availability and skills and capabilities of manpower for the engineering
sector.
Outlook:
From a policy perspective
there has been a growing consensus that a private-public partnership is
required to remove difficulties concerning the development of infrastructure in
the country. The realisation finally seems to be setting in with numerous BOT
(build, operate and transfer) projects being awarded to various private sector
companies. This makes the future of the Indian engineering and construction
sector promising.
The next couple of years
may remain challenging for the engineering and construction companies. While
execution pace is slowing down due to various internal as well as macro issues,
margins have also come under pressure due to rising input cost and competition.
Thus, unless the macro-environment improves overall growth will continue to
remain sluggish in the near term.
Emerging trends such as
outsourcing of engineering services can provide new opportunities for quantum
growth. Engineering and design services such as new product designing, product
improvement, maintenance and designing manufacturing systems are increasingly
getting outsourced to countries like India. India’s engineering sector has a
significant potential for future growth, both in manufacturing as well as
services.
Joint Venture:
Fives Cail KCP Limited:
Operational
Performance:
Domestic demand for sugar
machinery was at its low reflecting the hardships faced by sugar industry in
India. However, future expectations of millers in specific locations resulted
in certain expansion and balancing requirements. Export prospects resulted in
sizable and remunerative, executable orders for the year. Consequently, the JV
posted good results.
Subsidiary:
KCP Vietnam Industries
Limited:
Operational Performance:
Overview:
During the year company
operated with a total crushing capacity of 6000 TCD (Son Hoa Unit – 5000 TCD
and Dong Xuan Unit – 1000 TCD). The total cane crushed was 1,091,521 Mts with a
recovery rate of 8.87% and the refined sugar produced was 103,357 MTs which
includes sugar processed from raw sugar of 6,507 MTs.
Though adequate sugarcane
area was available, the inclement weather and lack of attention from the
farmers to grow high quality sugarcane etc affected the sugarcane quality.
However, there is slight improvement in cane quality when compared to last
year. Hence, raw sugar was purchased for conversion in to high quality refined
sugar to improve the production and ensure adequate supply to the existing
customers which also filled up the capacity.
The sugar price was in
downtrend and increased input costs affected the returns compared to last year.
The prices are predicted to be at the floor level and are expected to rise
during the year 2014-15 due to low production forecast in top sugar producing
countries.
The weather during the year
is more favorable than last year and it is expected to maintain the sugarcane
yield with improved quality compared to last season. It is estimated that the sugarcane
availability will be higher for the next year. The company has declared 24.22%
dividend on its paid-up equity share capital of the company during the year.
UNSECURED LOANS
|
PARTICULARS |
31.03.2014 (Rs.
In Millions) |
31.03.2013 (Rs.
In Millions) |
|
LONG TERM
BORROWINGS |
|
|
|
Other
Loans and advances: |
|
|
|
Deposits |
|
|
|
From
Directors |
3.153 |
0.350 |
|
From
Others |
564.956 |
354.159 |
|
SHORT TERM
BORROWINGS |
568.109 |
354.509 |
|
Loan Repayable on Demand |
|
|
|
: From Directors |
|
|
|
a)
Dr. V.L. Dutt |
130.000 |
107.500 |
|
b)
Smt. V. L. Indira Dutt |
53.000 |
64.000 |
|
c)
Smt. Kavitha Dutt Chitturi (The
above demand loans carry interest at the rate of 10%) |
34.000 |
32.500 |
|
Inter-corporate
Deposits repayable on demand (Inter Corporate loan
obtained from V. Ramakrishna Sons Private Limited and carries interest at the
rate of 10%) |
61.500 |
74.000 |
|
Total |
1414.718 |
987.018 |
INDEX OF CHARGES
|
S. No. |
Charge ID |
Date of Charge
Creation/Modification |
Charge amount secured |
Charge Holder |
Address |
Service Request Number
(SRN) |
|
1 |
10545975 |
27/01/2015 * |
400,000,000.00 |
BANK OF BARODA |
MOUNT ROAD BRANCH, NO.1, CLUB
HOUSE ROAD, ANNA SALAI, CHENNAI, TAMILNADU - 600002, INDIA |
C42034371 |
|
2 |
10485926 |
03/03/2014 |
927,300,000.00 |
BANK OF INDIA |
CHENNAI CORPORATE BANKING
BRANCH, IV FLOOR, TARAPORE TOWERS, 826 ANNA SALAI, CHENNAI, TAMILNADU -
600002, INDIA |
C00850669 |
|
3 |
10496642 |
10/12/2013 |
120,000,000.00 |
HDFC BANK LIMITED |
HDFC BANK HOUSE, SENAPATI
BAPAT MARG, LOWER PAREL (WEST), MUMBAI, MAHARASHTRA - 400013, INDIA |
C05150800 |
|
4 |
10361846 |
07/06/2012 |
210,000,000.00 |
BANK OF BARODA |
MOUNT ROAD BRANCH, NO.1,
CLUB HOUSE ROAD, ANNA SALAI, CHENNAI, TAMILNADU - 600002, INDIA |
B42131730 |
|
5 |
10317042 |
11/03/2014 * |
59,730,000.00 |
INDIAN OVERSEAS BANK |
MID CORPORATE BRANCH, 581,
NAVINS PLAZA,TEYNAMPET, CHENNAI, TAMILNADU - 600006, INDIA |
C05200605 |
|
6 |
10274627 |
06/01/2014 * |
234,500,000.00 |
BANK OF BARODA |
MOUNT ROAD BRANCH, NO.1,
CLUB HOUSE ROAD, ANNA SALAI, CHENNAI, TAMILNADU - 600002, INDIA |
B93400497 |
|
7 |
10266770 |
13/09/2012 * |
231,500,000.00 |
BANK OF INDIA |
CHENNAI CORPORATE BANKING
BRANCH, IV FLOOR, TARAPORE TOWERS, 826 ANNA SALAI, CHENNAI, TAMILNADU -
600002, INDIA |
B59754952 |
|
8 |
10263257 |
03/07/2013 * |
796,400,000.00 |
CANARA BANK |
MOUNT ROAD BRANCH,
781-785, ANNA SALAI, CHENNAI, TAMILNADU - 600002, INDIA |
B78874229 |
|
9 |
10213229 |
04/12/2013 * |
310,000,000.00 |
BANK OF BARODA |
MOUNT ROAD BRANCH, NO.1,
CLUB HOUSE ROAD, ANNA SALAI, CHENNAI, TAMILNADU - 600002, INDIA |
B90718933 |
|
10 |
10164033 |
02/06/2009 |
480,000,000.00 |
CANARA BANK |
MOUNT ROAD BRANCH,
781-785, ANNA SALAI, CHENNAI, TAMILNADU - 600002, INDIA |
A64531346 |
|
11 |
10152973 |
11/08/2011 * |
650,000,000.00 |
BANK OF BARODA |
MOUNT ROAD BRANCH, NO.1, CLUB
HOUSE ROAD, CHENNAI, TAMILNADU - 600002, INDIA |
B20353157 |
|
12 |
10157573 |
13/07/2011 * |
900,000,000.00 |
BANK OF INDIA |
CHENNAI CORPORATE BANKING
BRANCH, IV FLOOR, TARAPORE TOWERS,826 ANNA SALAI, CHENNAI, TAMILNADU -
600002, INDIA |
B17835430 |
|
13 |
10040288 |
22/01/2007 |
91,200,000.00 |
CANARA BANK |
MOUNT ROAD BRANCH,
781-785, ANNA SALAI, CHENNAI, TAMILNADU - 600002, INDIA |
A11785755 |
|
14 |
10040289 |
06/01/2014 * |
629,000,000.00 |
CANARA BANK |
MOUNT ROAD BRANCH, 781-785,
ANNA SALAI, CHENNAI, TAMILNADU - 600002, INDIA |
B97063309 |
|
15 |
10040290 |
22/01/2007 |
291,200,000.00 |
CANARA BANK |
MOUNT ROAD BRANCH,
781-785,ANNA SALAI, CHENNAI, TAMILNADU - 600002, INDIA |
A11786274 |
|
16 |
10028877 |
10/12/2013 * |
150,000,000.00 |
HDFC BANK LIMITED |
HDFC BANK HOUSE, SENAPATI
BAPAT MARG, LOWER PAREL (WEST), MUMBAI, MAHARASHTRA - 400013, INDIA |
C05120407 |
|
17 |
90302310 |
11/08/2004 |
505,176.00 |
M/S. SUNDARAM FINANCE
LIMITED |
NO. 21, PATULLOS ROAD, CHENNAI,
TAMILNADU - 600002, INDIA |
- |
|
18 |
90304942 |
14/08/2004 * |
203,000,000.00 |
INDUSTRIAL DEVELOPMENT
BANK OF INDIA |
CHENNAI, CHENNAI,
TAMILNADU, INDIA |
- |
|
19 |
90300179 |
30/04/1992 |
86,000,000.00 |
THE INDUSTRIAL CREDIT AND
INVESTMENT CORPORATION OF INDIA LIMITED |
BANK OF BARODA BUILDING;
16 SANSAD MARG, NEW DELHI - 110001, INDIA |
- |
|
20 |
90301723 |
24/09/1990 * |
70,000,000.00 |
THE INDUSTRIAL CREDIT AND
INVESTMENT CORPORATION OF INDIA LIMITED |
163; BACKBAY RECLAMATION,
BOMBAY, MAHARASHTRA - 400020, INDIA |
- |
|
21 |
90299914 |
15/12/1989 * |
70,000,000.00 |
THE SOUTHINDIAN BAK
LIMITED |
INDUSTRIAL FINANCE
BRANCH; 110; RAJAJI TOWER, ANNA SALAI, CHENNAI, TAMILNADU - 600002, INDIA |
- |
|
22 |
90288782 |
10/12/2005 * |
10,000,000.00 |
STATE BANK OF INDIA |
I. F. BRANCH, ANNA SALAI,
CHENNAI, TAMILNADU - 600002, INDIA |
- |
|
23 |
90303235 |
03/04/2004 * |
10,000,000.00 |
STATEBANK OF INDIA |
INDUSTRIAL FIANCE BRANCH;
ANNA SALAI, CHENNAI, TAMILNADU - 600002, INDIA |
- |
|
24 |
90298834 |
06/07/2002 * |
6,500,000.00 |
CANARA BANK |
781-785; MOUNT ROAD,
CHENNAI, TAMILNADU - 600002, INDIA |
- |
* Date of charge modification
CONTINGENT
LIABILITIES:
|
PARTICULARS |
31.03.2014 (Rs.
In Millions) |
31.03.2013 (Rs.
In Millions) |
|
A. Claims against the
Company / Disputed liabilities not acknowledged |
|
|
|
a)
In respect of Statutory levies |
345.664 |
120.560 |
|
b)
In respect of Contractual levies |
136.328 |
129.710 |
|
c)
In respect of others |
38.470 |
48.670 |
|
B.
Guarantees |
|
|
|
a)
Guarantees to Banks and Financial Institutions |
0.000 |
41.333 |
|
b)
Performance Bank Guarantees |
33.205 |
34.643 |
STATEMENT OF
UNAUDITED FINANCIAL RESULTS FOR THE QUARTER ENDED ON 30TH SEPTEMBER,
2014
(Rs. in
millions)
|
Particulars |
Quarter ended |
Quarter ended |
Half Year Ended |
||
|
30.09.2014 |
30.06.2014 |
30.09.2014 |
|||
|
Unaudited |
Unaudited |
Unaudited |
|||
|
1 |
Income from Operations |
1673.200 |
1563.400 |
3236.600 |
|
|
|
Less:
Excise Duty |
219.000 |
217.700 |
436.700 |
|
|
|
a) Net Sales/Income from Operations (net of excise duty) |
1454.200 |
1345.700 |
2799.900 |
|
|
|
b) Other Operating Income |
31.500 |
37.200 |
68.700 |
|
|
|
Total Income from Operations
(Net) |
1485.700 |
1382.900 |
2868.600 |
|
|
2 |
Expenses |
|
|
|
|
|
|
a) |
Cost of Materials consumed |
329.100 |
331.600 |
660.700 |
|
|
b) |
Purchase of stock in-trade |
0.000 |
0.000 |
0.000 |
|
|
c) |
Changes in inventories of finished goods, work-in-progress and
stock-in-trade |
(159.000) |
(22.900) |
(181.900) |
|
|
d) |
Stores and Spare Parts |
103.300 |
110.800 |
214.100 |
|
|
e) |
Employee benefit expenses |
127.700 |
138.200 |
265.900 |
|
|
f) |
Depreciation and amortization expense |
88.100 |
85.300 |
173.400 |
|
|
g)
|
Power & Fuel |
388.900 |
422.400 |
811.300 |
|
|
h) |
Freight Outward |
228.100 |
184.200 |
412.300 |
|
|
i) |
Other
expenses |
149.800 |
139.800 |
289.600 |
|
|
Total Expenses |
1256.000 |
1389.400 |
2645.400 |
|
|
3 |
|
Profit
/(Loss) from operations before other income, finance costs and exceptional
items (1-2) |
229.700 |
(6.500) |
223.200 |
|
4 |
Other
Income |
9.600 |
13.300 |
22.900 |
|
|
5 |
|
Profit
/(Loss) from ordinary activities before finance costs and exceptional items
(3+4) |
239.300 |
6.800 |
246.100 |
|
6 |
Finance
Costs |
119.500 |
116.000 |
235.500 |
|
|
7 |
|
Profit
/(Loss) from ordinary activities after finance costs but before exceptional
items (5-6) |
119.800 |
(109.200) |
10.600 |
|
8 |
Exceptional
Items |
0.000 |
0.000 |
0.000 |
|
|
9 |
Profit /(Loss) from
ordinary activities before tax |
119.800 |
(109.200) |
10.600 |
|
|
10 |
Tax
Expense |
30.400 |
33.800 |
(3.400) |
|
|
11 |
Net Profit /(Loss) from
ordinary activities after tax (9-10) |
89.400 |
(75.400) |
14.000 |
|
|
12 |
Extraordinary
items (net of tax expense) |
0.000 |
0.000 |
0.000 |
|
|
13 |
Net Profit /(Loss) for the
period (11-12) |
89.400 |
(75.400) |
14.000 |
|
|
14 |
Paid
up equity share capital (Eq. shares of
Rs.10/- each) |
128.900 |
128.900 |
128.900 |
|
|
15 |
Reserve
excluding revaluation reserves |
0.000 |
0.000 |
0.000 |
|
|
16 |
|
Earnings
per share (before/after extraordinary items) |
0.67 |
(0.61) |
0.06 |
|
A |
|
PARTICULARS
OF SHAREHOLDING |
|
|
|
|
1 |
|
Public Shareholding |
|
|
|
|
|
|
-
No. of Shares |
67894336 |
67894336 |
67894336 |
|
|
|
-
Percentage of Shareholding |
52.66% |
52.66% |
52.66% |
|
2 |
|
Promoters and promoter
group shareholding |
|
|
|
|
|
|
a) Pledged/Encumbered |
|
|
|
|
|
|
-
Number of shares |
Nil |
Nil |
Nil |
|
|
|
-
Percentage of shares (as a % of the total shareholding of the promoter and
promoter group) |
Nil |
Nil |
Nil |
|
|
|
-
Percentage of shares (as a % of the total share capital of the Company) |
Nil |
Nil |
Nil |
|
|
|
b)
Non- encumbered |
|
|
|
|
|
|
-
Number of shares |
61026824 |
61026824 |
61026824 |
|
|
|
-
Percentage of shares (as a % of the total shareholding of the promoter and
promoter group) |
100.00% |
100.00% |
100.00% |
|
|
|
-
Percentage of shares (as a % of the total share capital of the Company) |
47.34% |
47.34% |
47.34% |
Notes:
1. The above results were reviewed by the Audit
committee and taken on record by the Board at its meeting held on 12.11.2014
2. The Statutory Auditors of the company have
carried out a Limited review of the above financial statement.
3. The useful life of the fixed assets have been
revised with effect from 01.04.2014 as per Schedule II of the Companies Act,
2013. Consequently Deprecation for the half-year ended 30th September 2014 is
increased by an amount of Rs.2.700 millions, and the opening balance of
Retained Earrings is decreased by an amount of Rs.16.100 millions (Net of
Deferred Tax).
4. The above results for the period ended 30th
September, 2014 include Rs.7.200 millions being Loss from discontinued business
(Bio-Teh Unit).
5. The transfer of the Bio-Tech Unit was
completed with the receipt of the safe consideration of Rs.50.000 millions on
20th October, 2014.
6. The Board has declared pro-rata dividend on
8000000 nos of 12% redeemable cumulative non-convertible preference shares of
Rs.10/- each, at the time of redemption which is due on 09.12.2014.
|
|
Particulars |
Three
Months ended 30.09.2014 |
|
|
B |
|
Investor
Complaints |
|
|
|
|
Pending at
the beginning of the quarter |
Nil |
|
|
|
Received
during the quarter |
Nil |
|
|
|
Disposed
during the quarter |
Nil |
|
|
|
Remaining
unresolved at the end of the quarter |
Nil |
SEGMENTWISE REVENUE,
RESULTS AND CAPITAL EMPLOYED
(Rs. in millions)
|
Particulars |
Quarter ended |
Quarter ended |
Half Year Ended |
|
|
30.09.2014 |
30.06.2014 |
30.09.2014 |
||
|
Unaudited |
Unaudited |
Unaudited |
||
|
|
Segment Revenue (Sales and Other Operating
Income) |
|
|
|
|
a) |
Engineering |
119.200 |
104.000 |
223.200 |
|
b) |
Cement |
1550.900 |
1456.300 |
3007.200 |
|
c) |
Power |
60.200 |
60.300 |
120.500 |
|
d) |
Others |
0.000 |
0.000 |
0.000 |
|
|
TOTAL |
1730.300 |
1620.600 |
3350.900 |
|
|
Less: Inter-segment transfers |
57.100 |
57.200 |
114.300 |
|
|
Excise Duty |
219.000 |
217.700 |
436.700 |
|
|
Net Sales / Income from operation |
1454.200 |
1345.700 |
2799.900 |
|
|
Segment Results: [Profit/ (Loss)
before tax and interest from each segment] |
|
|
|
|
a) |
Engineering |
3.300 |
(40.200) |
(36.900) |
|
b) |
Cement |
197.000 |
13.100 |
210.100 |
|
c) |
Power |
35.800 |
40.600 |
76.400 |
|
d) |
Others |
0.000 |
0.000 |
0.000 |
|
|
TOTAL |
236.100 |
13.500 |
249.600 |
|
|
Less: Financial Cost |
119.500 |
116.000 |
235.500 |
|
|
Other
unallocable expenditure, net of Unallocable income |
(3.200) |
6.700 |
3.500 |
|
|
Total Profit/
Loss –before tax |
119.800 |
(109.200) |
10.600 |
|
|
Capital Employed: |
|
|
|
|
a) |
Engineering |
732.200 |
832.100 |
732.200 |
|
b) |
Cement |
4378.200 |
4195.200 |
4378.200 |
|
c) |
Power |
1506.200 |
1438.600 |
1506.200 |
|
d) |
Others |
981.900 |
788.800 |
981.900 |
|
|
TOTAL |
7598.500 |
7254.700 |
7598.500 |
STATEMENT OF ASSETS AND LIABILITIES
(Rs. in millions)
|
SOURCES OF FUNDS |
|
|
30.09.2014 (Unaudited) |
|
I.
EQUITY
AND LIABILITIES |
|
|
|
|
(1)
Shareholders' Funds |
|
|
|
|
(a) Share Capital |
|
|
208.900 |
|
(b) Reserves & Surplus |
|
|
3422.800 |
|
(c) Money
received against share warrants |
|
|
0.000 |
|
|
|
|
|
|
(2)
Share Application money pending allotment |
|
|
0.000 |
|
Total
Shareholders’ Funds (1) + (2) |
|
|
3631.700 |
|
|
|
|
|
|
(3) Non-Current
Liabilities |
|
|
|
|
(a) Long-term borrowings |
|
|
3020.200 |
|
(b) Trade payables |
|
|
12.500 |
|
(c) Deferred tax liabilities (Net) |
|
|
565.200 |
|
(d) Other long term
liabilities |
|
|
286.800 |
|
(e) Long-term
provisions |
|
|
20.800 |
|
Total Non-current
Liabilities (3) |
|
|
3905.500 |
|
|
|
|
|
|
(4) Current Liabilities |
|
|
|
|
(a) Short
term borrowings |
|
|
1056.900 |
|
(b) Trade
payables |
|
|
636.400 |
|
(c) Other
current liabilities |
|
|
1474.800 |
|
(d) Short-term
provisions |
|
|
26.100 |
|
Total Current
Liabilities (4) |
|
|
3194.200 |
|
|
|
|
|
|
TOTAL |
|
|
10731.400 |
|
|
|
|
|
|
II.
ASSETS |
|
|
|
|
(1) Non-current assets |
|
|
|
|
(a) Fixed
Assets |
|
|
6801.600 |
|
(b) Non-current Investments |
|
|
289.000 |
|
(c) Deferred tax assets (net) |
|
|
0.000 |
|
(d) Long-term Loan and Advances |
|
|
458.400 |
|
(e)
Trade receivables |
|
|
4.000 |
|
(f) Other
Non-current assets |
|
|
1.000 |
|
Total Non-Current
Assets |
|
|
7554.000 |
|
|
|
|
|
|
(2) Current assets |
|
|
|
|
(a)
Current investments |
|
|
0.000 |
|
(b)
Inventories |
|
|
1545.200 |
|
(c) Trade
receivables |
|
|
401.200 |
|
(d) Cash
and cash equivalents |
|
|
243.400 |
|
(e)
Short-term loans and advances |
|
|
969.200 |
|
(f) Other
current assets |
|
|
18.400 |
|
Total
Current Assets |
|
|
3177.400 |
|
|
|
|
|
|
TOTAL |
|
|
10731.400 |
FIXED ASSETS
Tangible
Assets
·
Land
·
Buildings
·
Leasehold
Buildings
·
Plant
and Machinery
·
Tramways
and Railway Sidings
·
Furniture
and Fixtures
·
Office
Equipment
·
Vehicles
and Earth Moving
·
Research
and Development
Intangible
Assets
·
Patents
·
Software
CMT REPORT (Corruption, Money Laundering & Terrorism]
The Public Notice information has been collected from various sources
including but not limited to: The Courts,
1] INFORMATION ON
DESIGNATED PARTY
No exist designating subject or any of its beneficial owners,
controlling shareholders or senior officers as terrorist or terrorist
organization or whom notice had been received that all financial transactions
involving their assets have been blocked or convicted, found guilty or against
whom a judgement or order had been entered in a proceedings for violating
money-laundering, anti-corruption or bribery or international economic or
anti-terrorism sanction laws or whose assets were seized, blocked, frozen or
ordered forfeited for violation of money laundering or international
anti-terrorism laws.
2] Court Declaration :
No exist to suggest that subject is or was
the subject of any formal or informal allegations, prosecutions or other
official proceeding for making any prohibited payments or other improper
payments to government officials for engaging in prohibited transactions or
with designated parties.
3] Asset Declaration :
No records exist to suggest that the property or assets of the subject
are derived from criminal conduct or a prohibited transaction.
4] Record on Financial
Crime :
Charges or conviction
registered against subject: None
5] Records on Violation of
Anti-Corruption Laws :
Charges or
investigation registered against subject: None
6] Records on Int’l
Anti-Money Laundering Laws/Standards :
Charges or
investigation registered against subject: None
7] Criminal Records
No
available information exist that suggest that subject or any of its principals
have been formally charged or convicted by a competent governmental authority
for any financial crime or under any formal investigation by a competent
government authority for any violation of anti-corruption laws or international
anti-money laundering laws or standard.
8] Affiliation with
Government :
No record
exists to suggest that any director or indirect owners, controlling
shareholders, director, officer or employee of the company is a government
official or a family member or close business associate of a Government
official.
9] Compensation Package :
Our market
survey revealed that the amount of compensation sought by the subject is fair
and reasonable and comparable to compensation paid to others for similar
services.
10] Press Report : No
press reports / filings exists on the subject.
CORPORATE GOVERNANCE
MIRA INFORM as part of its Due Diligence do provide comments on Corporate
Governance to identify management and governance. These factors often have been
predictive and in some cases have created vulnerabilities to credit
deterioration.
Our Governance Assessment focuses principally on the interactions
between a company’s management, its Board of Directors, Shareholders and other
financial stakeholders.
CONTRAVENTION
Subject is not known to have contravened any existing local laws,
regulations or policies that prohibit, restrict or otherwise affect the terms
and conditions that could be included in the agreement with the subject.
FOREIGN EXCHANGE RATES
|
Currency |
Unit
|
Indian Rupees |
|
US Dollar |
1 |
Rs.61.68 |
|
|
1 |
Rs.93.53 |
|
Euro |
1 |
Rs.70.75 |
INFORMATION DETAILS
|
Analysis Done by
: |
KAR |
|
|
|
|
Report Prepared
by : |
SMN |
SCORE & RATING EXPLANATIONS
|
SCORE FACTORS |
RANGE |
POINTS |
|
HISTORY |
1~10 |
5 |
|
PAID-UP CAPITAL |
1~10 |
5 |
|
OPERATING SCALE |
1~10 |
5 |
|
FINANCIAL
CONDITION |
|
|
|
--BUSINESS SCALE |
1~10 |
5 |
|
-- PROFITABILITY |
1~10 |
3 |
|
--LIQUIDITY |
1~10 |
5 |
|
--LEVERAGE |
1~10 |
5 |
|
--RESERVES |
1~10 |
5 |
|
--CREDIT LINES |
1~10 |
5 |
|
--MARGINS |
-5~5 |
- |
|
DEMERIT POINTS |
|
|
|
--BANK CHARGES |
YES/NO |
YES |
|
--LITIGATION |
YES/NO |
NO |
|
--OTHER ADVERSE INFORMATION |
YES/NO |
NO |
|
MERIT POINTS |
|
|
|
--SOLE DISTRIBUTORSHIP |
YES/NO |
NO |
|
--EXPORT ACTIVITIES |
YES/NO |
NO |
|
--AFFILIATION |
YES/NO |
YES |
|
--LISTED |
YES/NO |
YES |
|
--OTHER MERIT FACTORS |
YES/NO |
YES |
|
DEFAULTER |
|
|
|
--RBI |
YES/NO |
NO |
|
--EPF |
YES/NO |
NO |
|
TOTAL |
|
43 |
This score serves as a reference to assess
SC’s credit risk and to set the amount of credit to be extended. It is calculated
from a composite of weighted scores obtained from each of the major sections of
this report. The assessed factors and their relative weights (as indicated
through %) are as follows:
Financial
condition (40%) Ownership
background (20%) Payment record
(10%)
Credit history
(10%) Market trend (10%) Operational size
(10%)
RATING EXPLANATIONS
|
RATING |
STATUS |
PROPOSED CREDIT LINE |
|
|
>86 |
Aaa |
Possesses an extremely sound financial base with the strongest capability
for timely payment of interest and principal sums |
Unlimited |
|
71-85 |
Aa |
Possesses adequate working capital. No caution needed for credit
transaction. It has above average (strong) capability for payment of interest
and principal sums |
Large |
|
56-70 |
A |
Financial & operational base are regarded healthy. General
unfavourable factors will not cause fatal effect. Satisfactory capability for
payment of interest and principal sums |
Fairly Large |
|
41-55 |
Ba |
Overall operation is considered normal. Capable to meet normal
commitments. |
Satisfactory |
|
26-40 |
B |
Capability to overcome financial difficulties seems comparatively
below average. |
Small |
|
11-25 |
Ca |
Adverse factors are apparent. Repayment of interest and principal sums
in default or expected to be in default upon maturity |
Limited with
full security |
|
<10 |
C |
Absolute credit risk exists. Caution needed to be exercised |
Credit not
recommended |
|
-- |
NB |
New Business |
-- |
This report is issued at your request without any
risk and responsibility on the part of MIRA INFORM PRIVATE LIMITED (MIPL)
or its officials.