MIRA INFORM REPORT
|
Report No. : |
306939 |
|
Report Date : |
11.02.2015 |
IDENTIFICATION DETAILS
|
Name : |
TREKS [THAILAND] LIMITED PARTNERSHIP |
|
|
|
|
Registered Office : |
7/6 Soi 2, Ratchiangsaen Road, T. Haiya, A. Muang, Chiangmai 50100 |
|
|
|
|
Country : |
Thailand |
|
|
|
|
Financials (as on) : |
31.12.2011 |
|
|
|
|
Date of Incorporation : |
14.09.2009 |
|
|
|
|
Com. Reg. No.: |
0503549005101 |
|
|
|
|
Legal Form : |
Limited Partnership |
|
|
|
|
Line of Business : |
Tours and Treks Operator |
|
|
|
|
No. of Employee : |
Not Available |
RATING & COMMENTS
|
MIRA’s Rating : |
C |
|
RATING |
STATUS |
PROPOSED CREDIT LINE |
|
|
<10 |
C |
Absolute credit risk exists. Caution needed to be exercised |
Credit not recommended |
|
Status : |
Ceased business operation |
|
|
|
|
Payment Behaviour : |
-- |
|
|
|
|
Litigation : |
Clear |
NOTES :
Any query related to this report can be made
on e-mail : infodept@mirainform.com
while quoting report number, name and date.
ECGC Country Risk Classification List – December 31, 2014
|
Country Name |
Previous Rating (30.09.2014) |
Current Rating (31.12.2014) |
|
Thailand |
B1 |
B1 |
|
Risk Category |
ECGC Classification |
|
Insignificant |
A1 |
|
Low |
A2 |
|
Moderate |
B1 |
|
High |
B2 |
|
Very High |
C1 |
|
Restricted |
C2 |
|
Off-credit |
D |
THAILAND ECONOMIC OVERVIEW
With a well-developed infrastructure, a free-enterprise economy, generally pro-investment policies, and strong export industries, Thailand achieved steady growth due largely to industrial and agriculture exports - mostly electronics, agricultural commodities, automobiles and parts, and processed foods. Unemployment, at less than 1% of the labor force, stands as one of the lowest levels in the world, which puts upward pressure on wages in some industries. Thailand also attracts nearly 2.5 million migrant workers from neighboring countries. The Thai government in 2013 implemented a nation-wide 300 baht ($10) per day minimum wage policy and deployed new tax reforms designed to lower rates on middle-income earners. The Thai economy has weathered internal and external economic shocks in recent years. The global economic recession severely cut Thailand's exports, with most sectors experiencing double-digit drops. In late 2011 Thailand's recovery was interrupted by historic flooding in the industrial areas in Bangkok and its five surrounding provinces, crippling the manufacturing sector. The government approved flood mitigation projects worth $11.7 billion, which were started in 2012, to prevent similar economic damage, and an additional $75 billion for infrastructure over the following seven years. This was expected to lead to an economic upsurge but growth has remained slow, in part due to ongoing political unrest and resulting uncertainties. Spending on infrastructure will require re-approval once a new government is seated.
|
Source
: CIA |
Company
name and address
TREKS [THAILAND] LIMITED
PARTNERSHIP
SUMMARY
REGISTRATION &
LIQUIDATION : 7/6 SOI
2, RATCHIANGSAEN ROAD,
T. HAIYA,
ADDRESS A.
MUANG, CHIANGMAI 50100,
THAILAND
ESTABLISHED : 2006
REGISTRATION NO. : 0503549005101
TAX ID NO. : 3032351331
CAPITAL REGISTERED : BHT. 2,000,000
CAPITAL PAID-UP : BHT. 2,000,000
FISCAL YEAR CLOSING DATE : DECEMBER 31
LEGAL STATUS : LIMITED PARTNERSHIP
LINES OF BUSINESS :
TOURS AND TREKS
OPERATOR
CORPORATE PROFILE
PRESENT SITUATION : CEASING COMPLETELY
HISTORY
The subject was
established on September
14, 2006 as
a limited partnership
under the name
style TREKS [THAILAND]
LIMITED PARTNERSHIP by Thai
and Dutch partners,
with the objective
to engage in
touring and trekking
business.
On December 21, 2012, the subject registered
for a company’s
dissolution at the
Commercial Registration Department,
and it has
completed the liquidation
process of its
accounts on June
28, 2013. At
present, the company
does not exist
anymore.
The subject’s registration and liquidation
address is 7/6
Soi 2, Ratchiangsaen
Road,
T. Haiya, A. Muang, Chiangmai
50100.
ACCOUNT
LIQUIDATOR
Mrs.
Phantippa Deckers
is the Managing
Partner and Account
Liquidator. She signs
on behalf of
the subject with
seal affixed. She
also bears full
financial responsibility by
law.
COMMENT
The company has
no business activities because it has ceased
the business operation
completely by registering
for the company’s
dissolution at the
Commercial Registration Department.
In effect to the company's
dissolution, it does
not exist anymore.
Due to this,
any credit amount
is not recommended.
FINANCIAL
INFORMATION
[before account liquidation]
The capital was
registered at Bht.
2,000,000 which was
carried by 2
partners as follow:
Name
Age Amount
Mrs. Phantippa Deckers 44 Bht.1,220,000 [unlimited
partner]
Mr. Johannes Leonardus Terezia
Deckers 49 Bht. 780,000
NAME OF AUDITOR & CERTIFIED PUBLIC
ACCOUNTANT NO.
Ms. Pakamon Charupakdee No. 2176
Note:
The 2012-2013
financial statements were
not submitted to
the Commercial Registration
Department during investigation.
REMARK
Refer to
your given the
subject’s name “THAILAND
TREKS LIMITED PARTNERSHIP”,
please be informed
that the correct
name of the subject
is
TREKS [THAILAND]
LIMITED PARTNERSHIP.
BALANCE
SHEET [BAHT]
The latest
financial figures published as at December
31, 2011, 2010
& 2009 were:
ASSETS
|
Current Assets |
2011 |
2010 |
2009 |
|
|
|
|
|
|
Cash and Cash Equivalents |
105,235.96 |
91,670.23 |
91,248.23 |
|
Trade Account
& Other Receivable |
26,677.12 |
35,625.00 |
- |
|
Short-term Loan
from Person or Related Company |
- |
- |
2,128,520.00 |
|
Other Current
Assets |
30,911.11 |
5,267.67 |
76,892.67 |
|
|
|
|
|
|
Total Current
Assets |
162,824.19 |
132,562.90 |
2,296,660.90 |
|
|
|
|
|
|
Long-term
Long |
2,300,000.00 |
2,000,000.00 |
- |
|
Fixed Assets |
10,589.92 |
133,108.92 |
255,628.92 |
|
Total Assets |
2,473,414.11 |
2,265,671.82 |
2,552,289.82 |
LIABILITIES
& SHAREHOLDERS’ EQUITY [BAHT]
|
Current Liabilities |
2011 |
2010 |
2009 |
|
|
|
|
|
|
Trade Accounts
& Other Payable |
6,500.00 |
53,000.00 |
- |
|
Accrued Income
Tax |
16,186.33 |
16,186.33 |
- |
|
Other Current
Liabilities |
83,627.00 |
94,568.56 |
380,407.25 |
|
|
|
|
|
|
Total Current
Liabilities |
106,313.33 |
163,754.89 |
380,407.25 |
|
Total Liabilities
|
106,313.33 |
163,754.89 |
380,407.25 |
|
|
|
|
|
|
Shareholders'
Equity |
|
|
|
|
|
|
|
|
|
Capital Paid |
2,000,000.00 |
2,000,000.00 |
2,000,000.00 |
|
Retained
Earning Unappropriated |
367,100.78 |
101,916.93 |
171,882.57 |
|
Total Shareholders' Equity |
2,367,100.78 |
2,101,916.93 |
2,171,882.57 |
|
Total Liabilities & Shareholders' Equity |
2,473,414.11 |
2,265,671.82 |
2,552,289.82 |
PROFIT
& LOSS ACCOUNT
|
Revenue |
2011 |
2010 |
2009 |
|
|
|
|
|
|
Sales Income |
1,865,820.68 |
2,533,422.76 |
4,083,700.77 |
|
Other Income |
26,683.80 |
30,002.57 |
7,155.70 |
|
Total Revenues |
1,892,504.48 |
2,563,425.33 |
4,090,946.47 |
|
Expenses |
|
|
|
|
|
|
|
|
|
Cost of
Service |
1,163,601.79 |
1,788,613.92 |
2,625,419.73 |
|
Selling Expenses |
- |
7,400.00 |
630,725.63 |
|
Administrative Expenses |
440,914.10 |
807,957.87 |
- |
|
Total Expenses
|
1,604,515.89 |
2,603,971.79 |
3,265,145.36 |
|
|
|
|
|
|
Profit /
[Loss] before Income
Tax |
287,958.59 |
[40,546.46] |
825,801.11 |
|
Income Tax |
[22,804.74] |
[29,419.18] |
[107,246.06] |
|
Net Profit / [Loss] |
265,183.85 |
[69,965.64] |
718,555.05 |
|
Retained
Earning, Beginning of
Year |
101,916.93 |
171,882.57 |
[546,672.48] |
|
|
|
|
|
|
Retained
Earning, End of Year |
367,100.78 |
101,916.93 |
171,882.57 |
FINANCIAL
ANALYSIS
|
ITEM |
UNIT |
2011 |
2010 |
2009 |
|
|
|
|
|
|
|
LIQUIDITY RATIO |
|
|
|
|
|
CURRENT RATIO |
TIMES |
1.53 |
0.81 |
6.04 |
|
QUICK RATIO |
TIMES |
1.24 |
0.78 |
5.84 |
|
|
|
|
|
|
|
ACTIVITY RATIO |
|
|
|
|
|
FIXED ASSETS
TURNOVER |
TIMES |
176.19 |
19.03 |
15.98 |
|
TOTAL ASSETS
TURNOVER |
TIMES |
0.75 |
1.12 |
1.60 |
|
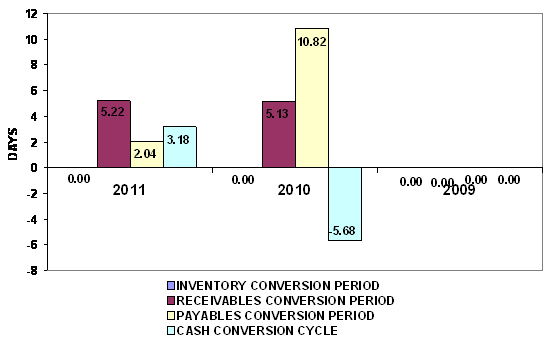
INVENTORY
CONVERSION PERIOD |
DAYS |
- |
- |
- |
|
INVENTORY
TURNOVER |
TIMES |
- |
- |
- |
|
RECEIVABLES
CONVERSION PERIOD |
DAYS |
5.22 |
5.13 |
- |
|
RECEIVABLES
TURNOVER |
TIMES |
69.94 |
71.11 |
- |
|
PAYABLES
CONVERSION PERIOD |
DAYS |
2.04 |
10.82 |
- |
|
CASH CONVERSION
CYCLE |
DAYS |
3.18 |
(5.68) |
- |
|
|
|
|
|
|
|
PROFITABILITY RATIO |
|
|
|
|
|
COST OF GOODS
SOLD |
% |
62.36 |
70.60 |
64.29 |
|
SELLING &
ADMINISTRATION |
% |
23.63 |
32.18 |
15.44 |
|
INTEREST |
% |
- |
- |
- |
|
GROSS PROFIT
MARGIN |
% |
39.07 |
30.58 |
35.89 |
|
NET PROFIT MARGIN
BEFORE EX. ITEM |
% |
15.43 |
(1.60) |
20.22 |
|
NET PROFIT MARGIN |
% |
14.21 |
(2.76) |
17.60 |
|
RETURN ON EQUITY |
% |
11.20 |
(3.33) |
33.08 |
|
RETURN ON ASSET |
% |
10.72 |
(3.09) |
28.15 |
|
EARNING PER SHARE |
BAHT |
13.26 |
(3.50) |
35.93 |
|
|
|
|
|
|
|
LEVERAGE RATIO |
|
|
|
|
|
DEBT RATIO |
TIMES |
0.04 |
0.07 |
0.15 |
|
DEBT TO EQUITY
RATIO |
TIMES |
0.04 |
0.08 |
0.18 |
|
TIME INTEREST
EARNED |
TIMES |
- |
- |
- |
|
|
|
|
|
|
|
ANNUAL GROWTH |
|
|
|
|
|
SALES GROWTH |
% |
(26.35) |
(37.96) |
|
|
OPERATING PROFIT |
% |
(810.27) |
(104.91) |
|
|
NET PROFIT |
% |
479.02 |
(109.74) |
|
|
FIXED ASSETS |
% |
(92.04) |
(47.93) |
|
|
TOTAL ASSETS |
% |
9.17 |
(11.23) |
|
ANNUAL
GROWTH : ACCEPTABLE
An annual sales
growth is -26.35%. Turnover has decreased
from THB
PROFITABILITY : IMPRESSIVE
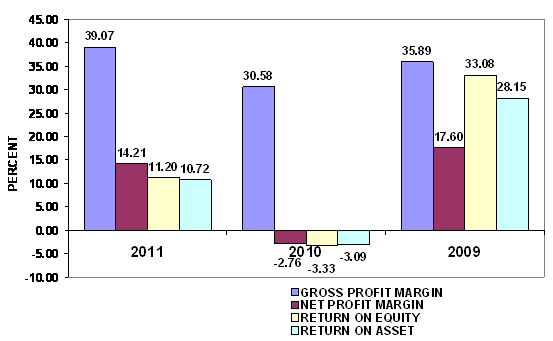
PROFITABILITY RATIO
|
Gross Profit
Margin |
39.07 |
Satisfactory |
Industrial Average |
50.54 |
|
Net Profit Margin |
14.21 |
Impressive |
Industrial Average |
(1.31) |
|
Return on Assets |
10.72 |
Impressive |
Industrial Average |
(2.18) |
|
Return on Equity |
11.20 |
Impressive |
Industrial Average |
(5.88) |
Gross Profit Margin
used to assess a firm's financial health by revealing the proportion of money
left over from revenues after accounting for the cost of goods sold. Gross
profit margin serves as the source for paying additional expenses and future
savings. The company's figure is 39.07%. When compared with the industry
average, the ratio of the company was lower. This indicated that company may
have problems with control over its costs.
Net Profit Margin
is the indicator of the company's efficiency in that net profit takes into
consideration all expenses of the company. A low profit margin indicates a low
margin of safety, higher risk that a decline in sales will erase profits and
result in a net loss. Net Profit Margin ratio is 14.21%, higher figure when
compared with those of its average competitors in the same industry, indicated
that business was an efficient operator in a dominant position within its
industry.
Return on Assets
measures how efficiently profits are being generated from the assets employed
in the business when compared with the ratios of firms in a similar business. A
low ratio in comparison with industry averages indicates an inefficient use of
business assets. Return on Assets ratio is 10.72%, higher figure when compared
with those of its average competitors in the same industry, indicated that
business was an efficient profit in a dominant position within its industry.
Return on Equity
indicates how profitable a company is by comparing its net income to its
average shareholders' equity, ROE measures how much the shareholders earned for
their investment in the company. Return on Equity ratio is 11.2%, higher figure
when compared with those of its average competitors in the same industry,
indicated that business was an efficient profit
in a dominant position within its industry.
Trend of the average competitors in the same
industry for last 5 years
Return on Assets Downtrend
Return on Equity Downtrend
LIQUIDITY : IMPRESSIVE
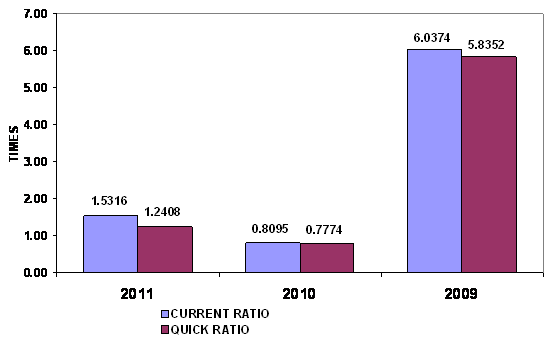
LIQUIDITY RATIO
|
Current Ratio |
1.53 |
Impressive |
Industrial Average |
1.39 |
|
Quick Ratio |
1.24 |
|
|
|
|
Cash Conversion
Cycle |
3.18 |
|
|
|
The Current Ratio
is to ascertain whether a company's short-term assets are readily available to pay
off its short-term liabilities. The company's figure is 1.53 times in 2011,
increase from 0.81 times, then it is generally considered to have good
short-term financial strength. When compared with the industry average, the
ratio of the company was higher, indicated that company was an efficient
operator in a dominant position within its industry.
The Quick Ratio is
a liquidity indicator that further refines the current ratio by measuring the
amount of the most liquid current assets there are to cover current
liabilities. The company's figure is 1.24 times in 2011, increase from 0.78
times, although excluding inventory so the company still have good short-term
financial strength.
The Cash Conversion
Cycle measures the number of days a company's cash is tied up in the production
and sales process of its operations and the benefit from payment terms from its
creditors. It meant the company could survive when no cash inflow was received
from sale for 4 days.
Trend of the average competitors in the same
industry for last 5 years
Current Ratio Stable
LEVERAGE : EXCELLENT
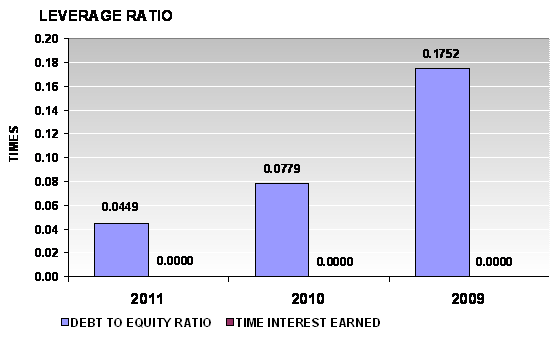
LEVERAGE RATIO
|
Debt Ratio |
0.04 |
Impressive |
Industrial Average |
0.62 |
|
Debt to Equity
Ratio |
0.04 |
Impressive |
Industrial Average |
1.62 |
|
Times Interest
Earned |
- |
|
Industrial Average |
- |
Debt to Equity Ratio
a measurement of how much suppliers, lenders, creditors and obligors have
committed to the company versus what the shareholders have committed. A lower
the percentage means that the company is using less leverage and has a stronger
equity position.
Debt Ratio shows
the proportion of a company's assets which are financed through debt. The
company's figure is 0.04 less than 0.5, most of the company's assets are
financed through equity.
Trend of the average competitors in the same
industry for last 5 years
Debt Ratio Downtrend
Times Interest
Earned Stable
ACTIVITY : SATISFACTORY
ACTIVITY RATIO
|
Fixed Assets
Turnover |
176.19 |
Impressive |
Industrial Average |
- |
|
Total Assets
Turnover |
0.75 |
Deteriorated |
Industrial Average |
1.67 |
|
Inventory
Conversion Period |
- |
|
|
|
|
Inventory
Turnover |
- |
|
Industrial Average |
6.56 |
|
Receivables
Conversion Period |
5.22 |
|
|
|
|
Receivables
Turnover |
69.94 |
Impressive |
Industrial Average |
1.97 |
|
Payables
Conversion Period |
2.04 |
|
|
|
The company's
Account Receivable Ratio is calculated as 69.94 and
The company's Total
Asset Turnover is calculated as 0.75 times and 1.12 times in 2011 and 2010
respectively. This ratio is determined by dividing total assets into total
sales turnover. The ratio measures the activity of the assets and the ability
of the firm to generate sales through the use of the assets.
Trend of the average competitors in the same
industry for last 5 years
Fixed Assets
Turnover Stable
Total Assets
Turnover Downtrend
Inventory Turnover Downtrend
Receivables
Turnover Downtrend
FOREIGN EXCHANGE RATES
|
Currency |
Unit
|
Indian Rupees |
|
US Dollar |
1 |
Rs.61.96 |
|
|
1 |
Rs.94.41 |
|
Euro |
1 |
Rs.70.30 |
INFORMATION DETAILS
|
Analysis Done by
: |
RAS |
|
|
|
|
Report Prepared
by : |
ANK |
RATING EXPLANATIONS
|
RATING |
STATUS |
PROPOSED CREDIT LINE |
|
|
>86 |
Aaa |
Possesses an extremely sound financial base with the strongest
capability for timely payment of interest and principal sums |
Unlimited |
|
71-85 |
Aa |
Possesses adequate working capital. No caution needed for credit
transaction. It has above average (strong) capability for payment of interest
and principal sums |
Large |
|
56-70 |
A |
Financial & operational base are regarded healthy. General
unfavourable factors will not cause fatal effect. Satisfactory capability for
payment of interest and principal sums |
Fairly Large |
|
41-55 |
Ba |
Overall operation is considered normal. Capable to meet normal
commitments. |
Satisfactory |
|
26-40 |
B |
Capability to overcome financial difficulties seems comparatively
below average. |
Small |
|
11-25 |
Ca |
Adverse factors are apparent. Repayment of interest and principal sums
in default or expected to be in default upon maturity |
Limited with
full security |
|
<10 |
C |
Absolute credit risk exists. Caution needed to be exercised |
Credit not
recommended |
|
-- |
NB |
New Business |
-- |
This score serves as a reference to assess
SC’s credit risk and to set the amount of credit to be extended. It is calculated
from a composite of weighted scores obtained from each of the major sections of
this report. The assessed factors and their relative weights (as indicated
through %) are as follows:
Financial
condition (40%) Ownership
background (20%) Payment record
(10%)
Credit history
(10%) Market trend (10%) Operational size
(10%)
This report is issued at your request without any
risk and responsibility on the part of MIRA INFORM PRIVATE LIMITED (MIPL)
or its officials.