MIRA
INFORM REPORT
|
Report No. : |
308030 |
|
Report Date : |
12.02.2015 |
IDENTIFICATION DETAILS
|
Name : |
ZIGOR CORPORACION SA |
|
|
|
|
Registered Office : |
C/ Portal De Gamarra, N° 28 Vitoria-Gasteiz Alava 01013 |
|
|
|
|
Country : |
|
|
|
|
|
Financials (as on) : |
31.12.2012 |
|
|
|
|
Date of Incorporation : |
19.07.1991 |
|
|
|
|
Legal Form : |
Public company |
|
|
|
|
Line of Business : |
Subject is engaged in the design, fabrication and commercialisation of
transforming energetic systems, made-cutome electronical solutions and
renewable energies. |
|
|
|
|
No. of Employee : |
70 |
RATING & COMMENTS
|
MIRA’s Rating : |
B |
|
RATING |
STATUS |
PROPOSED CREDIT LINE |
|
|
26-40 |
B |
Capability to overcome financial difficulties seems comparatively
below average. |
Small |
|
Status : |
Moderate |
|
|
|
|
Payment Behaviour : |
Slow |
|
|
|
|
Litigation : |
Clear |
NOTES :
Any query related to this report can be made
on e-mail : infodept@mirainform.com
while quoting report number, name and date.
ECGC Country Risk Classification List – December 31, 2014
|
Country Name |
Previous Rating (30.09.2014) |
Current Rating (31.12.2014) |
|
|
A2 |
A1 |
|
Risk Category |
ECGC
Classification |
|
Insignificant |
A1 |
|
Low |
A2 |
|
Moderate |
B1 |
|
High |
B2 |
|
Very High |
C1 |
|
Restricted |
C2 |
|
Off-credit |
D |
|
Source
: CIA |
EXECUTIVE SUMMARY
|
Name: |
ZIGOR CORPORACION SA |
|
NIF
/ Fiscal code: |
A01115807 |
|
Status: |
ACTIVE |
|
Incorporation
Date: |
19/07/1991 |
|
Register Data |
Register
Section 8 Sheet 736 |
|
Last Publication in BORME: |
28/11/2014
[Capital Reduction Announcement] |
|
Last
Published Account Deposit: |
2012 |
|
Share
Capital: |
20.514.588,75 |
|
|
|
|
Localization: |
C/
PORTAL DE GAMARRA, N° 28 - VITORIA-GASTEIZ - 01013 - ALAVA |
|
Telephone
- Fax - Email - Website: |
Ph.:.
945 291 541��
Email. zigor@zigor.com��
Website. www.zigor.com |
|
Number
of Branches |
6 |
|
|
|
|
Activity: |
|
|
NACE: |
2790
- Manufacture of other electrical equipment |
|
Registered
Trademarks: |
|
|
Audited
/ Opinion: |
Si
/ |
|
Tenders
and Awards: |
0
for a total cost of 0 |
|
Subsidies: |
8
for a total cost of 490094 |
|
Quality
Certificate: |
No |
|
|
|
|
Default
Risk: |
28.553% |
|
Maximum
recommended commercial credit: |
0 |
|
|
|
|
DEFAULTS, LEGAL CLAIMS AND
INSOLVENCY PROCEEDINGS : |
|
|
|
|
|
|
|
Number |
Amount
(€) |
Most
Recent Entry |
|
Insolvency
Proceedings, Bankruptcy and Suspension of Payments |
|
Unpublished |
--- |
--- |
|
Defaults
on debt with Financial Institutions and Large Companies |
|
2 |
44.387,91 |
--- |
|
Judicial
Claims (Notices, Executive Proceedings, Attachments, Auctions, Bad Debt) |
|
None |
0 |
--- |
|
Proceedings
heard by the |
|
Unpublished |
0 |
--- |
|
Proceedings
heard by the |
|
Unpublished |
0 |
--- |
|
|
|
Partners: |
|
|
|
CORPORACION
JUAN |
75.01
% |
|
|
PACKAGING
AND ELECTRICAL |
24.98
% |
|
|
Shares: |
5 |
|
|
Other
Links: |
2 |
|
|
No.
of Active Corporate Bodies: |
CHIEF
EXECUTIVE OFFICER 1 |
|
|
Ratios |
2012 |
2011 |
Change |
|
|
|
|
|
Guarantees: |
|
|
Properties
Registered: |
Company
NO, Administrator NO |
|
Financing
/ Guarantee Sources : |
Sources
YES, Guarantees YES |
|
|
|
|
INVESTIGATION
SUMMARY |
|
|
Company
founded a few years not, with enough experience in the sector of its
activity, so after consulting several references, we consider the company has
a good reputation. The group Zigor launch currently important development
projetcs centered in strategical áreas such as renewable energies, rural
electrification, intelligent networks, quality network and electrical energy
storage. Therefore, in their drive to continue with I+D+I
(investigation+development+innovation), ZIGOR continues to participate in
consortiums for de development of partnership projects with other companies,
besides investigation centers or public investigations organisms. |
|
Enquiry Details
|
IDENTIFICATION |
|
|
Social Denomination: |
ZIGOR CORPORACION SA |
|
NIF / Fiscal code: |
A01115807 |
|
Corporate Status: |
ACTIVE |
|
Start of activity: |
1991 |
|
Registered Office: |
C/ PORTAL DE GAMARRA, N°
28 |
|
Locality: |
VITORIA-GASTEIZ |
|
Province: |
ALAVA |
|
Postal Code: |
01013 |
|
Telephone: |
945 291 541 |
|
Fax: |
945 229 600 |
|
Website: |
|
|
Email: |
|
BRANCH OFFICES
|
Address |
Postal Code |
City |
Province |
|
C/ San Máximo
31-4ª Planta, Local 10 |
28041 |
|
|
|
C/ Unió, 63-65
Entl. |
08800 |
Vilanova i la
Geltrú |
|
|
C/Romero nº32 |
18100 |
Armilla |
|
|
C/ Menacho 38 2ºD |
06001 |
|
|
|
C/ Montiño 1
Entreplanta |
15009 |
|
|
|
C/ Poniente Nº 9
- PI Los Vientos |
46119 |
Naquera |
|
|
ACTIVITY |
|
|
NACE: |
2790 |
|
Additional Information: |
The company is engaged in the
design, fabrication and commercialisation of transforming energetic systems,
made-cutome electronical solutions and renewable energies. It is part of the
group ZIGOR. Leading company in innovation of made-custom solutions of
Support Network Quality, Solar Photovoltaic Systems, and "turnkey"
development of power electronics. Zigor owns a Management System of Quality
and Environment conformed to the requirements of the spanish Standard
UNE-EN-ISO 9001:2008 y UNE-EN-ISO 14001:2004, validado por AENOR Due to the
market crisis -not only in the national scope but also international- and the
financial difficulties, the group went to a previous phase of meeting
creditors in the end 2013, but finally the group arrived to solve its
financial problems in April 2014. |
|
Import / export: |
IMPORTS / EXPORTS |
|
Future Perspective: |
Consolidation |
|
Industry situation: |
Maturity |
NUMBER OF
EMPLOYEES
|
|
Year |
No. of employees |
Established |
Incidentals |
|
|
2015 |
70 |
|
|
Chronological Summary
|
Year |
Act |
|
1991 |
Appointments/ Re-elections (1) Company Formation (1) |
|
1992 |
Accounts deposit (ejer. 1991) |
|
1993 |
Accounts deposit (ejer. 1992) |
|
1994 |
Accounts deposit (ejer. 1993) |
|
1995 |
Accounts deposit (ejer. 1994) |
|
1996 |
Accounts deposit (ejer. 1995) Appointments/ Re-elections (1)
Cessations/ Resignations/ Reversals (1) |
|
1997 |
Accounts deposit (ejer. 1996) |
|
1998 |
Accounts deposit (ejer. 1997) Appointments/ Re-elections (1)
Cessations/ Resignations/ Reversals (1) Change of Social address (1)
Dividends Payment (1) Increase of Capital (1) |
|
1999 |
Accounts deposit (ejer. 1998) Other Concepts/ Events (1) |
|
2000 |
Accounts deposit (ejer. 1999) |
|
2001 |
Accounts deposit (ejer. 2000) Appointments/ Re-elections (3)
Cessations/ Resignations/ Reversals (1) Increase of Capital (1) |
|
2002 |
Accounts deposit (ejer. 2001) Change of Social Purpose (1) Change of Social
address (1) |
|
2003 |
Accounts deposit (ejer. 2002) Appointments/ Re-elections (3)
Cessations/ Resignations/ Reversals (1) |
|
2006 |
Accounts deposit (ejer. 2003, 2004) Appointments/ Re-elections (1) Cessations/
Resignations/ Reversals (1) Other Concepts/ Events (1) Statutory
Modifications (1) |
|
2007 |
Accounts deposit (ejer. 2005, 2006) Appointments/ Re-elections (4) |
|
2008 |
Accounts deposit (ejer. 2007) Appointments/ Re-elections (3) Change of
Social Denomination (1) Change of Social address (1) |
|
2009 |
Accounts deposit (ejer. 2008) Appointments/ Re-elections (1)
Cessations/ Resignations/ Reversals (2) Increase of Capital (1) |
|
2010 |
Accounts deposit (ejer. 2009) Appointments/ Re-elections (1) |
|
2011 |
Accounts deposit (ejer. 2010) Appointments/ Re-elections (1) Capital
Reduction (5) Increase of Capital (2) Other Concepts/ Events (2) |
|
2012 |
Accounts deposit (ejer. 2011) Appointments/ Re-elections (2)
Cessations/ Resignations/ Reversals (1) |
|
2013 |
Accounts deposit (ejer. 2012) Appointments/ Re-elections (1)
Cessations/ Resignations/ Reversals (1) |
|
2014 |
Capital Reduction (1) |
Main Historic Changes
|
Concept |
Publication |
Act |
Date |
|
Corporate Purpose Changes: |
FABRICACION MONTAJE DE MAQUINAS Y M QUINAS HERRAMIENTAS. |
Company Formation |
18/11/1991 |
Breakdown of Owners' Equity
|
Registered Capital: |
20.514.588,75 |
|
Paid up capital: |
20.514.588,75 |
UPDATED EVOLUTION OF THE SUBSCRIBED AND PAID-IN CAPITAL
|
|
|||||
|
|
|
|
|
|
|
|
Publishing Date |
Registration Type |
Capital Subscribed |
Paid up capital |
Underwritten result |
Disbursed Result |
|
21/10/1991 |
Company Formation |
360.607 |
90.152 |
360.607 |
90.152 |
|
17/03/1998 |
Capital call payment |
--- |
270.455 |
360.607 |
360.607 |
|
23/12/1998 |
Increase of Capital |
1.742.935 |
1.742.935 |
2.103.542 |
2.103.542 |
|
31/01/2001 |
Increase of Capital |
1.502.530 |
1.502.530 |
3.606.073 |
3.606.073 |
|
12/01/2009 |
Increase of Capital |
5.449.994 |
5.449.994 |
9.055.994 |
9.055.994 |
|
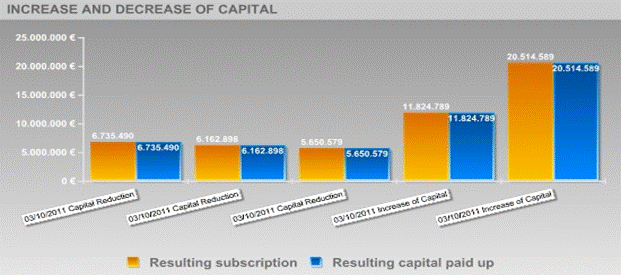
03/10/2011 |
Capital Reduction |
-2.320.504 |
-2.320.504 |
6.735.490 |
6.735.490 |
|
03/10/2011 |
Capital Reduction |
-572.592 |
-572.592 |
6.162.898 |
6.162.898 |
|
03/10/2011 |
Capital Reduction |
-512.319 |
-512.319 |
5.650.579 |
5.650.579 |
|
03/10/2011 |
Increase of Capital |
6.174.210 |
6.174.210 |
11.824.789 |
11.824.789 |
|
03/10/2011 |
Increase of Capital |
8.689.800 |
8.689.800 |
20.514.589 |
20.514.589 |
Active Social Bodies
|
Post published |
Social Body's Name |
Appointment Date |
Other Positions in this
Company |
|
PRESIDENT |
|
14/08/2012 |
5 |
|
MEMBER OF THE BOARD |
|
14/08/2012 |
5 |
|
|
GABILONDO ARRIOLA JOSE MIGUEL |
14/08/2012 |
4 |
|
|
OLARTE SANJUAN JAVIER MOISES |
14/08/2012 |
7 |
|
|
RAMIREZ GARCIA ANDOIN FRANCISCO JAVIER |
18/09/2009 |
1 |
|
PROXY |
OLARTE SANJUAN JAVIER MOISES |
17/10/2008 |
7 |
|
|
RODRIGUEZ |
08/01/2007 |
1 |
|
|
SALCEDO COSCOLLOLA JOAN BAPTISTA |
08/01/2007 |
1 |
|
|
|
26/04/2001 |
5 |
|
|
AGUIRRE IRAZABAL JUAN MIGUEL |
02/02/2001 |
1 |
|
CHIEF EXECUTIVE OFFICER |
GABILONDO ARRIOLA JOSE MIGUEL |
14/08/2012 |
4 |
|
SECRETARY |
OLARTE SANJUAN JAVIER MOISES |
14/08/2012 |
7 |
|
ACCOUNTS' AUDITOR / HOLDER |
|
22/11/2013 |
9 |
Historical Social Bodies
|
Social Body's Name |
Post published |
End Date |
Other Positions in this
Company |
|
AGUIRRE IBARBIA JAVIER |
SINGLE ADMINISTRATOR |
23/09/2003 |
2 |
|
|
SINGLE ADMINISTRATOR |
11/10/2006 |
|
|
AGUIRRE IRAZABAL JON MIKEL |
SINGLE ADMINISTRATOR |
11/10/2006 |
1 |
|
|
SINGLE ADMINISTRATOR |
02/10/1996 |
3 |
|
|
SINGLE ADMINISTRATOR |
17/03/1998 |
|
|
|
MEMBER OF THE BOARD |
18/09/2009 |
|
|
|
MEMBER OF THE BOARD |
14/08/2012 |
5 |
|
|
PRESIDENT |
14/08/2012 |
|
|
GABILONDO ARRIOLA JOSE MIGUEL |
MEMBER OF THE BOARD |
14/08/2012 |
4 |
|
|
CHIEF EXECUTIVE OFFICER |
14/08/2012 |
|
|
IRIBARREN ASENJO JOSE LUIS |
MEMBER OF THE BOARD |
26/12/2013 |
1 |
|
MADINA AGUIRRE AITOR |
MEMBER OF THE BOARD |
05/03/2009 |
1 |
|
|
ACCOUNTS' AUDITOR / HOLDER |
19/10/2012 |
9 |
|
|
ACCOUNTS' AUDITOR / HOLDER |
22/11/2013 |
|
|
|
ACCOUNTS' AUDITOR / HOLDER |
25/01/2007 |
|
|
|
ACCOUNTS' AUDITOR / HOLDER |
16/10/2007 |
|
|
|
ACCOUNTS' AUDITOR / HOLDER |
29/09/2008 |
|
|
|
ACCOUNTS' AUDITOR / HOLDER |
25/10/2008 |
|
|
|
ACCOUNTS' AUDITOR / HOLDER |
11/10/2010 |
|
|
|
ACCOUNTS' AUDITOR / HOLDER |
11/07/2011 |
|
|
OLARTE SANJUAN JAVIER MOISES |
SECRETARY |
14/08/2012 |
7 |
|
|
MEMBER OF THE BOARD |
14/08/2012 |
|
|
|
PROXY |
17/10/2008 |
|
|
|
PROXY |
09/11/2001 |
|
Executive board
|
Post |
NIF |
Name |
|
FINANCIAL DIRECTOR |
|
PASTOR GARCIA |
|
MANAGING DIRECTOR |
|
JAVIER OLARTE |
Defaults, Legal Claims and Insolvency Proceedings
Section enabling
assessment of the degree of compliance of the company queried with its payment obligations.
It provides information on the existence and nature of all stages of Insolvency
and Legal Proceedings published with reference to the Company in the country's
various Official Bulletins and national newspapers, as well Defaults Registered
in the main national credit bureaus (ASNEF Industrial and RAI ).
> Summary
Chronological summary
|
|
|
Number
of Publications |
Amount
(_) |
Start
date |
End
date |
|
Insolvency
Proceedings, Bankruptcy and Suspension of Payments |
|
Unpublished |
--- |
--- |
--- |
|
Request/Declaration |
|
0 |
--- |
date |
|
|
Proceedings |
|
--- |
--- |
|
--- |
|
Resolution |
|
--- |
--- |
|
--- |
|
Defaults
on debt with Financial Institutions and Large Companies |
Bank
and Commercial Delinquency |
2 |
0 |
20/01/2014 |
04/02/2015 |
|
Status:
Friendly |
|
1 |
37691.50 |
20/01/2014 |
20/01/2014 |
|
Status:
Pre-Litigation |
|
--- |
|
|
|
|
Status:
Litigation |
|
--- |
|
|
|
|
Status:
Non-performing |
|
--- |
|
|
|
|
Status:
insolvency proceedings, bankruptcy and suspension of payments |
|
--- |
|
|
|
|
Other
status |
|
1 |
|
|
|
|
Legal
and Administrative Proceedings |
|
Unpublished |
--- |
|
|
|
Notices
of defaults and enforcement |
|
--- |
--- |
|
--- |
|
Seizures |
|
--- |
--- |
|
--- |
|
Auctions |
|
--- |
--- |
|
--- |
|
Declarations
of insolvency and bad debt |
|
--- |
--- |
|
--- |
|
Proceedings
heard by the |
|
Unpublished |
--- |
|
|
|
Proceedings
heard by the |
|
Unpublished |
--- |
|
|
> Details
IMPAGOS EN ENTIDADES
FINANCIERAS Y GRANDES EMPRESAS
Section comprising a list of the instances of default recorded in the ASNEF Industrial file under the name of .
|
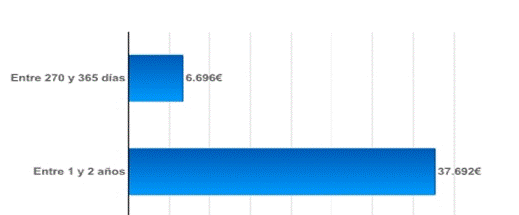
50.00% of contract defaults, which represent 84.91% of the amount, are in amicable debt collection status; the creditor entities have not initiated legal action for recovery. It must be noted that the total unpaid amount registered with ASNEF Empresas has decreased by 7.01% in the past six months. Highlight that the Company has payment defaults older than twelve months. |
List of current instances of default for each of the transactions in progress
|
Type of creditor |
Product |
Value of
transactions (_) |
Status |
No. of defaults |
Default balance (_) |
Date of first
default |
Date of last
default |
|
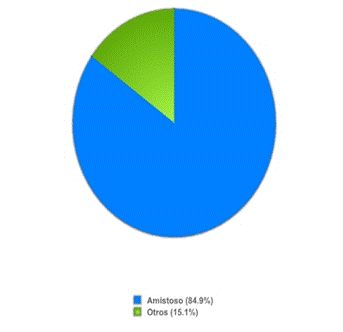
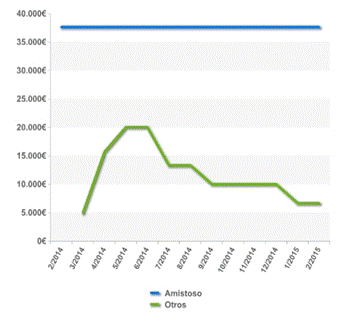
OTRAS |
Otros |
--- |
Amistoso |
--- |
37691.50 |
20/01/14 |
20/01/14 |
|
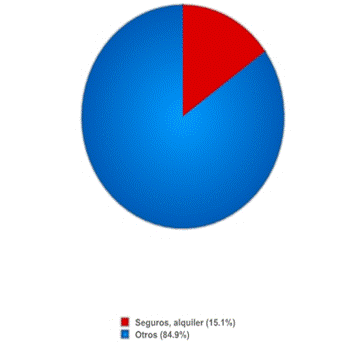
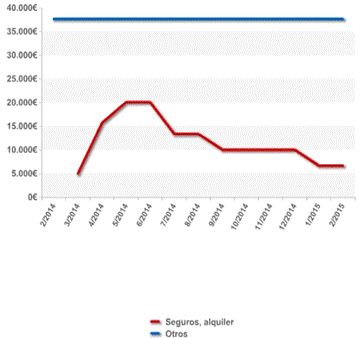
SOCIEDADES DE SEGUROS CREDITICIOS |
Seguros, alquiler |
150000.00 |
Otros |
3 |
6696.41 |
20/01/14 |
20/02/14 |
|
|
|
44.387,91 |
|
|
|
||
|
Default
by status
|
Default
by product
|
|
Age of current debt
|
|
Change
in values of defaults and settled debts
|
Changes in defaults by status
|
Changes in defaults by product
|
|
Change in values of defaults and
settled debts
|
Legal Notice:
This
data has been obtained from consultation of the ASNEF Industrial register. It may
only be used for the purposes of awarding credit, monitoring credit and
managing loans. This data may not be reused or included in any database, and
may not be ceded .
> Basis for
scoring
|
Positive Factors |
Adverse Factors |
|
|
It has been found to have irregular payment performance at the credit bureaus and has not paid all of its debts in a timely manner. It does not have any economic profitability.. It has no return from the necessary investments in the development of its main activity in comparison with its assets. It does not have any financial profitability.. ZIGOR CORPORACION SAIt does not obtain any financial return as a consequence of an investment in its own resources which, a priori, might deteriorate its financial and economic situation. Debts assumed by the company based on the volume of its own resources have increased in the previous financial year. ZIGOR CORPORACION SA presents a low turnover of the current assets , which could indicate an inefficient use of non-current assets due to the lacking of enough operating income capacity based on the dedicated assets available for sale. |
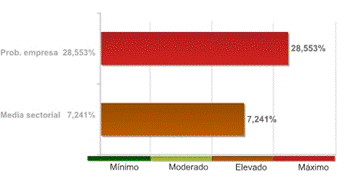
Probability of default
> Estimated Probability of Default for the next 12 months:
28.553 %
|
Sector in which comparison is carried out: 279 Manufacture of other electrical
equipment |
|
|
Relative Position:
|
The company's comparative analysis with
the rest of the companies that comprise the sector, shows the company holds a
worse position with regard to the probability of non-compliance.
The 3.00% of the companies of the
sector ZIGOR CORPORACION SA belongs to shows a lower probability of
non-compliance.
The probability of the company's
non-compliance with its payment obligations within deadlines estimated by our
qualifications models is 28.553%.
In the event they fail to comply with
the payment, the seriousness of the loss will depend on factors such as the
promptness of the commencement of the charging management, the existence of
executive documents which match the credit or the existence of guarantees and
free debt assets under the name of the debtor. Therefore, the probability of
non-compliance should not be solely interpreted as the total loss of the owed
amount.
SUMMARY OF JUDICIAL CLAIMS
|
|
|
|
|
|
|
No se han publicado |
|
|
|
No se han publicado |
|
|
|
|
|
|
|
No se han publicado |
|
|
|
No se han publicado |
|
|
|
No se han publicado |
|
|
|
No se han publicado |
|
|
|
|
|
|
|
No se han publicado |
|
|
|
No se han publicado |
|
|
|
|
|
|
|
No se han publicado |
GUARANTEES
REFERENCES
|
Clients |
|
|
Name |
NIF |
Telephone |
|
|
|
IKEA |
|
|
|
Link List
|
IS RELATED WITH: |
2 Entities |
|
PARTICIPATES IN: |
5 Entities |
|
SHAREHOLDERS: |
2 Entities |
> Shareholders
|
Relationship |
Entity |
Province |
Shareholding stake |
|
SHAREHOLDERS |
CORPORACION JUAN |
ALAVA |
75.01 |
|
|
PACKAGING AND ELECTRICAL |
|
24.98 |
|
PARTICIPATES IN |
ZIGOR RESEARCH & DEVELOPMENT AIE |
ALAVA |
99.99 |
|
|
ZIGOR |
|
99.5 |
|
|
ZIGOR DO BRASIL SISTEMAS DE ENERGIA LDA |
|
99.99 |
|
|
ZIGOR T&C SL |
ALAVA |
100 |
|
|
ZIGOR |
|
80 |
> Other
relationships
|
Relationship |
Entity |
Province |
Shareholding stake |
|
IS RELATED WITH |
| | |
|
|
|
|
ZIGOR |
|
|
|
IS RELATED WITH |
CTL-TH PACKAGING SL |
ALAVA |
|
Turnover
|
Total Sales 2014 |
13.500.000 |
Estimated Balance
|
ECONOMIC DATA : 2014 ( THOUSANDS OF EURO ) TOTAL ASSETS ..........................................34.000
NOT CURRENT ASSETS..............................18.000 CURRENT
ASSETS....................................16.000 LIABILITIES OWN
FUNDS......................................12.000 NOT CURRENT LIABILITIES.............................10.000
CURRENT LIABILITIES...................................12.000 |
Financial Accounts and Balance Sheets
|
Ejercicio |
Tipo
de Cuentas Anuales |
Fecha
Presentacion |
|
2012 |
Normale |
December 2013 |
|
2011 |
Normales |
November 2012 |
|
2010 |
Normales |
September 2011 |
|
2009 |
Normales |
October 2010 |
|
2008 |
Normales |
September 2009 |
|
2007 |
Normales |
October 2008 |
|
2006 |
Normales |
October 2007 |
|
2005 |
Normales |
April 2007 |
|
2004 |
Normales |
September 2006 |
|
2003 |
Normales |
August 2006 |
|
2002 |
Normales |
September 2003 |
|
2001 |
Normales |
November 2002 |
|
2000 |
Normales |
October 2001 |
|
1999 |
Normales |
August 2000 |
|
1998 |
Normales |
August 1999 |
|
1997 |
Normales |
August 1998 |
|
1996 |
Normales |
July 1997 |
|
1995 |
Normales |
July 1996 |
|
1994 |
Normales |
August 1995 |
|
1993 |
Normales |
August 1994 |
|
1992 |
Normales |
July 1993 |
|
1991 |
Normales |
August 1992 |
The
data in the report regarding the last Company Accounts submitted by the company
is taken from the TRADE REGISTER serving the region in which the company's
address is located 31/12/2012
> Balance en formato
Information
corresponding to the fiscal year
2012 2011 2010 2009 2008 is taken from information
submitted to the TRADE REGISTER. Data corresponding to fiscal years before
2012 2011 2010 2009 2008 has been compiled based on
the equivalence criteria stipulated in Act JUS/206/2009. To view details on the
methodology.
|
|
ORIGINAL |
ORIGINAL |
ORIGINAL |
ORIGINAL |
ORIGINAL |
|
|
Assets |
2012 |
2011 |
2010 |
2009 |
2008 |
|
|
A) NON-CURRENT ASSETS: 11000 |
17.357.657,00 |
16.396.455,00 |
7.612.218,00 |
5.472.707,00 |
6.168.529,00 |
|
|
I. Intangible fixed
assets : 11100 |
6.381.634,00 |
5.467.785,00 |
4.346.345,00 |
2.462.544,00 |
2.687.449,00 |
|
|
1. Development: 11110 |
0,00 |
0,00 |
0,00 |
0,00 |
0,00 |
|
|
2. Concessions: 11120 |
0,00 |
0,00 |
0,00 |
0,00 |
0,00 |
|
|
3. Patents, licencing, trade marks and similar: 11130 |
0,00 |
0,00 |
0,00 |
0,00 |
0,00 |
|
|
4. Goodwill: 11140 |
0,00 |
0,00 |
0,00 |
0,00 |
0,00 |
|
|
5. IT applications: 11150 |
181.705,00 |
68.483,00 |
103.996,00 |
124.940,00 |
153.312,00 |
|
|
6.
Investigation: 11160 |
6.199.929,00 |
5.399.302,00 |
4.242.349,00 |
2.337.604,00 |
2.534.137,00 |
|
|
7. Intellectual property: 11180 |
0,00 |
0,00 |
0,00 |
0,00 |
0,00 |
|
|
8.
Greenhouse gas emission allowance: 11190 |
0,00 |
0,00 |
0,00 |
0,00 |
0,00 |
|
|
9. Other intangible fixed assets. : 11170 |
0,00 |
0,00 |
0,00 |
0,00 |
0,00 |
|
|
II. Tangible fixed
assets : 11200 |
7.698.301,00 |
7.692.736,00 |
1.051.169,00 |
545.443,00 |
622.490,00 |
|
|
1. Land and buildings: 11210 |
0,00 |
0,00 |
0,00 |
0,00 |
0,00 |
|
|
2. Technical installations and other tangible fixed assets: 11220 |
6.559.987,00 |
7.692.736,00 |
1.051.169,00 |
545.443,00 |
622.490,00 |
|
|
3. Tangible asset in progress and advances: 11230 |
1.138.314,00 |
0,00 |
0,00 |
0,00 |
0,00 |
|
|
III. Real estate
investment: 11300 |
0,00 |
0,00 |
0,00 |
0,00 |
0,00 |
|
|
1. Land: 11310 |
0,00 |
0,00 |
0,00 |
0,00 |
0,00 |
|
|
2. Buildings: 11320 |
0,00 |
0,00 |
0,00 |
0,00 |
0,00 |
|
|
IV. Long-term
investments in Group companies and associates : 11400 |
3.235.752,00 |
3.193.964,00 |
2.169.934,00 |
2.419.338,00 |
2.834.472,00 |
|
|
1. Equity instruments: 11410 |
652.846,00 |
583.920,00 |
1.314.529,00 |
1.075.525,00 |
1.085.528,00 |
|
|
2.
Credits to businesses: 11420 |
2.582.906,00 |
2.610.044,00 |
855.405,00 |
1.343.813,00 |
1.748.944,00 |
|
|
3. Debt securities: 11430 |
0,00 |
0,00 |
0,00 |
0,00 |
0,00 |
|
|
4. Derivatives : 11440 |
0,00 |
0,00 |
0,00 |
0,00 |
0,00 |
|
|
5. Other financial assets : 11450 |
0,00 |
0,00 |
0,00 |
0,00 |
0,00 |
|
|
6. Other investments: 11460 |
0,00 |
0,00 |
0,00 |
0,00 |
0,00 |
|
|
V. Long-term financial
investments: 11500 |
41.970,00 |
41.970,00 |
44.770,00 |
45.382,00 |
24.118,00 |
|
|
1. Equity instruments: 11510 |
29.305,00 |
29.305,00 |
29.305,00 |
28.405,00 |
481,00 |
|
|
2.
Credits to third parties : 11520 |
0,00 |
0,00 |
2.800,00 |
9.460,00 |
16.120,00 |
|
|
3. Debt securities: 11530 |
0,00 |
0,00 |
0,00 |
0,00 |
0,00 |
|
|
4. Derivatives : 11540 |
0,00 |
0,00 |
0,00 |
0,00 |
0,00 |
|
|
5. Other financial assets : 11550 |
12.665,00 |
12.665,00 |
12.665,00 |
7.517,00 |
7.517,00 |
|
|
6. Other investments: 11560 |
0,00 |
0,00 |
0,00 |
0,00 |
0,00 |
|
|
VI. Assets for
deferred tax : 11600 |
0,00 |
0,00 |
0,00 |
0,00 |
0,00 |
|
|
VII. Non-current
trade debts : 11700 |
0,00 |
0,00 |
0,00 |
0,00 |
0,00 |
|
|
B) CURRENT ASSETS: 12000 |
20.596.964,00 |
23.057.980,00 |
24.896.099,00 |
23.985.750,00 |
18.696.524,00 |
|
|
I. Non-current assets
held for sale : 12100 |
0,00 |
0,00 |
0,00 |
0,00 |
0,00 |
|
|
II. Stocks:
12200 |
6.899.332,00 |
7.053.492,00 |
6.622.184,00 |
7.886.428,00 |
9.861.567,00 |
|
|
1. Commercial: 12210 |
0,00 |
0,00 |
0,00 |
0,00 |
0,00 |
|
|
2. Primary material and other supplies: 12220 |
1.416.430,00 |
1.889.762,00 |
1.776.110,00 |
1.619.735,00 |
1.525.236,00 |
|
|
3. Work in progress: 12230 |
1.733.986,00 |
1.958.799,00 |
1.710.343,00 |
1.141.076,00 |
3.076.786,00 |
|
|
a) Of long-term production cycle : 12231 |
0,00 |
0,00 |
0,00 |
0,00 |
0,00 |
|
|
b) Of short-term production cycle : 12232 |
1.733.986,00 |
1.958.799,00 |
1.710.343,00 |
1.141.076,00 |
3.076.786,00 |
|
|
4. Finished goods: 12240 |
3.595.134,00 |
3.143.786,00 |
2.940.110,00 |
4.977.146,00 |
5.171.277,00 |
|
|
a) Of long-term production cycle : 12241 |
0,00 |
0,00 |
0,00 |
0,00 |
0,00 |
|
|
b) Of short-term production cycle : 12242 |
3.595.134,00 |
3.143.786,00 |
2.940.110,00 |
4.977.146,00 |
5.171.277,00 |
|
|
5. By-products, residues and recycled materials: 12250 |
0,00 |
0,00 |
0,00 |
0,00 |
0,00 |
|
|
6. Advances to suppliers: 12260 |
153.782,00 |
61.145,00 |
195.621,00 |
148.471,00 |
88.268,00 |
|
|
III. Trade debtors
and others receivable accounts: 12300 |
12.994.622,00 |
15.878.129,00 |
16.673.106,00 |
13.940.692,00 |
8.815.299,00 |
|
|
1. Trade debtors / accounts receivable: 12310 |
3.563.677,00 |
6.636.499,00 |
9.057.981,00 |
7.471.261,00 |
3.462.418,00 |
|
|
a) Long-term receivables from sales and services
supplied : 12311 |
0,00 |
0,00 |
0,00 |
0,00 |
0,00 |
|
|
b) Customers for sales and provisions of services :
12312 |
3.563.677,00 |
6.636.499,00 |
9.057.981,00 |
7.471.261,00 |
3.462.418,00 |
|
|
2. Customers, Group companies and associates : 12320 |
9.058.651,00 |
8.554.793,00 |
7.045.909,00 |
6.246.224,00 |
4.617.252,00 |
|
|
3. Other accounts receivable: 12330 |
0,00 |
0,00 |
0,00 |
0,00 |
34.969,00 |
|
|
4. Personnel: 12340 |
0,00 |
2.800,00 |
6.660,00 |
6.660,00 |
9.344,00 |
|
|
5. Assets for deferred tax: 12350 |
3.777,00 |
1.531,00 |
1.383,00 |
1.114,00 |
205,00 |
|
|
6.
Other debtors, including tax and social security: 12360 |
368.517,00 |
682.506,00 |
561.173,00 |
215.433,00 |
691.111,00 |
|
|
7. Called up share capital: 12370 |
0,00 |
0,00 |
0,00 |
0,00 |
0,00 |
|
|
IV. Short-term investments
in Group companies and associates: 12400 |
283.058,00 |
51.733,00 |
1.461.286,00 |
964.876,00 |
0,00 |
|
|
1. Equity instruments: 12410 |
0,00 |
0,00 |
0,00 |
0,00 |
0,00 |
|
|
2.
Credits to businesses: 12420 |
283.058,00 |
51.733,00 |
1.461.286,00 |
964.876,00 |
0,00 |
|
|
3. Debt securities: 12430 |
0,00 |
0,00 |
0,00 |
0,00 |
0,00 |
|
|
4. Derivatives : 12440 |
0,00 |
0,00 |
0,00 |
0,00 |
0,00 |
|
|
5. Other financial assets : 12450 |
0,00 |
0,00 |
0,00 |
0,00 |
0,00 |
|
|
6. Other investments: 12460 |
0,00 |
0,00 |
0,00 |
0,00 |
0,00 |
|
|
V. Short-term
financial investments : 12500 |
0,00 |
0,00 |
0,00 |
1.165.714,00 |
0,00 |
|
|
1. Equity instruments: 12510 |
0,00 |
0,00 |
0,00 |
0,00 |
0,00 |
|
|
2. Credits to businesses: 12520 |
0,00 |
0,00 |
0,00 |
0,00 |
0,00 |
|
|
3.
Debt securities: 12530 |
0,00 |
0,00 |
0,00 |
0,00 |
0,00 |
|
|
4. Derivatives : 12540 |
0,00 |
0,00 |
0,00 |
0,00 |
0,00 |
|
|
5. Other financial assets : 12550 |
0,00 |
0,00 |
0,00 |
1.165.714,00 |
0,00 |
|
|
6. Other investments: 12560 |
0,00 |
0,00 |
0,00 |
0,00 |
0,00 |
|
|
VI. Short-term
accruals: 12600 |
3.805,00 |
8.878,00 |
13.952,00 |
0,00 |
0,00 |
|
|
VII. Cash and other
equivalent liquid assets : 12700 |
416.147,00 |
65.748,00 |
125.571,00 |
28.040,00 |
19.658,00 |
|
|
1. Treasury: 12710 |
416.147,00 |
65.748,00 |
125.571,00 |
28.040,00 |
19.658,00 |
|
|
2. Other equivalent liquid assets: 12720 |
0,00 |
0,00 |
0,00 |
0,00 |
0,00 |
|
|
TOTAL ASSETS (A + B) : 10000 |
37.954.621,00 |
39.454.435,00 |
32.508.317,00 |
29.458.457,00 |
24.865.053,00 |
|
|
|
ORIGINAL |
ORIGINAL |
ORIGINAL |
ORIGINAL |
ORIGINAL |
|
|
Liabilities
and Net Worth |
2012 |
2011 |
2010 |
2009 |
2008 |
|
|
A) NET WORTH: 20000 |
13.900.441,00 |
16.811.174,00 |
6.818.894,00 |
6.666.905,00 |
8.047.735,00 |
|
|
A-1) Shareholders'
equity: 21000 |
13.788.358,00 |
16.700.758,00 |
6.737.654,00 |
6.589.903,00 |
7.937.307,00 |
|
|
I. Capital:
21100 |
18.583.107,00 |
18.583.107,00 |
9.055.994,00 |
9.055.994,00 |
9.055.994,00 |
|
|
1. Registered capital : 21110 |
20.514.589,00 |
20.514.589,00 |
9.055.994,00 |
9.055.994,00 |
9.055.994,00 |
|
|
2. (Uncalled capital): 21120 |
-1.931.482,00 |
-1.931.482,00 |
0,00 |
0,00 |
0,00 |
|
|
II. Share premium:
21200 |
0,00 |
0,00 |
0,00 |
0,00 |
0,00 |
|
|
III. Reserves:
21300 |
1.068.766,00 |
1.068.766,00 |
-42.362,00 |
-42.362,00 |
-42.362,00 |
|
|
1. Legal y estatutarias: 21310 |
1.087.003,00 |
1.087.003,00 |
14.160,00 |
14.160,00 |
14.160,00 |
|
|
2. Other reserves: 21320 |
-18.237,00 |
-18.237,00 |
-56.522,00 |
-56.522,00 |
-56.522,00 |
|
|
3. Revaluation reserves: 21330 |
0,00 |
0,00 |
0,00 |
0,00 |
0,00 |
|
|
IV. (Common stock
equity): 21400 |
0,00 |
0,00 |
0,00 |
0,00 |
0,00 |
|
|
V. Results from
previous periods: 21500 |
-2.951.115,00 |
0,00 |
-2.423.729,00 |
-1.076.325,00 |
-1.477.234,00 |
|
|
1. Brought forward: 21510 |
0,00 |
0,00 |
0,00 |
0,00 |
0,00 |
|
|
2. (Negative results from previous periods): 21520 |
-2.951.115,00 |
0,00 |
-2.423.729,00 |
-1.076.325,00 |
-1.477.234,00 |
|
|
VI. Other
shareholders' contributions: 21600 |
0,00 |
0,00 |
0,00 |
0,00 |
0,00 |
|
|
VII. Result of the
period: 21700 |
-2.912.400,00 |
-2.951.115,00 |
147.751,00 |
-1.347.404,00 |
400.909,00 |
|
|
VIII. (Interim
dividend): 21800 |
0,00 |
0,00 |
0,00 |
0,00 |
0,00 |
|
|
IX. Other net worth
instruments: 21900 |
0,00 |
0,00 |
0,00 |
0,00 |
0,00 |
|
|
A-2) Adjustments due
to changes in value: 22000 |
0,00 |
0,00 |
0,00 |
0,00 |
0,00 |
|
|
I. Financial assets
held for sale: 22100 |
0,00 |
0,00 |
0,00 |
0,00 |
0,00 |
|
|
II. Hedge operations:
22200 |
0,00 |
0,00 |
0,00 |
0,00 |
0,00 |
|
|
III. Linked
non-current assets and liabilities held for sale : 22300 |
0,00 |
0,00 |
0,00 |
0,00 |
0,00 |
|
|
IV. Exchange rate
difference: 22400 |
0,00 |
0,00 |
0,00 |
0,00 |
0,00 |
|
|
V. Other: 22500 |
0,00 |
0,00 |
0,00 |
0,00 |
0,00 |
|
|
A-3) Received
subsidies, donations and legacies: 23000 |
112.083,00 |
110.416,00 |
81.240,00 |
77.002,00 |
110.428,00 |
|
|
B) NON-CURRENT LIABILITIES: 31000 |
13.564.008,00 |
8.337.962,00 |
6.354.441,00 |
6.889.477,00 |
6.500.315,00 |
|
|
I. Long-term
provisions: 31100 |
0,00 |
0,00 |
0,00 |
0,00 |
0,00 |
|
|
1.
Long-term employee benefits liability: 31110 |
0,00 |
0,00 |
0,00 |
0,00 |
0,00 |
|
|
2. Environmental actions: 31120 |
0,00 |
0,00 |
0,00 |
0,00 |
0,00 |
|
|
3. Restructuring provisions: 31130 |
0,00 |
0,00 |
0,00 |
0,00 |
0,00 |
|
|
4. Other provisions: 31140 |
0,00 |
0,00 |
0,00 |
0,00 |
0,00 |
|
|
II Long-term
creditors: 31200 |
1.080.701,00 |
605.302,00 |
1.133.128,00 |
1.669.812,00 |
1.250.000,00 |
|
|
1.
Liabilities and other securities: 31210 |
0,00 |
0,00 |
0,00 |
0,00 |
0,00 |
|
|
2. Amounts owed to credit institutions: 31220 |
422.016,00 |
0,00 |
849.934,00 |
1.349.979,00 |
1.250.000,00 |
|
|
3.
Creditors from financial leasing: 31230 |
374.290,00 |
380.954,00 |
0,00 |
0,00 |
0,00 |
|
|
4. Derivatives : 31240 |
0,00 |
0,00 |
0,00 |
0,00 |
0,00 |
|
|
5. Other financial liabilities : 31250 |
284.395,00 |
224.348,00 |
283.194,00 |
319.833,00 |
0,00 |
|
|
III. Long-term debts
with Group companies and associates: 31300 |
0,00 |
7.689.720,00 |
5.189.720,00 |
5.189.720,00 |
5.207.371,00 |
|
|
IV. Liabilities for
deferred tax: 31400 |
43.587,00 |
42.940,00 |
31.593,00 |
29.945,00 |
42.944,00 |
|
|
V. Long-term
accruals: 31500 |
0,00 |
0,00 |
0,00 |
0,00 |
0,00 |
|
|
VI. Non-current trade
creditors : 31600 |
0,00 |
0,00 |
0,00 |
0,00 |
0,00 |
|
|
VII. Special
long-term debts : 31700 |
12.439.720,00 |
0,00 |
0,00 |
0,00 |
0,00 |
|
|
C) CURRENT LIABILITIES : 32000 |
10.490.172,00 |
14.305.299,00 |
19.334.982,00 |
15.902.075,00 |
10.317.003,00 |
|
|
I. Liabilities linked
to non-current assets held for sale: 32100 |
0,00 |
0,00 |
0,00 |
0,00 |
0,00 |
|
|
II. Short-term
provisions: 32200 |
0,00 |
0,00 |
0,00 |
0,00 |
0,00 |
|
|
1. Provisions from greenhouse gas emission allowance: 32210 |
0,00 |
0,00 |
0,00 |
0,00 |
0,00 |
|
|
2. Other provisions: 32220 |
0,00 |
0,00 |
0,00 |
0,00 |
0,00 |
|
|
III. Short-term
creditors : 32300 |
6.281.692,00 |
9.942.616,00 |
8.073.418,00 |
9.629.089,00 |
5.777.093,00 |
|
|
1. Liabilities and other securities: 32310 |
0,00 |
0,00 |
0,00 |
0,00 |
0,00 |
|
|
2. Amounts owed to credit institutions: 32320 |
6.105.169,00 |
9.862.702,00 |
8.036.779,00 |
9.629.089,00 |
5.777.093,00 |
|
|
3. Creditors from financial leasing: 32330 |
49.030,00 |
25.028,00 |
0,00 |
0,00 |
0,00 |
|
|
4. Derivatives : 32340 |
0,00 |
0,00 |
0,00 |
0,00 |
0,00 |
|
|
5. Other financial liabilities : 32350 |
127.493,00 |
54.886,00 |
36.639,00 |
0,00 |
0,00 |
|
|
IV. Short-term debts
with Group companies and associates: 32400 |
0,00 |
0,00 |
6.613.750,00 |
0,00 |
0,00 |
|
|
V. Trade creditors
and other accounts payable: 32500 |
4.208.480,00 |
4.362.683,00 |
4.647.814,00 |
6.272.986,00 |
4.539.910,00 |
|
|
1. Suppliers: 32510 |
1.995.997,00 |
2.773.166,00 |
3.297.268,00 |
4.600.830,00 |
3.136.994,00 |
|
|
a) Long-term debts : 32511 |
0,00 |
0,00 |
0,00 |
0,00 |
0,00 |
|
|
b) Short-term debts : 32512 |
1.995.997,00 |
2.773.166,00 |
3.297.268,00 |
4.600.830,00 |
3.136.994,00 |
|
|
2. Suppliers, Group companies and associates: 32520 |
1.259.047,00 |
439.246,00 |
332.631,00 |
202.481,00 |
314.357,00 |
|
|
3. Other creditors: 32530 |
260.959,00 |
324.733,00 |
258.324,00 |
551.953,00 |
421.423,00 |
|
|
4. Personnel (remuneration due): 32540 |
147.812,00 |
137.219,00 |
116.167,00 |
109.074,00 |
151.009,00 |
|
|
5. Liabilities for current tax: 32550 |
0,00 |
0,00 |
0,00 |
0,00 |
0,00 |
|
|
6. Other accounts payable to Public Administrations.: 32560 |
148.330,00 |
153.984,00 |
132.517,00 |
502.157,00 |
205.918,00 |
|
|
7. Advances from clients: 32570 |
396.335,00 |
534.335,00 |
510.907,00 |
306.491,00 |
310.209,00 |
|
|
VI. Short-term
accruals: 32600 |
0,00 |
0,00 |
0,00 |
0,00 |
0,00 |
|
|
VII. Special
short-term debts : 32700 |
0,00 |
0,00 |
0,00 |
0,00 |
0,00 |
|
|
TOTAL NET WORTH AND LIABILITIES (A + B +
C) : 30000 |
37.954.621,00 |
39.454.435,00 |
32.508.317,00 |
29.458.457,00 |
24.865.053,00 |
|
|
|
ORIGINAL |
ORIGINAL |
ORIGINAL |
ORIGINAL |
ORIGINAL |
|
|
Profit and Loss |
2012 |
2011 |
2010 |
2009 |
2008 |
|
|
1. Net turnover: 40100 |
13.631.803,00 |
15.789.784,00 |
18.722.909,00 |
20.603.685,00 |
22.140.657,00 |
|
|
a) Sales: 40110 |
12.710.195,00 |
14.884.002,00 |
17.991.777,00 |
18.681.394,00 |
21.394.276,00 |
|
|
b) Rendering of
services: 40120 |
921.608,00 |
905.782,00 |
731.132,00 |
1.922.291,00 |
746.381,00 |
|
|
c) Income of
financial nature of holding companies: 40130 |
0,00 |
0,00 |
0,00 |
0,00 |
0,00 |
|
|
2. Changes in stocks of finished goods and
work in progress: 40200 |
413.582,00 |
452.132,00 |
-1.492.114,00 |
-2.108.204,00 |
5.448.841,00 |
|
|
3. Works carried out by the company for
its assets: 40300 |
0,00 |
284.606,00 |
0,00 |
198.800,00 |
595.495,00 |
|
|
4. Supplies : 40400 |
-8.212.746,00 |
-10.181.084,00 |
-10.169.074,00 |
-11.987.076,00 |
-20.400.402,00 |
|
|
a) Stock consumption:
40410 |
0,00 |
0,00 |
0,00 |
0,00 |
0,00 |
|
|
b) Consumption of raw
materials and miscellaneous consumable ones: 40420 |
-7.501.353,00 |
-9.344.490,00 |
-9.821.348,00 |
-10.632.032,00 |
-18.802.978,00 |
|
|
c) Works carried out
by other companies: 40430 |
-711.393,00 |
-836.353,00 |
-500.886,00 |
-1.214.330,00 |
-1.663.410,00 |
|
|
d) Impairment of stock,
primary material and other supplies: 40440 |
0,00 |
-241,00 |
153.160,00 |
-140.714,00 |
65.986,00 |
|
|
5. Other operating income: 40500 |
182.263,00 |
179.660,00 |
50.914,00 |
256.250,00 |
556.422,00 |
|
|
a) Auxiliary income and
other from current management: 40510 |
0,00 |
0,00 |
150,00 |
1.502,00 |
1.502,00 |
|
|
b) Operation
subsidies included in the Period's result: 40520 |
182.263,00 |
179.660,00 |
50.764,00 |
254.748,00 |
554.920,00 |
|
|
6. Personnel costs: 40600 |
-3.611.169,00 |
-3.570.277,00 |
-3.337.558,00 |
-3.503.863,00 |
-4.428.059,00 |
|
|
a) Wages, salaries et
al.: 40610 |
-2.927.144,00 |
-2.885.980,00 |
-2.704.884,00 |
-2.845.732,00 |
-3.625.921,00 |
|
|
b) Social security
costs: 40620 |
-684.025,00 |
-684.297,00 |
-632.674,00 |
-658.131,00 |
-802.138,00 |
|
|
c) Provisions :
40630 |
0,00 |
0,00 |
0,00 |
0,00 |
0,00 |
|
|
7. Other operating costs: 40700 |
-2.460.280,00 |
-2.929.215,00 |
-2.940.676,00 |
-3.073.130,00 |
-2.110.764,00 |
|
|
a) External services:
40710 |
-2.441.091,00 |
-2.929.760,00 |
-2.926.347,00 |
-2.989.303,00 |
-1.923.040,00 |
|
|
b) Taxes: 40720 |
-19.189,00 |
-23.604,00 |
-14.329,00 |
-6.219,00 |
-10.151,00 |
|
|
c) Losses,
impairments and variation in provisions from trade operations : 40730 |
0,00 |
24.149,00 |
0,00 |
-77.608,00 |
-177.573,00 |
|
|
d) Other current management
expenditure : 40740 |
0,00 |
0,00 |
0,00 |
0,00 |
0,00 |
|
|
e) Expenses due to
greenhouse gas emissions: 40750 |
0,00 |
0,00 |
0,00 |
0,00 |
0,00 |
|
|
8. Amortisation of fixed assets:
40800 |
-1.848.833,00 |
-1.462.431,00 |
-926.799,00 |
-1.103.809,00 |
-1.082.503,00 |
|
|
9. Allocation of subsidies of
non-financial fixed assets and other: 40900 |
50.831,00 |
37.290,00 |
38.864,00 |
46.425,00 |
54.098,00 |
|
|
10. Excess provisions : 41000 |
0,00 |
0,00 |
0,00 |
0,00 |
0,00 |
|
|
11. Impairment and result of transfers of
fixed assets: 41100 |
0,00 |
0,00 |
0,00 |
0,00 |
0,00 |
|
|
a) Impairment and
losses : 41110 |
0,00 |
0,00 |
0,00 |
0,00 |
0,00 |
|
|
b) Results for transfers
and other : 41120 |
0,00 |
0,00 |
0,00 |
0,00 |
0,00 |
|
|
c) Impairment and
profit due to disposals of assets of holding companies: 41130 |
0,00 |
0,00 |
0,00 |
0,00 |
0,00 |
|
|
12. Negative difference in combined businesses:
41200 |
0,00 |
0,00 |
0,00 |
0,00 |
0,00 |
|
|
13. Other results : 41300 |
-25.692,00 |
148.374,00 |
4.876,00 |
8.249,00 |
2.418,00 |
|
|
A.1) OPERATING INCOME (1 + 2 + 3 + 4 + 5 +
6 + 7 + 8 + 9 + 10 + 11 + 12 + 13) : 49100 |
-1.880.241,00 |
-1.251.161,00 |
-48.658,00 |
-662.673,00 |
776.203,00 |
|
|
14. Financial income : 41400 |
74.128,00 |
76.211,00 |
26.242,00 |
7.839,00 |
59.697,00 |
|
|
a) Of shares in
equity instruments : 41410 |
0,00 |
49,00 |
86,00 |
41,00 |
0,00 |
|
|
a 1) In Group companies and associates: 41411 |
0,00 |
0,00 |
0,00 |
0,00 |
0,00 |
|
|
a 2) In third parties: 41412 |
0,00 |
49,00 |
86,00 |
41,00 |
0,00 |
|
|
b) From negotiable securities
and other financial instruments : 41420 |
71.048,00 |
76.162,00 |
26.156,00 |
7.798,00 |
59.697,00 |
|
|
b 1) From Group companies and associates : 41421 |
71.048,00 |
73.069,00 |
21.044,00 |
5.582,00 |
58.561,00 |
|
|
b 2) From third parties : 41422 |
0,00 |
3.093,00 |
5.112,00 |
2.216,00 |
1.136,00 |
|
|
c) Allocation of
financial subsidies, donations and legacies : 41430 |
3.080,00 |
0,00 |
0,00 |
0,00 |
0,00 |
|
|
15. Financial expenditure: 41500 |
-385.504,00 |
-527.822,00 |
-344.338,00 |
-344.470,00 |
-341.893,00 |
|
|
a) Amounts owed to
Group companies and associates : 41510 |
0,00 |
-178.479,00 |
0,00 |
0,00 |
0,00 |
|
|
b) For debts with
third parties : 41520 |
0,00 |
-349.343,00 |
-344.338,00 |
-344.470,00 |
-341.893,00 |
|
|
c) Stock renewal :
41530 |
-385.504,00 |
0,00 |
0,00 |
0,00 |
0,00 |
|
|
16. Changes in fair value of financial instruments
: 41600 |
0,00 |
0,00 |
0,00 |
0,00 |
0,00 |
|
|
a) Trading book and
other : 41610 |
0,00 |
0,00 |
0,00 |
0,00 |
0,00 |
|
|
b) Allocation of
financial assets held for sale to the result for the period: 41620 |
0,00 |
0,00 |
0,00 |
0,00 |
0,00 |
|
|
17. Exchange rate differences :
41700 |
-123.034,00 |
177.641,00 |
60.575,00 |
63.236,00 |
262.875,00 |
|
|
18. Impairment and result for transfers of
financial instruments: 41800 |
-638.799,00 |
-1.434.410,00 |
410.629,00 |
-411.336,00 |
-355.973,00 |
|
|
a) Impairment and
losses : 41810 |
-638.799,00 |
-1.231.960,00 |
410.629,00 |
-411.336,00 |
-355.973,00 |
|
|
b) Results for
transfers and other : 41820 |
0,00 |
-202.450,00 |
0,00 |
0,00 |
0,00 |
|
|
19. Other financial income and
expenditure: 42100 |
0,00 |
0,00 |
0,00 |
0,00 |
0,00 |
|
|
a) Incorporation of
financial expenditure to assets: 42110 |
0,00 |
0,00 |
0,00 |
0,00 |
0,00 |
|
|
b) Financial income
from arrangement with creditors: 42120 |
0,00 |
0,00 |
0,00 |
0,00 |
0,00 |
|
|
c) Other income and
expenditure: 42130 |
0,00 |
0,00 |
0,00 |
0,00 |
0,00 |
|
|
A.2) FINANCIAL REVENUE (14+15+16+17+18+19)
: 49200 |
-1.073.209,00 |
-1.708.380,00 |
153.108,00 |
-684.731,00 |
-375.294,00 |
|
|
A.3) NET RESULT BEFORE TAXES (A.1+A.2) :
49300 |
-2.953.450,00 |
-2.959.541,00 |
104.450,00 |
-1.347.404,00 |
400.909,00 |
|
|
20. Income taxes: 41900 |
41.050,00 |
8.426,00 |
43.301,00 |
0,00 |
0,00 |
|
|
A.4) PROFIT AFTER TAXES (A.3+20) :
49400 |
-2.912.400,00 |
-2.951.115,00 |
147.751,00 |
-1.347.404,00 |
400.909,00 |
|
|
21. Result of the year coming from
interrupted operations : 42000 |
0,00 |
0,00 |
0,00 |
0,00 |
0,00 |
|
|
A.5) RESULT OF THE PERIOD (A.4+21) :
49500 |
-2.912.400,00 |
-2.951.115,00 |
147.751,00 |
-1.347.404,00 |
400.909,00 |
|
> Normal Balance Sheet under the rules of the 1990 General Accounting Plan (repealed since 1st January of 2008)
Information corresponding to the fiscal year 2012 2011 2010 2009 2008 has been compiled based on the equivalence criteria stipulated in Act JUS/206/2009. To view details on the methodology 2012 2011 2010 2009 2008 is taken from information submitted to the TRADE REGISTER.
|
|
EQUIVALENCIA |
EQUIVALENCIA |
EQUIVALENCIA |
EQUIVALENCIA |
EQUIVALENCIA |
|
|
ASSETS |
2012 |
2011 |
2010 |
2009 |
2008 |
|
|
A) SHAREHOLDERS (PARTNERS) BY UNCALLED
SUSCRIBED CAPITAL: |
1.931.482,00 |
1.931.482,00 |
0,00 |
0,00 |
0,00 |
|
|
B) FIXED ASSETS: |
17.357.657,00 |
16.396.455,00 |
7.612.218,00 |
5.472.707,00 |
6.168.529,00 |
|
|
I. Formation expenses:
|
0,00 |
0,00 |
0,00 |
0,00 |
0,00 |
|
|
II. Intangible fixed
assets: |
6.381.634,00 |
5.467.785,00 |
4.346.345,00 |
2.462.544,00 |
2.687.449,00 |
|
|
1. Research and development costs: |
6.199.929,00 |
5.399.302,00 |
4.242.349,00 |
2.337.604,00 |
2.534.137,00 |
|
|
2. Concessions, patents, licences, trademarks et al.: |
0,00 |
0,00 |
0,00 |
0,00 |
0,00 |
|
|
3. Goodwill: |
0,00 |
0,00 |
0,00 |
0,00 |
0,00 |
|
|
4. Key money paid for premises: |
0,00 |
0,00 |
0,00 |
0,00 |
0,00 |
|
|
5. Software: |
181.705,00 |
68.483,00 |
103.996,00 |
124.940,00 |
153.312,00 |
|
|
6. Assets under capital leases: |
0,00 |
0,00 |
0,00 |
0,00 |
0,00 |
|
|
7. Payments on account: |
0,00 |
0,00 |
0,00 |
0,00 |
0,00 |
|
|
8. Provisions: |
0,00 |
0,00 |
0,00 |
0,00 |
0,00 |
|
|
9. Accumulated depreciation: |
0,00 |
0,00 |
0,00 |
0,00 |
0,00 |
|
|
III. Tangible fixed
assets: |
7.698.301,00 |
7.692.736,00 |
1.051.169,00 |
545.443,00 |
622.490,00 |
|
|
1. Land and construction: |
0,00 |
0,00 |
0,00 |
0,00 |
0,00 |
|
|
2.
Technical installations and machinery: |
413.714,00 |
485.152,00 |
66.293,00 |
34.399,00 |
39.258,00 |
|
|
3. Other installations, tools and furniture: |
5.113.298,00 |
5.996.239,00 |
819.352,00 |
425.155,00 |
485.211,00 |
|
|
4. Payments on account and tangible fixed assets under construction: |
1.138.314,00 |
0,00 |
0,00 |
0,00 |
0,00 |
|
|
5. Other tangible assets: |
1.032.975,00 |
1.211.344,00 |
165.523,00 |
85.889,00 |
98.021,00 |
|
|
6. Provisions: |
0,00 |
0,00 |
0,00 |
0,00 |
0,00 |
|
|
7. Accumulated depreciation: |
0,00 |
0,00 |
0,00 |
0,00 |
0,00 |
|
|
IV. Financial
investments: |
3.277.722,00 |
3.235.934,00 |
2.214.704,00 |
2.464.720,00 |
2.858.590,00 |
|
|
1. Equity investments in group companies: |
652.846,00 |
583.920,00 |
1.314.529,00 |
1.075.525,00 |
1.085.528,00 |
|
|
2. Receivables from group companies: |
2.582.906,00 |
2.610.044,00 |
855.405,00 |
1.343.813,00 |
1.748.944,00 |
|
|
3. Equity investment in associated companies: |
0,00 |
0,00 |
0,00 |
0,00 |
0,00 |
|
|
4. Credits to associated companies: |
0,00 |
0,00 |
0,00 |
0,00 |
0,00 |
|
|
5. Long-term securities portfolio: |
29.305,00 |
29.305,00 |
29.305,00 |
28.405,00 |
481,00 |
|
|
6. Other receivables: |
0,00 |
0,00 |
2.800,00 |
9.460,00 |
16.120,00 |
|
|
7.
Long term guarantees and deposits: |
12.665,00 |
12.665,00 |
12.665,00 |
7.517,00 |
7.517,00 |
|
|
8. Provisions: |
0,00 |
0,00 |
0,00 |
0,00 |
0,00 |
|
|
9. Long-term receivables from public bodies: |
0,00 |
0,00 |
0,00 |
0,00 |
0,00 |
|
|
V. Own shares: |
0,00 |
0,00 |
0,00 |
0,00 |
0,00 |
|
|
VI. Long-term trade
receivables: |
0,00 |
0,00 |
0,00 |
0,00 |
0,00 |
|
|
C) Deferred expenses: |
0,00 |
0,00 |
0,00 |
0,00 |
0,00 |
|
|
D) CURRENT ASSETS: |
20.596.964,00 |
23.057.980,00 |
24.896.099,00 |
23.985.750,00 |
18.696.524,00 |
|
|
I. Called-up share
capital (not paid): |
0,00 |
0,00 |
0,00 |
0,00 |
0,00 |
|
|
II. Stocks: |
6.899.332,00 |
7.053.492,00 |
6.622.184,00 |
7.886.428,00 |
9.861.567,00 |
|
|
1. Goods for resale: |
0,00 |
0,00 |
0,00 |
0,00 |
0,00 |
|
|
2. Raw materials and other consumables: |
1.416.430,00 |
1.889.762,00 |
1.776.110,00 |
1.619.735,00 |
1.525.236,00 |
|
|
3. Goods in process and semifinished ones: |
1.733.986,00 |
1.958.799,00 |
1.710.343,00 |
1.141.076,00 |
3.076.786,00 |
|
|
4. Finished products: |
3.595.134,00 |
3.143.786,00 |
2.940.110,00 |
4.977.146,00 |
5.171.277,00 |
|
|
5. Byproducts, scrap and recovered materials: |
0,00 |
0,00 |
0,00 |
0,00 |
0,00 |
|
|
6. Payments on account: |
153.782,00 |
61.145,00 |
195.621,00 |
148.471,00 |
88.268,00 |
|
|
7. Provisions: |
0,00 |
0,00 |
0,00 |
0,00 |
0,00 |
|
|
III. Debtors: |
12.994.622,00 |
15.878.129,00 |
16.673.106,00 |
13.940.692,00 |
8.815.299,00 |
|
|
1.
Trade debtors / accounts receivable: |
3.563.677,00 |
6.636.499,00 |
9.057.981,00 |
7.471.261,00 |
3.462.418,00 |
|
|
2. Accounts receivable, Group companies: |
9.058.651,00 |
8.554.793,00 |
7.045.909,00 |
6.246.224,00 |
4.617.252,00 |
|
|
3. Accounts receivable, associated companies: |
0,00 |
0,00 |
0,00 |
0,00 |
0,00 |
|
|
4. Other debtors: |
0,00 |
0,00 |
0,00 |
0,00 |
34.969,00 |
|
|
5. Staff: |
0,00 |
2.800,00 |
6.660,00 |
6.660,00 |
9.344,00 |
|
|
6. Public bodies: |
372.294,00 |
684.037,00 |
562.556,00 |
216.547,00 |
691.316,00 |
|
|
7. Provisions: |
0,00 |
0,00 |
0,00 |
0,00 |
0,00 |
|
|
IV. Short-term
investments: |
283.058,00 |
51.733,00 |
1.461.286,00 |
2.130.590,00 |
0,00 |
|
|
1. Equity investments in group companies: |
0,00 |
0,00 |
0,00 |
0,00 |
0,00 |
|
|
2. Receivables from group companies: |
283.058,00 |
51.733,00 |
1.461.286,00 |
964.876,00 |
0,00 |
|
|
3. Equity investment in associated companies: |
0,00 |
0,00 |
0,00 |
0,00 |
0,00 |
|
|
4. Credits to associated companies: |
0,00 |
0,00 |
0,00 |
0,00 |
0,00 |
|
|
5. Short term securities portfolio: |
0,00 |
0,00 |
0,00 |
0,00 |
0,00 |
|
|
6. Other receivables: |
0,00 |
0,00 |
0,00 |
0,00 |
0,00 |
|
|
7. Shor term guarantees and deposits: |
0,00 |
0,00 |
0,00 |
1.165.714,00 |
0,00 |
|
|
8. Provisions: |
0,00 |
0,00 |
0,00 |
0,00 |
0,00 |
|
|
V. Short-term
treasury shares: |
0,00 |
0,00 |
0,00 |
0,00 |
0,00 |
|
|
VI. Cash at bank and
in hand: |
416.147,00 |
65.748,00 |
125.571,00 |
28.040,00 |
19.658,00 |
|
|
VII. Prepayments and
accrued income: |
3.805,00 |
8.878,00 |
13.952,00 |
0,00 |
0,00 |
|
|
GENERAL TOTAL (A + B + C + D): |
39.886.103,00 |
41.385.917,00 |
32.508.317,00 |
29.458.457,00 |
24.865.053,00 |
|
MERCANTILE
REGISTRY.
|
|
EQUIVALENCIA |
EQUIVALENCIA |
EQUIVALENCIA |
EQUIVALENCIA |
EQUIVALENCIA |
|
|
LIABILITIES |
2012 |
2011 |
2010 |
2009 |
2008 |
|
|
A) EQUITY: |
15.753.465,00 |
18.665.365,00 |
6.762.026,00 |
6.613.004,00 |
7.970.435,00 |
|
|
I. Subscribed
capital: |
20.514.589,00 |
20.514.589,00 |
9.055.994,00 |
9.055.994,00 |
9.055.994,00 |
|
|
II. Share premium:
|
0,00 |
0,00 |
0,00 |
0,00 |
0,00 |
|
|
III. Revaluation
reserves: |
0,00 |
0,00 |
0,00 |
0,00 |
0,00 |
|
|
IV. Reserves: |
1.102.391,00 |
1.101.891,00 |
-17.990,00 |
-19.261,00 |
-9.234,00 |
|
|
1. Legal reserve: |
1.087.003,00 |
1.087.003,00 |
14.160,00 |
14.160,00 |
14.160,00 |
|
|
2. Reserves for own shares: |
0,00 |
0,00 |
0,00 |
0,00 |
0,00 |
|
|
3.
Reserves for shares of the controlling company: |
0,00 |
0,00 |
0,00 |
0,00 |
0,00 |
|
|
4. Statutory reserves: |
0,00 |
0,00 |
0,00 |
0,00 |
0,00 |
|
|
5. Miscellaneous reserves: |
-145.094,00 |
145.897,00 |
198.807,00 |
103.143,00 |
33.128,00 |
|
|
Differences due to capital adjustement to euros: |
160.482,00 |
-131.010,00 |
-230.957,00 |
-136.565,00 |
-56.522,00 |
|
|
V. Profit or loss
brought forward: |
-2.951.115,00 |
0,00 |
-2.423.729,00 |
-1.076.325,00 |
-1.477.234,00 |
|
|
1. Retained earnings: |
0,00 |
0,00 |
0,00 |
0,00 |
0,00 |
|
|
2. Prior year losses: |
-2.951.115,00 |
0,00 |
-2.423.729,00 |
-1.076.325,00 |
-1.477.234,00 |
|
|
3. Partners' contributions so as to compensate losses: |
0,00 |
0,00 |
0,00 |
0,00 |
0,00 |
|
|
VI. Profit or loss
for the financial year: |
-2.912.400,00 |
-2.951.115,00 |
147.751,00 |
-1.347.404,00 |
400.909,00 |
|
|
VII. Interim dividend
paid: |
0,00 |
0,00 |
0,00 |
0,00 |
0,00 |
|
|
VIII. Own shares for
capital reduction: |
0,00 |
0,00 |
0,00 |
0,00 |
0,00 |
|
|
B) Deferred income: |
78.458,00 |
77.291,00 |
56.868,00 |
53.901,00 |
77.300,00 |
|
|
1. Capital grants: |
78.458,00 |
77.291,00 |
56.868,00 |
53.901,00 |
77.300,00 |
|
|
2. Unrealised exchange gains: |
0,00 |
0,00 |
0,00 |
0,00 |
0,00 |
|
|
3.
Other deferred income: |
0,00 |
0,00 |
0,00 |
0,00 |
0,00 |
|
|
4. Public revenues to distribute in several financial years: |
0,00 |
0,00 |
0,00 |
0,00 |
0,00 |
|
|
C) PROVISIONS FOR LIABILITIES AND CHARGES:
|
0,00 |
0,00 |
0,00 |
0,00 |
0,00 |
|
|
1. Provisions for pension fund and other similar obligations: |
0,00 |
0,00 |
0,00 |
0,00 |
0,00 |
|
|
2. Provisions for taxes: |
0,00 |
0,00 |
0,00 |
0,00 |
0,00 |
|
|
3.
Other provisions: |
0,00 |
0,00 |
0,00 |
0,00 |
0,00 |
|
|
4. Reversion fund: |
0,00 |
0,00 |
0,00 |
0,00 |
0,00 |
|
|
D) LONG TERM LIABILITIES: |
13.564.008,00 |
8.337.962,00 |
6.354.441,00 |
6.889.477,00 |
6.500.315,00 |
|
|
I. Issued debentures
and other marketable securities: |
0,00 |
0,00 |
0,00 |
0,00 |
0,00 |
|
|
1. Non-convertible debentures: |
0,00 |
0,00 |
0,00 |
0,00 |
0,00 |
|
|
2. Convertible debentures: |
0,00 |
0,00 |
0,00 |
0,00 |
0,00 |
|
|
3. Other debt securities: |
0,00 |
0,00 |
0,00 |
0,00 |
0,00 |
|
|
II. Amounts owed to
credit institutions: |
796.306,00 |
380.954,00 |
849.934,00 |
1.349.979,00 |
1.250.000,00 |
|
|
1. Loans and other liabilities: |
422.016,00 |
0,00 |
849.934,00 |
1.349.979,00 |
1.250.000,00 |
|
|
2. Long-term liabilities from capital leases: |
374.290,00 |
380.954,00 |
0,00 |
0,00 |
0,00 |
|
|
III. Debts with
companies of the group and affiliated ones: |
0,00 |
7.689.720,00 |
5.189.720,00 |
5.189.720,00 |
5.207.371,00 |
|
|
1. Amounts owed to group companies: |
0,00 |
7.689.720,00 |
5.189.720,00 |
5.189.720,00 |
5.207.371,00 |
|
|
2. Amounts owed to associated companies: |
0,00 |
0,00 |
0,00 |
0,00 |
0,00 |
|
|
IV. Other creditors:
|
12.767.702,00 |
267.288,00 |
314.787,00 |
349.778,00 |
42.944,00 |
|
|
1.
Long-term bills of exchange payable: |
0,00 |
0,00 |
0,00 |
0,00 |
0,00 |
|
|
2. Other creditors: |
12.724.115,00 |
224.348,00 |
283.194,00 |
319.833,00 |
0,00 |
|
|
3. Long term guarantees and deposits received: |
0,00 |
0,00 |
0,00 |
0,00 |
0,00 |
|
|
4. Long term payables to public bodies: |
43.587,00 |
42.940,00 |
31.593,00 |
29.945,00 |
42.944,00 |
|
|
V. Unpaid portion of
equity investment: |
0,00 |
0,00 |
0,00 |
0,00 |
0,00 |
|
|
1. Group companies: |
0,00 |
0,00 |
0,00 |
0,00 |
0,00 |
|
|
2. Associated companies: |
0,00 |
0,00 |
0,00 |
0,00 |
0,00 |
|
|
3. Third parties: |
0,00 |
0,00 |
0,00 |
0,00 |
0,00 |
|
|
VI. Long term trade
creditors: |
0,00 |
0,00 |
0,00 |
0,00 |
0,00 |
|
|
E) SHORT TERM CREDITORS: |
10.490.172,00 |
14.305.299,00 |
19.334.982,00 |
15.902.075,00 |
10.317.003,00 |
|
|
I. Issued debentures and
other marketable securities: |
0,00 |
0,00 |
0,00 |
0,00 |
0,00 |
|
|
1. Non-convertible debentures: |
0,00 |
0,00 |
0,00 |
0,00 |
0,00 |
|
|
2. Convertible debentures: |
0,00 |
0,00 |
0,00 |
0,00 |
0,00 |
|
|
3. Other debt securities: |
0,00 |
0,00 |
0,00 |
0,00 |
0,00 |
|
|
4. Accrued interest on debentures and other debt securities: |
0,00 |
0,00 |
0,00 |
0,00 |
0,00 |
|
|
II. Amounts owed to credit
institutions: |
6.154.199,00 |
9.887.730,00 |
8.036.779,00 |
9.629.089,00 |
5.777.093,00 |
|
|
1. Loans and other liabilities: |
6.105.169,00 |
9.862.702,00 |
8.036.779,00 |
9.629.089,00 |
5.777.093,00 |
|
|
2.
Accrued interest on liabilities with credit institutions: |
0,00 |
0,00 |
0,00 |
0,00 |
0,00 |
|
|
3. Short-term liabilities from capital leases: |
49.030,00 |
25.028,00 |
0,00 |
0,00 |
0,00 |
|
|
III. Short-term amounts
owed to group and associated companies: |
1.259.047,00 |
439.246,00 |
6.946.381,00 |
202.481,00 |
314.357,00 |
|
|
1. Amounts owed to group companies: |
1.259.047,00 |
439.246,00 |
6.946.381,00 |
202.481,00 |
314.357,00 |
|
|
2. Amounts owed to associated companies: |
0,00 |
0,00 |
0,00 |
0,00 |
0,00 |
|
|
IV. Trade creditors:
|
2.653.291,00 |
3.632.234,00 |
4.066.499,00 |
5.459.274,00 |
3.868.626,00 |
|
|
1.
Advanced payments from customers: |
396.335,00 |
534.335,00 |
510.907,00 |
306.491,00 |
310.209,00 |
|
|
2. Amounts owed for purchases of goods or services: |
2.256.956,00 |
3.097.899,00 |
3.555.592,00 |
5.152.783,00 |
3.558.417,00 |
|
|
3. Debts represented by notes payable: |
0,00 |
0,00 |
0,00 |
0,00 |
0,00 |
|
|
V. Other creditors:
|
423.635,00 |
346.089,00 |
285.323,00 |
611.231,00 |
356.927,00 |
|
|
1. Public bodies: |
148.330,00 |
153.984,00 |
132.517,00 |
502.157,00 |
205.918,00 |
|
|
2. Bills of exchange payable: |
0,00 |
0,00 |
0,00 |
0,00 |
0,00 |
|
|
3. Miscellaneous debts: |
127.493,00 |
54.886,00 |
36.639,00 |
0,00 |
0,00 |
|
|
4. Wages and salaries payable: |
147.812,00 |
137.219,00 |
116.167,00 |
109.074,00 |
151.009,00 |
|
|
5. Guarantees and deposits received at short term: |
0,00 |
0,00 |
0,00 |
0,00 |
0,00 |
|
|
VI. Provisions:
|
0,00 |
0,00 |
0,00 |
0,00 |
0,00 |
|
|
VII. Prepayments and
accrued income: |
0,00 |
0,00 |
0,00 |
0,00 |
0,00 |
|
|
F) SHORT-TERM PROVISIONS FOR LIABILITIES
AND CHARGES: |
0,00 |
0,00 |
0,00 |
0,00 |
0,00 |
|
|
GENERAL TOTAL (A + B + C + D + E + F):
|
39.886.103,00 |
41.385.917,00 |
32.508.317,00 |
29.458.457,00 |
24.865.053,00 |
|
MERCANTILE
REGISTRY.
|
|
EQUIVALENCIA |
EQUIVALENCIA |
EQUIVALENCIA |
EQUIVALENCIA |
EQUIVALENCIA |
|
|
DEBIT |
2012 |
2011 |
2010 |
2009 |
2008 |
|
|
A) CHARGES (A.1 to A.15): |
17.265.007,00 |
20.096.813,00 |
18.756.629,00 |
22.531.888,00 |
28.719.594,00 |
|
|
A.1. Stock reduction of both manufactured goods and the ones in process:
|
0,00 |
0,00 |
1.492.114,00 |
2.108.204,00 |
0,00 |
|
|
A.2. Supplies: |
8.212.746,00 |
10.180.843,00 |
10.322.234,00 |
11.846.362,00 |
20.466.388,00 |
|
|
a) Stock consumption: |
0,00 |
0,00 |
0,00 |
0,00 |
0,00 |
|
|
b) Consumption of raw materials and miscellaneous
consumable ones: |
7.501.353,00 |
9.344.490,00 |
9.821.348,00 |
10.632.032,00 |
18.802.978,00 |
|
|
c) Miscellaneous external expenditure: |
711.393,00 |
836.353,00 |
500.886,00 |
1.214.330,00 |
1.663.410,00 |
|
|
A.3. Staff costs: |
3.611.169,00 |
3.570.277,00 |
3.337.558,00 |
3.503.863,00 |
4.428.059,00 |
|
|
a) Wages, salaries et al.: |
2.927.144,00 |
2.885.980,00 |
2.704.884,00 |
2.845.732,00 |
3.625.921,00 |
|
|
b) Social security costs: |
684.025,00 |
684.297,00 |
632.674,00 |
658.131,00 |
802.138,00 |
|
|
A.4. Depreciation expense: |
1.848.833,00 |
1.462.431,00 |
926.799,00 |
1.103.809,00 |
1.082.503,00 |
|
|
A.5.
Variation of trade provisions and losses of unrecovered receivables: |
0,00 |
-23.908,00 |
-153.160,00 |
218.322,00 |
111.587,00 |
|
|
a) Stock provision variation: |
0,00 |
241,00 |
-153.160,00 |
140.714,00 |
-65.986,00 |
|
|
b) Variation in provision and bad debt losses: |
0,00 |
0,00 |
0,00 |
77.608,00 |
177.573,00 |
|
|
c) Variation of other trade provisions: |
0,00 |
-24.149,00 |
0,00 |
0,00 |
0,00 |
|
|
A.6. Other operating charges: |
2.460.280,00 |
2.953.364,00 |
2.940.676,00 |
2.995.522,00 |
1.933.191,00 |
|
|
a) External services: |
2.441.091,00 |
2.929.760,00 |
2.926.347,00 |
2.989.303,00 |
1.923.040,00 |
|
|
b) Taxes: |
19.189,00 |
23.604,00 |
14.329,00 |
6.219,00 |
10.151,00 |
|
|
c) Other operating expenses: |
0,00 |
0,00 |
0,00 |
0,00 |
0,00 |
|
|
d) Allocation to revision fund: |
0,00 |
0,00 |
0,00 |
0,00 |
0,00 |
|
|
A.I. OPERATING
BENEFITS (B.1+B.2+B.3+B.4-A.1-A.2-A.3-A.4-A.5-A.6): |
0,00 |
0,00 |
0,00 |
0,00 |
719.687,00 |
|
|
A.7. Financial and similar charges: |
475.663,00 |
730.272,00 |
344.338,00 |
344.470,00 |
341.893,00 |
|
|
a) Due to liabilities with companies of the group:
|
0,00 |
178.479,00 |
0,00 |
0,00 |
0,00 |
|
|
b) Due to liabilities with associated companies: |
0,00 |
0,00 |
0,00 |
0,00 |
0,00 |
|
|
c) Due to other debts.: |
385.504,00 |
349.343,00 |
344.338,00 |
344.470,00 |
341.893,00 |
|
|
d) Losses from financial investments: |
90.159,00 |
202.450,00 |
0,00 |
0,00 |
0,00 |
|
|
A.8. Changes in financial investment provisions: |
0,00 |
0,00 |
0,00 |
0,00 |
0,00 |
|
|
A.9. Exchange losses: |
123.034,00 |
0,00 |
0,00 |
0,00 |
0,00 |
|
|
A.II. NET FINANCIAL INCOME
(B.5+B.6+B.7+B.8-A.7-A.8-A.9): |
0,00 |
0,00 |
0,00 |
0,00 |
0,00 |
|
|
A.III. PROFIT FROM
ORDINARY ACTIVITIES (A.I+A.II-B.I-B.II): |
0,00 |
0,00 |
0,00 |
0,00 |
700.366,00 |
|
|
A.10.
Changes in provisions for intangible, tangible and securities portfolio:
|
548.640,00 |
1.231.960,00 |
-410.629,00 |
411.336,00 |
355.973,00 |
|
|
A.11. Losses from tangible and intangible fixed assets and securities
portfolio: |
0,00 |
0,00 |
0,00 |
0,00 |
0,00 |
|
|
A.12. Losses from transactions with own shares and debentures: |
0,00 |
0,00 |
0,00 |
0,00 |
0,00 |
|
|
A.13. Extraordinary expenses: |
25.692,00 |
0,00 |
0,00 |
0,00 |
0,00 |
|
|
A.14. Expenses and losses of former financial years: |
0,00 |
0,00 |
0,00 |
0,00 |
0,00 |
|
|
A.IV. EXTRAORDINARY
PROFIT (B.9+B.10+B.11+B.12+B.13-A.10-A.11-A.12-A.13-A.14): |
0,00 |
0,00 |
454.369,00 |
0,00 |
0,00 |
|
|
A.V. PROFIT BEFORE
TAXES (A.III+A.IV-B.III-B.IV): |
0,00 |
0,00 |
104.450,00 |
0,00 |
400.909,00 |
|
|
A.15. Corporation tax: |
-41.050,00 |
-8.426,00 |
-43.301,00 |
0,00 |
0,00 |
|
|
A.16.
Miscellaneous taxes: |
0,00 |
0,00 |
0,00 |
0,00 |
0,00 |
|
|
A.VI. FINANCIAL YEAR
RESULTS (PROFIT) (A.V-A.15-A.16): |
0,00 |
0,00 |
147.751,00 |
0,00 |
400.909,00 |
|
MERCANTILE
REGISTRY.
|
|
EQUIVALENCIA |
EQUIVALENCIA |
EQUIVALENCIA |
EQUIVALENCIA |
EQUIVALENCIA |
|
|
CREDIT |
2012 |
2011 |
2010 |
2009 |
2008 |
|
|
B) INCOME ( B.1 to B.13): |
14.352.607,00 |
17.145.698,00 |
18.904.380,00 |
21.184.484,00 |
29.120.503,00 |
|
|
B.1. Net total sales: |
13.631.803,00 |
15.789.784,00 |
18.722.909,00 |
20.603.685,00 |
22.140.657,00 |
|
|
a) Sales: |
12.710.195,00 |
14.884.002,00 |
17.991.777,00 |
18.681.394,00 |
21.394.276,00 |
|
|
b) Rendering of services: |
921.608,00 |
905.782,00 |
731.132,00 |
1.922.291,00 |
746.381,00 |
|
|
Returns and Rappel on sales: |
0,00 |
0,00 |
0,00 |
0,00 |
0,00 |
|
|
B.2. Stock increase of manufactured goods and products in process: |
413.582,00 |
452.132,00 |
0,00 |
0,00 |
5.448.841,00 |
|
|
B.3. Works performed by the company for fixed assets: |
0,00 |
284.606,00 |
0,00 |
198.800,00 |
595.495,00 |
|
|
B.4. Miscellaneous operating income: |
182.263,00 |
179.660,00 |
50.914,00 |
256.250,00 |
556.422,00 |
|
|
a) Auxiliary income and other from current management:
|
0,00 |
0,00 |
150,00 |
1.502,00 |
1.502,00 |
|
|
b) Grants: |
182.263,00 |
179.660,00 |
50.764,00 |
254.748,00 |
554.920,00 |
|
|
c) Liabilities and charges provisions surplus: |
0,00 |
0,00 |
0,00 |
0,00 |
0,00 |
|
|
B.I. PÉRDIDAS DE
EXPLOTACIÓN (A.1+A.2+A.3+A.4+A.5-A.6-B.1-B.2-B.3-B.4): |
1.905.380,00 |
1.436.825,00 |
92.398,00 |
717.347,00 |
0,00 |
|
|
B.5. Income from equity investment: |
0,00 |
49,00 |
86,00 |
41,00 |
0,00 |
|
|
a) In companies of the group: |
0,00 |
0,00 |
0,00 |
0,00 |
0,00 |
|
|
b) In associated companies: |
0,00 |
0,00 |
0,00 |
0,00 |
0,00 |
|
|
c) Third parties: |
0,00 |
49,00 |
86,00 |
41,00 |
0,00 |
|
|
B.6. Income from other marketable securities and long-term receivables:
|
0,00 |
0,00 |
0,00 |
0,00 |
0,00 |
|
|
a) From companies of the group: |
0,00 |
0,00 |
0,00 |
0,00 |
0,00 |
|
|
b) From associated companies: |
0,00 |
0,00 |
0,00 |
0,00 |
0,00 |
|
|
c) From companies out of the group: |
0,00 |
0,00 |
0,00 |
0,00 |
0,00 |
|
|
B.7. Miscellaneous interests or similar income: |
71.048,00 |
76.162,00 |
26.156,00 |
7.798,00 |
59.697,00 |
|
|
a) From companies of the group: |
71.048,00 |
73.069,00 |
21.044,00 |
5.582,00 |
58.561,00 |
|
|
b) From associated companies: |
0,00 |
0,00 |
0,00 |
0,00 |
0,00 |
|
|
c) Miscellaneous interests: |
0,00 |
3.093,00 |
5.112,00 |
2.216,00 |
1.136,00 |
|
|
d) Profit on financial investment: |
0,00 |
0,00 |
0,00 |
0,00 |
0,00 |
|
|
B.8. Exchange positive differences: |
0,00 |
177.641,00 |
60.575,00 |
63.236,00 |
262.875,00 |
|
|
B.II. NEGATIVE
FINANCIAL RESULTS (A.7+A.8+A.9-B.5-B.6-B.7-B.8): |
527.649,00 |
476.420,00 |
257.521,00 |
273.395,00 |
19.321,00 |
|
|
B.III. LOSSES ON
ORDINARY ACTIVITIES ( B.I + B.II - A.I - A.II ): |
2.433.029,00 |
1.913.245,00 |
349.919,00 |
990.742,00 |
0,00 |
|
|
B.9.Profit on disposal of both tangible and intangible fixed assets and securities
portfolio: |
0,00 |
0,00 |
0,00 |
0,00 |
0,00 |
|
|
B.10. Profit on transactions with own shares and debentures: |
0,00 |
0,00 |
0,00 |
0,00 |
0,00 |
|
|
B.11.
Capital grants transferred to profit and loss: |
53.911,00 |
37.290,00 |
38.864,00 |
46.425,00 |
54.098,00 |
|
|
B.12. Extraordinary income: |
0,00 |
148.374,00 |
4.876,00 |
8.249,00 |
2.418,00 |
|
|
B.13.
Income and profit of former financial years: |
0,00 |
0,00 |
0,00 |
0,00 |
0,00 |
|
|
B.IV. NEGATIVE
EXTRAORDINARY RESULTS (A.10+A.11+A.12+A.13+A.14-B.9-B.10-B.11-B.12-B.13):
|
520.421,00 |
1.046.296,00 |
0,00 |
356.662,00 |
299.457,00 |
|
|
B.V. LOSSES BEFORE
TAXES (B.III+B.IV-A.III-A.IV): |
2.953.450,00 |
2.959.541,00 |
0,00 |
1.347.404,00 |
0,00 |
|
|
B.VI. RESULT OF THE
PERIOD (LOSSES) (B.V+A.15+A.16): |
2.912.400,00 |
2.951.115,00 |
0,00 |
1.347.404,00 |
0,00 |
|
MERCANTILE
REGISTRY.
CASHFLOW STATEMENT
Model:
> Source of information: Data contained in this section is taken from the information declared in the Annual Accounts submitted to the Trade Register.
|
1. Fiscal year result before taxes.:
61100 |
-2.953.450,00 |
-2.959.541,00 |
104.450,00 |
-1.347.404,00 |
400.909,00 |
|
|
2. Results adjustments.: 61200 |
2.871.211,00 |
3.109.662,00 |
581.753,00 |
1.960.478,00 |
1.515.286,00 |
|
|
a) Fixed Assets
Amortization (+).: 61201 |
1.848.833,00 |
1.462.431,00 |
926.799,00 |
1.103.809,00 |
1.082.503,00 |
|
|
b) Obsolescence
Allowances (+/-). : 61202 |
638.799,00 |
1.208.052,00 |
-563.789,00 |
629.658,00 |
467.560,00 |
|
|
d) Allocation of
grants (-).: 61204 |
-50.831,00 |
-37.290,00 |
-38.864,00 |
-46.425,00 |
-54.098,00 |
|
|
f) Results on
disposal of financial instruments (+/-).: 61206 |
0,00 |
202.450,00 |
0,00 |
0,00 |
0,00 |
|
|
g) Financial income
(-).: 61207 |
-74.128,00 |
-76.162,00 |
-26.156,00 |
-7.798,00 |
-59.697,00 |
|
|
h) Financial Expenses
(+). : 61208 |
385.504,00 |
527.822,00 |
344.338,00 |
344.470,00 |
341.893,00 |
|
|
i) Exchange
differences (+/-). : 61209 |
123.034,00 |
-177.641,00 |
-60.575,00 |
-63.236,00 |
-262.875,00 |
|
|
3. Changes in current capital equity.:
61300 |
274.204,00 |
1.716.695,00 |
-1.741.966,00 |
-2.123.008,00 |
-1.820.839,00 |
|
|
a) Stock (+/-).:
61301 |
-32.887,00 |
-431.549,00 |
1.417.404,00 |
1.834.425,00 |
-4.749.329,00 |
|
|
d) Debtors and other
accounts receivable (+/-). : 61302 |
456.221,00 |
2.250.660,00 |
-2.746.535,00 |
-4.524.795,00 |
3.380.955,00 |
|
|
c) Other current
assets (+/-). : 61303 |
5.073,00 |
5.074,00 |
1.151.762,00 |
-1.165.714,00 |
0,00 |
|
|
d) Creditors and
other accounts payable (+/-). : 61304 |
-154.203,00 |
-107.490,00 |
-1.564.597,00 |
1.733.076,00 |
-452.465,00 |
|
|
4. Other cash flows for operating
activities.: 61400 |
-355.466,00 |
-315.748,00 |
-310.681,00 |
-303.380,00 |
-176.508,00 |
|
|
a) Interest payments
(-). : 61401 |
-397.520,00 |
-373.452,00 |
-336.568,00 |
-374.414,00 |
-363.048,00 |
|
|
c) Interest
collection (+). : 61403 |
74.128,00 |
76.162,00 |
26.156,00 |
7.798,00 |
59.697,00 |
|
|
d) Income tax payment
collection (payments) (+/-).: 61404 |
-32.074,00 |
-148,00 |
-269,00 |
0,00 |
205,00 |
|
|
e) Other payments
(payment collection) (-/+) : 61405 |
0,00 |
-18.310,00 |
0,00 |
63.236,00 |
126.638,00 |
|
|
5. Operating activity cash flows (1 + 2 +
3 + 4) : 61500 |
-163.501,00 |
1.551.068,00 |
-1.366.444,00 |
-1.813.314,00 |
-81.152,00 |
|
|
6. Payments for investment (-).:
62100 |
-3.474.914,00 |
-3.713.502,00 |
-3.971.721,00 |
-3.546.150,00 |
-2.548.966,00 |
|
|
a) Companies of the
group and affiliates. : 62101 |
-944.956,00 |
-1.068.258,00 |
-647.681,00 |
-2.642.630,00 |
-1.476.497,00 |
|
|
b) Intangible fixed
assets. : 62102 |
-2.466.177,00 |
-2.364.532,00 |
-2.697.149,00 |
-725.440,00 |
-664.732,00 |
|
|
c) Fixed assets. :
62103 |
-63.781,00 |
-280.712,00 |
-619.177,00 |
-150.156,00 |
-382.487,00 |
|
|
e) Other financial
assets. : 62105 |
0,00 |
0,00 |
0,00 |
-27.924,00 |
-25.250,00 |
|
|
h) Other assets. :
62108 |
0,00 |
0,00 |
-7.714,00 |
0,00 |
0,00 |
|
|
7. Divestment payment collection (+). :
62200 |
108.413,00 |
73.903,00 |
819.630,00 |
1.764.635,00 |
9.344,00 |
|
|
a) Companies of the
group and affiliates. : 62201 |
108.413,00 |
71.103,00 |
811.304,00 |
1.755.291,00 |
0,00 |
|
|
e) Other financial
assets. : 62205 |
0,00 |
2.800,00 |
8.326,00 |
9.344,00 |
9.344,00 |
|
|
8. Investment activity cash flows (6 + 7)
minus Amortization: 62300 |
-3.366.501,00 |
-3.639.599,00 |
-3.152.091,00 |
-1.781.515,00 |
-2.539.622,00 |
|
|
9. Payment collection and payments for
equity instruments. : 63100 |
53.145,00 |
77.813,00 |
44.750,00 |
0,00 |
5.393.399,00 |
|
|
a) Issuance of equity
instruments (+). : 63101 |
0,00 |
0,00 |
0,00 |
0,00 |
6.189.632,00 |
|
|
e) Grants, donations
and bequests received (+). : 63105 |
53.145,00 |
77.813,00 |
44.750,00 |
0,00 |
0,00 |
|
|
10. Payment collection and payments for
financial liabilities instruments.: 63200 |
3.827.256,00 |
1.950.895,00 |
4.571.316,00 |
3.603.211,00 |
-2.815.865,00 |
|
|
a) Issuance :
63201 |
7.892.342,00 |
2.500.000,00 |
6.613.750,00 |
3.620.862,00 |
-2.815.865,00 |
|
|
2. Debts incurred
with credit institutions (+). : 63203 |
2.954.802,00 |
0,00 |
0,00 |
3.301.029,00 |
-2.773.865,00 |
|
|
3. Debts incurred
with companies of the group and affiliates (+).: 63204 |
0,00 |
2.500.000,00 |
6.613.750,00 |
319.833,00 |
-42.000,00 |
|
|
4. Special characteristic
debts (+). : 63205 |
4.750.000,00 |
0,00 |
0,00 |
0,00 |
0,00 |
|
|
5. Other debts (+). :
63206 |
187.540,00 |
0,00 |
0,00 |
0,00 |
0,00 |
|
|
b) Repayment and
amortization of : 63207 |
-4.065.086,00 |
-549.105,00 |
-2.042.434,00 |
-17.651,00 |
0,00 |
|
|
2. Debts incurred
with credit institutions (-).: 63209 |
-3.976.297,00 |
-508.506,00 |
-2.042.434,00 |
0,00 |
0,00 |
|
|
5. Other debts (-). :
63212 |
-88.789,00 |
-40.599,00 |
0,00 |
-17.651,00 |
0,00 |
|
|
11. Payments from dividends and
remunerations from other assets instruments. : 63300 |
0,00 |
0,00 |
0,00 |
0,00 |
0,00 |
|
|
12. Cash flows for financing activities
(9+10+11).: 63400 |
3.880.401,00 |
2.028.708,00 |
4.616.066,00 |
3.603.211,00 |
2.577.534,00 |
|
|
D) EFFECT OF EXCHANGE RATE CHANGES:
64000 |
0,00 |
0,00 |
0,00 |
0,00 |
0,00 |
|
|
E) NET INCREASE/DECREASE OF CASH OR
EQUIVALENT ASSETS (+/-5+/-8+/12+/-D) : 65000 |
350.399,00 |
-59.823,00 |
97.531,00 |
8.382,00 |
-43.240,00 |
|
|
Cash or equivalent
assets as of beginning of the fiscal year.: 65100 |
65.748,00 |
125.571,00 |
28.040,00 |
19.658,00 |
62.898,00 |
|
|
Cash or equivalent assets
as of end of the fiscal year.: 65200 |
416.147,00 |
65.748,00 |
125.571,00 |
28.040,00 |
19.658,00 |
|
FINANCIAL DIAGNOSIS
>
Economic-Financial Comparative Analysis
Data used in the
following ratios and indicators is taken from the Annual Accounts submitted by
the company to the TRADE REGISTER.
> Comparison
within the Sector
|
Cash
Flow |
2012 |
2011 |
Variación 2012 - 2011 |
|
|||
|
|
Empresa |
Sector |
Empresa |
Sector |
Empresa |
Sector |
|
|
Cash Flow over Sales: |
0,03 % |
-1,73 % |
0,00 % |
0,00 % |
|
|
|
|
EBITDA over Sales: |
-0,41 % |
9,23 % |
0,16 % |
10,07 % |
-355,79 % |
-8,40 % |
|
|
Cash Flow Yield: |
0,01 % |
-0,83 % |
0,00 % |
0,00 % |
|
|
|
|
Profitability |
2012 |
2011 |
Variación 2012 - 2011 |
|
|||
|
|
Empresa |
Sector |
Empresa |
Sector |
Empresa |
Sector |
|
|
Operating economic profitability: |
-5,39 % |
5,22 % |
-3,87 % |
6,90 % |
-39,34 % |
-24,45 % |
|
|
Total economic profitability: |
-6,77 % |
2,49 % |
-6,16 % |
4,13 % |
-9,78 % |
-39,63 % |
|
|
Financial profitability: |
-21,12 % |
1,32 % |
-17,67 % |
5,86 % |
-19,53 % |
-77,51 % |
|
|
Margin: |
-13,43 % |
4,84 % |
-8,61 % |
6,36 % |
-55,92 % |
-23,83 % |
|
|
Mark-up: |
-21,19 % |
1,59 % |
-19,12 % |
4,72 % |
-10,84 % |
-66,29 % |
|
|
Solvency |
2012 |
2011 |
Variación 2012 - 2011 |
|
|||
|
|
Empresa |
Sector |
Empresa |
Sector |
Empresa |
Sector |
|
|
Liquidity: |
0,04 |
0,12 |
0,00 |
0,11 |
|
8,79 |
|
|
Acid Test: |
1,31 |
0,85 |
1,12 |
0,83 |
16,75 |
2,08 |
|
|
Working Capital / Investment: |
0,27 |
0,03 |
0,22 |
0,03 |
20,03 |
1,90 |
|
|
Solvency: |
1,96 |
1,17 |
1,61 |
1,17 |
21,81 |
0,68 |
|
|
Indebtedness |
2012 |
2011 |
Variación 2012 - 2011 |
|
|||
|
|
Empresa |
Sector |
Empresa |
Sector |
Empresa |
Sector |
|
|
Indebtedness level: |
1,73 |
1,63 |
1,35 |
1,67 |
28,48 |
-2,06 |
|
|
Borrowing Composition: |
1,29 |
1,02 |
0,58 |
1,05 |
121,84 |
-2,81 |
|
|
Repayment Ability: |
68,65 |
-0,74 |
-378,50 |
878,41 |
118,14 |
-100,08 |
|
|
Warranty: |
1,58 |
1,62 |
1,74 |
1,61 |
-9,44 |
0,80 |
|
|
Generated resources / Total creditors:
|
-0,02 |
0,07 |
0,00 |
0,07 |
|
-4,22 |
|
|
Efficiency |
2012 |
2011 |
Variación 2012 - 2011 |
|
|||
|
|
Empresa |
Sector |
Empresa |
Sector |
Empresa |
Sector |
|
|
Productivity: |
0,98 |
1,72 |
1,01 |
1,75 |
-2,27 |
-1,45 |
|
|
Turnover of Collection Rights : |
1,06 |
4,79 |
1,02 |
4,45 |
3,85 |
7,59 |
|
|
Turnover of Payment Entitlements: |
2,63 |
3,52 |
3,11 |
3,26 |
-15,26 |
7,98 |
|
|
Stock rotation: |
2,28 |
6,51 |
2,51 |
6,00 |
-9,16 |
8,42 |
|
|
Assets turnover: |
0,40 |
1,08 |
0,45 |
1,09 |
-10,63 |
-0,81 |
|
|
Borrowing Cost: |
1,60 |
2,95 |
2,33 |
2,92 |
-31,25 |
1,18 |
|
> Trend of indicators under the General
Accounting Plan of 2007 (2012, 2011, 2010, 2009, 2008)
|
Cash
Flow |
2012 |
2011 |
2010 |
2009 |
2008 |
|
|
Cash Flow over Sales: |
0,03 % |
0,00 % |
0,01 % |
0,04 % |
-0,20 % |
|
|
EBITDA over Sales: |
-0,41 % |
0,16 % |
4,46 % |
1,88 % |
8,14 % |
|
|
Cash Flow Yield: |
0,01 % |
0,00 % |
0,00 % |
0,03 % |
-0,17 % |
|
|
Profitability |
2012 |
2011 |
2010 |
2009 |
2008 |
|
|
Operating economic profitability: |
-5,39 % |
-3,87 % |
-0,19 % |
-2,70 % |
3,52 % |
|
|
Total economic profitability: |
-6,77 % |
-6,16 % |
1,38 % |
-3,40 % |
2,99 % |
|
|
Financial profitability: |
-21,12 % |
-17,67 % |
2,19 % |
-20,45 % |
5,05 % |
|
|
Margin: |
-13,43 % |
-8,61 % |
-0,29 % |
-3,19 % |
3,32 % |
|
|
Mark-up: |
-21,19 % |
-19,12 % |
0,53 % |
-6,44 % |
-1,62 % |
|
|
Solvency |
2012 |
2011 |
2010 |
2009 |
2008 |
|
|
Liquidity: |
0,04 |
0,00 |
0,01 |
0,00 |
0,00 |
|
|
Acid Test: |
1,31 |
1,12 |
0,94 |
1,01 |
0,86 |
|
|
Working Capital / Investment: |
0,27 |
0,22 |
0,17 |
0,27 |
0,34 |
|
|
Solvency: |
1,96 |
1,61 |
1,29 |
1,51 |
1,81 |
|
|
Indebtedness |
2012 |
2011 |
2010 |
2009 |
2008 |
|
|
Indebtedness level: |
1,73 |
1,35 |
3,77 |
3,42 |
2,09 |
|
|
Borrowing Composition: |
1,29 |
0,58 |
0,33 |
0,43 |
0,63 |
|
|
Repayment Ability: |
68,65 |
-378,50 |
263,40 |
37,18 |
10,23 |
|
|
Warranty: |
1,58 |
1,74 |
1,27 |
1,29 |
1,48 |
|
|
Generated resources / Total creditors:
|
-0,02 |
0,00 |
0,02 |
0,01 |
0,11 |
|
|
Efficiency |
2012 |
2011 |
2010 |
2009 |
2008 |
|
|
Productivity: |
0,98 |
1,01 |
1,25 |
1,11 |
1,41 |
|
|
Turnover of Collection Rights : |
1,06 |
1,02 |
1,13 |
1,51 |
2,64 |
|
|
Turnover of Payment Entitlements: |
2,63 |
3,11 |
2,50 |
2,06 |
6,16 |
|
|
Stock rotation: |
2,28 |
2,51 |
2,85 |
2,76 |
2,29 |
|
|
Assets turnover: |
0,40 |
0,45 |
0,65 |
0,85 |
1,06 |
|
|
Borrowing Cost: |
1,60 |
2,33 |
1,34 |
1,51 |
2,03 |
|
COMPARATIVE SECTORIAL BALANCE
Sector-based Comparison under the rules of the
New General Accounting Plan.
|
|
Variación - |
|
|
|
Empresa |
Sector |
|
|
Variación - |
|
|
|
Empresa |
Sector |
|
|
Variación - |
|
|
|
Empresa |
Sector |
News
|
El Correo Digital |
25/04/2014 |
|
El grupo alavés Zigor sale |
|
|
Companies related |
|
|
|
|
Public Tenders and Works Won
No Public Tenders assigned to the name of the company.
Detail of Subsidies appearing in Balances Memories
|
Entity |
ORGANISMO NO
ESPECIFICADO |
|
Status |
CONCEDIDA |
|
Amount Granted |
36.597,00 |
|
Notes |
El importe
reflejado corresponde al imputado a resultados en este ejercicio. |
|
Entity |
ORGANISMO NO
ESPECIFICADO |
|
Status |
CONCEDIDA |
|
Amount Granted |
81.240,00 |
|
Notes |
El importe es el
total al cierre |
|
Entity |
ORGANISMO NO
ESPECIFICADO |
|
Subsidy Concept |
Subvención de
explotación |
|
Status |
CONCEDIDA |
|
Project |
gastos de I+D |
|
Amount Granted |
30.310,00 |
|
Entity |
ORGANISMO NO
ESPECIFICADO |
|
Subsidy Concept |
Subvención de
explotación |
|
Status |
CONCEDIDA |
|
Amount Granted |
14.454,00 |
|
Entity |
ORGANISMO NO
ESPECIFICADO |
|
Subsidy Concept |
Subvención a la
explotación |
|
Status |
CONCEDIDA |
|
Amount Granted |
30.310,00 |
|
Entity |
ORGANISMO NO
ESPECIFICADO |
|
Subsidy Concept |
Subvención de
capital |
|
Status |
CONCEDIDA |
|
Amount Granted |
27.981,00 |
|
Notes |
El importe
reflejado corresponde al imputado a resultados. |
|
Entity |
ORGANISMO NO
ESPECIFICADO |
|
Subsidy Concept |
Subvención a la
explotación |
|
Status |
CONCEDIDA |
|
Amount Granted |
14.454,00 |
|
Entity |
ORGANISMO NO
ESPECIFICADO |
|
Status |
CONCEDIDA |
|
Amount Granted |
254.748,00 |
Research Summary
Company founded a few years not, with enough experience in the sector of its activity, so after consulting several references, we consider the company has a good reputation. The group Zigor launch currently important development projetcs centered in strategical áreas such as renewable energies, rural electrification, intelligent networks, quality network and electrical energy storage. Therefore, in their drive to continue with I+D+I (investigation+development+innovation), ZIGOR continues to participate in consortiums for de development of partnership projects with other companies, besides investigation centers or public investigations organisms.
FOREIGN EXCHANGE RATES
|
Currency |
Unit
|
Indian Rupees |
|
US Dollar |
1 |
Rs.62.15 |
|
|
1 |
Rs.94.72 |
|
Euro |
1 |
Rs.70.33 |
INFORMATION DETAILS
|
Analysis Done by
: |
DIV |
|
|
|
|
Report Prepared
by : |
ANK |
RATING EXPLANATIONS
|
RATING |
STATUS |
PROPOSED CREDIT LINE |
|
|
>86 |
Aaa |
Possesses an extremely sound financial base with the strongest capability
for timely payment of interest and principal sums |
Unlimited |
|
71-85 |
Aa |
Possesses adequate working capital. No caution needed for credit
transaction. It has above average (strong) capability for payment of interest
and principal sums |
Large |
|
56-70 |
A |
Financial & operational base are regarded healthy. General
unfavourable factors will not cause fatal effect. Satisfactory capability for
payment of interest and principal sums |
Fairly Large |
|
41-55 |
Ba |
Overall operation is considered normal. Capable to meet normal
commitments. |
Satisfactory |
|
26-40 |
B |
Capability to overcome financial difficulties seems comparatively
below average. |
Small |
|
11-25 |
Ca |
Adverse factors are apparent. Repayment of interest and principal sums
in default or expected to be in default upon maturity |
Limited with
full security |
|
<10 |
C |
Absolute credit risk exists. Caution needed to be exercised |
Credit not
recommended |
|
-- |
NB |
New Business |
-- |
This score serves as a reference to assess SC’s credit risk
and to set the amount of credit to be extended. It is calculated from a
composite of weighted scores obtained from each of the major sections of this
report. The assessed factors and their relative weights (as indicated through
%) are as follows:
Financial
condition (40%) Ownership
background (20%) Payment record
(10%)
Credit history
(10%) Market trend
(10%) Operational
size (10%)
This report is issued at your request without any
risk and responsibility on the part of MIRA INFORM PRIVATE LIMITED (MIPL)
or its officials.