MIRA INFORM REPORT
|
Report No. : |
308190 |
|
Report Date : |
18.02.2015 |
IDENTIFICATION DETAILS
|
Name : |
STE PHARMA SYSTEMS SL |
|
|
|
|
Registered Office : |
C/ Universitat Autonoma., 13 ; P. Tecnologico Del Valles Cerdanyola Del Valles Barcelona 08290 |
|
|
|
|
Country : |
Spain |
|
|
|
|
Financials (as on) : |
31.12.2013 |
|
|
|
|
Date of Incorporation : |
03.11.1997 |
|
|
|
|
Legal Form : |
Private Company |
|
|
|
|
Line of Business : |
Engaged in the sale and purchase of all types of automatics mahchines for the pharmaceutical, cosmetic and food industry. Construction, technical assistance, repair and maintenantce of these machines. |
|
|
|
|
No. of Employee : |
Not Available |
RATING & COMMENTS
|
MIRA’s Rating : |
Ba |
|
RATING |
STATUS |
PROPOSED CREDIT LINE |
|
|
41-55 |
Ba |
Overall operation is considered normal. Capable to meet normal
commitments. |
Satisfactory |
|
Maximum Credit Limit : |
1.230.000 |
|
|
|
|
Status : |
Satisfactory |
|
|
|
|
Payment Behaviour : |
No complaints |
|
|
|
|
Litigation : |
Clear |
NOTES :
Any query related to this report can be made
on e-mail : infodept@mirainform.com
while quoting report number, name and date.
ECGC Country Risk Classification List – December 31, 2014
|
Country Name |
Previous Rating (30.09.2014) |
Current Rating (31.12.2014) |
|
Spain |
A2 |
A1 |
|
Risk Category |
ECGC
Classification |
|
Insignificant |
A1 |
|
Low |
A2 |
|
Moderate |
B1 |
|
High |
B2 |
|
Very High |
C1 |
|
Restricted |
C2 |
|
Off-credit |
D |
SPAIN ECONOMIC OVERVIEW
Spain experienced a prolonged recession in the wake of the global financial crisis. GDP contracted by 3.7% in 2009, ending a 16-year growth trend, and continued contracting through most of 2013. Economic growth resumed in late 2013, albeit only modestly, as credit contraction in the private sector, fiscal austerity, and high unemployment continued to weigh on domestic consumption and investment. Exports, however, have been resilient throughout the economic downturn, partially offsetting declines in domestic consumption and helped to bring Spain's current account into surplus in 2013 for the first time since 1986. The unemployment rate rose from a low of about 8% in 2007 to more than 26% in 2013, straining Spain's public finances as spending on social benefits increased while tax revenues fell. Spain’s budget deficit peaked at 11.4% of GDP in 2009. Spain gradually reduced the deficit to just under 7% of GDP in 2013, slightly above the 6.5% target negotiated between Spain and the EU. Public debt has increased substantially – from 60.1% of GDP in 2010 to 93.4% in 2013. Rising labor productivity, moderating labor costs, and lower inflation have helped to improve foreign investor interest in the economy and to reduce government borrowing costs. The government's ongoing efforts to implement reforms - labor, pension, health, tax, and education - are aimed at supporting investor sentiment. The government also has shored up struggling banks exposed to Spain's depressed domestic construction and real estate sectors by successfully completing an EU-funded restructuring and recapitalization program in December 2013.
|
Source
: CIA |
EXECUTIVE
SUMMARY
|
Name: |
STE PHARMA SYSTEMS SL |
|
NIF / Fiscal code: |
B61503363 |
|
Status: |
ACTIVE |
|
Incorporation Date: |
03/11/1997 |
|
Register
Data |
Register Section 8 Sheet 170342 |
|
Last
Publication in BORME: |
29/01/2015 [Appointments] |
|
Last Published Account Deposit: |
2013 |
|
Share Capital: |
3.405.600 |
|
|
|
|
Localization: |
C/ UNIVERSITAT AUTONOMA., 13 ; P.
TECNOLOGICO DEL VALLES - CERDANYOLA DEL VALLES - 08290 - BARCELONA |
|
Telephone - Fax - Email - Website: |
Ph.:. 935 912 502�� Email. servitem@servitem.com�� Website. www.stegroup.com |
|
|
|
|
Activity: |
|
|
NACE: |
4669 - Wholesale of other machinery and
equipment |
|
Registered Trademarks: |
|
|
Audited / Opinion: |
Si / |
|
Tenders and Awards: |
11 for a total cost of NaN |
|
Subsidies: |
6 for a total cost of 43711.83 |
|
Quality Certificate: |
No |
|
Maximum recommended commercial credit: |
1.230.000 |
|
Defaults,
Legal Claims and Insolvency Proceedings : |
|
|
|
|
|
|
|
Number |
Amount (€) |
Most Recent Entry |
|
Insolvency Proceedings, Bankruptcy and
Suspension of Payments |
|
Unpublished |
--- |
--- |
|
Defaults on debt with Financial
Institutions and Large Companies |
|
None |
--- |
--- |
|
Judicial Claims (Notices, Executive
Proceedings, Attachments, Auctions, Bad Debt) |
|
None |
0 |
--- |
|
Proceedings heard by the Civil Court |
|
Unpublished |
0 |
--- |
|
Proceedings heard by the Labour Court |
|
Unpublished |
0 |
--- |
|
|
|
Partners: |
|
|
|
JUAN JANE MATEU |
60 % |
|
|
MARCHESINI GROUP SPA |
20 % |
|
|
MAURIZIO MARCHESINI |
20 % |
|
|
MAURICIO MARCHESINI |
20 % |
|
|
Shares: |
5 |
|
|
Other Links: |
8 |
|
|
No. of Active Corporate Bodies: |
SINGLE ADMINISTRATOR 1 |
|
|
Ratios |
2013 |
2012 |
Change |
|
|
|
|
|
Guarantees: |
|
|
Properties Registered: |
Company NO, Administrator NO |
|
Financing / Guarantee Sources : |
Sources YES, Guarantees YES |
|
|
|
|
|
|
|
INVESTIGATION SUMMARY |
|
|
Founded in 1.998, the company is engaged
in sale and purchase of all type of automatic machines for the
pharmaceutical, cosmetic and food industry. The net turnover of the company
in the year 2013 has decreased by 14.95 ° A) to the figure of 2012 (24,451,551.74
Euros in 2013 versus 28,750,161.01 euros in 2012). Despite this decrease in
sales profit amounted to 294,921.58 after taxes and sales. The profitability
has remained at an acceptable level. Working capital at year-end has also
significantly improved in terms of absolute respect for the past five years. |
|
Enquiry
Details
|
|
|
|
Social Denomination: |
STE PHARMA SYSTEMS SL |
|
NIF / Fiscal code: |
B61503363 |
|
Corporate Status: |
ACTIVE |
|
Start of activity: |
1998 |
|
Registered Office: |
C/ UNIVERSITAT AUTONOMA., 13 ; P. TECNOLOGICO DEL VALLES |
|
Locality: |
CERDANYOLA DEL VALLES |
|
Province: |
BARCELONA |
|
Postal Code: |
08290 |
|
Telephone: |
935 912 502 |
|
Fax: |
936 753 954 |
|
Website: |
|
|
Email: |
|
BRANCH OFFICES
--
Activity
|
NACE: |
4669 |
|
Additional Information: |
Engaged in the sale and purchase of all types of automatics mahchines for the pharmaceutical, cosmetic and food industry. Construction, technical assistance, repair and maintenantce of these machines. Part of STE GROUP. |
|
Import / export: |
EXPORTS |
|
Future Perspective: |
Consolidation |
|
Industry situation: |
Maturity |
Chronological Summary
|
Year |
Act |
|
1997 |
Appointments/ Re-elections (1)
Company Formation (1) |
|
1999 |
Accounts deposit (ejer. 1997, 1998) |
|
2000 |
Accounts deposit (ejer. 1999)
Appointments/ Re-elections (3) Cessations/ Resignations/ Reversals (1) Change
of Social Denomination (1) Change of Social Purpose (1) Change of Social address
(1) Increase of Capital (1) Other Concepts/ Events (1) |
|
2001 |
Accounts deposit (ejer. 2000)
Appointments/ Re-elections (1) Change of Social address (1) Increase of
Capital (1) |
|
2002 |
Accounts deposit (ejer. 2001)
Appointments/ Re-elections (1) |
|
2003 |
Accounts deposit (ejer. 2002)
Appointments/ Re-elections (1) Cessations/ Resignations/ Reversals (1) |
|
2004 |
Appointments/ Re-elections (2)
Cessations/ Resignations/ Reversals (1) |
|
2005 |
Accounts deposit (ejer. 2004 consolidated,
2003, 2004) |
|
2006 |
Accounts deposit (ejer. 2003
consolidated, 2005) Cessations/ Resignations/ Reversals (1) |
|
2007 |
Accounts deposit (ejer. 2005
consolidated, 2006) Change of Social Denomination (1) Change of Social
Purpose (1) Increase of Capital (1) |
|
2008 |
Accounts deposit (ejer. 2006
consolidated, 2007 consolidated, 2007) |
|
2009 |
Accounts deposit (ejer. 2008)
Appointments/ Re-elections (1) Cessations/ Resignations/ Reversals (1) Errata
(1) Take-over Merger (1) |
|
2010 |
Accounts deposit (ejer. 2008
consolidated, 2009 consolidated, 2009) |
|
2011 |
Accounts deposit (ejer. 2010) |
|
2012 |
Accounts deposit (ejer. 2010
consolidated, 2011 consolidated) Appointments/ Re-elections (2) |
|
2013 |
Accounts deposit (ejer. 2012 consolidated,
2011, 2012) |
|
2014 |
Accounts deposit (ejer. 2013
consolidated, 2013) Appointments/ Re-elections (1) Cessations/ Resignations/
Reversals (1) Statutory Modifications (1) |
|
2015 |
Appointments/ Re-elections (1) |
Main
Historic Changes
|
Concept |
Publication |
Act |
Date |
|
Corporate Purpose Changes: |
LA COMPRAVENTA EN ESPAÑA O EN
EL EXTERIOR DE TODA CLASE DE MAQUINAS AUTOMATICAS O SEMIAUTOMATICAS PARA LA INDUSTRIA
FARMACEUTICA, COSMETICA Y ALIMENTARIA EN GRAL.LA ASISTENCIA TECN.,
REPARACION, MANUTEN, Y REVISION DE LAS MISMAS |
Corporate Purpose Change |
16/02/2000 |
|
|
DISEÑO, CONSTRUCCION Y COMERCIALIZACION
DE MOLDES, MATRICES Y AUTOMATISMOS INDUSTRIALES. |
Company Formation |
26/01/1998 |
|
|
|
|
Registered Capital: |
3.405.600 |
|
Paid up capital: |
3.405.600 |
|
|
|||||
|
|
|
|
|
|
|
|
|
|||||
|
|
|
|
|
|
|
|
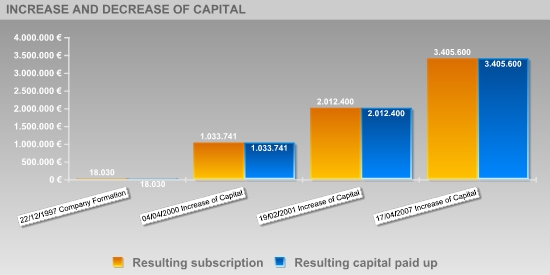
Publishing Date |
Registration Type |
Capital Subscribed |
Paid up capital |
Underwritten result |
Disbursed Result |
|
22/12/1997 |
Company Formation |
18.030 |
18.030 |
18.030 |
18.030 |
|
04/04/2000 |
Increase of Capital |
1.015.710 |
1.015.710 |
1.033.741 |
1.033.741 |
|
19/02/2001 |
Increase of Capital |
978.680 |
978.680 |
2.012.400 |
2.012.400 |
|
17/04/2007 |
Increase of Capital |
1.393.200 |
1.393.200 |
3.405.600 |
3.405.600 |
Active
Social Bodies
|
Post published |
Social Body's Name |
Appointment Date |
Other Positions in this
Company |
|
SINGLE ADMINISTRATOR |
JANE MATEU JOAN |
02/10/2014 |
1 |
|
PROXY |
MATEO BARRANCO DAVID |
23/08/2012 |
1 |
|
|
JANE AUBAREDA BARBARA |
18/09/2002 |
1 |
|
|
TODOLI DE MORA JOSE MANUEL |
15/03/2000 |
1 |
|
ACCOUNTS' AUDITOR / HOLDER |
BARCELONA AUDITORS SLP |
22/01/2015 |
4 |
|
CONSOLIDATED ACCOUNTS' AUDITOR |
BARCELONA AUDITORS SLP |
22/01/2015 |
4 |
Historical
Social Bodies
|
Social Body's Name |
Post published |
End Date |
Other Positions in this
Company |
|
BARCELONA AUDITORS SL |
ACCOUNTS' AUDITOR / HOLDER |
05/01/2004 |
3 |
|
|
DEPUTY ACCOUNTS' AUDITOR |
03/01/2003 |
|
|
|
CONSOLIDATED ACCOUNTS' AUDITOR |
06/02/2012 |
|
|
BARCELONA AUDITORS SLP |
ACCOUNTS' AUDITOR / HOLDER |
22/01/2015 |
4 |
|
|
CONSOLIDATED ACCOUNTS' AUDITOR |
22/01/2015 |
|
|
JANE MATEU JUAN |
SINGLE ADMINISTRATOR |
16/11/2009 |
3 |
|
|
SINGLE ADMINISTRATOR |
02/10/2014 |
|
|
|
ADMINISTRATOR |
25/10/2004 |
|
|
MARIA JOVE JOSE |
ACCOUNTS' AUDITOR / HOLDER |
03/01/2003 |
1 |
|
TORRENT LACASA FRANCISCO
JAVIER |
ADMINISTRATOR |
26/01/2000 |
1 |
|
VILADOMAT BALLARA JOSEP |
PROXY |
01/04/2006 |
1 |
Executive
board
|
Post |
NIF |
Name |
|
ADMINISTRATOR |
|
JOAN JANE MATEU |
Defaults, Legal Claims and Insolvency
Proceedings
Section enabling assessment of
the degree of compliance of the company queried with its payment obligations. It
provides information on the existence and nature of all stages of Insolvency
and Legal Proceedings published with reference to the Company in the country's
various Official Bulletins and national newspapers, as well Defaults Registered
in the main national credit bureaus (ASNEF Industrial and RAI ).
> Summary
Chronological summary
|
|
|
Number of Publications |
Amount (_) |
Start date |
End date |
|
Insolvency Proceedings, Bankruptcy and
Suspension of Payments |
|
Unpublished |
--- |
--- |
--- |
|
Request/Declaration |
|
0 |
--- |
date |
|
|
Proceedings |
|
--- |
--- |
|
--- |
|
Resolution |
|
--- |
--- |
|
--- |
|
Defaults on debt with Financial
Institutions and Large Companies |
Bank and Commercial Delinquency |
None |
0 |
|
|
|
Status: Friendly |
|
--- |
|
|
|
|
Status: Pre-Litigation |
|
--- |
|
|
|
|
Status: Litigation |
|
--- |
|
|
|
|
Status: Non-performing |
|
--- |
|
|
|
|
Status: insolvency proceedings, bankruptcy
and suspension of payments |
|
--- |
|
|
|
|
Other status |
|
--- |
|
|
|
|
Legal and Administrative Proceedings |
|
Unpublished |
--- |
|
|
|
Notices of defaults and enforcement |
|
--- |
--- |
|
--- |
|
Seizures |
|
--- |
--- |
|
--- |
|
Auctions |
|
--- |
--- |
|
--- |
|
Declarations of insolvency and bad debt |
|
--- |
--- |
|
--- |
|
Proceedings heard by the Civil Court |
|
Unpublished |
--- |
|
|
|
Proceedings heard by the Labour Court |
|
Unpublished |
--- |
|
|
> Details
|
Positive Factors |
Adverse Factors |
|
No judicial claims have been detected in the Official Gazettes, regarding any Entity's outstanding debts with the Tax Bureau or Social Security administrations, as submitted by Courts of the various court jurisdictions. No irregular payment performance has been detected based on information obtained from credit bureaus. Adequate level of financial autonomy. The financial autonomy of the entity represents the 31.86 %. In principle, an increase in this ratio would indicate an improvement in the corporate's balace sheets. It has financial profitability.. STE PHARMA SYSTEMS SL obtains financial return as a consequence of an investment in its own resources which, a priori, might improve its financial and economic situation. Positive Working CapitalThe Company's Working Capital quality is significant, i.e. much of the Company financing comes from its equity. A structure is considered optimal if its liquidity level is slightly above its debt volume as a result of low idleness levels of its financial resources involved. |
The current debt represents a 66.06% of the financial structure. In principle, a decrease in this ratio would indicate an improvement in the short-term financial situation. The company denotes a special dependence short-term financing which, a priori, could cause problems of short-term solvency. STE PHARMA SYSTEMS SL presents a low turnover of the current assets , which could indicate an inefficient use of non-current assets due to the lacking of enough operating income capacity based on the dedicated assets available for sale. Limited capacity to generate cash and cash equivalents through operating income. In principle, a decrease in this ratio would indicate a worsening in the Company´s financial situation. Private consumption continues to have, in spite of some signs of improvement, very low rates , thus showing great weakness. |
Probability
of default
> Estimated Probability of Default for the next 12 months: 1.281 %
|
Sector in which comparison is carried out: 466 Wholesale of other machinery, equipment and supplies |
|
|
Relative Position:
|
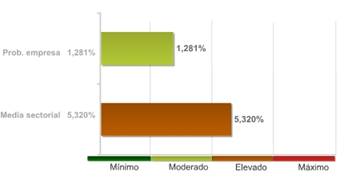
The company's comparative analysis with the rest of the companies that comprise the sector, shows the company holds a better position with regard to the probability of non-compliance.
The 88.00% of the companies of the sector STE PHARMA SYSTEMS SL belongs to show a higher probability of non-compliance.
The probability of the company's non-compliance with its payment obligations within deadlines estimated by our qualifications models is 1.281%.
In the event they fail to comply with the payment, the seriousness of the loss will depend on factors such as the promptness of the commencement of the charging management, the existence of executive documents which match the credit or the existence of guarantees and free debt assets under the name of the debtor. Therefore, the probability of non-compliance should not be solely interpreted as the total loss of the owed amount.
Recommended
commercial credit
Favourable until 1.230.000
€ (Guideline value of outstanding commercial balance that axesor
recommends be awarded to or maintained with the company queried)
LEGAL CLAIMS
|
Summary of Judicial Claims |
|
|
|
|
|
|
|
|
||
|
|
|
No se han publicado |
|
|
|
|
No se han publicado |
|
|
|
|
||
|
|
|
No se han publicado |
|
|
|
|
No se han publicado |
|
|
|
|
No se han publicado |
|
|
|
|
No se han publicado |
|
|
|
|
||
|
|
|
No se han publicado |
|
|
|
|
No se han publicado |
|
|
|
|
||
|
|
|
No se han publicado |
|
GUARANTEES
REFERENCES
Link
List
|
ABSORBS TO: |
1 Entities |
|
IS RELATED
WITH: |
7 Entities |
|
PARTICIPATES
IN: |
5 Entities |
|
SHAREHOLDERS: |
4 Entities |
> Shareholders
|
Relationship |
Entity |
Province |
Shareholding
stake |
|
SHAREHOLDERS |
JUAN JANE MATEU |
|
60 |
|
|
MARCHESINI GROUP
SPA |
|
20 |
|
|
MAURIZIO
MARCHESINI |
|
20 |
|
|
MAURICIO
MARCHESINI |
|
20 |
|
PARTICIPATES IN |
STE PACKAGING
ENGINEERING SL |
BARCELONA |
100 |
|
|
STE MAGHREB SARL
(ARGELIA) |
|
100 |
|
|
STE MAGHREB SARL
(TUNEZ) |
|
100 |
|
|
SERVITEM SARLAU
(MARRUECOS) |
|
100 |
|
|
SARL STE MAGHREB |
|
100 |
> Other
relationships
|
Relationship |
Entity |
Province |
Shareholding
stake |
|
IS RELATED WITH |
| | |
|
|
|
|
STE ENGIPHARM,
S.L. |
|
|
|
|
PHARMALINK SL |
BARCELONA |
|
|
|
STE TECPHARM SL |
BARCELONA |
|
|
|
STE MAGRHEB TUNEZ |
|
|
|
|
SERVITEM SARLAU |
|
|
|
|
PRASFARMA SL |
BARCELONA |
|
|
|
STE ENGIPHARM S.L |
BARCELONA |
|
|
ABSORBS TO |
STEPACKAGING
ENGINEERING SLU |
BARCELONA |
|
Turnover
|
Total Sales 2014 |
24.000.000 |
Financial Accounts
and Balance Sheets
Financial Years Presented
|
Ejercicio |
Tipo de Cuentas
Anuales |
Fecha
Presentacion |
|
2013 |
Consolidadas |
October
2014 |
|
2013 |
Normales |
October
2014 |
|
2012 |
Consolidadas |
August 2013 |
|
2012 |
Normales |
October
2013 |
|
2011 |
Consolidadas |
September
2012 |
|
2011 |
Normales |
October
2013 |
|
2010 |
Consolidadas |
September
2012 |
|
2010 |
Normales |
August 2011 |
|
2009 |
Consolidadas |
October
2010 |
|
2009 |
Normales |
October
2010 |
|
2008 |
Consolidadas |
October
2010 |
|
2008 |
Normales |
August 2009 |
|
2007 |
Consolidadas |
October
2008 |
|
2007 |
Normales |
September
2008 |
|
2006 |
Consolidadas |
February
2008 |
|
2006 |
Normales |
September
2007 |
|
2005 |
Consolidadas |
October
2006 |
|
2005 |
Normales |
September
2006 |
|
2004 |
Consolidadas |
October
2005 |
|
2004 |
Normales |
October
2005 |
|
2003 |
Consolidadas |
December
2005 |
|
2003 |
Normales |
October 2005 |
|
2002 |
Normales |
August 2003 |
|
2001 |
Normales |
October
2002 |
|
2000 |
Normales |
September
2001 |
|
1999 |
Normales |
August 2000 |
|
1998 |
Normales |
November
1999 |
|
1997 |
Normales |
November
1999 |
The data in the report
regarding the last Company Accounts submitted by the company is taken from the
TRADE REGISTER serving the region in which the company's address is located
31/12/2013
> Balance
en formato Normal de acuerdo al Nuevo Plan General Contable 2007
Information
corresponding to the fiscal year
2013 2012 2010 2009 2008 is taken from information
submitted to the TRADE REGISTER. Data corresponding to fiscal years before
2013 2012 2010 2009 2008 has been compiled based on
the equivalence criteria stipulated in Act JUS/206/2009.. To view details on
the methodology.
|
|
ORIGINAL |
ORIGINAL |
ORIGINAL |
ORIGINAL |
ORIGINAL |
|
|
Assets |
2013 |
2012 |
2010 |
2009 |
2008 |
|
|
A) NON-CURRENT ASSETS: 11000 |
6.082.411,00 |
7.151.096,00 |
9.998.451,00 |
10.393.101,00 |
9.952.124,00 |
|
|
I. Intangible fixed
assets : 11100 |
7.759,00 |
38.743,00 |
170.614,00 |
213.973,00 |
121.551,00 |
|
|
1. Development: 11110 |
0,00 |
0,00 |
0,00 |
110.432,00 |
0,00 |
|
|
2. Concessions: 11120 |
0,00 |
0,00 |
0,00 |
0,00 |
0,00 |
|
|
3. Patents, licencing, trade marks and similar: 11130 |
0,00 |
0,00 |
139,00 |
356,00 |
573,00 |
|
|
4. Goodwill: 11140 |
0,00 |
0,00 |
0,00 |
0,00 |
0,00 |
|
|
5. IT applications: 11150 |
1.263,00 |
6.263,00 |
86.027,00 |
103.185,00 |
120.977,00 |
|
|
6. Investigation: 11160 |
6.496,00 |
32.480,00 |
84.448,00 |
0,00 |
0,00 |
|
|
7.
Intellectual property: 11180 |
0,00 |
0,00 |
0,00 |
0,00 |
0,00 |
|
|
8. Greenhouse gas emission allowance: 11190 |
0,00 |
0,00 |
0,00 |
0,00 |
0,00 |
|
|
9. Other intangible fixed assets. : 11170 |
0,00 |
0,00 |
0,00 |
0,00 |
0,00 |
|
|
II. Tangible fixed
assets : 11200 |
4.751.422,00 |
5.901.264,00 |
6.018.785,00 |
6.150.450,00 |
6.005.936,00 |
|
|
1. Land and buildings: 11210 |
3.039.349,00 |
2.980.609,00 |
3.425.152,00 |
3.555.880,00 |
3.686.607,00 |
|
|
2. Technical installations and other tangible fixed assets: 11220 |
1.379.734,00 |
2.583.396,00 |
1.316.992,00 |
1.362.879,00 |
1.546.518,00 |
|
|
3.
Tangible asset in progress and advances: 11230 |
332.339,00 |
337.259,00 |
1.276.642,00 |
1.231.691,00 |
772.811,00 |
|
|
III. Real estate
investment: 11300 |
0,00 |
0,00 |
0,00 |
0,00 |
0,00 |
|
|
1. Land: 11310 |
0,00 |
0,00 |
0,00 |
0,00 |
0,00 |
|
|
2. Buildings: 11320 |
0,00 |
0,00 |
0,00 |
0,00 |
0,00 |
|
|
IV. Long-term
investments in Group companies and associates : 11400 |
1.115.166,00 |
1.075.454,00 |
4.403.404,00 |
3.712.461,00 |
3.325.322,00 |
|
|
1. Equity instruments: 11410 |
990.644,00 |
1.050.432,00 |
3.837.548,00 |
3.068.032,00 |
2.397.854,00 |
|
|
2. Credits to businesses: 11420 |
124.522,00 |
25.022,00 |
565.856,00 |
644.430,00 |
927.468,00 |
|
|
3. Debt securities: 11430 |
0,00 |
0,00 |
0,00 |
0,00 |
0,00 |
|
|
4. Derivatives : 11440 |
0,00 |
0,00 |
0,00 |
0,00 |
0,00 |
|
|
5. Other financial assets : 11450 |
0,00 |
0,00 |
0,00 |
0,00 |
0,00 |
|
|
6. Other investments: 11460 |
0,00 |
0,00 |
0,00 |
0,00 |
0,00 |
|
|
V. Long-term
financial investments: 11500 |
12.210,00 |
5.071,00 |
-724.917,00 |
176.779,00 |
346.779,00 |
|
|
1.
Equity instruments: 11510 |
0,00 |
0,00 |
6.007,00 |
6.007,00 |
6.007,00 |
|
|
2. Credits to third parties : 11520 |
0,00 |
0,00 |
0,00 |
169.412,00 |
339.412,00 |
|
|
3. Debt securities: 11530 |
0,00 |
0,00 |
-732.284,00 |
0,00 |
0,00 |
|
|
4. Derivatives : 11540 |
0,00 |
0,00 |
0,00 |
0,00 |
0,00 |
|
|
5. Other financial assets : 11550 |
12.210,00 |
5.071,00 |
1.361,00 |
1.361,00 |
1.361,00 |
|
|
6.
Other investments: 11560 |
0,00 |
0,00 |
0,00 |
0,00 |
0,00 |
|
|
VI. Assets for
deferred tax : 11600 |
195.853,00 |
130.564,00 |
130.564,00 |
139.437,00 |
152.536,00 |
|
|
VII. Non-current
trade debts : 11700 |
0,00 |
0,00 |
0,00 |
0,00 |
0,00 |
|
|
B) CURRENT ASSETS: 12000 |
20.477.082,00 |
23.306.145,00 |
13.030.857,00 |
9.865.016,00 |
15.875.014,00 |
|
|
I. Non-current assets
held for sale : 12100 |
0,00 |
0,00 |
0,00 |
0,00 |
0,00 |
|
|
II. Stocks:
12200 |
3.126.144,00 |
6.264.184,00 |
2.865.485,00 |
2.852.040,00 |
4.750.915,00 |
|
|
1. Commercial: 12210 |
972.011,00 |
4.419.116,00 |
773.005,00 |
1.431.141,00 |
1.849.526,00 |
|
|
2.
Primary material and other supplies: 12220 |
408.731,00 |
482.472,00 |
341.626,00 |
330.522,00 |
329.107,00 |
|
|
3. Work in progress: 12230 |
0,00 |
0,00 |
89.117,00 |
89.117,00 |
89.117,00 |
|
|
a) Of long-term production cycle : 12231 |
0,00 |
0,00 |
0,00 |
0,00 |
0,00 |
|
|
b) Of short-term production cycle : 12232 |
0,00 |
0,00 |
89.117,00 |
89.117,00 |
89.117,00 |
|
|
4. Finished goods: 12240 |
0,00 |
0,00 |
0,00 |
0,00 |
75.333,00 |
|
|
a) Of long-term production cycle : 12241 |
0,00 |
0,00 |
0,00 |
0,00 |
0,00 |
|
|
b) Of short-term production cycle : 12242 |
0,00 |
0,00 |
0,00 |
0,00 |
75.333,00 |
|
|
5. By-products, residues and recycled materials: 12250 |
0,00 |
0,00 |
0,00 |
0,00 |
0,00 |
|
|
6. Advances to suppliers: 12260 |
1.745.402,00 |
1.362.595,00 |
1.661.737,00 |
1.001.260,00 |
2.407.832,00 |
|
|
III. Trade debtors
and others receivable accounts: 12300 |
12.823.757,00 |
13.397.982,00 |
9.294.317,00 |
5.569.669,00 |
9.434.018,00 |
|
|
1. Trade debtors / accounts receivable: 12310 |
12.475.648,00 |
12.604.286,00 |
7.768.792,00 |
5.383.110,00 |
9.348.608,00 |
|
|
a) Long-term receivables from sales and services
supplied : 12311 |
0,00 |
0,00 |
0,00 |
0,00 |
0,00 |
|
|
b) Customers for sales and provisions of services :
12312 |
12.475.648,00 |
12.604.286,00 |
7.768.792,00 |
5.383.110,00 |
9.348.608,00 |
|
|
2. Customers, Group companies and associates : 12320 |
254.638,00 |
735.182,00 |
1.457.043,00 |
139.323,00 |
80.962,00 |
|
|
3.
Other accounts receivable: 12330 |
0,00 |
0,00 |
0,00 |
0,00 |
0,00 |
|
|
4. Personnel: 12340 |
93.472,00 |
24.608,00 |
68.482,00 |
44.004,00 |
4.448,00 |
|
|
5. Assets for deferred tax: 12350 |
0,00 |
33.906,00 |
0,00 |
0,00 |
0,00 |
|
|
6. Other debtors, including tax and social security: 12360 |
0,00 |
0,00 |
0,00 |
3.232,00 |
0,00 |
|
|
7. Called up share capital: 12370 |
0,00 |
0,00 |
0,00 |
0,00 |
0,00 |
|
|
IV. Short-term
investments in Group companies and associates: 12400 |
6.157,00 |
174.554,00 |
171.514,00 |
159.071,00 |
372.925,00 |
|
|
1. Equity instruments: 12410 |
0,00 |
0,00 |
0,00 |
0,00 |
0,00 |
|
|
2.
Credits to businesses: 12420 |
6.157,00 |
174.554,00 |
171.514,00 |
159.071,00 |
372.925,00 |
|
|
3. Debt securities: 12430 |
0,00 |
0,00 |
0,00 |
0,00 |
0,00 |
|
|
4. Derivatives : 12440 |
0,00 |
0,00 |
0,00 |
0,00 |
0,00 |
|
|
5. Other financial assets : 12450 |
0,00 |
0,00 |
0,00 |
0,00 |
0,00 |
|
|
6. Other investments: 12460 |
0,00 |
0,00 |
0,00 |
0,00 |
0,00 |
|
|
V. Short-term
financial investments : 12500 |
4.173.864,00 |
2.905.369,00 |
120.970,00 |
457.230,00 |
279.591,00 |
|
|
1. Equity instruments: 12510 |
0,00 |
0,00 |
0,00 |
0,00 |
0,00 |
|
|
2. Credits to businesses: 12520 |
3.571.144,00 |
2.763.512,00 |
0,00 |
340.000,00 |
170.000,00 |
|
|
3. Debt securities: 12530 |
0,00 |
0,00 |
0,00 |
0,00 |
0,00 |
|
|
4. Derivatives : 12540 |
0,00 |
0,00 |
0,00 |
0,00 |
0,00 |
|
|
5. Other financial assets : 12550 |
602.720,00 |
141.857,00 |
120.970,00 |
117.230,00 |
109.591,00 |
|
|
6. Other investments: 12560 |
0,00 |
0,00 |
0,00 |
0,00 |
0,00 |
|
|
VI. Short-term
accruals: 12600 |
3.547,00 |
180.405,00 |
100.143,00 |
469.304,00 |
161.724,00 |
|
|
VII. Cash and other
equivalent liquid assets : 12700 |
343.612,00 |
383.652,00 |
478.428,00 |
357.701,00 |
875.841,00 |
|
|
1. Treasury: 12710 |
343.612,00 |
383.652,00 |
478.428,00 |
357.701,00 |
875.841,00 |
|
|
2. Other equivalent liquid assets: 12720 |
0,00 |
0,00 |
0,00 |
0,00 |
0,00 |
|
|
TOTAL ASSETS (A + B) : 10000 |
26.559.492,00 |
30.457.242,00 |
23.029.309,00 |
20.258.116,00 |
25.827.138,00 |
|
|
|
ORIGINAL |
ORIGINAL |
ORIGINAL |
ORIGINAL |
ORIGINAL |
|
|
Liabilities and Net Worth |
2013 |
2012 |
2010 |
2009 |
2008 |
|
|
A) NET WORTH: 20000 |
8.461.229,00 |
8.166.307,00 |
6.837.187,00 |
6.440.311,00 |
6.032.845,00 |
|
|
A-1) Shareholders'
equity: 21000 |
8.461.229,00 |
8.166.307,00 |
6.837.187,00 |
6.440.311,00 |
6.032.845,00 |
|
|
I. Capital:
21100 |
3.405.600,00 |
3.405.600,00 |
3.405.600,00 |
3.405.600,00 |
3.405.600,00 |
|
|
1.
Registered capital : 21110 |
3.405.600,00 |
3.405.600,00 |
3.405.600,00 |
3.405.600,00 |
3.405.600,00 |
|
|
2. (Uncalled capital): 21120 |
0,00 |
0,00 |
0,00 |
0,00 |
0,00 |
|
|
II. Share premium:
21200 |
0,00 |
0,00 |
0,00 |
0,00 |
0,00 |
|
|
III. Reserves:
21300 |
4.760.707,00 |
4.252.295,00 |
3.034.711,00 |
2.627.245,00 |
1.917.733,00 |
|
|
1. Legal y estatutarias: 21310 |
738.040,00 |
738.040,00 |
616.281,00 |
0,00 |
0,00 |
|
|
2. Other reserves: 21320 |
4.022.668,00 |
3.514.256,00 |
2.418.430,00 |
2.627.245,00 |
1.917.733,00 |
|
|
3. Revaluation reserves: 21330 |
0,00 |
0,00 |
0,00 |
0,00 |
0,00 |
|
|
IV. (Common stock
equity): 21400 |
0,00 |
0,00 |
0,00 |
0,00 |
0,00 |
|
|
V. Results from
previous periods: 21500 |
0,00 |
0,00 |
0,00 |
0,00 |
0,00 |
|
|
1. Brought forward: 21510 |
0,00 |
0,00 |
0,00 |
0,00 |
0,00 |
|
|
2.
(Negative results from previous periods): 21520 |
0,00 |
0,00 |
0,00 |
0,00 |
0,00 |
|
|
VI. Other
shareholders' contributions: 21600 |
0,00 |
0,00 |
0,00 |
0,00 |
0,00 |
|
|
VII. Result of the
period: 21700 |
294.922,00 |
508.412,00 |
396.876,00 |
407.466,00 |
709.512,00 |
|
|
VIII. (Interim
dividend): 21800 |
0,00 |
0,00 |
0,00 |
0,00 |
0,00 |
|
|
IX. Other net worth
instruments: 21900 |
0,00 |
0,00 |
0,00 |
0,00 |
0,00 |
|
|
A-2) Adjustments due
to changes in value: 22000 |
0,00 |
0,00 |
0,00 |
0,00 |
0,00 |
|
|
I. Financial assets
held for sale: 22100 |
0,00 |
0,00 |
0,00 |
0,00 |
0,00 |
|
|
II. Hedge operations:
22200 |
0,00 |
0,00 |
0,00 |
0,00 |
0,00 |
|
|
III. Linked
non-current assets and liabilities held for sale : 22300 |
0,00 |
0,00 |
0,00 |
0,00 |
0,00 |
|
|
IV. Exchange rate
difference: 22400 |
0,00 |
0,00 |
0,00 |
0,00 |
0,00 |
|
|
V. Other: 22500 |
0,00 |
0,00 |
0,00 |
0,00 |
0,00 |
|
|
A-3) Received
subsidies, donations and legacies: 23000 |
0,00 |
0,00 |
0,00 |
0,00 |
0,00 |
|
|
B) NON-CURRENT LIABILITIES: 31000 |
553.856,00 |
678.653,00 |
828.323,00 |
950.298,00 |
1.464.204,00 |
|
|
I. Long-term
provisions: 31100 |
0,00 |
0,00 |
0,00 |
0,00 |
71.393,00 |
|
|
1. Long-term employee benefits liability: 31110 |
0,00 |
0,00 |
0,00 |
0,00 |
0,00 |
|
|
2. Environmental actions: 31120 |
0,00 |
0,00 |
0,00 |
0,00 |
0,00 |
|
|
3. Restructuring provisions: 31130 |
0,00 |
0,00 |
0,00 |
0,00 |
0,00 |
|
|
4. Other provisions: 31140 |
0,00 |
0,00 |
0,00 |
0,00 |
71.393,00 |
|
|
II Long-term creditors:
31200 |
336.733,00 |
380.954,00 |
576.511,00 |
653.851,00 |
1.052.251,00 |
|
|
1. Liabilities and other securities: 31210 |
0,00 |
0,00 |
0,00 |
0,00 |
0,00 |
|
|
2.
Amounts owed to credit institutions: 31220 |
153.750,00 |
176.250,00 |
263.868,00 |
263.595,00 |
862.854,00 |
|
|
3. Creditors from financial leasing: 31230 |
0,00 |
0,00 |
64.499,00 |
129.612,00 |
189.397,00 |
|
|
4.
Derivatives : 31240 |
0,00 |
0,00 |
0,00 |
0,00 |
0,00 |
|
|
5. Other financial liabilities : 31250 |
182.983,00 |
204.704,00 |
248.144,00 |
260.644,00 |
0,00 |
|
|
III. Long-term debts with
Group companies and associates: 31300 |
0,00 |
0,00 |
0,00 |
0,00 |
0,00 |
|
|
IV. Liabilities for
deferred tax: 31400 |
217.123,00 |
297.699,00 |
251.812,00 |
296.447,00 |
340.559,00 |
|
|
V. Long-term
accruals: 31500 |
0,00 |
0,00 |
0,00 |
0,00 |
0,00 |
|
|
VI. Non-current trade
creditors : 31600 |
0,00 |
0,00 |
0,00 |
0,00 |
0,00 |
|
|
VII. Special
long-term debts : 31700 |
0,00 |
0,00 |
0,00 |
0,00 |
0,00 |
|
|
C) CURRENT LIABILITIES : 32000 |
17.544.408,00 |
21.612.281,00 |
15.363.799,00 |
12.867.507,00 |
18.330.089,00 |
|
|
I. Liabilities linked
to non-current assets held for sale: 32100 |
0,00 |
0,00 |
0,00 |
0,00 |
0,00 |
|
|
II. Short-term
provisions: 32200 |
0,00 |
0,00 |
0,00 |
0,00 |
0,00 |
|
|
1. Provisions from greenhouse gas emission allowance: 32210 |
0,00 |
0,00 |
0,00 |
0,00 |
0,00 |
|
|
2. Other provisions: 32220 |
0,00 |
0,00 |
0,00 |
0,00 |
0,00 |
|
|
III. Short-term
creditors : 32300 |
6.402.468,00 |
6.957.308,00 |
6.386.697,00 |
4.226.732,00 |
5.929.109,00 |
|
|
1. Liabilities and other securities: 32310 |
0,00 |
0,00 |
0,00 |
0,00 |
0,00 |
|
|
2. Amounts owed to credit institutions: 32320 |
6.380.748,00 |
6.915.342,00 |
6.309.122,00 |
4.148.571,00 |
5.856.606,00 |
|
|
3. Creditors from financial leasing: 32330 |
0,00 |
20.246,00 |
65.074,00 |
78.161,00 |
71.427,00 |
|
|
4. Derivatives : 32340 |
0,00 |
0,00 |
0,00 |
0,00 |
0,00 |
|
|
5. Other financial liabilities : 32350 |
21.720,00 |
21.720,00 |
12.500,00 |
0,00 |
1.076,00 |
|
|
IV. Short-term debts with
Group companies and associates: 32400 |
69.653,00 |
0,00 |
0,00 |
0,00 |
0,00 |
|
|
V. Trade creditors
and other accounts payable: 32500 |
11.072.286,00 |
14.654.974,00 |
8.977.102,00 |
8.640.775,00 |
12.400.980,00 |
|
|
1. Suppliers: 32510 |
7.080.874,00 |
9.839.519,00 |
5.953.490,00 |
6.292.238,00 |
7.590.459,00 |
|
|
a) Long-term debts : 32511 |
0,00 |
0,00 |
0,00 |
0,00 |
0,00 |
|
|
b) Short-term debts : 32512 |
7.080.874,00 |
9.839.519,00 |
5.953.490,00 |
6.292.238,00 |
7.590.459,00 |
|
|
2. Suppliers, Group companies and associates: 32520 |
10.414,00 |
39.180,00 |
151.150,00 |
24.518,00 |
124.645,00 |
|
|
3.
Other creditors: 32530 |
281.969,00 |
460.143,00 |
518.591,00 |
214.602,00 |
140.072,00 |
|
|
4. Personnel (remuneration due): 32540 |
179.262,00 |
157.674,00 |
181.868,00 |
181.639,00 |
198.069,00 |
|
|
5.
Liabilities for current tax: 32550 |
216.609,00 |
0,00 |
0,00 |
100.172,00 |
85.291,00 |
|
|
6. Other accounts payable to Public Administrations.: 32560 |
811.758,00 |
1.335.854,00 |
613.549,00 |
479.600,00 |
646.424,00 |
|
|
7. Advances from clients: 32570 |
2.491.400,00 |
2.822.603,00 |
1.558.453,00 |
1.348.006,00 |
3.616.020,00 |
|
|
VI. Short-term
accruals: 32600 |
0,00 |
0,00 |
0,00 |
0,00 |
0,00 |
|
|
VII. Special short-term
debts : 32700 |
0,00 |
0,00 |
0,00 |
0,00 |
0,00 |
|
|
TOTAL NET WORTH AND LIABILITIES (A + B +
C) : 30000 |
26.559.492,00 |
30.457.242,00 |
23.029.309,00 |
20.258.116,00 |
25.827.138,00 |
|
|
|
ORIGINAL |
ORIGINAL |
ORIGINAL |
ORIGINAL |
ORIGINAL |
|
|
Profit and Loss |
2013 |
2012 |
2010 |
2009 |
2008 |
|
|
1. Net turnover: 40100 |
24.451.552,00 |
28.750.161,00 |
17.294.038,00 |
21.972.573,00 |
25.188.206,00 |
|
|
a) Sales: 40110 |
23.487.814,00 |
27.660.754,00 |
14.720.503,00 |
18.236.524,00 |
23.762.570,00 |
|
|
b) Rendering of
services: 40120 |
963.738,00 |
1.089.407,00 |
2.573.534,00 |
3.736.049,00 |
1.425.636,00 |
|
|
c) Income of financial
nature of holding companies: 40130 |
0,00 |
0,00 |
0,00 |
0,00 |
0,00 |
|
|
2. Changes in stocks of finished goods and
work in progress: 40200 |
0,00 |
0,00 |
0,00 |
-75.109,00 |
-137.217,00 |
|
|
3. Works carried out by the company for
its assets: 40300 |
0,00 |
0,00 |
0,00 |
0,00 |
0,00 |
|
|
4. Supplies : 40400 |
-17.521.138,00 |
-20.927.874,00 |
-11.108.102,00 |
-15.481.790,00 |
-17.966.793,00 |
|
|
a) Stock consumption:
40410 |
-11.655.849,00 |
-14.698.417,00 |
-6.953.109,00 |
-9.876.475,00 |
-13.577.547,00 |
|
|
b) Consumption of raw
materials and miscellaneous consumable ones: 40420 |
-3.506.966,00 |
-3.784.299,00 |
-4.049.644,00 |
-3.564.487,00 |
-2.500.673,00 |
|
|
c) Works carried out
by other companies: 40430 |
-2.358.323,00 |
-2.445.159,00 |
-105.349,00 |
-2.040.828,00 |
-1.888.573,00 |
|
|
d) Impairment of
stock, primary material and other supplies: 40440 |
0,00 |
0,00 |
0,00 |
0,00 |
0,00 |
|
|
5. Other operating income: 40500 |
586.632,00 |
642.868,00 |
603.115,00 |
696.174,00 |
730.740,00 |
|
|
a) Auxiliary income
and other from current management: 40510 |
581.558,00 |
637.820,00 |
593.427,00 |
679.664,00 |
722.498,00 |
|
|
b) Operation
subsidies included in the Period's result: 40520 |
5.073,00 |
5.048,00 |
9.688,00 |
16.510,00 |
8.242,00 |
|
|
6. Personnel costs: 40600 |
-3.383.054,00 |
-3.466.923,00 |
-3.110.182,00 |
-3.406.374,00 |
-3.528.496,00 |
|
|
a) Wages, salaries et
al.: 40610 |
-2.699.253,00 |
-2.754.598,00 |
-2.484.396,00 |
-2.740.415,00 |
-2.811.122,00 |
|
|
b) Social security
costs: 40620 |
-683.801,00 |
-712.325,00 |
-625.786,00 |
-665.959,00 |
-717.374,00 |
|
|
c) Provisions :
40630 |
0,00 |
0,00 |
0,00 |
0,00 |
0,00 |
|
|
7. Other operating costs: 40700 |
-2.765.509,00 |
-3.419.456,00 |
-2.554.613,00 |
-2.588.289,00 |
-3.127.089,00 |
|
|
a) External services:
40710 |
-2.679.046,00 |
-3.045.705,00 |
-2.490.642,00 |
-2.508.788,00 |
-3.006.370,00 |
|
|
b) Taxes: 40720 |
-43.008,00 |
-43.856,00 |
-32.189,00 |
-38.837,00 |
-81.818,00 |
|
|
c) Losses, impairments
and variation in provisions from trade operations : 40730 |
-43.455,00 |
-329.895,00 |
-31.782,00 |
-40.664,00 |
-35.331,00 |
|
|
d) Other current
management expenditure : 40740 |
0,00 |
0,00 |
0,00 |
0,00 |
-3.570,00 |
|
|
e) Expenses due to
greenhouse gas emissions: 40750 |
0,00 |
0,00 |
0,00 |
0,00 |
0,00 |
|
|
8. Amortisation of fixed assets:
40800 |
-479.499,00 |
-502.483,00 |
-426.471,00 |
-461.109,00 |
-487.107,00 |
|
|
9. Allocation of subsidies of
non-financial fixed assets and other: 40900 |
0,00 |
0,00 |
0,00 |
0,00 |
0,00 |
|
|
10. Excess provisions : 41000 |
0,00 |
0,00 |
0,00 |
0,00 |
0,00 |
|
|
11. Impairment and result of transfers of
fixed assets: 41100 |
5,00 |
0,00 |
0,00 |
0,00 |
0,00 |
|
|
a) Impairment and
losses : 41110 |
0,00 |
0,00 |
0,00 |
0,00 |
0,00 |
|
|
b) Results for
transfers and other : 41120 |
5,00 |
0,00 |
0,00 |
0,00 |
0,00 |
|
|
c) Impairment and profit
due to disposals of assets of holding companies: 41130 |
0,00 |
0,00 |
0,00 |
0,00 |
0,00 |
|
|
12. Negative difference in combined
businesses: 41200 |
0,00 |
0,00 |
0,00 |
0,00 |
0,00 |
|
|
13. Other results : 41300 |
-33.723,00 |
-25.574,00 |
-99.005,00 |
10.965,00 |
-46.031,00 |
|
|
A.1) OPERATING INCOME (1 + 2 + 3 + 4 + 5 +
6 + 7 + 8 + 9 + 10 + 11 + 12 + 13) : 49100 |
855.265,00 |
1.050.717,00 |
598.780,00 |
667.042,00 |
626.213,00 |
|
|
14. Financial income : 41400 |
7.695,00 |
4.189,00 |
8.228,00 |
19.090,00 |
64.906,00 |
|
|
a) Of shares in
equity instruments : 41410 |
0,00 |
0,00 |
0,00 |
0,00 |
0,00 |
|
|
a 1) In Group companies and associates: 41411 |
0,00 |
0,00 |
0,00 |
0,00 |
0,00 |
|
|
a 2) In third parties: 41412 |
0,00 |
0,00 |
0,00 |
0,00 |
0,00 |
|
|
b) From negotiable
securities and other financial instruments : 41420 |
7.695,00 |
4.189,00 |
8.228,00 |
19.090,00 |
64.906,00 |
|
|
b 1) From Group companies and associates : 41421 |
0,00 |
0,00 |
0,00 |
0,00 |
0,00 |
|
|
b 2) From third parties : 41422 |
7.695,00 |
4.189,00 |
8.228,00 |
19.090,00 |
64.906,00 |
|
|
c) Allocation of financial
subsidies, donations and legacies : 41430 |
0,00 |
0,00 |
0,00 |
0,00 |
0,00 |
|
|
15. Financial expenditure: 41500 |
-312.925,00 |
-305.114,00 |
-200.327,00 |
-222.966,00 |
-376.189,00 |
|
|
a) Amounts owed to Group
companies and associates : 41510 |
-68.052,00 |
-76.216,00 |
-8.555,00 |
0,00 |
0,00 |
|
|
b) For debts with
third parties : 41520 |
-244.873,00 |
-228.899,00 |
-191.772,00 |
-222.966,00 |
-376.189,00 |
|
|
c) Stock renewal :
41530 |
0,00 |
0,00 |
0,00 |
0,00 |
0,00 |
|
|
16. Changes in fair value of financial
instruments : 41600 |
-11.506,00 |
-738,00 |
-3.934,00 |
0,00 |
0,00 |
|
|
a) Trading book and
other : 41610 |
-11.506,00 |
-738,00 |
-3.934,00 |
0,00 |
0,00 |
|
|
b) Allocation of
financial assets held for sale to the result for the period: 41620 |
0,00 |
0,00 |
0,00 |
0,00 |
0,00 |
|
|
17. Exchange rate differences :
41700 |
-112.211,00 |
-89.536,00 |
6.663,00 |
18.308,00 |
-2.629,00 |
|
|
18. Impairment and result for transfers of
financial instruments: 41800 |
-59.788,00 |
-13.033,00 |
-6.267,00 |
-1.454,00 |
634.788,00 |
|
|
a) Impairment and
losses : 41810 |
-59.788,00 |
-13.033,00 |
-6.267,00 |
-1.454,00 |
81.446,00 |
|
|
b) Results for
transfers and other : 41820 |
0,00 |
0,00 |
0,00 |
0,00 |
553.343,00 |
|
|
19. Other financial income and
expenditure: 42100 |
0,00 |
0,00 |
0,00 |
0,00 |
0,00 |
|
|
a) Incorporation of
financial expenditure to assets: 42110 |
0,00 |
0,00 |
0,00 |
0,00 |
0,00 |
|
|
b) Financial income
from arrangement with creditors: 42120 |
0,00 |
0,00 |
0,00 |
0,00 |
0,00 |
|
|
c) Other income and
expenditure: 42130 |
0,00 |
0,00 |
0,00 |
0,00 |
0,00 |
|
|
A.2) FINANCIAL REVENUE (14+15+16+17+18+19)
: 49200 |
-488.734,00 |
-404.233,00 |
-195.638,00 |
-187.022,00 |
320.877,00 |
|
|
A.3) NET RESULT BEFORE TAXES (A.1+A.2) :
49300 |
366.531,00 |
646.484,00 |
403.142,00 |
480.019,00 |
947.090,00 |
|
|
20. Income taxes: 41900 |
-71.609,00 |
-138.073,00 |
-6.266,00 |
-72.553,00 |
-237.578,00 |
|
|
A.4) PROFIT AFTER TAXES (A.3+20) :
49400 |
294.922,00 |
508.412,00 |
396.876,00 |
407.466,00 |
709.512,00 |
|
|
21. Result of the year coming from interrupted operations : 42000 |
0,00 |
0,00 |
0,00 |
0,00 |
0,00 |
|
|
A.5) RESULT OF THE PERIOD (A.4+21) : 49500 |
294.922,00 |
508.412,00 |
396.876,00 |
407.466,00 |
709.512,00 |
|
> Normal Balance Sheet under the rules of the 1990 General Accounting Plan (repealed since 1st January of 2008)
Information corresponding to the fiscal year 2013 2012 2010 2009 2008 has been compiled based on the equivalence criteria stipulated in Act JUS/206/2009. Where the provisions of the Act did not establish relevant equivalence criteria To view details on the methodology 2013 2012 2010 2009 2008 is taken from information submitted to the TRADE REGISTER.
|
|
EQUIVALENCIA |
EQUIVALENCIA |
EQUIVALENCIA |
EQUIVALENCIA |
EQUIVALENCIA |
|
|
ASSETS |
2013 |
2012 |
2010 |
2009 |
2008 |
|
|
A) SHAREHOLDERS (PARTNERS) BY UNCALLED
SUSCRIBED CAPITAL: |
0,00 |
0,00 |
0,00 |
0,00 |
0,00 |
|
|
B) FIXED ASSETS: |
5.886.558,00 |
7.020.532,00 |
9.867.887,00 |
10.253.664,00 |
9.799.588,00 |
|
|
I. Formation
expenses: |
0,00 |
0,00 |
0,00 |
0,00 |
0,00 |
|
|
II. Intangible fixed
assets: |
7.759,00 |
38.743,00 |
170.614,00 |
213.973,00 |
121.551,00 |
|
|
1. Research and development costs: |
6.496,00 |
32.480,00 |
84.448,00 |
110.432,00 |
0,00 |
|
|
2. Concessions, patents, licences, trademarks et al.: |
0,00 |
0,00 |
139,00 |
356,00 |
573,00 |
|
|
3. Goodwill: |
0,00 |
0,00 |
0,00 |
0,00 |
0,00 |
|
|
4. Key money paid for premises: |
0,00 |
0,00 |
0,00 |
0,00 |
0,00 |
|
|
5. Software: |
1.263,00 |
6.263,00 |
86.027,00 |
103.185,00 |
120.977,00 |
|
|
6. Assets under capital leases: |
0,00 |
0,00 |
0,00 |
0,00 |
0,00 |
|
|
7.
Payments on account: |
0,00 |
0,00 |
0,00 |
0,00 |
0,00 |
|
|
8. Provisions: |
0,00 |
0,00 |
0,00 |
0,00 |
0,00 |
|
|
9. Accumulated depreciation: |
0,00 |
0,00 |
0,00 |
0,00 |
0,00 |
|
|
III. Tangible fixed
assets: |
4.751.422,00 |
5.901.264,00 |
6.018.785,00 |
6.150.450,00 |
6.005.936,00 |
|
|
1. Land and construction: |
3.039.349,00 |
2.980.609,00 |
3.425.152,00 |
3.555.880,00 |
3.686.607,00 |
|
|
2.
Technical installations and machinery: |
1.379.734,00 |
2.583.396,00 |
409.578,00 |
423.848,00 |
480.959,00 |
|
|
3. Other installations, tools and furniture: |
0,00 |
0,00 |
657.185,00 |
680.083,00 |
771.720,00 |
|
|
4. Payments on account and tangible fixed assets under construction: |
332.339,00 |
337.259,00 |
1.276.642,00 |
1.231.691,00 |
772.811,00 |
|
|
5. Other tangible assets: |
0,00 |
0,00 |
250.229,00 |
258.947,00 |
293.839,00 |
|
|
6. Provisions: |
0,00 |
0,00 |
0,00 |
0,00 |
0,00 |
|
|
7. Accumulated depreciation: |
0,00 |
0,00 |
0,00 |
0,00 |
0,00 |
|
|
IV. Financial
investments: |
1.127.377,00 |
1.080.525,00 |
3.678.488,00 |
3.889.241,00 |
3.672.101,00 |
|
|
1. Equity investments in group companies: |
990.644,00 |
1.050.432,00 |
1.710.919,00 |
1.367.840,00 |
1.069.051,00 |
|
|
2. Receivables from group companies: |
124.522,00 |
25.022,00 |
565.856,00 |
644.430,00 |
927.468,00 |
|
|
3. Equity investment in associated companies: |
0,00 |
0,00 |
2.126.629,00 |
1.700.191,00 |
1.328.803,00 |
|
|
4. Credits to associated companies: |
0,00 |
0,00 |
0,00 |
0,00 |
0,00 |
|
|
5. Long-term securities portfolio: |
0,00 |
0,00 |
-726.277,00 |
6.007,00 |
6.007,00 |
|
|
6. Other receivables: |
0,00 |
0,00 |
0,00 |
169.412,00 |
339.412,00 |
|
|
7.
Long term guarantees and deposits: |
12.210,00 |
5.071,00 |
1.361,00 |
1.361,00 |
1.361,00 |
|
|
8. Provisions: |
0,00 |
0,00 |
0,00 |
0,00 |
0,00 |
|
|
9. Long-term receivables from public bodies: |
0,00 |
0,00 |
0,00 |
0,00 |
0,00 |
|
|
V. Own shares: |
0,00 |
0,00 |
0,00 |
0,00 |
0,00 |
|
|
VI. Long-term trade
receivables: |
0,00 |
0,00 |
0,00 |
0,00 |
0,00 |
|
|
C) Deferred expenses: |
0,00 |
0,00 |
0,00 |
0,00 |
0,00 |
|
|
D) CURRENT ASSETS: |
20.672.935,00 |
23.436.710,00 |
13.161.422,00 |
10.004.453,00 |
16.027.549,00 |
|
|
I. Called-up share
capital (not paid): |
0,00 |
0,00 |
0,00 |
0,00 |
0,00 |
|
|
II. Stocks: |
3.126.144,00 |
6.264.184,00 |
2.865.485,00 |
2.852.040,00 |
4.750.915,00 |
|
|
1. Goods for resale: |
972.011,00 |
4.419.116,00 |
773.005,00 |
1.431.141,00 |
1.849.526,00 |
|
|
2. Raw materials and other consumables: |
408.731,00 |
482.472,00 |
341.626,00 |
330.522,00 |
329.107,00 |
|
|
3. Goods in process and semifinished ones: |
0,00 |
0,00 |
89.117,00 |
89.117,00 |
89.117,00 |
|
|
4. Finished products: |
0,00 |
0,00 |
0,00 |
0,00 |
75.333,00 |
|
|
5. Byproducts, scrap and recovered materials: |
0,00 |
0,00 |
0,00 |
0,00 |
0,00 |
|
|
6. Payments on account: |
1.745.402,00 |
1.362.595,00 |
1.661.737,00 |
1.001.260,00 |
2.407.832,00 |
|
|
7. Provisions: |
0,00 |
0,00 |
0,00 |
0,00 |
0,00 |
|
|
III. Debtors: |
13.019.610,00 |
13.528.546,00 |
9.424.882,00 |
5.709.107,00 |
9.586.553,00 |
|
|
1. Trade debtors / accounts receivable: |
12.475.648,00 |
12.604.286,00 |
7.768.792,00 |
5.383.110,00 |
9.348.608,00 |
|
|
2. Accounts receivable, Group companies: |
254.638,00 |
735.182,00 |
1.457.043,00 |
139.323,00 |
80.962,00 |
|
|
3.
Accounts receivable, associated companies: |
0,00 |
0,00 |
0,00 |
0,00 |
0,00 |
|
|
4. Other debtors: |
0,00 |
0,00 |
0,00 |
0,00 |
0,00 |
|
|
5. Staff: |
93.472,00 |
24.608,00 |
68.482,00 |
44.004,00 |
4.448,00 |
|
|
6. Public bodies: |
195.853,00 |
164.470,00 |
130.564,00 |
142.669,00 |
152.536,00 |
|
|
7. Provisions: |
0,00 |
0,00 |
0,00 |
0,00 |
0,00 |
|
|
IV. Short-term
investments: |
4.180.021,00 |
3.079.922,00 |
292.484,00 |
616.301,00 |
652.516,00 |
|
|
1. Equity investments in group companies: |
0,00 |
0,00 |
0,00 |
0,00 |
0,00 |
|
|
2. Receivables from group companies: |
6.157,00 |
174.554,00 |
171.514,00 |
159.071,00 |
372.925,00 |
|
|
3. Equity investment in associated companies: |
0,00 |
0,00 |
0,00 |
0,00 |
0,00 |
|
|
4. Credits to associated companies: |
0,00 |
0,00 |
0,00 |
0,00 |
0,00 |
|
|
5.
Short term securities portfolio: |
0,00 |
0,00 |
0,00 |
0,00 |
0,00 |
|
|
6. Other receivables: |
3.571.144,00 |
2.763.512,00 |
0,00 |
340.000,00 |
170.000,00 |
|
|
7. Shor term guarantees and deposits: |
602.720,00 |
141.857,00 |
120.970,00 |
117.230,00 |
109.591,00 |
|
|
8. Provisions: |
0,00 |
0,00 |
0,00 |
0,00 |
0,00 |
|
|
V. Short-term
treasury shares: |
0,00 |
0,00 |
0,00 |
0,00 |
0,00 |
|
|
VI. Cash at bank and
in hand: |
343.612,00 |
383.652,00 |
478.428,00 |
357.701,00 |
875.841,00 |
|
|
VII. Prepayments and
accrued income: |
3.547,00 |
180.405,00 |
100.143,00 |
469.304,00 |
161.724,00 |
|
|
GENERAL TOTAL (A + B + C + D): |
26.559.492,00 |
30.457.242,00 |
23.029.309,00 |
20.258.116,00 |
25.827.138,00 |
|
MERCANTILE
REGISTRY.
|
|
EQUIVALENCIA |
EQUIVALENCIA |
EQUIVALENCIA |
EQUIVALENCIA |
EQUIVALENCIA |
|
|
LIABILITIES |
2013 |
2012 |
2010 |
2009 |
2008 |
|
|
A) EQUITY: |
8.461.229,00 |
8.166.307,00 |
6.837.187,00 |
6.440.311,00 |
6.032.845,00 |
|
|
I. Subscribed
capital: |
3.405.600,00 |
3.405.600,00 |
3.405.600,00 |
3.405.600,00 |
3.405.600,00 |
|
|
II. Share premium:
|
0,00 |
0,00 |
0,00 |
0,00 |
0,00 |
|
|
III. Revaluation
reserves: |
0,00 |
0,00 |
0,00 |
0,00 |
0,00 |
|
|
IV. Reserves: |
4.760.707,00 |
4.252.295,00 |
3.034.711,00 |
2.627.245,00 |
1.917.733,00 |
|
|
1. Legal reserve: |
738.040,00 |
738.040,00 |
616.281,00 |
0,00 |
0,00 |
|
|
2. Reserves for own shares: |
0,00 |
0,00 |
0,00 |
0,00 |
0,00 |
|
|
3.
Reserves for shares of the controlling company: |
0,00 |
0,00 |
0,00 |
0,00 |
0,00 |
|
|
4. Statutory reserves: |
0,00 |
0,00 |
0,00 |
0,00 |
0,00 |
|
|
5. Miscellaneous reserves: |
4.022.668,00 |
3.514.256,00 |
2.418.430,00 |
2.627.245,00 |
1.917.733,00 |
|
|
Differences due to capital adjustement to euros: |
0,00 |
0,00 |
0,00 |
0,00 |
0,00 |
|
|
V. Profit or loss
brought forward: |
0,00 |
0,00 |
0,00 |
0,00 |
0,00 |
|
|
1. Retained earnings: |
0,00 |
0,00 |
0,00 |
0,00 |
0,00 |
|
|
2. Prior year losses: |
0,00 |
0,00 |
0,00 |
0,00 |
0,00 |
|
|
3. Partners' contributions so as to compensate losses: |
0,00 |
0,00 |
0,00 |
0,00 |
0,00 |
|
|
VI. Profit or loss
for the financial year: |
294.922,00 |
508.412,00 |
396.876,00 |
407.466,00 |
709.512,00 |
|
|
VII. Interim dividend
paid: |
0,00 |
0,00 |
0,00 |
0,00 |
0,00 |
|
|
VIII. Own shares for
capital reduction: |
0,00 |
0,00 |
0,00 |
0,00 |
0,00 |
|
|
B) Deferred income: |
0,00 |
0,00 |
0,00 |
0,00 |
0,00 |
|
|
1. Capital grants: |
0,00 |
0,00 |
0,00 |
0,00 |
0,00 |
|
|
2.
Unrealised exchange gains: |
0,00 |
0,00 |
0,00 |
0,00 |
0,00 |
|
|
3. Other deferred income: |
0,00 |
0,00 |
0,00 |
0,00 |
0,00 |
|
|
4. Public revenues to distribute in several financial years: |
0,00 |
0,00 |
0,00 |
0,00 |
0,00 |
|
|
C) PROVISIONS FOR LIABILITIES AND CHARGES:
|
0,00 |
0,00 |
0,00 |
0,00 |
71.393,00 |
|
|
1. Provisions for pension fund and other similar obligations: |
0,00 |
0,00 |
0,00 |
0,00 |
0,00 |
|
|
2. Provisions for taxes: |
0,00 |
0,00 |
0,00 |
0,00 |
0,00 |
|
|
3. Other provisions: |
0,00 |
0,00 |
0,00 |
0,00 |
71.393,00 |
|
|
4. Reversion fund: |
0,00 |
0,00 |
0,00 |
0,00 |
0,00 |
|
|
D) LONG TERM LIABILITIES: |
553.856,00 |
678.653,00 |
828.323,00 |
950.298,00 |
1.392.811,00 |
|
|
I. Issued debentures
and other marketable securities: |
0,00 |
0,00 |
0,00 |
0,00 |
0,00 |
|
|
1.
Non-convertible debentures: |
0,00 |
0,00 |
0,00 |
0,00 |
0,00 |
|
|
2. Convertible debentures: |
0,00 |
0,00 |
0,00 |
0,00 |
0,00 |
|
|
3. Other debt securities: |
0,00 |
0,00 |
0,00 |
0,00 |
0,00 |
|
|
II. Amounts owed to
credit institutions: |
153.750,00 |
176.250,00 |
328.367,00 |
393.207,00 |
1.052.251,00 |
|
|
1. Loans and other liabilities: |
153.750,00 |
176.250,00 |
263.868,00 |
263.595,00 |
862.854,00 |
|
|
2. Long-term liabilities from capital leases: |
0,00 |
0,00 |
64.499,00 |
129.612,00 |
189.397,00 |
|
|
III. Debts with
companies of the group and affiliated ones: |
0,00 |
0,00 |
0,00 |
0,00 |
0,00 |
|
|
1. Amounts owed to group companies: |
0,00 |
0,00 |
0,00 |
0,00 |
0,00 |
|
|
2. Amounts owed to associated companies: |
0,00 |
0,00 |
0,00 |
0,00 |
0,00 |
|
|
IV. Other creditors:
|
400.106,00 |
502.403,00 |
499.956,00 |
557.091,00 |
340.559,00 |
|
|
1. Long-term bills of exchange payable: |
0,00 |
0,00 |
0,00 |
0,00 |
0,00 |
|
|
2. Other creditors: |
182.983,00 |
204.704,00 |
248.144,00 |
260.644,00 |
0,00 |
|
|
3.
Long term guarantees and deposits received: |
0,00 |
0,00 |
0,00 |
0,00 |
0,00 |
|
|
4. Long term payables to public bodies: |
217.123,00 |
297.699,00 |
251.812,00 |
296.447,00 |
340.559,00 |
|
|
V. Unpaid portion of equity
investment: |
0,00 |
0,00 |
0,00 |
0,00 |
0,00 |
|
|
1. Group companies: |
0,00 |
0,00 |
0,00 |
0,00 |
0,00 |
|
|
2. Associated companies: |
0,00 |
0,00 |
0,00 |
0,00 |
0,00 |
|
|
3.
Third parties: |
0,00 |
0,00 |
0,00 |
0,00 |
0,00 |
|
|
VI. Long term trade
creditors: |
0,00 |
0,00 |
0,00 |
0,00 |
0,00 |
|
|
E) SHORT TERM CREDITORS: |
17.544.408,00 |
21.612.281,00 |
15.363.799,00 |
12.867.507,00 |
18.330.089,00 |
|
|
I. Issued debentures
and other marketable securities: |
0,00 |
0,00 |
0,00 |
0,00 |
0,00 |
|
|
1. Non-convertible debentures: |
0,00 |
0,00 |
0,00 |
0,00 |
0,00 |
|
|
2.
Convertible debentures: |
0,00 |
0,00 |
0,00 |
0,00 |
0,00 |
|
|
3. Other debt securities: |
0,00 |
0,00 |
0,00 |
0,00 |
0,00 |
|
|
4. Accrued interest on debentures and other debt securities: |
0,00 |
0,00 |
0,00 |
0,00 |
0,00 |
|
|
II. Amounts owed to
credit institutions: |
6.380.748,00 |
6.935.587,00 |
6.374.197,00 |
4.226.732,00 |
5.928.034,00 |
|
|
1. Loans and other liabilities: |
6.380.748,00 |
6.915.342,00 |
6.309.122,00 |
4.148.571,00 |
5.856.606,00 |
|
|
2. Accrued interest on liabilities with credit institutions: |
0,00 |
0,00 |
0,00 |
0,00 |
0,00 |
|
|
3. Short-term liabilities from capital leases: |
0,00 |
20.246,00 |
65.074,00 |
78.161,00 |
71.427,00 |
|
|
III. Short-term
amounts owed to group and associated companies: |
80.067,00 |
39.180,00 |
151.150,00 |
24.518,00 |
124.645,00 |
|
|
1. Amounts owed to group companies: |
80.067,00 |
39.180,00 |
151.150,00 |
24.518,00 |
124.645,00 |
|
|
2. Amounts owed to associated companies: |
0,00 |
0,00 |
0,00 |
0,00 |
0,00 |
|
|
IV. Trade creditors:
|
9.854.243,00 |
13.122.265,00 |
8.030.535,00 |
7.854.846,00 |
11.346.551,00 |
|
|
1. Advanced payments from customers: |
2.491.400,00 |
2.822.603,00 |
1.558.453,00 |
1.348.006,00 |
3.616.020,00 |
|
|
2. Amounts owed for purchases of goods or services: |
7.362.843,00 |
10.299.662,00 |
6.472.082,00 |
6.506.840,00 |
7.730.531,00 |
|
|
3. Debts represented by notes payable: |
0,00 |
0,00 |
0,00 |
0,00 |
0,00 |
|
|
V. Other creditors:
|
1.229.350,00 |
1.515.248,00 |
807.917,00 |
761.410,00 |
930.860,00 |
|
|
1. Public bodies: |
1.028.367,00 |
1.335.854,00 |
613.549,00 |
579.771,00 |
731.715,00 |
|
|
2. Bills of exchange payable: |
0,00 |
0,00 |
0,00 |
0,00 |
0,00 |
|
|
3.
Miscellaneous debts: |
21.720,00 |
21.720,00 |
12.500,00 |
0,00 |
1.076,00 |
|
|
4. Wages and salaries payable: |
179.262,00 |
157.674,00 |
181.868,00 |
181.639,00 |
198.069,00 |
|
|
5.
Guarantees and deposits received at short term: |
0,00 |
0,00 |
0,00 |
0,00 |
0,00 |
|
|
VI. Provisions:
|
0,00 |
0,00 |
0,00 |
0,00 |
0,00 |
|
|
VII. Prepayments and
accrued income: |
0,00 |
0,00 |
0,00 |
0,00 |
0,00 |
|
|
F) SHORT-TERM PROVISIONS FOR LIABILITIES
AND CHARGES: |
0,00 |
0,00 |
0,00 |
0,00 |
0,00 |
|
|
GENERAL TOTAL (A + B + C + D + E + F):
|
26.559.492,00 |
30.457.242,00 |
23.029.309,00 |
20.258.116,00 |
25.827.138,00 |
|
MERCANTILE
REGISTRY.
|
|
EQUIVALENCIA |
EQUIVALENCIA |
EQUIVALENCIA |
EQUIVALENCIA |
EQUIVALENCIA |
|
|
DEBIT |
2013 |
2012 |
2010 |
2009 |
2008 |
|
|
A) CHARGES (A.1 to A.15): |
24.750.962,00 |
28.888.806,00 |
17.515.167,00 |
22.309.644,00 |
25.827.683,00 |
|
|
A.1. Stock reduction of both manufactured goods and the ones in process:
|
0,00 |
0,00 |
0,00 |
75.109,00 |
137.217,00 |
|
|
A.2. Supplies: |
17.521.138,00 |
20.927.874,00 |
11.108.102,00 |
15.481.790,00 |
17.966.793,00 |
|
|
a) Stock consumption: |
11.655.849,00 |
14.698.417,00 |
6.953.109,00 |
9.876.475,00 |
13.577.547,00 |
|
|
b) Consumption of raw materials and miscellaneous consumable
ones: |
3.506.966,00 |
3.784.299,00 |
4.049.644,00 |
3.564.487,00 |
2.500.673,00 |
|
|
c) Miscellaneous external expenditure: |
2.358.323,00 |
2.445.159,00 |
105.349,00 |
2.040.828,00 |
1.888.573,00 |
|
|
A.3. Staff costs: |
3.383.054,00 |
3.466.923,00 |
3.110.182,00 |
3.406.374,00 |
3.528.496,00 |
|
|
a) Wages, salaries et al.: |
2.699.253,00 |
2.754.598,00 |
2.484.396,00 |
2.740.415,00 |
2.811.122,00 |
|
|
b) Social security costs: |
683.801,00 |
712.325,00 |
625.786,00 |
665.959,00 |
717.374,00 |
|
|
A.4. Depreciation expense: |
479.499,00 |
502.483,00 |
426.471,00 |
461.109,00 |
487.107,00 |
|
|
A.5.
Variation of trade provisions and losses of unrecovered receivables: |
43.455,00 |
329.895,00 |
31.782,00 |
40.664,00 |
35.331,00 |
|
|
a) Stock provision variation: |
0,00 |
0,00 |
0,00 |
0,00 |
0,00 |
|
|
b) Variation in provision and bad debt losses: |
0,00 |
0,00 |
31.782,00 |
40.664,00 |
35.331,00 |
|
|
c) Variation of other trade provisions: |
43.455,00 |
329.895,00 |
0,00 |
0,00 |
0,00 |
|
|
A.6.
Other operating charges: |
2.722.054,00 |
3.089.561,00 |
2.522.830,00 |
2.547.625,00 |
3.091.758,00 |
|
|
a) External services: |
2.679.046,00 |
3.045.705,00 |
2.490.642,00 |
2.508.788,00 |
3.006.370,00 |
|
|
b) Taxes: |
43.008,00 |
43.856,00 |
32.189,00 |
38.837,00 |
81.818,00 |
|
|
c) Other operating expenses: |
0,00 |
0,00 |
0,00 |
0,00 |
3.570,00 |
|
|
d) Allocation to revision fund: |
0,00 |
0,00 |
0,00 |
0,00 |
0,00 |
|
|
A.I. OPERATING
BENEFITS (B.1+B.2+B.3+B.4-A.1-A.2-A.3-A.4-A.5-A.6): |
888.983,00 |
1.076.291,00 |
697.785,00 |
656.077,00 |
672.244,00 |
|
|
A.7. Financial and similar charges: |
312.925,00 |
305.114,00 |
200.327,00 |
222.966,00 |
376.189,00 |
|
|
a) Due to liabilities with companies of the group:
|
68.052,00 |
76.216,00 |
8.555,00 |
0,00 |
0,00 |
|
|
b) Due to liabilities with associated companies: |
0,00 |
0,00 |
0,00 |
0,00 |
0,00 |
|
|
c) Due to other debts.: |
244.873,00 |
228.899,00 |
191.772,00 |
222.966,00 |
376.189,00 |
|
|
d) Losses from financial investments: |
0,00 |
0,00 |
0,00 |
0,00 |
0,00 |
|
|
A.8. Changes in financial investment provisions: |
71.293,00 |
13.771,00 |
3.934,00 |
0,00 |
0,00 |
|
|
A.9. Exchange losses: |
112.211,00 |
89.536,00 |
0,00 |
0,00 |
2.629,00 |
|
|
A.II. NET FINANCIAL
INCOME (B.5+B.6+B.7+B.8-A.7-A.8-A.9): |
0,00 |
0,00 |
0,00 |
0,00 |
239.431,00 |
|
|
A.III. PROFIT FROM
ORDINARY ACTIVITIES (A.I+A.II-B.I-B.II): |
400.249,00 |
672.058,00 |
508.414,00 |
470.509,00 |
911.675,00 |
|
|
A.10. Changes in provisions for intangible, tangible and securities
portfolio: |
0,00 |
0,00 |
6.267,00 |
1.454,00 |
-81.446,00 |
|
|
A.11.
Losses from tangible and intangible fixed assets and securities portfolio:
|
0,00 |
0,00 |
0,00 |
0,00 |
0,00 |
|
|
A.12. Losses from transactions with own shares and debentures: |
0,00 |
0,00 |
0,00 |
0,00 |
0,00 |
|
|
A.13. Extraordinary expenses: |
33.723,00 |
25.574,00 |
99.005,00 |
0,00 |
46.031,00 |
|
|
A.14. Expenses and losses of former financial years: |
0,00 |
0,00 |
0,00 |
0,00 |
0,00 |
|
|
A.IV. EXTRAORDINARY PROFIT
(B.9+B.10+B.11+B.12+B.13-A.10-A.11-A.12-A.13-A.14): |
0,00 |
0,00 |
0,00 |
9.511,00 |
35.415,00 |
|
|
A.V. PROFIT BEFORE
TAXES (A.III+A.IV-B.III-B.IV): |
366.531,00 |
646.484,00 |
403.142,00 |
480.019,00 |
947.090,00 |
|
|
A.15. Corporation tax: |
71.609,00 |
138.073,00 |
6.266,00 |
72.553,00 |
237.578,00 |
|
|
A.16. Miscellaneous taxes: |
0,00 |
0,00 |
0,00 |
0,00 |
0,00 |
|
|
A.VI. FINANCIAL YEAR
RESULTS (PROFIT) (A.V-A.15-A.16): |
294.922,00 |
508.412,00 |
396.876,00 |
407.466,00 |
709.512,00 |
|
MERCANTILE
REGISTRY.
|
|
EQUIVALENCIA |
EQUIVALENCIA |
EQUIVALENCIA |
EQUIVALENCIA |
EQUIVALENCIA |
|
|
CREDIT |
2013 |
2012 |
2010 |
2009 |
2008 |
|
|
B) INCOME ( B.1 to B.13): |
25.045.884,00 |
29.397.218,00 |
17.912.043,00 |
22.717.111,00 |
26.537.195,00 |
|
|
B.1. Net total sales: |
24.451.552,00 |
28.750.161,00 |
17.294.038,00 |
21.972.573,00 |
25.188.206,00 |
|
|
a) Sales: |
23.487.814,00 |
27.660.754,00 |
14.720.723,00 |
18.236.796,00 |
23.762.925,00 |
|
|
b) Rendering of services: |
963.738,00 |
1.089.407,00 |
2.573.534,00 |
3.736.049,00 |
1.425.636,00 |
|
|
Returns and Rappel on sales: |
0,00 |
0,00 |
-220,00 |
-272,00 |
-354,00 |
|
|
B.2. Stock increase of manufactured goods and products in process: |
0,00 |
0,00 |
0,00 |
0,00 |
0,00 |
|
|
B.3.
Works performed by the company for fixed assets: |
0,00 |
0,00 |
0,00 |
0,00 |
0,00 |
|
|
B.4. Miscellaneous operating income: |
586.632,00 |
642.868,00 |
603.115,00 |
696.174,00 |
730.740,00 |
|
|
a) Auxiliary income and other from current management:
|
581.558,00 |
637.820,00 |
593.427,00 |
679.664,00 |
722.498,00 |
|
|
b) Grants: |
5.073,00 |
5.048,00 |
9.688,00 |
16.510,00 |
8.242,00 |
|
|
c) Liabilities and charges provisions surplus: |
0,00 |
0,00 |
0,00 |
0,00 |
0,00 |
|
|
B.I. PÉRDIDAS DE
EXPLOTACIÓN (A.1+A.2+A.3+A.4+A.5-A.6-B.1-B.2-B.3-B.4): |
0,00 |
0,00 |
0,00 |
0,00 |
0,00 |
|
|
B.5.
Income from equity investment: |
0,00 |
0,00 |
0,00 |
0,00 |
0,00 |
|
|
a) In companies of the group: |
0,00 |
0,00 |
0,00 |
0,00 |
0,00 |
|
|
b) In associated companies: |
0,00 |
0,00 |
0,00 |
0,00 |
0,00 |
|
|
c) Third parties: |
0,00 |
0,00 |
0,00 |
0,00 |
0,00 |
|
|
B.6. Income from other marketable securities and long-term receivables:
|
0,00 |
0,00 |
0,00 |
0,00 |
0,00 |
|
|
a) From companies of the group: |
0,00 |
0,00 |
0,00 |
0,00 |
0,00 |
|
|
b) From associated companies: |
0,00 |
0,00 |
0,00 |
0,00 |
0,00 |
|
|
c) From companies out of the group: |
0,00 |
0,00 |
0,00 |
0,00 |
0,00 |
|
|
B.7. Miscellaneous interests or similar income: |
7.695,00 |
4.189,00 |
8.228,00 |
19.090,00 |
618.249,00 |
|
|
a) From companies of the group: |
0,00 |
0,00 |
0,00 |
0,00 |
0,00 |
|
|
b) From associated companies: |
0,00 |
0,00 |
0,00 |
0,00 |
0,00 |
|
|
c) Miscellaneous interests: |
7.695,00 |
4.189,00 |
8.228,00 |
19.090,00 |
64.906,00 |
|
|
d) Profit on financial investment: |
0,00 |
0,00 |
0,00 |
0,00 |
553.343,00 |
|
|
B.8. Exchange positive differences: |
0,00 |
0,00 |
6.663,00 |
18.308,00 |
0,00 |
|
|
B.II. NEGATIVE FINANCIAL
RESULTS (A.7+A.8+A.9-B.5-B.6-B.7-B.8): |
488.734,00 |
404.233,00 |
189.371,00 |
185.568,00 |
0,00 |
|
|
B.III. LOSSES ON
ORDINARY ACTIVITIES ( B.I + B.II - A.I - A.II ): |
0,00 |
0,00 |
0,00 |
0,00 |
0,00 |
|
|
B.9.Profit
on disposal of both tangible and intangible fixed assets and securities
portfolio: |
5,00 |
0,00 |
0,00 |
0,00 |
0,00 |
|
|
B.10. Profit on transactions with own shares and debentures: |
0,00 |
0,00 |
0,00 |
0,00 |
0,00 |
|
|
B.11. Capital grants transferred to profit and loss: |
0,00 |
0,00 |
0,00 |
0,00 |
0,00 |
|
|
B.12. Extraordinary income: |
0,00 |
0,00 |
0,00 |
10.965,00 |
0,00 |
|
|
B.13.
Income and profit of former financial years: |
0,00 |
0,00 |
0,00 |
0,00 |
0,00 |
|
|
B.IV. NEGATIVE
EXTRAORDINARY RESULTS (A.10+A.11+A.12+A.13+A.14-B.9-B.10-B.11-B.12-B.13):
|
33.719,00 |
25.574,00 |
105.272,00 |
0,00 |
0,00 |
|
|
B.V. LOSSES BEFORE
TAXES (B.III+B.IV-A.III-A.IV): |
0,00 |
0,00 |
0,00 |
0,00 |
0,00 |
|
|
B.VI. RESULT OF THE
PERIOD (LOSSES) (B.V+A.15+A.16): |
0,00 |
0,00 |
0,00 |
0,00 |
0,00 |
|
MERCANTILE
REGISTRY.
CASHFLOW
STATEMENT
Model: Normal
> Source of information: Data contained in this section is taken from the information declared in the Annual Accounts submitted to the Trade Register.
|
|
2013 |
2012 |
2010 |
2009 |
2008 |
|
|
1. Fiscal year result before taxes.: 61100 |
366.531,00 |
646.484,00 |
403.142,00 |
480.019,00 |
947.090,00 |
|
|
2. Results adjustments.: 61200 |
1.001.683,00 |
1.236.638,00 |
654.427,00 |
726.712,00 |
201.324,00 |
|
|
a) Fixed Assets Amortization (+).: 61201 |
479.499,00 |
502.483,00 |
426.471,00 |
461.109,00 |
487.107,00 |
|
|
b) Obsolescence
Allowances (+/-). : 61202 |
103.243,00 |
342.928,00 |
38.585,00 |
41.854,00 |
-90.013,00 |
|
|
c) Variation in
Provision (+/-). : 61203 |
0,00 |
0,00 |
0,00 |
0,00 |
43.661,00 |
|
|
e) Results on
disposal of fixed assets (+/-). : 61205 |
-5,00 |
0,00 |
0,00 |
0,00 |
-553.343,00 |
|
|
g) Financial income
(-).: 61207 |
-7.695,00 |
-4.189,00 |
-8.228,00 |
19.090,00 |
-64.906,00 |
|
|
h) Financial Expenses
(+). : 61208 |
314.431,00 |
305.852,00 |
204.261,00 |
222.966,00 |
376.189,00 |
|
|
i) Exchange
differences (+/-). : 61209 |
112.211,00 |
89.563,00 |
-6.663,00 |
-18.308,00 |
2.629,00 |
|
|
3. Changes in current capital equity.:
61300 |
437.629,00 |
-1.428.029,00 |
-3.005.986,00 |
1.692.098,00 |
-1.247.738,00 |
|
|
a) Stock (+/-).:
61301 |
3.520.847,00 |
-2.545.003,00 |
647.033,00 |
492.525,00 |
65.839,00 |
|
|
d) Debtors and other
accounts receivable (+/-). : 61302 |
418.506,00 |
-1.851.434,00 |
-3.525.272,00 |
1.598.458,00 |
-1.543.515,00 |
|
|
d) Creditors and other
accounts payable (+/-). : 61304 |
-3.680.715,00 |
2.687.771,00 |
-472.071,00 |
-87.301,00 |
145.102,00 |
|
|
e) Other current
liabilities (+/-).: 61305 |
129.583,00 |
304.702,00 |
357.412,00 |
-363.565,00 |
-8.400,00 |
|
|
f) Other non-current
assets and liabilities (+/-).: 61306 |
49.407,00 |
-24.064,00 |
-13.087,00 |
51.981,00 |
93.235,00 |
|
|
4. Other cash flows for operating
activities.: 61400 |
-465.469,00 |
-143.796,00 |
-297.584,00 |
-330.743,00 |
-535.617,00 |
|
|
a) Interest payments
(-). : 61401 |
-314.431,00 |
-305.853,00 |
-204.261,00 |
-222.966,00 |
-376.189,00 |
|
|
c) Interest
collection (+). : 61403 |
7.695,00 |
4.189,00 |
8.228,00 |
-19.090,00 |
64.906,00 |
|
|
d) Income tax payment
collection (payments) (+/-).: 61404 |
-158.733,00 |
157.867,00 |
-101.551,00 |
-88.687,00 |
-224.334,00 |
|
|
5. Operating activity cash flows (1 + 2 +
3 + 4) : 61500 |
1.340.374,00 |
311.297,00 |
-2.246.001,00 |
2.568.087,00 |
-634.942,00 |
|
|
6. Payments for investment (-).:
62100 |
-758.285,00 |
-258.646,00 |
-376.849,00 |
-1.272.518,00 |
-1.448.755,00 |
|
|
a) Companies of the
group and affiliates. : 62101 |
0,00 |
0,00 |
-43.500,00 |
-494.331,00 |
-385.195,00 |
|
|
b) Intangible fixed
assets. : 62102 |
0,00 |
0,00 |
-19.552,00 |
-149.512,00 |
-109.729,00 |
|
|
c) Fixed assets. :
62103 |
-135.721,00 |
-258.646,00 |
-310.057,00 |
-619.960,00 |
-879.485,00 |
|
|
e) Other financial
assets. : 62105 |
-622.564,00 |
0,00 |
-3.640,00 |
-3.639,00 |
0,00 |
|
|
g) Business Unit :
62107 |
0,00 |
0,00 |
0,00 |
-5.076,00 |
0,00 |
|
|
h) Other assets. :
62108 |
0,00 |
0,00 |
-100,00 |
0,00 |
-74.346,00 |
|
|
7. Divestment payment collection (+). :
62200 |
68.896,00 |
439.963,00 |
575.542,00 |
248.239,00 |
930.252,00 |
|
|
a) Companies of the
group and affiliates. : 62201 |
68.896,00 |
365.929,00 |
235.542,00 |
0,00 |
744.255,00 |
|
|
e) Other financial
assets. : 62205 |
0,00 |
74.033,00 |
340.000,00 |
248.239,00 |
185.997,00 |
|
|
8. Investment activity cash flows (6 + 7)
minus Amortization: 62300 |
-689.389,00 |
181.316,00 |
198.693,00 |
-1.024.279,00 |
-518.504,00 |
|
|
9. Payment collection and payments for
equity instruments. : 63100 |
0,00 |
0,00 |
0,00 |
0,00 |
0,00 |
|
|
a) Issuance of equity
instruments (+). : 63101 |
0,00 |
0,00 |
6.440.311,00 |
0,00 |
0,00 |
|
|
10. Payment collection and payments for
financial liabilities instruments.: 63200 |
-578.814,00 |
-707.968,00 |
2.161.372,00 |
-2.080.255,00 |
700.835,00 |
|
|
a) Issuance :
63201 |
0,00 |
0,00 |
2.161.372,00 |
260.644,00 |
1.260.295,00 |
|
|
2. Debts incurred
with credit institutions (+). : 63203 |
0,00 |
0,00 |
2.161.372,00 |
0,00 |
1.259.219,00 |
|
|
5. Other debts (+). :
63206 |
0,00 |
0,00 |
0,00 |
260.644,00 |
1.076,00 |
|
|
b) Repayment and
amortization of : 63207 |
-578.814,00 |
-707.968,00 |
0,00 |
-2.340.900,00 |
-559.459,00 |
|
|
2. Debts incurred
with credit institutions (-).: 63209 |
-557.094,00 |
-677.027,00 |
0,00 |
-2.340.900,00 |
-559.459,00 |
|
|
5. Other debts (-). :
63212 |
-21.720,00 |
-30.941,00 |
0,00 |
0,00 |
0,00 |
|
|
11. Payments from dividends and
remunerations from other assets instruments. : 63300 |
0,00 |
0,00 |
0,00 |
0,00 |
0,00 |
|
|
12. Cash flows for financing activities
(9+10+11).: 63400 |
-578.814,00 |
-707.968,00 |
2.161.372,00 |
-2.080.255,00 |
700.835,00 |
|
|
D) EFFECT OF EXCHANGE RATE CHANGES:
64000 |
-112.211,00 |
-89.563,00 |
6.663,00 |
18.308,00 |
-2.629,00 |
|
|
E) NET INCREASE/DECREASE OF CASH OR
EQUIVALENT ASSETS (+/-5+/-8+/12+/-D) : 65000 |
-40.039,00 |
-304.917,00 |
120.727,00 |
-518.140,00 |
-455.239,00 |
|
|
Cash or equivalent
assets as of beginning of the fiscal year.: 65100 |
383.652,00 |
688.569,00 |
357.701,00 |
875.841,00 |
1.331.080,00 |
|
|
Cash or equivalent
assets as of end of the fiscal year.: 65200 |
343.612,00 |
383.652,00 |
478.428,00 |
357.701,00 |
875.841,00 |
|
FINANCIAL DIAGNOSIS
> Economic-Financial Comparative Analysis
Data used in the following
ratios and indicators is taken from the Annual Accounts submitted by the
company to the TRADE REGISTER.
> Comparison within the Sector
|
Cash Flow |
2013 |
2012 |
Variación 2013 -
2012 |
|
|||
|
|
Empresa |
Sector |
Empresa |
Sector |
Empresa |
Sector |
|
|
Cash Flow over Sales: |
0,00 % |
0,05 % |
0,01 % |
0,01 % |
-112,28 % |
622,07 % |
|
|
EBITDA over Sales: |
5,60 % |
11,49 % |
5,49 % |
9,24 % |
1,92 % |
24,40 % |
|
|
Cash Flow Yield: |
0,00 % |
0,02 % |
0,01 % |
0,00 % |
-111,97 % |
|
|
|
Profitability |
2013 |
2012 |
Variación 2013 -
2012 |
|
|||
|
|
Empresa |
Sector |
Empresa |
Sector |
Empresa |
Sector |
|
|
Operating economic profitability: |
4,18 % |
7,19 % |
4,09 % |
5,22 % |
2,20 % |
37,61 % |
|
|
Total economic profitability: |
2,56 % |
3,93 % |
3,12 % |
2,49 % |
-18,12 % |
57,88 % |
|
|
Financial profitability: |
3,49 % |
4,65 % |
6,23 % |
1,32 % |
-44,01 % |
253,41 % |
|
|
Margin: |
3,55 % |
6,91 % |
3,66 % |
4,85 % |
-3,04 % |
42,35 % |
|
|
Mark-up: |
1,60 % |
4,80 % |
2,29 % |
1,59 % |
-30,09 % |
202,40 % |
|
|
Solvency |
2013 |
2012 |
Variación 2013 -
2012 |
|
|||
|
|
Empresa |
Sector |
Empresa |
Sector |
Empresa |
Sector |
|
|
Liquidity: |
0,02 |
0,14 |
0,02 |
0,12 |
10,33 |
16,30 |
|
|
Acid Test: |
0,99 |
0,87 |
0,78 |
0,85 |
26,74 |
1,99 |
|
|
Working Capital / Investment: |
0,11 |
0,05 |
0,06 |
0,03 |
98,55 |
104,05 |
|
|
Solvency: |
1,18 |
1,19 |
1,08 |
1,17 |
8,66 |
1,09 |
|
|
Indebtedness |
2013 |
2012 |
Variación 2013 -
2012 |
|
|||
|
|
Empresa |
Sector |
Empresa |
Sector |
Empresa |
Sector |
|
|
Indebtedness level: |
2,14 |
1,35 |
2,73 |
1,63 |
-21,64 |
-17,19 |
|
|
Borrowing Composition: |
0,03 |
0,99 |
0,03 |
1,03 |
0,54 |
-3,44 |
|
|
Repayment Ability: |
-452,01 |
24,45 |
58,10 |
190,09 |
-877,96 |
-87,14 |
|
|
Warranty: |
1,47 |
1,75 |
1,37 |
1,62 |
7,40 |
8,03 |
|
|
Generated resources / Total creditors:
|
0,05 |
0,09 |
0,05 |
0,07 |
0,34 |
29,74 |
|
|
Efficiency |
2013 |
2012 |
Variación 2013 -
2012 |
|
|||
|
|
Empresa |
Sector |
Empresa |
Sector |
Empresa |
Sector |
|
|
Productivity: |
1,40 |
1,88 |
1,46 |
1,73 |
-3,50 |
8,79 |
|
|
Turnover of Collection Rights : |
1,95 |
5,10 |
2,19 |
4,79 |
-11,00 |
6,44 |
|
|
Turnover of Payment Entitlements: |
1,83 |
3,69 |
1,66 |
3,52 |
10,28 |
5,02 |
|
|
Stock rotation: |
7,72 |
7,43 |
4,52 |
6,49 |
70,89 |
14,42 |
|
|
Assets turnover: |
1,18 |
1,04 |
1,12 |
1,08 |
5,40 |
-3,33 |
|
|
Borrowing Cost: |
1,73 |
2,83 |
1,37 |
2,95 |
26,32 |
-4,06 |
|
> Trend of indicators under the General
Accounting Plan of 2007 (2013, 2012, 2010, 2009, 2008)
|
Cash Flow |
2013 |
2012 |
2010 |
2009 |
2008 |
|
|
Cash Flow over Sales: |
0,00 % |
0,01 % |
0,03 % |
-0,02 % |
-1,81 % |
|
|
EBITDA over Sales: |
5,60 % |
5,49 % |
6,50 % |
5,08 % |
4,60 % |
|
|
Cash Flow Yield: |
0,00 % |
0,01 % |
0,02 % |
-0,03 % |
-1,76 % |
|
|
Profitability |
2013 |
2012 |
2010 |
2009 |
2008 |
|
|
Operating economic profitability: |
4,18 % |
4,09 % |
3,66 % |
4,16 % |
3,13 % |
|
|
Total economic profitability: |
2,56 % |
3,12 % |
2,62 % |
3,47 % |
5,12 % |
|
|
Financial profitability: |
3,49 % |
6,23 % |
5,80 % |
6,33 % |
11,76 % |
|
|
Margin: |
3,55 % |
3,66 % |
3,90 % |
2,89 % |
2,59 % |
|
|
Mark-up: |
1,60 % |
2,29 % |
2,81 % |
2,07 % |
1,42 % |
|
|
Solvency |
2013 |
2012 |
2010 |
2009 |
2008 |
|
|
Liquidity: |
0,02 |
0,02 |
0,03 |
0,03 |
0,05 |
|
|
Acid Test: |
0,99 |
0,78 |
0,66 |
0,51 |
0,60 |
|
|
Working Capital / Investment: |
0,11 |
0,06 |
-0,10 |
-0,15 |
-0,09 |
|
|
Solvency: |
1,18 |
1,08 |
0,86 |
0,78 |
0,87 |
|
|
Indebtedness |
2013 |
2012 |
2010 |
2009 |
2008 |
|
|
Indebtedness level: |
2,14 |
2,73 |
2,37 |
2,15 |
3,23 |
|
|
Borrowing Composition: |
0,03 |
0,03 |
0,05 |
0,07 |
0,08 |
|
|
Repayment Ability: |
-452,01 |
58,10 |
33,84 |
-26,67 |
27,70 |
|
|
Warranty: |
1,47 |
1,37 |
1,42 |
1,47 |
1,31 |
|
|
Generated resources / Total creditors:
|
0,05 |
0,05 |
0,05 |
0,06 |
0,03 |
|
|
Efficiency |
2013 |
2012 |
2010 |
2009 |
2008 |
|
|
Productivity: |
1,40 |
1,46 |
1,36 |
1,33 |
1,33 |
|
|
Turnover of Collection Rights : |
1,95 |
2,19 |
1,93 |
4,07 |
2,75 |
|
|
Turnover of Payment Entitlements: |
1,83 |
1,66 |
1,52 |
2,08 |
1,69 |
|
|
Stock rotation: |
7,72 |
4,52 |
6,00 |
7,72 |
5,31 |
|
|
Assets turnover: |
1,18 |
1,12 |
0,94 |
1,44 |
1,21 |
|
|
Borrowing Cost: |
1,73 |
1,37 |
1,24 |
1,61 |
1,91 |
|
COMPARATIVE
SECTORIAL BALANCE
Sector-based Comparison under the rules of the New General Accounting
Plan.
|
|
Variación - |
|
|
|
Empresa |
Sector |
|
|
Variación - |
|
|
|
Empresa |
Sector |
|
|
Variación - |
|
|
|
Empresa |
Sector |
News
--
Public Tenders and Works Won
|
|
|
Organisation that calls the tender: |
|
INSPECCION GENERAL
DE SANIDAD DEL MINISTERIO DE DEFENSA |
|
Objective of Tender: |
|
Suministro e
instalación de línea de envasado de formas farmacéuticas semisólidas. Centro
Militar de Farmacia de la Defensa. |
|
Date Awarded: |
|
01/10/2014 |
|
Cost: |
|
596.478,82 EURO. |
|
|
|
Organisation that calls the tender: |
|
INSPECCION
GENERAL DE SANIDAD DEL MINISTERIO DE DEFENSA |
|
Objective of Tender: |
|
SUMINISTRO E
INSTALACION DE LINEA DE ENVASADO DE FORMAS FARMACEUTICAS SEMISOLIDAS CENTRO MILITAR
DE FARMACIA DE LA DEFENSA |
|
Date Awarded: |
|
01/10/2014 |
|
Cost: |
|
596.478,82 EURO. |
|
|
|
Organisation that calls the tender: |
|
MINISTERIO DE
DEFENSA |
|
Objective of Tender: |
|
Adquisición de 2
máquinas encajadoras y cinta de conexión para la línea de envasado de
cápsulas.CMILFAR. |
|
Date Awarded: |
|
30/09/2014 |
|
Cost: |
|
378.351,06 EURO. |
|
|
|
Organisation that calls the tender: |
|
INSPECCION
GENERAL DE SANIDAD DEL MINISTERIO DE DEFENSA |
|
Objective of Tender: |
|
ADQUISICION DE 2
MAQUINAS ENCAJADORAS Y CINTA DE CONEXION PARA LA LINEA DE ENVASADO DE
CAPSULAS CMILFAR |
|
Date Awarded: |
|
30/09/2014 |
|
Cost: |
|
378.351,06 EURO. |
|
|
|
Organisation that calls the tender: |
|
CENTRO MILITAR
DE FARMACIA DE LA DEFENSA |
|
Objective of Tender: |
|
INSTALACIONES
COMPLEMENTARIAS PARA PRODUCCION |
|
Date Awarded: |
|
24/10/2009 |
|
Cost: |
|
84.424,80 EURO. |
|
|
|
Organisation that calls the tender: |
|
CENTRO MILITAR DE
FARMACIA DE LA DEFENSA |
|
Objective of Tender: |
|
ADAPTACION A
NORMAS DE CORRECTA FABRICACION NCF DE ELABORADOS FARMACEUTICOS, DE UNA
MAQUINA ESTUCHADORA |
|
Date Awarded: |
|
18/11/2008 |
|
|
|
Organisation that calls the tender: |
|
CENTRO MILITAR DE
FARMACIA DE LA DEFENSA |
|
Objective of Tender: |
|
ADAPTACION A
NORMAS DE CORRECTA FABRICACION NCF DE ELABORADOS FARMACEUTICOS, DE UNA
MAQUINA ESTUCHADORA |
|
Date Awarded: |
|
18/11/2008 |
|
Cost: |
|
114.000,00 EURO. |
|
|
|
Organisation that calls the tender: |
|
CENTRO MILITAR
DE FARMACIA DE LA DEFENSA |
|
Objective of Tender: |
|
ADAPTACION A
NORMAS DE CORRECTA FABRICACION NCF DE ELABORADOS FARMACEUTICOS, DE UNA
MAQUINA ESTUCHADORA |
|
Date Awarded: |
|
18/11/2008 |
|
Cost: |
|
114.000,00 EURO. |
|
|
|
Organisation that calls the tender: |
|
CENTRO MILITAR
DE FARMACIA DE LA DEFENSA |
|
Objective of Tender: |
|
PUBLICACION DE
LA ADJUDICACION DEL SUMINISTRO DE EQUIPOS PARA NUEVA LINEA DE PRODUCCION PARA
EL CENTRO MILITAR DE FARMACIA |
|
Date Awarded: |
|
07/05/2008 |
|
Cost: |
|
149.500,00 EURO. |
|
|
|
Organisation that calls the tender: |
|
CENTRO MILITAR
DE FARMACIA DE LA DEFENSA |
|
Objective of Tender: |
|
Adquisición de
una blisteadora |
|
Date Awarded: |
|
26/10/2006 |
|
Cost: |
|
267.000,00 EURO. |
|
|
|
Organisation that calls the tender: |
|
PARQUE CENTRAL
DE RECURSOS SANITARIOS |
|
Objective of Tender: |
|
SUMINISTRO DE
MAQUINARIA DE FABRICACION |
|
Date Awarded: |
|
16/09/2002 |
|
Cost: |
|
210.354,00 EURO. |
Detail of Subsidies appearing in Balances
Memories
|
Entity |
ORGANISMO NO
ESPECIFICADO |
|
Subsidy Concept |
subvención de
explotación |
|
Status |
CONCEDIDA |
|
Amount Granted |
5.073,41 |
|
Notes |
subvención de formación
continuada para empresas |
|
Entity |
ORGANISMO NO
ESPECIFICADO |
|
Subsidy Concept |
Subvención de
explotación. |
|
Status |
CONCEDIDA |
|
Amount Granted |
5.047,85 |
|
Entity |
ORGANISMO NO
ESPECIFICADO |
|
Status |
CONCEDIDA |
|
Amount Granted |
6.819,44 |
|
Notes |
el importe
reflejado corresponde al sado inicial de 2011. |
|
Entity |
NO ESPECIFICADO |
|
Subsidy Concept |
Subvención de
explotación |
|
Project |
Formación
continuada para empresas |
|
Amount Granted |
5.348,29 |
|
Entity |
NO ESPECIFICADO |
|
Subsidy Concept |
Subvención de
explotación |
|
Amount Granted |
4.340,07 |
|
Entity |
CONSORCIO DE
PROMOCION COMARCAL DE CATALUNYA |
|
Status |
CONCEDIDA |
|
Amount Granted |
17.082,77 |
Research
Summary
|
Founded in 1.998, the company is
engaged in sale and purchase of all type of automatic machines for the
pharmaceutical, cosmetic and food industry. The net turnover of the company in
the year 2013 has decreased by 14.95 ° A) to the figure of 2012
(24,451,551.74 Euros in 2013 versus 28,750,161.01 euros in 2012). Despite
this decrease in sales profit amounted to 294,921.58 after taxes and sales.
The profitability has remained at an acceptable level. Working capital at
year-end has also significantly improved in terms of absolute respect for the
past five years. |
SOURCES
|
Registry of Commerce's
Official Gazette. Own and external data bases Company References |
FOREIGN EXCHANGE RATES
|
Currency |
Unit
|
Indian Rupees |
|
US Dollar |
1 |
Rs.62.20 |
|
|
1 |
Rs.96.00 |
|
Euro |
1 |
Rs.71.00 |
INFORMATION DETAILS
|
Analysis Done by
: |
SUB |
|
|
|
|
Report Prepared
by : |
ANK |
RATING EXPLANATIONS
|
RATING |
STATUS |
PROPOSED CREDIT LINE |
|
|
>86 |
Aaa |
Possesses an extremely sound financial base with the strongest
capability for timely payment of interest and principal sums |
Unlimited |
|
71-85 |
Aa |
Possesses adequate working capital. No caution needed for credit
transaction. It has above average (strong) capability for payment of interest
and principal sums |
Large |
|
56-70 |
A |
Financial & operational base are regarded healthy. General unfavourable
factors will not cause fatal effect. Satisfactory capability for payment of
interest and principal sums |
Fairly Large |
|
41-55 |
Ba |
Overall operation is considered normal. Capable to meet normal
commitments. |
Satisfactory |
|
26-40 |
B |
Capability to overcome financial difficulties seems comparatively
below average. |
Small |
|
11-25 |
Ca |
Adverse factors are apparent. Repayment of interest and principal sums
in default or expected to be in default upon maturity |
Limited with full
security |
|
<10 |
C |
Absolute credit risk exists. Caution needed to be exercised |
Credit not
recommended |
|
-- |
NB |
New Business |
-- |
This score serves as a reference to assess SC’s
credit risk and to set the amount of credit to be extended. It is calculated
from a composite of weighted scores obtained from each of the major sections of
this report. The assessed factors and their relative weights (as indicated
through %) are as follows:
Financial
condition (40%) Ownership
background (20%) Payment
record (10%)
Credit history
(10%) Market trend (10%) Operational size
(10%)
This report is issued at your request without any
risk and responsibility on the part of MIRA INFORM PRIVATE LIMITED (MIPL)
or its officials.