MIRA
INFORM REPORT
|
Report No. : |
308289 |
|
Report Date : |
20.02.2015 |
IDENTIFICATION DETAILS
|
Name : |
CREACIONES ARPPE SOCIEDAD ANONIMA |
|
|
|
|
Registered Office : |
Cl Islas Canarias, 45 |
|
|
|
|
Country : |
|
|
|
|
|
Financials (as on) : |
2013 |
|
|
|
|
Date of Incorporation : |
11.05.1989 |
|
|
|
|
Legal Form : |
Public Limited Company |
|
|
|
|
Line of Business : |
Engaged as manufacturers of Pet Accessories Subject product ranges includes: · Cookies Purple
line Harness
& leash ACC jeans Necklaces Snacks
Of Fruits, Mini Roll Arppe's
Deco-Comfort, The Ethnic Touch Alcohol
Free Exclusive
Nylon Arppe Kit
Harness + Leash Sporty And Car Nylon
Confi, Comfortable And Warm Comfort
Leopard Fly-Control,
Natural Repelers Arppe´S
Natural Sticks Comfort
Echo - Bamboo Of Arppe Little
Dandies Color
Muzzles Biotina´S
Shampoo By Arppe Dentifresh
By Biogance Miaou
By Arppe, Cat Collar´S Nylon
Lorien, Practical And Elegant Arppe's
Velvet New Nylon Flavoured
Dog Chew Comfort
Outdoor Biospotix
Indoor Spray Antiparasitic
Collars, Natural Formula Cottage
Dog´S House Get
Ready For The Cold, Anoraks Arppe Arppe´S
Leather & Swarovski Elements |
|
|
|
|
No of Employees : |
Not Available [NOTE: We tried to confirm
the number of employees but no one is ready to part any information from the
company management.] |
RATING & COMMENTS
|
MIRA’s Rating : |
Ca |
|
RATING |
STATUS |
PROPOSED CREDIT LINE |
|
|
11-25 |
Ca |
Adverse factors are apparent. Repayment of interest and principal sums
in default or expected to be in default upon maturity |
Limited with
full security |
|
Status : |
Moderate |
|
Payment Behaviour : |
No Complaints |
|
Litigation : |
Clear |
NOTES :
Any query related to this report can be made
on e-mail : infodept@mirainform.com
while quoting report number, name and date.
ECGC Country Risk Classification List – December 31, 2014
|
Country Name |
Previous Rating (30.09.2014) |
Current Rating (31.12.2014) |
|
Spain |
A2 |
A1 |
|
Risk Category |
ECGC
Classification |
|
Insignificant |
A1 |
|
Low |
A2 |
|
Moderate |
B1 |
|
High |
B2 |
|
Very High |
C1 |
|
Restricted |
C2 |
|
Off-credit |
D |
Spain ECONOMIC OVERVIEW
Spain experienced a prolonged
recession in the wake of the global financial crisis. GDP contracted by 3.7% in
2009, ending a 16-year growth trend, and continued contracting through most of
2013. Economic growth resumed in late 2013, albeit only modestly, as credit
contraction in the private sector, fiscal austerity, and high unemployment
continued to weigh on domestic consumption and investment. Exports, however,
have been resilient throughout the economic downturn, partially offsetting
declines in domestic consumption and helped to bring Spain's current account
into surplus in 2013 for the first time since 1986. The unemployment rate rose
from a low of about 8% in 2007 to more than 26% in 2013, straining Spain's
public finances as spending on social benefits increased while tax revenues
fell. Spain’s budget deficit peaked at 11.4% of GDP in 2009. Spain gradually
reduced the deficit to just under 7% of GDP in 2013, slightly above the 6.5%
target negotiated between Spain and the EU. Public debt has increased
substantially – from 60.1% of GDP in 2010 to 93.4% in 2013. Rising labor
productivity, moderating labor costs, and lower inflation have helped to
improve foreign investor interest in the economy and to reduce government
borrowing costs. The government's ongoing efforts to implement reforms - labor,
pension, health, tax, and education - are aimed at supporting investor
sentiment. The government also has shored up struggling banks exposed to
Spain's depressed domestic construction and real estate sectors by successfully
completing an EU-funded restructuring and recapitalization program in December
2013.
|
Source : CIA |
EXECUTIVE SUMMARY
|
Name: |
CREACIONES
ARPPE SOCIEDAD ANONIMA |
||||
|
NIF
/ Fiscal code: |
A46626099 |
||||
|
Status: |
ACTIVE |
||||
|
Incorporation
Date: |
11/05/1989 |
||||
|
Legal Form : |
Public Limited Company |
||||
|
Register
Data |
Register
Section 8 Sheet 26223 |
||||
|
Last
Publication in BORME: |
19/02/2013
[Statutory modifications] |
||||
|
Last
Published Account Deposit: |
2013 |
||||
|
Share
Capital: |
0 |
||||
|
|
|||||
|
Localization: |
CL
ISLAS CANARIAS ,45 POL IND FUENTE DEL JARRO - PATERNA - 46980 - VALENCIA |
||||
|
Telephone
- Fax - Email - Website: |
Ph.
961 323 311 Fax: 96 132 11 20 Email.
info@arppe.es Website.
www.arppe.es |
||||
|
|
|||||
|
Activity: |
|
||||
|
NACE: |
Engaged as manufacturers of Pet Accessories |
||||
|
Registered
Trademarks: |
|
||||
|
Audited
/ Opinion: |
No |
||||
|
Tenders
and Awards: |
0
for a total cost of 0 |
||||
|
Subsidies: |
1
for a total cost of 2089164.43 |
||||
|
Quality
Certificate: |
No |
||||
|
|
|||||
|
Defaults,
Legal Claims and Insolvency Proceedings : |
|||||
|
|
|
Number |
Amount
(€) |
Most
Recent Entry |
|
|
Insolvency
Proceedings, Bankruptcy and Suspension of Payments |
|
Unpublished |
--- |
--- |
|
|
Defaults
on debt with Financial Institutions and Large Companies |
|
None |
--- |
--- |
|
|
Judicial
Claims (Notices, Executive Proceedings, Attachments, Auctions, Bad Debt) |
|
1 |
0 |
--- |
|
|
Proceedings
heard by the Civil Court |
|
Unpublished |
0 |
--- |
|
|
Proceedings
heard by the Labour Court |
|
Unpublished |
0 |
--- |
|
Partners |
||
|
JUAN
GARCIA NAVARRO |
35
% |
|
|
CRISTINA
GARCIA SAHUQUILLO |
10
% |
|
|
ESTHER
GARCIA SAHUQUILLO |
10
% |
|
|
JUAN
GARCIA SAHUQUILLO |
10
% |
|
|
RIANSERAS
SAHUQUILLO MONDEJAR |
35
% |
|
|
Shares: |
0 |
|
|
Other
Links: |
0 |
|
|
No.
of Active Corporate Bodies: |
JOINT
MANAGER 2 |
|
Guarantees
|
Properties
Registered: |
Company
NO, Administrator NO |
|
Financing
/ Guarantee Sources : |
Sources
NO, Guarantees NO |
|
|
|
|
INVESTIGATION SUMMARY |
|
|
Company founded for a few years now, which provides itself of enough experience in the sector of the activity it develops, even though its billing was reduced 26.67% in 2013, in comparison with the previous year. The company meets with normality the payment obligations. |
|
Identification
|
|
|
Social
Denomination: |
CREACIONES ARPPE SOCIEDAD
ANONIMA |
|
NIF
/ Fiscal code: |
A46626099 |
|
Corporate
Status: |
ACTIVE |
|
Start
of activity: |
1989 |
|
Registered
Office: |
CL ISLAS CANARIAS ,45 POL
IND FUENTE DEL JARRO |
|
Locality: |
PATERNA |
|
Province: |
VALENCIA |
|
Postal
Code: |
46980 |
|
Telephone: |
961 323 311 |
|
Website: |
|
|
Email: |
|
Activity
|
NACE: |
3299 |
|
CNAE Obtaining Source: |
3299 |
|
Additional Information: |
The company is engaged as manufacturers
of Pet Accessories. CL ISLAS CANARIAS ,45 POL IND FUENTE DEL JARRO 46980 PATERNA (VALENCIA), registered office, factory, offices, storage, industrial unit, in rent. |
|
Import / export: |
DOES NOT IMPORT / DOES NOT EXPORT |
|
Future Perspective: |
Face recession |
|
Industry situation: |
Maturity |
|
Product details |
· Cookies Purple
line Harness
& leash ACC jeans Necklaces Snacks
Of Fruits, Mini Roll Arppe's
Deco-Comfort, The Ethnic Touch Alcohol
Free Cologne For Dogs Exclusive
Nylon Arppe Kit
Harness + Leash Sporty And Car Nylon
Confi, Comfortable And Warm Comfort
Leopard Kenya Fly-Control,
Natural Repelers Arppe´S
Natural Sticks Comfort
Echo - Bamboo Of Arppe Little
Dandies Color
Muzzles Biotina´S
Shampoo By Arppe Dentifresh
By Biogance Miaou
By Arppe, Cat Collar´S Nylon
Lorien, Practical And Elegant Arppe's
Velvet New Nylon Flavoured
Dog Chew Comfort
Outdoor Biospotix
Indoor Spray Antiparasitic
Collars, Natural Formula Cottage
Dog´S House Get
Ready For The Cold, Anoraks Arppe Arppe´S
Leather & Swarovski Elements |
Chronological
Summary
|
|||
|
|
|
|
|
|
|
Year |
Act |
|
|
|
1992 |
Accounts deposit (ejer.
1991) |
|
|
|
1993 |
Accounts deposit (ejer.
1992) Adaptation to Law (1) Appointments/ Re-elections (1) Cessations/
Resignations/ Reversals (1) |
|
|
|
1994 |
Accounts deposit (ejer.
1993) Appointments/ Re-elections (3) Cessations/ Resignations/ Reversals (2) |
|
|
|
1995 |
Accounts deposit (ejer.
1994) |
|
|
|
1996 |
Accounts deposit (ejer.
1995) |
|
|
|
1997 |
Accounts deposit (ejer.
1996) |
|
|
|
1998 |
Accounts deposit (ejer.
1997) |
|
|
|
2000 |
Accounts deposit (ejer.
1998, 1999) Appointments/ Re-elections (1) |
|
|
|
2001 |
Accounts deposit (ejer.
2000) |
|
|
|
2002 |
Accounts deposit (ejer.
2001) |
|
|
|
2003 |
Accounts deposit (ejer.
2002) |
|
|
|
2004 |
Accounts deposit (ejer.
2003) |
|
|
|
2005 |
Accounts deposit (ejer.
2004) Appointments/ Re-elections (1) |
|
|
|
2006 |
Accounts deposit (ejer.
2005) |
|
|
|
2007 |
Accounts deposit (ejer.
2006) |
|
|
|
2008 |
Accounts deposit (ejer.
2007) |
|
|
|
2009 |
Accounts deposit (ejer.
2008) |
|
|
|
2010 |
Appointments/ Re-elections
(2) Cessations/ Resignations/ Reversals (1) |
|
|
|
2011 |
Accounts deposit (ejer.
2009) |
|
|
|
2012 |
Accounts deposit (ejer.
2010, 2011) |
|
|
|
2013 |
Accounts deposit (ejer.
2012) Statutory Modifications (1) |
|
|
|
2014 |
Accounts deposit (ejer.
2013) |
|
Breakdown of
Owners' Equity
|
|
|
Registered
Capital: |
0 |
|
Paid
up capital: |
0 |
Active Social Bodies |
||||
|
|
|
|||
|
Post published |
Social Body's Name |
Appointment Date |
Other Positions in this
Company |
|
|
JOINT MANAGER |
GARCIA SAHUQUILLO JUAN |
03/12/2010 |
4 |
|
|
|
GARCIA SAHUQUILLO MARIA
CRISTINA |
03/12/2010 |
2 |
|
|
PROXY |
GARCIA SAHUQUILLO MARIA
ESTHER |
03/12/2010 |
1 |
|
|
|
GARCIA NAVARRO JUAN |
12/08/1994 |
3 |
|
|
Historical Social Bodies |
|
Social Body's Name |
Post published |
End Date |
Other Positions in this
Company |
|
GARCIA NAVARRO JUAN |
JOINT MANAGER |
29/03/1994 |
3 |
|
|
PRESIDENT |
28/04/1993 |
|
|
GARCIA SAHUQUILLO CRISTINA |
JOINT MANAGER |
28/01/2000 |
3 |
|
|
JOINT MANAGER |
28/04/2005 |
|
|
|
SECRETARY |
28/04/1993 |
|
|
GARCIA SAHUQUILLO ESTHER |
JOINT MANAGER |
01/08/1994 |
2 |
|
|
VICE CHAIRMAN |
28/04/1993 |
|
|
GARCIA SAHUQUILLO JUAN |
JOINT MANAGER |
28/01/2000 |
4 |
|
|
JOINT MANAGER |
28/04/2005 |
|
|
|
JOINT MANAGER |
30/10/2010 |
|
|
GARCIA SAHUQUILLO MARIA CRISTINA |
JOINT MANAGER |
30/10/2010 |
2 |
Executive board |
|
Post |
NIF |
Name |
|
ADMINISTRATOR |
|
JUAN GARCIA SAHUQUILLO |
|
ADMINISTRATOR |
|
MARIA CRISTINA GARCIA
SAHUQUILLO |
|
FINANCIAL DIRECTOR |
|
CRISTINA GARCIA SAHUQUILLO |
|
MANAGING DIRECTOR |
|
JUAN GARCIA SAHUQUILLO |
Defaults, Legal Claims and Insolvency Proceedings |
Section enabling assessment of the degree of compliance of the company queried with its payment obligations. It provides information on the existence and nature of all stages of Insolvency and Legal Proceedings published with reference to the Company in the country's various Official Bulletins and national newspapers, as well Defaults Registered in the main national credit bureaus (ASNEF Industrial and RAI ).
Summary
Chronological summary
|
|
|
Number
of Publications |
Amount
(_) |
Start
date |
End
date |
|
Insolvency
Proceedings, Bankruptcy and Suspension of Payments |
|
Unpublished |
--- |
--- |
--- |
|
Request/Declaration |
|
0 |
--- |
date |
|
|
Proceedings |
|
--- |
--- |
|
--- |
|
Resolution |
|
--- |
--- |
|
--- |
|
Defaults
on debt with Financial Institutions and Large Companies |
Bank and Commercial Delinquency |
None |
0 |
|
|
|
Status:
Friendly |
|
--- |
|
|
|
|
Status:
Pre-Litigation |
|
--- |
|
|
|
|
Status:
Litigation |
|
--- |
|
|
|
|
Status:
Non-performing |
|
--- |
|
|
|
|
Status:
insolvency proceedings, bankruptcy and suspension of payments |
|
--- |
|
|
|
|
Other
status |
|
--- |
|
|
|
|
Legal
and Administrative Proceedings |
|
1 |
--- |
28/10/2011 |
28/10/2011 |
|
Notices
of defaults and enforcement |
|
1 |
--- |
|
--- |
|
Seizures |
|
--- |
--- |
|
--- |
|
Auctions |
|
--- |
--- |
|
--- |
|
Declarations
of insolvency and bad debt |
|
--- |
--- |
|
--- |
|
Proceedings
heard by the Civil Court |
|
Unpublished |
--- |
|
|
|
Proceedings
heard by the Labour Court |
|
Unpublished |
--- |
|
|
Probability of default
> Estimated Probability of Default for the next 12 months:
15.923 %
> Latest Scoring Changes:
|
Sector in which comparison is carried out: 329 Manufacturing n.e.c. |
|
|
Relative Position:
|
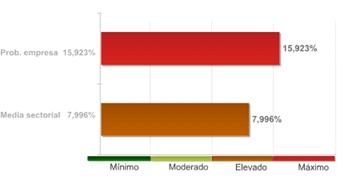
The company's comparative analysis with the rest of the companies that
comprise the sector, shows the company holds a worse position with regard to
the probability of non-compliance.
The 4.00% of the companies of the sector CREACIONES ARPPE SOCIEDAD
ANONIMA belongs to shows a lower probability of non-compliance.
The probability of the company's non-compliance with its payment
obligations within deadlines estimated by our qualifications models is 15.923%.
In the event they fail to comply with the payment, the seriousness of
the loss will depend on factors such as the promptness of the commencement of
the charging management, the existence of executive documents which match the
credit or the existence of guarantees and free debt assets under the name of
the debtor. Therefore, the probability of non-compliance should not be solely
interpreted as the total loss of the owed amount.
LEGAL CLAIMS
|
Summary of
Judicial Claims |
|
|
|
|
|
|
|
No se han publicado |
|
|
|
No se han publicado |
|
|
|
|
|
|
|
No se han publicado |
|
|
|
No se han publicado |
|
|
|
No se han publicado |
|
|
|
|
|
|
|
|
|
|
|
No se han publicado |
|
|
|
No se han publicado |
|
|
|
|
|
|
|
No se han publicado |
|
Incidences
with the Local Administration |
|
|
|
Last
Published Stage: |
SEIZURE |
|
Record
Number: |
2011EXP12003843 |
|
Amount
of the incidence: |
0,00
E |
|
Requested
by: |
ADMINISTRACION
LOCAL |
|
Published
domicile: |
(DESCONOCIDA) |
|
Source: |
B.O.P.
VALENCIA Nº263, 2011 PAGINA 532 |
Link List
|
SHAREHOLDERS : |
5 Entities |
Shareholders
|
Relationship |
Entity |
Province |
Shareholding stake |
|
SHAREHOLDERS |
JUAN GARCIA NAVARRO |
|
35 |
|
|
CRISTINA GARCIA SAHUQUILLO |
|
10 |
|
|
ESTHER GARCIA SAHUQUILLO |
|
10 |
|
|
JUAN GARCIA SAHUQUILLO |
|
10 |
|
|
RIANSERAS SAHUQUILLO
MONDEJAR |
|
35 |
Turnover
|
|
|
Total
Sales 2014 |
1.807.755,56 |
Financial Accounts and Balance Sheets |
Financial Years Presented
|
Ejercicio |
Tipo
de Cuentas Anuales |
Fecha
Presentacion |
|
2013 |
Normales |
September
2014 |
|
2012 |
Normales |
October
2013 |
|
2011 |
Normales |
October
2012 |
|
2010 |
Normales |
February
2012 |
|
2009 |
Normales |
December
2010 |
|
2008 |
Normales |
September
2009 |
|
2007 |
Normales |
August
2008 |
|
2006 |
Normales |
August
2007 |
|
2005 |
Normales |
September
2006 |
|
2004 |
Normales |
October
2005 |
|
2003 |
Normales |
August
2004 |
|
2002 |
Normales |
October
2003 |
|
2001 |
Normales |
October
2002 |
|
2000 |
Normales |
September
2001 |
|
1999 |
Normales |
October
2000 |
|
1998 |
Normales |
January
2000 |
|
1997 |
Normales |
August
1998 |
|
1996 |
Normales |
September
1997 |
|
1995 |
Normales |
August
1996 |
|
1994 |
Normales |
July
1995 |
|
1993 |
Normales |
September
1994 |
|
1992 |
Normales |
September
1993 |
|
1991 |
Normales |
October
1992 |
The data in the report regarding the last Company Accounts submitted by the company is taken from the TRADE REGISTER serving the region in which the company's address is located 31/12/2013
> Balance en formato Pyme de acuerdo al Nuevo Plan General Contable 2007
Information corresponding to the fiscal year 2013 2012 2011 2010 2009 is taken from information submitted to the TRADE REGISTER. Data corresponding to fiscal years before 2013 2012 2011 2010 2009 has been compiled based on the equivalence criteria stipulated in Act JUS/206/2009. Where the provisions of the Act did not establish relevant equivalence criteria.
|
|
ORIGINAL |
ORIGINAL |
ORIGINAL |
ORIGINAL |
ORIGINAL |
|
|
Assets |
2013 |
2012 |
2011 |
2010 |
2009 |
|
|
A)
NON-CURRENT ASSETS: 11000 |
131.294,00 |
132.908,00 |
101.808,00 |
101.659,00 |
110.673,00 |
|
|
I. Intangible fixed assets : 11100 |
0,00 |
-66.088,00 |
0,00 |
0,00 |
0,00 |
|
|
II. Tangible fixed assets : 11200 |
68.336,00 |
132.465,00 |
71.758,00 |
71.609,00 |
80.622,00 |
|
|
III. Real estate investment: 11300 |
0,00 |
0,00 |
0,00 |
0,00 |
0,00 |
|
|
IV. Long-term investments in Group companies and associates :
11400 |
30.051,00 |
30.051,00 |
30.051,00 |
30.051,00 |
30.051,00 |
|
|
V. Long-term financial investments: 11500 |
0,00 |
0,00 |
0,00 |
0,00 |
0,00 |
|
|
VI. Assets for deferred tax : 11600 |
32.907,00 |
36.481,00 |
0,00 |
0,00 |
0,00 |
|
|
VII. Non-current trade debtors : 11700 |
0,00 |
0,00 |
0,00 |
0,00 |
0,00 |
|
|
B)
CURRENT ASSETS: 12000 |
6.013.280,00 |
5.206.676,00 |
3.304.375,00 |
3.436.559,00 |
3.039.813,00 |
|
|
I. Stocks : 12200 |
1.838.465,00 |
1.836.904,00 |
1.365.801,00 |
1.227.212,00 |
1.162.127,00 |
|
|
II. Trade debtors and others receivable accounts : 12300 |
4.165.678,00 |
4.165.032,00 |
1.924.246,00 |
2.133.322,00 |
1.676.830,00 |
|
|
1. Trade debtors / accounts receivable:
12380 |
4.075.044,00 |
2.723.772,00 |
1.860.277,00 |
1.441.596,00 |
1.250.049,00 |
|
|
a) Long-term
receivables from sales and services supplied : 12381 |
0,00 |
0,00 |
0,00 |
0,00 |
0,00 |
|
|
b) Customers for
sales and provisions of services : 12382 |
4.075.044,00 |
2.723.772,00 |
1.860.277,00 |
1.441.596,00 |
1.250.049,00 |
|
|
2. Called up share capital: 12370 |
0,00 |
0,00 |
0,00 |
0,00 |
0,00 |
|
|
3. Other accounts receivable : 12390 |
90.633,00 |
1.441.260,00 |
63.968,00 |
691.726,00 |
426.780,00 |
|
|
III. Short-term investment in Group companies and associates:
12400 |
0,00 |
-888.613,00 |
0,00 |
0,00 |
0,00 |
|
|
IV. Short-term financial investments : 12500 |
0,00 |
0,00 |
0,00 |
0,00 |
0,00 |
|
|
V. Short-term accruals : 12600 |
0,00 |
0,00 |
0,00 |
0,00 |
0,00 |
|
|
VI. Cash and other equivalent liquid assets : 12700 |
9.137,00 |
93.352,00 |
14.328,00 |
76.025,00 |
200.857,00 |
|
|
TOTAL
ASSETS (A + B) : 10000 |
6.144.574,00 |
5.339.583,00 |
3.406.183,00 |
3.538.218,00 |
3.150.486,00 |
|
|
|
ORIGINAL |
ORIGINAL |
ORIGINAL |
ORIGINAL |
ORIGINAL |
|
|
Liabilities
and Net Worth |
2013 |
2012 |
2011 |
2010 |
2009 |
|
|
A)
NET WORTH: 20000 |
2.097.502,00 |
2.089.164,00 |
2.128.484,00 |
2.122.728,00 |
2.118.752,00 |
|
|
A-1)
Shareholders' equity: 21000 |
2.097.502,00 |
2.089.164,00 |
2.128.484,00 |
2.122.728,00 |
2.118.752,00 |
|
|
I. Capital: 21100 |
180.300,00 |
180.300,00 |
180.304,00 |
180.304,00 |
180.300,00 |
|
|
1. Registered capital : 21110 |
180.300,00 |
180.300,00 |
180.304,00 |
180.304,00 |
180.300,00 |
|
|
2. (Uncalled capital): 21120 |
0,00 |
0,00 |
0,00 |
0,00 |
0,00 |
|
|
II. Share premium: 21200 |
0,00 |
0,00 |
0,00 |
0,00 |
0,00 |
|
|
III. Reserves: 21300 |
1.945.591,00 |
1.945.591,00 |
1.933.452,00 |
1.936.323,00 |
1.904.522,00 |
|
|
IV. (Common stock equity): 21400 |
0,00 |
0,00 |
0,00 |
0,00 |
0,00 |
|
|
V. Profit or loss brought forward: 21500 |
-36.726,00 |
0,00 |
0,00 |
0,00 |
0,00 |
|
|
VI. Other shareholders' contributions: 21600 |
0,00 |
0,00 |
0,00 |
0,00 |
0,00 |
|
|
VII. Result of the period: 21700 |
8.338,00 |
-36.726,00 |
14.728,00 |
6.102,00 |
33.930,00 |
|
|
VIII. (Interim dividend): 21800 |
0,00 |
0,00 |
0,00 |
0,00 |
0,00 |
|
|
A-2)
Changes in net worth : 22000 |
0,00 |
0,00 |
0,00 |
0,00 |
0,00 |
|
|
A-3)
Received subsidies, donations and legacies: 23000 |
0,00 |
0,00 |
0,00 |
0,00 |
0,00 |
|
|
B)
NON-CURRENT LIABILITIES: 31000 |
117.459,00 |
122.673,00 |
5.658,00 |
5.726,00 |
35.113,00 |
|
|
I. Long-term provisions: 31100 |
0,00 |
0,00 |
5.658,00 |
5.726,00 |
35.113,00 |
|
|
II. Long-term creditors : 31200 |
120.176,00 |
125.391,00 |
0,00 |
0,00 |
0,00 |
|
|
1. Amounts owed to credit institutions:
31220 |
0,00 |
0,00 |
0,00 |
0,00 |
0,00 |
|
|
2. Creditors from financial leasing :
31230 |
443,00 |
5.658,00 |
0,00 |
0,00 |
0,00 |
|
|
3. Other long-term creditors : 31290 |
119.733,00 |
119.733,00 |
0,00 |
0,00 |
0,00 |
|
|
III. Long-term debts with Group companies and associates:
31300 |
0,00 |
0,00 |
0,00 |
0,00 |
0,00 |
|
|
IV. Liabilities for deferred tax: 31400 |
-2.717,00 |
-2.717,00 |
0,00 |
0,00 |
0,00 |
|
|
V. Long-term accruals: 31500 |
0,00 |
0,00 |
0,00 |
0,00 |
0,00 |
|
|
VI. Non-current trade creditors : 31600 |
0,00 |
0,00 |
0,00 |
0,00 |
0,00 |
|
|
VII. Special long-term debts : 31700 |
0,00 |
0,00 |
0,00 |
0,00 |
0,00 |
|
|
C)
CURRENT LIABILITIES : 32000 |
3.929.613,00 |
3.127.745,00 |
1.272.042,00 |
1.409.765,00 |
996.620,00 |
|
|
I. Short-term provisions: 32200 |
0,00 |
0,00 |
0,00 |
0,00 |
0,00 |
|
|
II. Short-term creditors : 32300 |
1.573.461,00 |
28.419,00 |
681.445,00 |
586.113,00 |
378.705,00 |
|
|
1. Amounts owed to credit institutions:
32320 |
0,00 |
0,00 |
0,00 |
0,00 |
0,00 |
|
|
2. Creditors from financial leasing :
32330 |
0,00 |
7,00 |
0,00 |
0,00 |
0,00 |
|
|
3. Other short-term creditors :
32390 |
1.573.461,00 |
28.413,00 |
681.445,00 |
586.113,00 |
378.705,00 |
|
|
III. Short-term amounts owed to group and associated companies:
32400 |
0,00 |
0,00 |
0,00 |
0,00 |
0,00 |
|
|
IV. Trade creditors and other accounts payable: 32500 |
2.356.152,00 |
3.099.326,00 |
590.596,00 |
823.652,00 |
617.916,00 |
|
|
1. Suppliers: 32580 |
2.305.640,00 |
1.737.838,00 |
188.846,00 |
125.540,00 |
150.495,00 |
|
|
a) Long-term debts :
32581 |
0,00 |
0,00 |
0,00 |
0,00 |
0,00 |
|
|
b) Short-term debts :
32582 |
2.305.640,00 |
1.737.838,00 |
188.846,00 |
125.540,00 |
150.495,00 |
|
|
2. Other creditors: 32590 |
50.512,00 |
1.361.488,00 |
401.750,00 |
698.113,00 |
467.421,00 |
|
|
V. Short-term accruals : 32600 |
0,00 |
0,00 |
0,00 |
0,00 |
0,00 |
|
|
VI. Special short-term debts : 32700 |
0,00 |
0,00 |
0,00 |
0,00 |
0,00 |
|
|
TOTAL
NET WORTH AND LIABILITIES (A + B + C) : 30000 |
6.144.574,00 |
5.339.583,00 |
3.406.183,00 |
3.538.218,00 |
3.150.486,00 |
|
|
|
ORIGINAL |
ORIGINAL |
ORIGINAL |
ORIGINAL |
ORIGINAL |
|
|
Profit
and Loss |
2013 |
2012 |
2011 |
2010 |
2009 |
|
|
1. Net turnover: 40100 |
1.807.756,00 |
2.465.126,00 |
2.286.830,00 |
2.400.689,00 |
2.350.362,00 |
|
|
2. Changes in stocks of finished goods and work in progress:
40200 |
1.561,00 |
0,00 |
138.488,00 |
65.085,00 |
149.896,00 |
|
|
3. Works carried out by the company for its assets: 40300 |
0,00 |
0,00 |
0,00 |
0,00 |
0,00 |
|
|
4. Supplies : 40400 |
-1.125.417,00 |
-1.290.888,00 |
-1.037.948,00 |
-1.160.657,00 |
-1.049.958,00 |
|
|
5. Other operating income: 40500 |
663.246,00 |
40,00 |
47,00 |
27,00 |
18,00 |
|
|
6. Personnel costs: 40600 |
-908.973,00 |
-770.021,00 |
-761.116,00 |
-745.209,00 |
-776.584,00 |
|
|
7. Other operating costs: 40700 |
-408.912,00 |
-441.317,00 |
-687.627,00 |
-533.216,00 |
-578.648,00 |
|
|
8. Amortisation of fixed assets: 40800 |
0,00 |
-6.974,00 |
-11.014,00 |
-10.307,00 |
-27.737,00 |
|
|
9. Allocation of subsidies of non-financial fixed assets and
other: 40900 |
0,00 |
0,00 |
0,00 |
0,00 |
0,00 |
|
|
10. Excess provisions : 41000 |
0,00 |
0,00 |
115.418,00 |
0,00 |
-5.277,00 |
|
|
11. Impairment and result of transfers of fixed assets:
41100 |
-356,00 |
1.179,00 |
-15.345,00 |
0,00 |
-6.598,00 |
|
|
12. Other results : 41300 |
0,00 |
0,00 |
0,00 |
0,00 |
0,00 |
|
|
A)
OPERATING INCOME (1 + 2 + 3 + 4 + 5 + 6 + 7 + 8 + 9 + 10 + 11 + 12) :
49100 |
28.905,00 |
-42.856,00 |
27.732,00 |
16.411,00 |
55.473,00 |
|
|
13. Financial income : 41400 |
14,00 |
116,00 |
2.466,00 |
6.110,00 |
5.616,00 |
|
|
a) Allocation of financial subsidies,
donations and legacies: 41430 |
0,00 |
0,00 |
0,00 |
0,00 |
0,00 |
|
|
b) Other financial income: 41490 |
14,00 |
116,00 |
2.466,00 |
6.110,00 |
5.616,00 |
|
|
14. Financial expenditure : 41500 |
-17.008,00 |
-11.321,00 |
-9.158,00 |
-16.531,00 |
-16.466,00 |
|
|
15. Changes in fair value of financial instruments :
41600 |
0,00 |
0,00 |
0,00 |
0,00 |
0,00 |
|
|
16. Exchange rate differences: 41700 |
0,00 |
-96,00 |
0,00 |
0,00 |
0,00 |
|
|
17. Impairment and result for transfers of financial
instruments : 41800 |
0,00 |
0,00 |
0,00 |
2.027,00 |
0,00 |
|
|
18. Other financial income and expenditure: 42100 |
0,00 |
0,00 |
0,00 |
0,00 |
0,00 |
|
|
a) Incorporation of financial expenditure
to assets: 42110 |
0,00 |
0,00 |
0,00 |
0,00 |
0,00 |
|
|
b) Financial income from arrangement with
creditors: 42120 |
0,00 |
0,00 |
0,00 |
0,00 |
0,00 |
|
|
c) Other income and expenditure:
42130 |
0,00 |
0,00 |
0,00 |
0,00 |
0,00 |
|
|
B)
FINANCIAL REVENUE ( 13 + 14 + 15 + 16 + 17 +18 ) : 49200 |
-16.994,00 |
-11.300,00 |
-6.692,00 |
-8.394,00 |
-10.850,00 |
|
|
C)
NET RESULT BEFORE TAXES ( A + B ) : 49300 |
11.911,00 |
-54.156,00 |
21.041,00 |
8.017,00 |
44.623,00 |
|
|
19. Income taxes : 41900 |
-3.573,00 |
17.430,00 |
-6.312,00 |
-1.915,00 |
-10.693,00 |
|
|
D)
RESULT OF THE PERIOD ( C + 19 ) : 49500 |
8.338,00 |
-36.726,00 |
14.728,00 |
6.102,00 |
33.930,00 |
|
>
Normal Balance Sheet under the rules of the 1990 General Accounting Plan
(repealed since 1st January of 2008)
Information
corresponding to the fiscal year
2013 2012 2011 2010 2009 has been compiled based on
the equivalence criteria stipulated in Act JUS/206/2009. Where the provisions
of the Act did not establish relevant equivalence criteria.
|
|
EQUIVALENCIA |
EQUIVALENCIA |
EQUIVALENCIA |
EQUIVALENCIA |
EQUIVALENCIA |
|
|
ASSETS |
2013 |
2012 |
2011 |
2010 |
2009 |
|
|
A)
SHAREHOLDERS (PARTNERS) BY UNCALLED SUSCRIBED CAPITAL: |
0,00 |
0,00 |
0,00 |
0,00 |
0,00 |
|
|
B)
FIXED ASSETS: |
98.386,00 |
96.427,00 |
101.808,00 |
101.659,00 |
110.673,00 |
|
|
I. Formation expenses: |
0,00 |
0,00 |
0,00 |
0,00 |
0,00 |
|
|
II. Intangible fixed assets: |
0,00 |
-66.088,00 |
0,00 |
0,00 |
0,00 |
|
|
III. Tangible fixed assets: |
68.336,00 |
132.465,00 |
71.758,00 |
71.609,00 |
80.622,00 |
|
|
IV. Financial investments: |
30.051,00 |
30.051,00 |
30.051,00 |
30.051,00 |
30.051,00 |
|
|
V. Own shares: |
0,00 |
0,00 |
0,00 |
0,00 |
0,00 |
|
|
VI. Long-term trade receivables: |
0,00 |
0,00 |
0,00 |
0,00 |
0,00 |
|
|
C)
Deferred expenses: |
0,00 |
0,00 |
0,00 |
0,00 |
0,00 |
|
|
D)
CURRENT ASSETS: |
6.046.187,00 |
5.243.156,00 |
3.304.375,00 |
3.436.559,00 |
3.039.813,00 |
|
|
I. Called-up share capital (not paid): |
0,00 |
0,00 |
0,00 |
0,00 |
0,00 |
|
|
II. Stocks: |
1.838.465,00 |
1.836.904,00 |
1.365.801,00 |
1.227.212,00 |
1.162.127,00 |
|
|
III. Debtors: |
4.198.585,00 |
4.201.513,00 |
1.924.246,00 |
2.133.322,00 |
1.676.830,00 |
|
|
IV. Short-term investments: |
0,00 |
-888.613,00 |
0,00 |
0,00 |
0,00 |
|
|
V. Short-term treasury shares: |
0,00 |
0,00 |
0,00 |
0,00 |
0,00 |
|
|
VI. Cash at bank and in hand: |
9.137,00 |
93.352,00 |
14.328,00 |
76.025,00 |
200.857,00 |
|
|
VII. Prepayments and accrued income: |
0,00 |
0,00 |
0,00 |
0,00 |
0,00 |
|
|
GENERAL
TOTAL (A + B + C + D): |
6.144.574,00 |
5.339.583,00 |
3.406.183,00 |
3.538.218,00 |
3.150.486,00 |
|
MERCANTILE
REGISTRY.
|
|
EQUIVALENCIA |
EQUIVALENCIA |
EQUIVALENCIA |
EQUIVALENCIA |
EQUIVALENCIA |
|
|
LIABILITIES |
2013 |
2012 |
2011 |
2010 |
2009 |
|
|
A)
EQUITY: |
2.097.502,00 |
2.089.164,00 |
2.128.484,00 |
2.122.728,00 |
2.118.752,00 |
|
|
I. Subscribed capital: |
180.300,00 |
180.300,00 |
180.304,00 |
180.304,00 |
180.300,00 |
|
|
II. Share premium: |
0,00 |
0,00 |
0,00 |
0,00 |
0,00 |
|
|
III. Revaluation reserves: |
0,00 |
0,00 |
0,00 |
0,00 |
0,00 |
|
|
IV. Reserves: |
1.945.591,00 |
1.945.591,00 |
1.933.452,00 |
1.936.323,00 |
1.904.522,00 |
|
|
a) Differences for capital adjustment to
euros: |
4,00 |
4,00 |
4,00 |
4,00 |
4,00 |
|
|
b) Remaining Reserves: |
1.945.587,00 |
1.945.587,00 |
1.933.448,00 |
1.936.319,00 |
1.904.518,00 |
|
|
V. Profit or loss brought forward: |
-36.726,00 |
0,00 |
0,00 |
0,00 |
0,00 |
|
|
VI. Profit or loss for the financial year: |
8.338,00 |
-36.726,00 |
14.728,00 |
6.102,00 |
33.930,00 |
|
|
VII. Interim dividend paid: |
0,00 |
0,00 |
0,00 |
0,00 |
0,00 |
|
|
VIII. Own shares for capital reduction: |
0,00 |
0,00 |
0,00 |
0,00 |
0,00 |
|
|
B)
Deferred income: |
0,00 |
0,00 |
0,00 |
0,00 |
0,00 |
|
|
C)
PROVISIONS FOR LIABILITIES AND CHARGES: |
0,00 |
0,00 |
5.658,00 |
5.726,00 |
35.113,00 |
|
|
D)
LONG TERM LIABILITIES: |
117.459,00 |
122.673,00 |
0,00 |
0,00 |
0,00 |
|
|
E)
SHORT TERM CREDITORS: |
3.929.613,00 |
3.127.745,00 |
1.272.042,00 |
1.409.765,00 |
996.620,00 |
|
|
F)
SHORT-TERM PROVISIONS FOR LIABILITIES AND CHARGES: |
0,00 |
0,00 |
0,00 |
0,00 |
0,00 |
|
|
GENERAL
TOTAL (A + B + C + D + E + F): |
6.144.574,00 |
5.339.583,00 |
3.406.183,00 |
3.538.218,00 |
3.150.486,00 |
|
MERCANTILE
REGISTRY.
|
|
EQUIVALENCIA |
EQUIVALENCIA |
EQUIVALENCIA |
EQUIVALENCIA |
EQUIVALENCIA |
|
|
DEBIT |
2013 |
2012 |
2011 |
2010 |
2009 |
|
|
A)
CHARGES (A.1 to A.15): |
2.462.678,00 |
2.503.187,00 |
2.390.033,00 |
2.402.750,00 |
2.316.789,00 |
|
|
A.1. Operating consumption: |
1.123.855,00 |
1.290.888,00 |
899.460,00 |
1.095.572,00 |
900.062,00 |
|
|
A.2. Staff Costs: |
908.973,00 |
770.021,00 |
761.116,00 |
745.209,00 |
776.584,00 |
|
|
a) Wages, salaries et
al.: |
681.312,00 |
577.162,00 |
570.488,00 |
558.565,00 |
582.082,00 |
|
|
b) Social security
costs: |
227.661,00 |
192.859,00 |
190.629,00 |
186.645,00 |
194.503,00 |
|
|
A.3. Depreciation expense: |
0,00 |
6.974,00 |
11.014,00 |
10.307,00 |
27.737,00 |
|
|
A.4. Variation of trade provisions and
losses of unrecovered receivables: |
0,00 |
0,00 |
0,00 |
0,00 |
0,00 |
|
|
A.5. Other operating charges: |
408.912,00 |
441.317,00 |
687.627,00 |
533.216,00 |
578.648,00 |
|
|
A.I. OPERATING BENEFITS (B.1-A.1-A.2-A.3-A.4-A.5): |
29.261,00 |
0,00 |
43.077,00 |
16.411,00 |
62.072,00 |
|
|
A.6. Financial and similar charges: |
17.008,00 |
11.321,00 |
9.158,00 |
16.531,00 |
16.466,00 |
|
|
a) Due to liabilities
with companies of the group: |
0,00 |
0,00 |
0,00 |
0,00 |
0,00 |
|
|
b) Due to liabilities
with associated companies: |
0,00 |
0,00 |
0,00 |
0,00 |
0,00 |
|
|
c) Due to other
debts: |
17.008,00 |
11.321,00 |
9.158,00 |
16.531,00 |
16.466,00 |
|
|
d) Losses from
financial investments: |
0,00 |
0,00 |
0,00 |
0,00 |
0,00 |
|
|
A.7. Financial investment provision
change: |
0,00 |
0,00 |
0,00 |
0,00 |
0,00 |
|
|
A.8. Exchange losses: |
0,00 |
96,00 |
0,00 |
0,00 |
0,00 |
|
|
A.II. POSITIVE FINANCIAL RESULTS (B.2+B.3-A.6-A.7-A.8): |
0,00 |
0,00 |
0,00 |
0,00 |
0,00 |
|
|
A.III. PROFIT FROM ORDINARY ACTIVITIES (A.I+A.II-B.I-B.II):
|
12.267,00 |
0,00 |
36.386,00 |
8.017,00 |
51.221,00 |
|
|
A.9. Changes in provisions for intangible,
tangible and securities portfolio: |
0,00 |
0,00 |
0,00 |
0,00 |
0,00 |
|
|
A.10. Losses from tangible and intangible
fixed assets and portfolio: |
356,00 |
0,00 |
15.345,00 |
0,00 |
6.598,00 |
|
|
A.11. Losses from transactions with own
shares and debentures: |
0,00 |
0,00 |
0,00 |
0,00 |
0,00 |
|
|
A.12. Extraordinary expenses: |
0,00 |
0,00 |
0,00 |
0,00 |
0,00 |
|
|
A.13. Prior year expenses and losses:
|
0,00 |
0,00 |
0,00 |
0,00 |
0,00 |
|
|
A.IV. EXTRAORDINARY PROFIT
(B.4+B.5+B.6+B.7+B.8-A.9-A.10-A.11-A.12-A.13): |
0,00 |
1.179,00 |
0,00 |
0,00 |
0,00 |
|
|
A.V. PROFIT BEFORE TAXES (A.III+A.IV-B.III-B.IV): |
11.911,00 |
0,00 |
21.041,00 |
8.017,00 |
44.623,00 |
|
|
A.14. Corporation Tax: |
3.573,00 |
-17.430,00 |
6.312,00 |
1.915,00 |
10.693,00 |
|
|
A.15. Miscellaneous taxes: |
0,00 |
0,00 |
0,00 |
0,00 |
0,00 |
|
|
A.VI. FINANCIAL YEAR RESULT (PROFIT) (A.V-A.14-A.15): |
8.338,00 |
0,00 |
14.728,00 |
6.102,00 |
33.930,00 |
|
MERCANTILE
REGISTRY.
|
|
EQUIVALENCIA |
EQUIVALENCIA |
EQUIVALENCIA |
EQUIVALENCIA |
EQUIVALENCIA |
|
|
CREDIT |
2013 |
2012 |
2011 |
2010 |
2009 |
|
|
B)
INCOME ( B.1 to B.8): |
2.471.016,00 |
2.466.461,00 |
2.404.761,00 |
2.408.852,00 |
2.350.719,00 |
|
|
B.1. Operating income: |
2.471.002,00 |
2.465.166,00 |
2.402.295,00 |
2.400.716,00 |
2.345.103,00 |
|
|
a) Net total sales:
|
1.807.756,00 |
2.465.126,00 |
2.286.830,00 |
2.400.689,00 |
2.350.362,00 |
|
|
b) Miscellaneous
operating income: |
663.246,00 |
40,00 |
115.465,00 |
27,00 |
-5.259,00 |
|
|
B.I. PÉRDIDAS DE EXPLOTACIÓN (A.1+A.2+A.3+A.4+A.5-B.1 ): |
0,00 |
44.035,00 |
0,00 |
0,00 |
0,00 |
|
|
B.2. Financial income: |
14,00 |
116,00 |
2.466,00 |
8.136,00 |
5.616,00 |
|
|
a) Companies of the
group: |
0,00 |
0,00 |
0,00 |
0,00 |
0,00 |
|
|
b) In associated
companies: |
0,00 |
0,00 |
0,00 |
0,00 |
0,00 |
|
|
c) Miscellaneous:
|
14,00 |
116,00 |
2.466,00 |
6.110,00 |
5.616,00 |
|
|
d) Profit on
financial investment: |
0,00 |
0,00 |
0,00 |
2.027,00 |
0,00 |
|
|
B.3. Exchange gains: |
0,00 |
0,00 |
0,00 |
0,00 |
0,00 |
|
|
B.II. NEGATIVE FINANCIAL RESULTS (A.6+A.7+A.8-B.2-B.3): |
16.994,00 |
11.300,00 |
6.692,00 |
8.394,00 |
10.850,00 |
|
|
B.III. LOSSES ON ORDINARY ACTIVITIES ( B.I + B.II - A.I - A.II
): |
0,00 |
55.335,00 |
0,00 |
0,00 |
0,00 |
|
|
B.4. Profit on disposal of both tangible
and intangible fixed assets and securities portfolio: |
0,00 |
1.179,00 |
0,00 |
0,00 |
0,00 |
|
|
B.5. Profit on transactions with own
shares and debentures: |
0,00 |
0,00 |
0,00 |
0,00 |
0,00 |
|
|
B.6. Capital grants transferred to profit
and loss: |
0,00 |
0,00 |
0,00 |
0,00 |
0,00 |
|
|
B.7. Extraordinary income: |
0,00 |
0,00 |
0,00 |
0,00 |
0,00 |
|
|
B.8. Income and profit of former financial
years: |
0,00 |
0,00 |
0,00 |
0,00 |
0,00 |
|
|
B.IV. NEGATIVE EXTRAORDINARY RESULTS
(A.9+A.10+A.11+A.12+A.13-B.4-B.5-B.6-B.7-B.8): |
356,00 |
0,00 |
15.345,00 |
0,00 |
6.598,00 |
|
|
B.V. LOSSES BEFORE TAXES (B.III+B.IV-A.III-A.IV): |
0,00 |
54.156,00 |
0,00 |
0,00 |
0,00 |
|
|
B.VI. FINANCIAL YEAR RESULTS (LOSSES) (B.V+A.14+A.15): |
0,00 |
36.726,00 |
0,00 |
0,00 |
0,00 |
|
MERCANTILE
REGISTRY.
CASHFLOW STATEMENT
Model: Normal
>
Source of information: Data contained in this section is taken from the
information declared in the Annual Accounts submitted to the Trade Register.
|
|
2013 |
2012 |
2011 |
2010 |
2009 |
|
|
1.
Fiscal year result before taxes.: 61100 |
11.911,00 |
-54.156,00 |
21.041,00 |
8.017,00 |
44.623,00 |
|
|
2.
Results adjustments.: 61200 |
16.994,00 |
12.521,00 |
17.638,00 |
-8.660,00 |
73.700,00 |
|
|
a) Fixed Assets Amortization (+).: 61201 |
0,00 |
6.974,00 |
11.014,00 |
10.307,00 |
27.737,00 |
|
|
c) Variation in Provision (+/-). : 61203 |
0,00 |
-5.658,00 |
-68,00 |
-29.388,00 |
35.113,00 |
|
|
g) Financial income (-).: 61207 |
-14,00 |
-116,00 |
-2.466,00 |
-6.110,00 |
-5.616,00 |
|
|
h) Financial Expenses (+). : 61208 |
17.008,00 |
11.321,00 |
9.158,00 |
16.531,00 |
16.466,00 |
|
|
3. Changes in current capital
equity.: 61300 |
-1.637.567,00 |
702.883,00 |
-168.881,00 |
-317.756,00 |
-101.456,00 |
|
|
a) Stock (+/-).: 61301 |
-1.561,00 |
-471.103,00 |
-138.589,00 |
-65.085,00 |
-144.619,00 |
|
|
d) Debtors and other accounts receivable (+/-). : 61302 |
-645,00 |
-2.240.787,00 |
209.076,00 |
-456.492,00 |
-173.274,00 |
|
|
c) Other current assets (+/-). : 61303 |
-888.613,00 |
888.613,00 |
0,00 |
0,00 |
0,00 |
|
|
d) Creditors and other accounts payable (+/-). : 61304 |
-746.747,00 |
2.526.159,00 |
-239.368,00 |
203.821,00 |
216.437,00 |
|
|
4.
Other cash flows for operating activities.: 61400 |
-16.994,00 |
-11.205,00 |
-6.692,00 |
-10.421,00 |
-10.850,00 |
|
|
a) Interest payments (-). : 61401 |
-17.008,00 |
-11.321,00 |
-9.158,00 |
-16.531,00 |
-16.466,00 |
|
|
c) Interest collection (+). : 61403 |
14,00 |
116,00 |
2.466,00 |
6.110,00 |
5.616,00 |
|
|
5.
Operating activity cash flows (1 + 2 + 3 + 4) : 61500 |
-1.625.656,00 |
650.043,00 |
-136.894,00 |
-328.820,00 |
6.017,00 |
|
|
6.
Payments for investment (-).: 62100 |
-66.088,00 |
-97.188,00 |
-149,00 |
0,00 |
-44.453,00 |
|
|
a) Companies of the group and affiliates. : 62101 |
0,00 |
0,00 |
0,00 |
0,00 |
-30.051,00 |
|
|
b) Intangible fixed assets. : 62102 |
-66.088,00 |
0,00 |
0,00 |
0,00 |
0,00 |
|
|
c) Fixed assets. : 62103 |
0,00 |
-60.707,00 |
-149,00 |
0,00 |
-14.402,00 |
|
|
h) Other assets. : 62108 |
0,00 |
-36.481,00 |
0,00 |
0,00 |
0,00 |
|
|
7.
Divestment payment collection (+). : 62200 |
67.702,00 |
66.088,00 |
0,00 |
9.013,00 |
0,00 |
|
|
b) Intangible fixed assets. : 62202 |
0,00 |
66.088,00 |
0,00 |
0,00 |
0,00 |
|
|
c) Fixed assets. : 62203 |
64.129,00 |
0,00 |
0,00 |
9.013,00 |
0,00 |
|
|
h) Other assets. : 62208 |
3.573,00 |
0,00 |
0,00 |
0,00 |
0,00 |
|
|
8.
Investment activity cash flows (6 + 7) minus Amortization: 62300 |
1.614,00 |
-38.073,00 |
-11.163,00 |
-1.294,00 |
-72.189,00 |
|
|
9.
Payment collection and payments for equity instruments. : 63100 |
0,00 |
-2.593,00 |
-8.973,00 |
-2.126,00 |
-8.588,00 |
|
|
b) Amortization of assets instruments (-). : 63102 |
0,00 |
-2.593,00 |
-8.973,00 |
-2.126,00 |
-8.588,00 |
|
|
10.
Payment collection and payments for financial liabilities instruments.:
63200 |
1.539.827,00 |
-530.352,00 |
95.332,00 |
207.408,00 |
126.088,00 |
|
|
a) Issuance : 63201 |
1.545.048,00 |
125.397,00 |
95.332,00 |
207.408,00 |
126.088,00 |
|
|
4. Special characteristic debts (+). : 63205 |
0,00 |
5.664,00 |
0,00 |
0,00 |
0,00 |
|
|
5. Other debts (+). : 63206 |
1.545.048,00 |
119.733,00 |
95.332,00 |
207.408,00 |
126.088,00 |
|
|
b) Repayment and amortization of : 63207 |
-5.221,00 |
-655.750,00 |
0,00 |
0,00 |
0,00 |
|
|
4. Special characteristic debts (-). : 63211 |
-5.221,00 |
0,00 |
0,00 |
0,00 |
0,00 |
|
|
5. Other debts (-). : 63212 |
0,00 |
-655.750,00 |
0,00 |
0,00 |
0,00 |
|
|
11.
Payments from dividends and remunerations from other assets instruments. :
63300 |
0,00 |
0,00 |
0,00 |
0,00 |
0,00 |
|
|
12.
Cash flows for financing activities (9+10+11).: 63400 |
1.539.827,00 |
-532.945,00 |
86.360,00 |
205.283,00 |
117.500,00 |
|
|
D)
EFFECT OF EXCHANGE RATE CHANGES: 64000 |
0,00 |
0,00 |
0,00 |
0,00 |
0,00 |
|
|
E)
NET INCREASE/DECREASE OF CASH OR EQUIVALENT ASSETS (+/-5+/-8+/12+/-D) : 65000 |
-84.215,00 |
79.024,00 |
-61.697,00 |
-124.831,00 |
51.328,00 |
|
|
Cash or equivalent assets as of beginning of the fiscal year.:
65100 |
93.352,00 |
14.328,00 |
76.025,00 |
200.857,00 |
149.529,00 |
|
|
Cash or equivalent assets as of end of the fiscal year.:
65200 |
9.137,00 |
93.352,00 |
14.328,00 |
76.025,00 |
200.857,00 |
|
FINANCIAL DIAGNOSIS
>
Economic-Financial Comparative Analysis
Data used in the following ratios and indicators is taken from the
Annual Accounts submitted by the company to the TRADE REGISTER.
>
Comparison within the Sector
|
Cash
Flow |
2013 |
2012 |
Variación
2013 - 2012 |
|
|||
|
|
Empresa |
Sector |
Empresa |
Sector |
Empresa |
Sector |
|
|
Cash
Flow over Sales: |
-0,05
% |
0,01
% |
0,03
% |
0,00
% |
-245,32
% |
|
|
|
EBITDA
over Sales: |
1,62
% |
4,39
% |
-1,50
% |
2,62
% |
207,67
% |
67,31
% |
|
|
Cash
Flow Yield: |
-0,01
% |
0,00
% |
0,01
% |
0,00
% |
-192,61
% |
|
|
|
Profitability |
2013 |
2012 |
Variación
2013 - 2012 |
|
|||
|
|
Empresa |
Sector |
Empresa |
Sector |
Empresa |
Sector |
|
|
Operating
economic profitability: |
0,47
% |
1,65
% |
-0,69
% |
0,95
% |
168,37
% |
72,81
% |
|
|
Total
economic profitability: |
0,47
% |
1,50
% |
-0,80
% |
1,35
% |
158,67
% |
10,79
% |
|
|
Financial
profitability: |
0,40
% |
0,05
% |
-1,76
% |
-0,34
% |
122,61
% |
115,94
% |
|
|
Margin:
|
1,17
% |
1,71
% |
-1,74
% |
1,06
% |
167,29
% |
60,84
% |
|
|
Mark-up:
|
0,48
% |
0,24
% |
-2,20
% |
-0,22
% |
121,94
% |
204,93
% |
|
|
Solvency |
2013 |
2012 |
Variación
2013 - 2012 |
|
|||
|
|
Empresa |
Sector |
Empresa |
Sector |
Empresa |
Sector |
|
|
Liquidity:
|
0,00 |
0,26 |
0,03 |
0,23 |
-92,21 |
10,76 |
|
|
Acid
Test: |
1,06 |
1,10 |
1,08 |
1,07 |
-1,39 |
2,47 |
|
|
Working
Capital / Investment: |
0,34 |
0,21 |
0,39 |
0,21 |
-12,90 |
-3,82 |
|
|
Solvency:
|
1,54 |
1,76 |
1,68 |
1,79 |
-8,22 |
-2,16 |
|
|
Indebtedness |
2013 |
2012 |
Variación
2013 - 2012 |
|
|||
|
|
Empresa |
Sector |
Empresa |
Sector |
Empresa |
Sector |
|
|
Indebtedness
level: |
1,93 |
1,03 |
1,56 |
1,08 |
24,01 |
-4,41 |
|
|
Borrowing
Composition: |
0,03 |
0,73 |
0,04 |
0,80 |
-23,79 |
-8,29 |
|
|
Repayment
Ability: |
-48,06 |
103,97 |
41,13 |
-1.451,83 |
-216,83 |
107,16 |
|
|
Warranty:
|
1,52 |
1,98 |
1,64 |
1,93 |
-7,58 |
2,20 |
|
|
Generated
resources / Total creditors: |
0,00 |
0,06 |
-0,01 |
0,04 |
122,51 |
25,42 |
|
|
Efficiency |
2013 |
2012 |
Variación
2013 - 2012 |
|
|||
|
|
Empresa |
Sector |
Empresa |
Sector |
Empresa |
Sector |
|
|
Productivity:
|
1,03 |
1,20 |
0,95 |
1,11 |
8,44 |
8,39 |
|
|
Turnover
of Collection Rights : |
0,59 |
4,36 |
0,59 |
4,25 |
0,22 |
2,73 |
|
|
Turnover
of Payment Entitlements: |
0,65 |
2,92 |
0,56 |
2,76 |
16,63 |
6,00 |
|
|
Stock
rotation: |
1,33 |
4,21 |
1,37 |
3,66 |
-2,77 |
14,90 |
|
|
Assets
turnover: |
0,40 |
0,96 |
0,40 |
0,90 |
1,61 |
7,44 |
|
|
Borrowing
Cost: |
0,42 |
2,14 |
0,35 |
2,43 |
20,67 |
-11,83 |
|
>
Trend of indicators under the General Accounting Plan of 2007 (2013, 2012,
2011, 2010, 2009)
|
Cash
Flow |
2013 |
2012 |
2011 |
2010 |
2009 |
|
|
Cash
Flow over Sales: |
-0,05
% |
0,03
% |
-0,03
% |
-0,05
% |
2,18
% |
|
|
EBITDA
over Sales: |
1,62
% |
-1,50
% |
-2,68
% |
1,11
% |
4,05
% |
|
|
Cash
Flow Yield: |
-0,01
% |
0,01
% |
-0,02
% |
-0,04
% |
1,63
% |
|
|
Profitability |
2013 |
2012 |
2011 |
2010 |
2009 |
|
|
Operating
economic profitability: |
0,47
% |
-0,69
% |
0,82
% |
0,47
% |
1,78
% |
|
|
Total
economic profitability: |
0,47
% |
-0,80
% |
0,89
% |
0,69
% |
1,94
% |
|
|
Financial
profitability: |
0,40
% |
-1,76
% |
0,69
% |
0,29
% |
1,60
% |
|
|
Margin:
|
1,17
% |
-1,74
% |
1,21
% |
0,68
% |
2,36
% |
|
|
Mark-up:
|
0,48
% |
-2,20
% |
0,92
% |
0,33
% |
1,90
% |
|
|
Solvency |
2013 |
2012 |
2011 |
2010 |
2009 |
|
|
Liquidity:
|
0,00 |
0,03 |
0,01 |
0,05 |
0,20 |
|
|
Acid
Test: |
1,06 |
1,08 |
1,52 |
1,57 |
1,88 |
|
|
Working
Capital / Investment: |
0,34 |
0,39 |
0,60 |
0,57 |
0,65 |
|
|
Solvency:
|
1,54 |
1,68 |
2,60 |
2,44 |
3,05 |
|
|
Indebtedness |
2013 |
2012 |
2011 |
2010 |
2009 |
|
|
Indebtedness
level: |
1,93 |
1,56 |
0,60 |
0,66 |
0,46 |
|
|
Borrowing
Composition: |
0,03 |
0,04 |
0,00 |
0,00 |
0,00 |
|
|
Repayment
Ability: |
-48,06 |
41,13 |
-20,62 |
-11,29 |
8,42 |
|
|
Warranty:
|
1,52 |
1,64 |
2,68 |
2,51 |
3,16 |
|
|
Generated
resources / Total creditors: |
0,00 |
-0,01 |
0,02 |
0,01 |
0,06 |
|
|
Efficiency |
2013 |
2012 |
2011 |
2010 |
2009 |
|
|
Productivity:
|
1,03 |
0,95 |
0,92 |
1,04 |
1,12 |
|
|
Turnover
of Collection Rights : |
0,59 |
0,59 |
1,19 |
1,13 |
1,40 |
|
|
Turnover
of Payment Entitlements: |
0,65 |
0,56 |
3,16 |
2,14 |
2,88 |
|
|
Stock
rotation: |
1,33 |
1,37 |
1,73 |
1,94 |
1,96 |
|
|
Assets
turnover: |
0,40 |
0,40 |
0,68 |
0,68 |
0,75 |
|
|
Borrowing
Cost: |
0,42 |
0,35 |
0,72 |
1,17 |
1,65 |
|
COMPARATIVE SECTORIAL BALANCE
Sector-based Comparison under the rules of the New General Accounting
Plan.
|
Variación
- |
|
|
Empresa |
Sector |
|
Variación
- |
|
|
Empresa |
Sector |
|
Variación
- |
|
|
Empresa |
Sector |
Detail of Subsidies appearing in Balances Memories
|
Entity |
ORGANISMO
NO ESPECIFICADO |
|
Status |
CONCEDIDA |
|
Amount
Granted |
2.089.164,43 |
|
Notes |
Saldo
pendiente de imputación al cierre del ejercicio. |
Research Summary
|
|
Company founded for a few years now, which provides itself of enough experience in the sector of the activity it develops, even though its billing was reduced 26.67% in 2013, in comparison with the previous year. The company meets with normality the payment obligations. |
Sources
|
|
Registry
of Commerce's Official Gazette. Own and external data bases Company
References |
FOREIGN EXCHANGE RATES
|
Currency |
Unit
|
Indian Rupees |
|
US Dollar |
1 |
Rs.62.25 |
|
UK Pound |
1 |
Rs.95.57 |
|
Euro |
1 |
Rs.71.01 |
INFORMATION DETAILS
|
Analysis Done by
: |
SUB |
|
|
|
|
Report Prepared
by : |
MNL |
RATING EXPLANATIONS
|
RATING |
STATUS |
PROPOSED CREDIT LINE |
|
|
>86 |
Aaa |
Possesses an extremely sound financial base with the strongest
capability for timely payment of interest and principal sums |
Unlimited |
|
71-85 |
Aa |
Possesses adequate working capital. No caution needed for credit
transaction. It has above average (strong) capability for payment of interest
and principal sums |
Large |
|
56-70 |
A |
Financial & operational base are regarded healthy. General unfavourable
factors will not cause fatal effect. Satisfactory capability for payment of
interest and principal sums |
Fairly Large |
|
41-55 |
Ba |
Overall operation is considered normal. Capable to meet normal
commitments. |
Satisfactory |
|
26-40 |
B |
Capability to overcome financial difficulties seems comparatively
below average. |
Small |
|
11-25 |
Ca |
Adverse factors are apparent. Repayment of interest and principal sums
in default or expected to be in default upon maturity |
Limited with full
security |
|
<10 |
C |
Absolute credit risk exists. Caution needed to be exercised |
Credit not
recommended |
|
-- |
NB |
New Business |
-- |
This score serves as a reference to assess SC’s credit risk
and to set the amount of credit to be extended. It is calculated from a
composite of weighted scores obtained from each of the major sections of this
report. The assessed factors and their relative weights (as indicated through
%) are as follows:
Financial
condition (40%) Ownership
background (20%) Payment
record (10%)
Credit history
(10%) Market trend
(10%) Operational
size (10%)
This report is issued at your request without any
risk and responsibility on the part of MIRA INFORM PRIVATE LIMITED (MIPL) or
its officials.