MIRA INFORM REPORT
|
Report No. : |
309307 |
|
Report Date : |
25.02.2015 |
IDENTIFICATION DETAILS
|
Name : |
PIC CO JSC |
|
|
|
|
Registered Office : |
Kv. Kazichane, Severna Promishlena Zona, Ul. Industrialna 3 1532 Sofia |
|
|
|
|
Country : |
Bulgaria |
|
|
|
|
Financials (as on) : |
31.12.2013 |
|
|
|
|
Date of Incorporation : |
1992 |
|
|
|
|
Legal Form : |
Joint Stock Company (AD) |
|
|
|
|
Line of Business : |
Wholesale trade of materials for sweet
food industry. |
|
|
|
|
No. of Employee : |
188 |
RATING & COMMENTS
|
MIRA’s Rating : |
Ba |
|
RATING |
STATUS |
PROPOSED CREDIT LINE |
|
|
41-55 |
Ba |
Overall operation is considered normal. Capable to meet normal
commitments. |
Satisfactory |
|
Status : |
Satisfactory |
|
|
|
|
Payment Behaviour : |
No complaints |
|
|
|
|
Litigation : |
Clear |
NOTES :
Any query related to this report can be made
on e-mail : infodept@mirainform.com
while quoting report number, name and date.
ECGC Country Risk Classification List – December 31, 2014
|
Country Name |
Previous Rating (30.09.2014) |
Current Rating (31.12.2014) |
|
Bulgaria |
A2 |
A2 |
|
Risk Category |
ECGC
Classification |
|
Insignificant |
A1 |
|
Low |
A2 |
|
Moderate |
B1 |
|
High |
B2 |
|
Very High |
C1 |
|
Restricted |
C2 |
|
Off-credit |
D |
BULGARIA ECONOMIC OVERVIEW
Bulgaria, a former Communist country that entered the EU on 1 January 2007, averaged more than 6% annual growth from 2004 to 2008, driven by significant amounts of bank lending, consumption, and foreign direct investment. Successive governments have demonstrated a commitment to economic reforms and responsible fiscal planning, but the global downturn sharply reduced domestic demand, exports, capital inflows, and industrial production. GDP contracted by 5.5% in 2009, and has been slow to recover in the years since. Despite having a favorable investment regime, including low, flat corporate income taxes, significant challenges remain. Corruption in public administration, a weak judiciary, and the presence of organized crime continue to hamper the country's investment climate and economic prospects.
|
Source
: CIA |
COMPANY DETAILS
Local name: PIK-KO AD
International name: PIC CO JSC
Registered address:
KV. KAZICHANE,
SEVERNA PROMISHLENA ZONA, UL. INDUSTRIALNA 3
1532 SOFIA
Bulgaria
Telephone: +359 2 999 5031, +359 2 999 50 33, +359 2 999 50 36
Fax: + 359 2 999 9514
E-Mail: picco@pic-co.com
Internet: http://www.pic-co.com
Company
summary
ESTABLISHMENT & REGISTRATION:
Established: 1992
Registered at Sofia Town Court
Court number 18215/1992
Bulstat/VAT number: 121157625
Status of the company:
Active
HISTORY:
Previous
registered address ul. Bountovnik No. 35 is no longer valid.
LEGAL FORM:
Joint Stock
Company (AD)
REGISTERED CAPITAL:
BGN 5 000 000.00
BANKERS:
ALFABANK
SHAREHOLDERS/MANAGEMENT
SHAREHOLDERS:
|
IMPALA INVEST B.V. (Netherlands) |
99,999% |
|
DIMITRIOS VINDZILEOS (Greece) |
0,001% |
|
ID 1114603 |
|
MANAGEMENT:
IVETA SEVERINOVA
BALIEVA - Representative
HRISTO PETROV
MURTAZOV - Board of directors
IVETA SEVERINOVA
BALIEVA - Board of directors
|
IVA YORDANOVOVA |
- Bord of directors |
RELATED COMPANIES:
Ultimate owner of
the company is DIMITRIOS VINDZILEOS (Greece)
Through other
companies, Mr. Vindzileos is considered to be the biggest owner in food sector
with consolidated sales exceeding EUR 300 million. Major companies are Bella
Bulgaria, BELLA - 97, KARINA 2000, UNIBEL, UNISNAKS, HVOYNA-PERSENK, OLITRADE,
DIL-TUR PLOVDIV, RAUCH-SCHPECK, IDEA BULGARIA, SACHI, SVINEVADNO STOPANSTVO
MANOLE, PERELIK 1998, BELLA ALATINI, MURGASH, FERMATA, FRESH EXPRESS, FRESH
LOGISTICS etc.
BUSINESS ACTIVITY
BUSINESS OPERATION:
NACE 1.1: 51.90
Other wholesale
Activity:
Wholesale trade of
materials for sweet food industry.
Warehouses in
Sofia, Ruse, Pazardjik, Stara Zagora, Burgas, Shumen, Plovdiv, Gorna Oriahovitza,
Varna and Blagoevgrad.
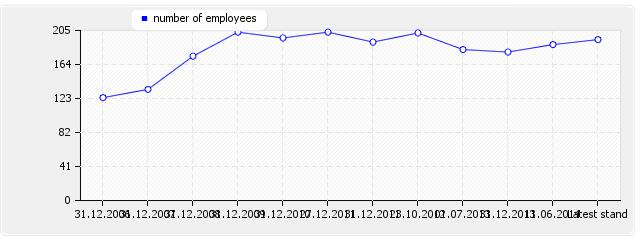
NUMBER
OF EMPLOYEES
|
As at date |
Value |
|
31.12.2006 |
124 |
|
31.12.2007 |
134 |
|
31.12.2008 |
174 |
|
31.12.2009 |
203 |
|
31.12.2010 |
196 |
|
27.12.2011 |
203 |
|
31.12.2011 |
191 |
|
23.10.2012 |
202 |
|
01.07.2013 |
182 |
|
31.12.2013 |
179 |
|
11.06.2014 |
188 |
|
Latest stand |
194 |
EXPORT
None
IMPORT
Albania, MK, YU,
RO, Ukraine, Denmark, Turkey, Japan, USA, India, China
REAL
ESTATE
Own premises.
FINANCIAL DATA
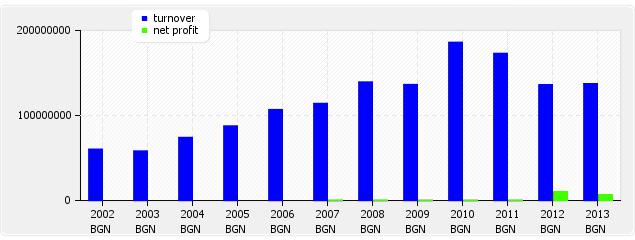
TURNOVER:
|
Year |
Currency |
Value |
|
2002 |
BGN |
60 324 000.00 |
|
2003 |
BGN |
58 165 000.00 |
|
2004 |
BGN |
74 157 000.00 |
|
2005 |
BGN |
87 637 000.00 |
|
2006 |
BGN |
106 930 000.00 |
|
2007 |
BGN |
114 159 000.00 |
|
2008 |
BGN |
139 363 000.00 |
|
2009 |
BGN |
136 376 000.00 |
|
2010 |
BGN |
186 106 000.00 |
|
2011 |
BGN |
173 068 000.00 |
|
2012 |
BGN |
135 984 000.00 |
|
2013 |
BGN |
137 363 000.00 |
MODES OF PAYMENT:
Payments are made
within agreed terms.
DEBT COLLECTION:
No debt collection
cases are registered against the company.
BANK DISTRAINTS:
No shares of the company
are under bank distraint.
UNPAID TAXES/ CONTRIBUTIONS TO GOVERNMENT:
There is no
publication about overdue unpaid taxes.
INVOLVEMENT IN LEGAL DISPUTES:
There is no
publication about legal claims or disputes against the company.
OTHER PAYMENT INFORMATION:
No adverse payment
information is available.
BRANCH INDICATOR:
The company's
payment behaviour is average for the branch.
Exchange rate
since 1998 is 1 BGN (denominated lev) = 0.51 EUR
Financial
statement
|
RATIO |
2010 |
2011 |
2012 |
2013 |
|
Accounting
period: |
1.1.2010 - |
1.1.2011 - |
1.1.2012 - |
1.1.2013 - |
|
Debt ratio |
0.80 |
0.71 |
0.59 |
0.51 |
|
Quick ratio |
0.75 |
1.24 |
1.62 |
1.12 |
|
Current ratio |
0.92 |
1.56 |
2.26 |
1.79 |
|
Days purchase in payables |
164.27 |
120.21 |
97.91 |
121.57 |
|
Operating margin in % |
4.25 |
8.09 |
8.64 |
5.46 |
|
Cash ratio (acid ratio) |
0.00 |
0.02 |
0.02 |
0.08 |
|
Return on sales ROS in % |
3.82 |
7.27 |
7.78 |
4.89 |
|
Return on assets ROA in % |
6.68 |
10.81 |
9.72 |
7.07 |
|
Return on equity ROE in % |
33.03 |
37.69 |
24.00 |
14.33 |
|
Days supply in inventory |
28.52 |
39.19 |
62.74 |
82.34 |
|
Days sales in receivables |
122.63 |
146.72 |
157.28 |
126.06 |
|
BALANCE SHEET in
BGN'000 |
2010 |
2011 |
2012 |
2013 |
|
Accounting
period: |
1.1.2010 - |
1.1.2011 - |
1.1.2012 - |
1.1.2013 - |
|
A.UNPAID CAPITAL |
||||
|
B. FIXED ASSETS |
||||
|
I Fixed Intangible
Assets: |
||||
|
R&D Products |
||||
|
Concessions, patents, trade-marks etc |
38 |
24 |
||
|
Goodwill |
||||
|
Intangible fixed assets under construction |
||||
|
thereof advances |
||||
|
Total I: |
53 |
70 |
38 |
24 |
|
II Fixed Tangible
Assets |
||||
|
Land and Buildings |
9458 |
9165 |
||
|
thereof Land |
4122 |
4093 |
||
|
thereof Buildings |
5336 |
5072 |
||
|
Machines, Vehicles |
904 |
659 |
||
|
Equipment |
2124 |
1464 |
||
|
Tangible fixed assets under construction |
371 |
377 |
||
|
thereof advances |
||||
|
Total II |
14259 |
13421 |
12857 |
11665 |
|
III. Fixed
Financial Assets |
||||
|
Shares in group companies |
589 |
104 |
||
|
Loans granted to group companies |
||||
|
Shares in joint ventures |
50 |
50 |
||
|
Long term investments |
||||
|
Other loans |
11092 |
10 |
||
|
Bought back own shares |
||||
|
Total III |
13872 |
12590 |
11731 |
164 |
|
IV. Deferred
Taxes |
0 |
0 |
||
|
B. FIXED ASSETS
TOTAL |
28184 |
26081 |
24626 |
11853 |
|
C. CURRENT
ASSETS |
||||
|
I. Inventories |
||||
|
Raw Materials |
||||
|
Work in progress |
||||
|
thereof young animals |
||||
|
Trading goods |
23269 |
31205 |
||
|
thereof production |
62 |
247 |
||
|
thereof goods for sale |
23207 |
30958 |
||
|
Advances |
||||
|
Total I |
14744 |
18840 |
23269 |
31205 |
|
II. Receivables |
||||
|
Receivables from customers |
57205 |
46907 |
||
|
thereof more than 1 year |
||||
|
Receivables from group companies |
||||
|
thereof more than 1 year |
||||
|
Receivables from joint ventures |
||||
|
thereof more than 1 year |
||||
|
Other receivables |
1131 |
864 |
||
|
thereof more than 1 year |
||||
|
Total II |
63396 |
70536 |
58336 |
47771 |
|
III. Current
Financial Assets |
||||
|
Current investments in related companies |
||||
|
Bought back own shares |
||||
|
Other current financial assets |
||||
|
Total III |
0 |
0 |
||
|
IV. Cash
equivalents |
||||
|
Cash and accounts in the country |
577 |
3642 |
||
|
thereof cash |
153 |
2415 |
||
|
Thereof cash in foreign currency
(equivalent) |
||||
|
thereof current accounts |
424 |
1227 |
||
|
thereof blocked accounts |
||||
|
thereof cash equivalents |
||||
|
Cash and accounts abroad |
||||
|
thereof cash |
||||
|
Thereof cash in foreign currency
(equivalent) |
||||
|
thereof current accounts |
||||
|
thereof blocked accounts |
||||
|
Total IV |
191 |
1035 |
577 |
3642 |
|
C. CURRENT
ASSETS TOTAL |
78331 |
90411 |
82182 |
82618 |
|
D. Deferred
expenses |
0 |
0 |
32 |
1 |
|
TOTAL ASSETS |
106515 |
116492 |
106840 |
94472 |
|
A. OWNERS EQUITY
|
||||
|
I. Share capital
|
5000 |
5000 |
5000 |
5000 |
|
II. Issue
premium |
||||
|
III. Revaluation
reserves |
||||
|
thereof revaluation reserves of financial instruments |
||||
|
IV. Reserves |
||||
|
legal reserves |
||||
|
reserve related to bought back own shares |
||||
|
reserve from company foundation |
||||
|
other reserves |
500 |
500 |
||
|
Total IV |
312 |
500 |
500 |
500 |
|
V. Result from previous
period |
||||
|
Undistributed profit |
27372 |
34404 |
||
|
Uncovered loss |
||||
|
Total V |
9112 |
15316 |
27372 |
34404 |
|
VI. Current
result profit (loss) |
7115 |
12589 |
10382 |
6676 |
|
A. OWNERS EQUITY
TOTAL |
21539 |
33405 |
43254 |
46580 |
|
B. PROVISIONS |
||||
|
Provisions for pensions |
||||
|
Provisions for taxes |
||||
|
thereof deferred taxes |
||||
|
Other provisions |
||||
|
B. PROVISIONS
TOTAL |
||||
|
C. LIABILITIES |
||||
|
Bond-backed loans |
||||
|
less than 1 year |
||||
|
more than 1 year |
||||
|
Bank loans |
11307 |
10630 |
||
|
less than 1 year |
11158 |
10577 |
||
|
more than 1 year |
149 |
53 |
||
|
Advances received |
110 |
|||
|
less than 1 year |
110 |
|||
|
more than 1 year |
||||
|
Payables to suppliers |
46171 |
31177 |
||
|
less than 1 year |
21291 |
29505 |
||
|
more than 1 year |
24880 |
1672 |
||
|
Liabilities on policies |
||||
|
less than 1 year |
||||
|
more than 1 year |
||||
|
Liabilities to group companies |
||||
|
less than 1 year |
||||
|
more than 1 year |
||||
|
Liabilities to joint-venture companies |
||||
|
less than 1 year |
||||
|
more than 1 year |
||||
|
Other liabilities |
5802 |
5987 |
||
|
less than 1 year |
3754 |
5987 |
||
|
more than 1 year |
2048 |
|||
|
thereof to personnel |
229 |
183 |
||
|
less than 1 year |
229 |
183 |
||
|
more than 1 year |
||||
|
thereof to social insurance |
65 |
105 |
||
|
less than 1 year |
65 |
105 |
||
|
more than 1 year |
||||
|
thereof for taxes |
2595 |
1839 |
||
|
less than 1 year |
2595 |
1839 |
||
|
more than 1 year |
||||
|
C. LIABILITIES
TOTAL |
84976 |
83087 |
63390 |
47794 |
|
less than 1 year |
84923 |
57789 |
36313 |
46069 |
|
more than 1 year |
53 |
25298 |
27077 |
1725 |
|
D. FINANCING AND
DEFERRED INCOME |
196 |
98 |
||
|
thereof |
||||
|
Financing |
||||
|
Deferred income |
196 |
98 |
||
|
TOTAL EQUITY AND
LIABILITIES |
106515 |
116492 |
106840 |
94472 |
|
P & L
ACCOUNT in BGN'000 |
2010 |
2011 |
2012 |
2013 |
|
Accounting
period: |
1.1.2010 - |
1.1.2011 - |
1.1.2012 - |
1.1.2013 - |
|
A. EXPENSES |
||||
|
I. OPERATION
EXPENSES |
||||
|
Decrease of inventories |
3233 |
|||
|
thereof for materials |
9904 |
5400 |
||
|
thereof for services |
5010 |
4780 |
||
|
Personnel expenses |
4000 |
3034 |
||
|
thereof wages |
3507 |
2658 |
||
|
thereof social insurance |
493 |
376 |
||
|
thereof pensions |
||||
|
Depreciation |
1500 |
1319 |
||
|
thereof Depreciation of fixed assets |
1500 |
1319 |
||
|
Other expenses |
100961 |
114539 |
||
|
thereof Book value of sold assets (without
production) |
100408 |
114239 |
||
|
I. OPERATION
EXPENSES TOTAL |
177182 |
158169 |
124608 |
129072 |
|
II. Financial
expenditures |
||||
|
Depreciation of financial assets |
1432 |
888 |
||
|
thereof exchange rate losses |
1432 |
888 |
||
|
Paid interest |
1120 |
1646 |
||
|
thereof interest to group companies |
||||
|
Thereof expenditures for securities
operations |
||||
|
II. Financial
expenditures Total |
1629 |
1806 |
2552 |
2534 |
|
B. Profit on
ordinary activity |
7914 |
14000 |
11539 |
7449 |
|
III.
Extraordinary expenses |
0 |
0 |
||
|
thereof expenses on disasters and
emergency expenses |
||||
|
C. Total
expenses (I+II+III) |
178811 |
159975 |
127160 |
131606 |
|
D. Accounting
profit |
7914 |
14000 |
11539 |
7449 |
|
IV. Taxation on
profit |
799 |
1411 |
1157 |
773 |
|
V. Other taxes |
||||
|
E. Net profit |
7115 |
12589 |
10382 |
6676 |
|
Total expenses |
186725 |
173975 |
138699 |
139055 |
|
A. REVENUES |
||||
|
I . OPERATING
REVENUES |
||||
|
Net sales |
186106 |
173068 |
133523 |
136425 |
|
Production |
16668 |
7269 |
||
|
Goods |
112596 |
128198 |
||
|
Services |
4259 |
958 |
||
|
Increase of production and work in
progress |
184 |
|||
|
Expenses on acquisition of assets |
||||
|
Other revenues |
2428 |
754 |
||
|
thereof financing |
||||
|
I. TOTAL
OPERATING REVENUES |
186106 |
173068 |
135951 |
137363 |
|
II FINANCIAL
REVENUES |
||||
|
Income from shares |
||||
|
thereof income from shares in group
companies |
||||
|
Income from investments and loans |
||||
|
thereof from investments in group
companies |
||||
|
Income from interest |
2748 |
1692 |
||
|
thereof from interest from group companies |
||||
|
II FINANCIAL
REVENUES TOTAL |
619 |
907 |
2748 |
1692 |
|
TOTAL REVENUES
FROM ORDINARY ACTIVITIES |
186725 |
173975 |
138699 |
139055 |
|
LOSS |
||||
|
Extraordinary revenues |
0 |
0 |
||
|
AFTER TAX LOSS |
0 |
0 |
||
|
TOTAL REVENUES |
186725 |
173975 |
138699 |
139055 |
FOREIGN EXCHANGE RATES
|
Currency |
Unit
|
Indian Rupees |
|
US Dollar |
1 |
Rs.62.27 |
|
|
1 |
Rs.96.21 |
|
Euro |
1 |
Rs.70.60 |
INFORMATION DETAILS
|
Analysis Done by
: |
DIV |
|
|
|
|
Report Prepared
by : |
ANK |
RATING EXPLANATIONS
|
RATING |
STATUS |
PROPOSED CREDIT LINE |
|
|
>86 |
Aaa |
Possesses an extremely sound financial base with the strongest capability
for timely payment of interest and principal sums |
Unlimited |
|
71-85 |
Aa |
Possesses adequate working capital. No caution needed for credit
transaction. It has above average (strong) capability for payment of interest
and principal sums |
Large |
|
56-70 |
A |
Financial & operational base are regarded healthy. General
unfavourable factors will not cause fatal effect. Satisfactory capability for
payment of interest and principal sums |
Fairly Large |
|
41-55 |
Ba |
Overall operation is considered normal. Capable to meet normal
commitments. |
Satisfactory |
|
26-40 |
B |
Capability to overcome financial difficulties seems comparatively
below average. |
Small |
|
11-25 |
Ca |
Adverse factors are apparent. Repayment of interest and principal sums
in default or expected to be in default upon maturity |
Limited with
full security |
|
<10 |
C |
Absolute credit risk exists. Caution needed to be exercised |
Credit not
recommended |
|
-- |
NB |
New Business |
-- |
This score serves as a reference to assess
SC’s credit risk and to set the amount of credit to be extended. It is calculated
from a composite of weighted scores obtained from each of the major sections of
this report. The assessed factors and their relative weights (as indicated
through %) are as follows:
Financial
condition (40%) Ownership
background (20%) Payment record
(10%)
Credit history
(10%) Market trend (10%) Operational size
(10%)
This report is issued at your request without any
risk and responsibility on the part of MIRA INFORM PRIVATE LIMITED (MIPL)
or its officials.