MIRA INFORM REPORT
|
Report No. : |
309908 |
|
Report Date : |
28.02.2015 |
IDENTIFICATION DETAILS
|
Name : |
CEAT LIMITED |
|
|
|
|
Registered
Office : |
463, Dr. Annie Besant Road, Worli, Mumbai – 400030, Maharashtra |
|
|
|
|
Country : |
India |
|
|
|
|
Financials (as
on) : |
31.03.2014 |
|
|
|
|
Date of
Incorporation : |
10.03.1958 |
|
|
|
|
Com. Reg. No.: |
11-011041 |
|
|
|
|
Capital Investment
/ Paid-up Capital : |
Rs.359.557 Million |
|
|
|
|
CIN No.: [Company Identification
No.] |
L25100MH1958PLC011041 |
|
|
|
|
TAN No.: [Tax Deduction &
Collection Account No.] |
Not Available |
|
|
|
|
PAN No.: [Permanent Account No.] |
Not Available |
|
|
|
|
Legal Form : |
A Public Limited Liability Company. The Company’s Shares are Listed on
the Stock Exchanges. |
|
|
|
|
Line of Business
: |
Manufacturer and Exporter of Automotive Tyres, Tubes and Flaps. |
|
|
|
|
No. of Employees
: |
More than 1000 (Approximately) |
RATING & COMMENTS
|
MIRA’s Rating : |
A (64) |
|
RATING |
STATUS |
PROPOSED CREDIT LINE |
|
|
56-70 |
A |
Financial & operational base are regarded healthy. General unfavourable
factors will not cause fatal effect. Satisfactory capability for payment of
interest and principal sums |
Fairly Large |
|
Status : |
Good |
|
|
|
|
Payment Behaviour : |
Regular |
|
|
|
|
Litigation : |
Exist |
|
|
|
|
Comments : |
Subject is a
well-established and reputed company having fine track record. The rating
reflects company’s established market position in tyres segment supported by
healthy financial risk profile, adequate liquidity position and fair
profitability levels of the company. Trade relations
are reported as fair. Business is active. Payment terms are reported to be
regular and as per commitment. The company can
be considered good for normal business dealings at usual trade terms and
conditions. |
NOTES :
Any query related to this report can be made
on e-mail : infodept@mirainform.com
while quoting report number, name and date.
EXTERNAL AGENCY RATING
|
Rating Agency Name |
CARE |
|
Rating |
Long Term Bank Facility=A+ |
|
Rating Explanation |
Adequate degree of safety and low credit
risk. |
|
Date |
23.01.2015 |
|
Rating Agency Name |
CARE |
|
Rating |
Short Term Bank Facility=A1+ |
|
Rating Explanation |
Strong degree of safety and lowest credit
risk. |
|
Date |
23.01.2015 |
RBI DEFAULTERS’ LIST STATUS
Subject’s name is not enlisted as a defaulter
in the publicly available RBI Defaulters’ list.
EPF (Employee Provident Fund) DEFAULTERS’ LIST STATUS
Subject’s name is not enlisted as a defaulter
in the publicly available EPF (Employee Provident Fund) Defaulters’ list as of
31-03-2014.
INFORMATION PARTED BY
|
Name : |
Ms. Namrata |
|
Designation : |
Manager – Treasury |
|
Contact No.: |
91-22-24930621 |
|
Date : |
26.02.2015 |
LOCATIONS
|
Registered Office : |
463, |
|
Tel. No.: |
91-22-24930621 /
24616054 / 25640461 / 25660461 / 63 / 66670200 / 61073500 |
|
Fax No.: |
91-22-24606039 / 25640301
/ 25663964 / 66670299 / 24975798 |
|
E-Mail : |
|
|
Website : |
|
|
Area : |
10000 sq. ft. |
|
Location : |
Owned |
|
|
|
|
Factory 1 : |
Village Road, Bhandup, Mumbai – 400 078, |
|
|
|
|
Factory 2 : |
82, MIDC Industrial Estate, Satpur, |
|
|
|
|
Factory 3 : |
Village Gate Muvala, Halol, Panchmahal - 389350, Gujarat |
|
|
|
|
Regional
Offices: |
Located At: ·
·
· Jalandhar ·
· Rohtak ·
· Varansi ·
· Jaipur ·
·
New ·
|
|
|
|
|
Sales Office : |
Located At: · Chhattisgarh · Madhya Pradesh · Bihar · Delhi · Uttar Pradesh · Karnataka · Andhra Pradesh · Maharashtra · Goa · Gujarat |
DIRECTORS
As on 31.03.2014
|
Name : |
Mr. H. V. Goenka |
|
Designation : |
Chairman |
|
|
|
|
Name : |
Mr. Anant Vardhan Goenka |
|
Designation : |
Managing Director |
|
|
|
|
Name : |
Mr. Arnab Banerjee |
|
Designation : |
Executive Director – Operations |
|
|
|
|
Name : |
Mr. Vinay Bansal |
|
Designation : |
Director |
|
|
|
|
Name : |
Mr. A. C. Choksey |
|
Designation : |
Director |
|
|
|
|
Name : |
Mr. Paras K. Chowdhary |
|
Designation : |
Director |
|
|
|
|
Name : |
Mr. S. Doreswamy |
|
Designation : |
Director |
|
|
|
|
Name : |
Mr. Mahesh S. Gupta |
|
Designation : |
Director |
|
|
|
|
Name : |
Mr. Haigreve Khaitan |
|
Designation : |
Director |
|
|
|
|
Name : |
Mr. Bansi S. Mehta |
|
Designation : |
Director |
|
|
|
|
Name : |
Mr. Hari L. Mundra |
|
Designation : |
Director |
|
|
|
|
Name : |
Mr. K. R. Podar |
|
Designation : |
Director |
|
|
|
|
Name : |
Mr. Punita Lal |
|
Designation : |
Director |
KEY EXECUTIVES
|
Name : |
Mr. H. N. Singh Rajpoot |
|
Designation : |
Company Secretary |
|
Address : |
463, |
|
|
|
|
Audit Committee : |
Mr. Hari L. Mundra - Chairman Mr. S. Doreswamy Mr. Mahesh S. Gupta |
|
Name : |
Ms. Namrata |
|
Designation : |
Manager – Treasury |
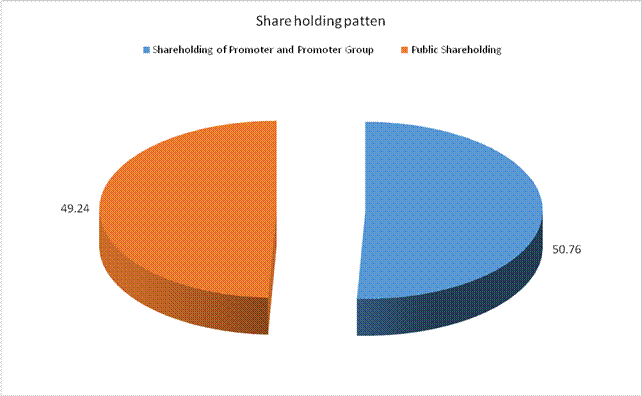
MAJOR SHAREHOLDERS / SHAREHOLDING PATTERN
As on 31.12.2014
|
Category of Shareholder |
Total No. of Shares |
Total Shareholding as a % of Total No. of Shares |
|
|
||
|
(A) Shareholding of Promoter
and Promoter Group |
||
|
|
|
|
|
|
148118 |
0.37 |
|
|
18603272 |
45.99 |
|
|
18751390 |
46.36 |
|
|
|
|
|
|
1782348 |
4.41 |
|
|
1782348 |
4.41 |
|
Total shareholding of
Promoter and Promoter Group (A) |
20533738 |
50.76 |
|
(B) Public Shareholding |
||
|
|
|
|
|
|
1600680 |
3.96 |
|
|
18914 |
0.05 |
|
|
9700 |
0.02 |
|
|
860986 |
2.13 |
|
|
10036897 |
24.81 |
|
|
12527177 |
30.97 |
|
|
|
|
|
|
1711816 |
4.23 |
|
|
|
|
|
|
4468482 |
11.05 |
|
|
1036035 |
2.56 |
|
|
172844 |
0.43 |
|
|
8343 |
0.02 |
|
|
3000 |
0.01 |
|
|
37 |
0.00 |
|
|
140029 |
0.35 |
|
|
21435 |
0.05 |
|
|
7389177 |
18.27 |
|
Total Public shareholding
(B) |
19916354 |
49.24 |
|
Total (A)+(B) |
40450092 |
100.00 |
|
(C) Shares held by Custodians
and against which Depository Receipts have been issued |
|
|
|
|
0 |
0.00 |
|
|
0 |
0.00 |
|
|
0 |
0.00 |
|
Total (A)+(B)+(C) |
40450092 |
100.00 |
Shareholding of
securities (including shares, warrants, convertible securities) of persons
belonging to the category Promoter and Promoter Group
|
No. |
Name of the Shareholder |
Details of Shares held |
Total shares (including underlying shares
assuming full conversion of warrants and convertible securities) as a % of
diluted share capital |
|
|
No. of Shares held |
As a % of grand total (A)+(B)+(C) |
|||
|
1 |
Anant Vardhan Goenka |
14,185 |
0.04 |
0.04 |
|
2 |
Chattarpati Investments
Limited |
2,75,876 |
0.68 |
0.68 |
|
3 |
Harsh Vardhan Goenka |
3,799 |
0.01 |
0.01 |
|
4 |
Harsh Vardhan Goenka |
10,133 |
0.03 |
0.03 |
|
5 |
Harsh Vardhan Goenka |
1 |
0.00 |
0.00 |
|
6 |
Harsh Vardhan Goenka |
1,20,000 |
0.30 |
0.30 |
|
7 |
Instant Holdings Limited |
25,28,602 |
6.25 |
6.25 |
|
8 |
Instant Holdings Limited |
48,26,467 |
11.93 |
11.93 |
|
9 |
Instant Holdings Limited |
41,55,743 |
10.27 |
10.27 |
|
10 |
Societe Ceat D Investissementen
Asie S A |
17,82,348 |
4.41 |
4.41 |
|
11 |
STEL Holdings Limited |
13,72,835 |
3.39 |
3.39 |
|
12 |
Summit Securities Limited |
9,59,125 |
2.37 |
2.37 |
|
13 |
SWALLOW Associates LLP |
59,524 |
0.15 |
0.15 |
|
14 |
SWALLOW Associates LLP |
44,25,100 |
10.94 |
10.94 |
|
|
Total |
2,05,33,738 |
50.76 |
50.76 |
Shareholding of
securities (including shares, warrants, convertible securities) of persons
belonging to the category Public and holding more than 1% of the total number
of shares
|
No. |
Name of the Shareholder |
No. of Shares held |
Shares as % of Total No. of Shares |
Total shares (including underlying shares
assuming full conversion of warrants and convertible securities) as a % of
diluted share capital |
|
|
1 |
Kotak Mahindra
(International) Limited |
1905273 |
4.71 |
4.71 |
|
|
2 |
Morgan Stanley Asia
(Singapore) Limited |
1163621 |
2.88 |
2.88 |
|
|
3 |
The New India Assurance
Company Limited |
415873 |
1.03 |
1.03 |
|
|
4 |
TIAA -CREF Institutional Mutual
Funds-International Equity |
2160298 |
5.34 |
5.34 |
|
|
5 |
UTI-MID Cap Fund |
605606 |
1.50 |
1.50 |
|
|
|
Total |
6250671 |
15.45 |
15.45 |
Shareholding of
securities (including shares, warrants, convertible securities) of persons (together
with PAC) belonging to the category “Public” and holding more than 5% of the
total number of shares of the company
|
No. |
Name(s) of the shareholder(s) and the Persons
Acting in Concert (PAC) with them |
No. of Shares |
Shares as % of Total No. of Shares |
Total shares (including underlying shares
assuming full conversion of warrants and convertible securities) as a % of
diluted share capital |
|
|
1 |
TIAA -CREF Institutional
Mutual Funds-International Equity |
2160298 |
5.34 |
5.34 |
|
|
|
Total |
2160298 |
5.34 |
5.34 |
BUSINESS DETAILS
|
Line of Business : |
Manufacturer and Exporter of Automotive Tyres, Tubes and Flaps. |
||||||||
|
|
|
||||||||
|
Products : |
|
||||||||
|
|
|
||||||||
|
Brand Names : |
CEAT, CEAT SECURA, CEAT ENDURA, CEAT MAESTRO, etc. |
||||||||
|
|
|
||||||||
|
Brand Names : |
Not Divulged |
||||||||
|
|
|
||||||||
|
Agencies Held : |
Not Divulged |
||||||||
|
|
|
||||||||
|
Exports : |
|
||||||||
|
Products : |
Automotive Tyres, Tubes and Flaps |
||||||||
|
Countries : |
|
||||||||
|
|
|
||||||||
|
Imports : |
|
||||||||
|
Products : |
Raw Material |
||||||||
|
Countries : |
|
||||||||
|
|
|
||||||||
|
Terms : |
|
||||||||
|
Selling : |
Cash, L/C, Cheque and Credit (30 days) |
||||||||
|
|
|
||||||||
|
Purchasing : |
Cash, L/C, Cheque and Credit (30 days) |
PRODUCTION STATUS : NOT AVAILABLE
GENERAL INFORMATION
|
Suppliers : |
Not Divulged |
|||||||||||||||||||||||||||||||||||||||||||||||||||||||||||||||||||||||||||
|
|
|
|||||||||||||||||||||||||||||||||||||||||||||||||||||||||||||||||||||||||||
|
Customers : |
Not Divulged |
|||||||||||||||||||||||||||||||||||||||||||||||||||||||||||||||||||||||||||
|
|
|
|||||||||||||||||||||||||||||||||||||||||||||||||||||||||||||||||||||||||||
|
No. of Employees : |
More than 1000 (Approximately) |
|||||||||||||||||||||||||||||||||||||||||||||||||||||||||||||||||||||||||||
|
|
|
|||||||||||||||||||||||||||||||||||||||||||||||||||||||||||||||||||||||||||
|
Bankers : |
v Axis Bank Limited v Bank of Baroda v Bank of India v Corporation Bank v EXIM Bank v ICICI Bank Limited v IDBI Bank Limited v State Bank of India v UCO Bank v YES Bank Limited |
|||||||||||||||||||||||||||||||||||||||||||||||||||||||||||||||||||||||||||
|
|
|
|||||||||||||||||||||||||||||||||||||||||||||||||||||||||||||||||||||||||||
|
Facilities : |
|
|
Banking
Relations : |
-- |
|
|
|
|
Auditors : |
|
|
Name : |
S. R. Batliboi and Associates LLP Chartered Accountants |
|
Address : |
14th Floor, The Ruby 29 Senapati Bapat Marg, Dadar (West), Mumbai – 400028, Maharashtra, India |
|
Tel. No. : |
91-22-61920000 |
|
Fax No. : |
91-22-61921000 |
|
|
|
|
Legal Adviser: |
1. Mulla and Mulla and Craige Chartered Accountants 2. Blunt and Caroe Chartered Accountants |
|
|
|
|
Related parties
where control exists : |
v Associated CEAT Holdings Company (Pvt.) Limited (ACHL) (Subsidiary Company) v CEAT Bangladesh Limited (CEAT Bangladesh) (Subsidiary Company) v Rado Tyres Limited (Subsidiary Company) (w.e.f. 27th September, 2013) |
|
|
|
|
Related parties
with whom transactions have taken place during the year : |
v CEAT-Kelani Holding Company (Pvt.) Limited (CKHL) (Joint Venture of ACHL) v Associated CEAT (Pvt.) Limited (ACPL) (Subsidiary of CKHL) v CEAT-Kelani International Tyres (Pvt.) Limited, (CKITL) (Subsidiary of CKHL) v CEAT Kelani Radials Limited (CKRL) (Subsidiary of CKHL) v Asian Tyres (Pvt) Limited ( ATPL) (Subsidiary of CKITL) (w.e.f 14th November, 2012) v Instant Holdings Limited (Investing entity in respect of which CEAT Limited is an Associate) |
CAPITAL STRUCTURE
As on 31.03.2014
Authorised Capital :
|
No. of Shares |
Type |
Value |
Amount |
|
|
|
|
|
|
46100000 |
Equity Shares |
Rs.10/- each |
Rs.461.000 Million |
|
3900000 |
Preference Shares |
Rs.10/- each |
Rs.39.000 Million |
|
10000000 |
Unclassified Shares |
Rs.10/- each |
Rs.100.000 Million |
|
|
|
|
|
|
|
Total |
|
Rs.600.000
Million |
Issued Capital :
|
No. of Shares |
Type |
Value |
Amount |
|
|
|
|
|
|
35956398 |
Equity Shares |
Rs.10/- each |
Rs.359.564 Million |
|
|
|
|
|
Subscribed & Paid-up Capital :
|
No. of Shares |
Type |
Value |
Amount |
|
|
|
|
|
|
34243534 |
Equity Shares |
Rs.10/- each |
Rs.342.435 Million |
|
1712176 |
Add : Shares Allotted during the year |
|
Rs.17.122 Million |
|
|
|
|
|
|
|
Total |
|
Rs.359.557
Million |
Reconciliation of
equity shares outstanding
|
Equity Shares |
Number |
Rs. In Million |
|
Shares outstanding at the beginning of the year |
3,42,43,534 |
342.435 |
|
Shares outstanding at the beginning of the year |
17,12,176 |
17.122 |
|
Shares issued during the year |
3,59,55,710 |
359.557 |
|
Shares outstanding at the end of the year |
|
|
Terms and rights
attached to Equity Shareholders:
The Company has only one class of equity shares having a face value of ` 10/- per share. Each holder of equity shares is entitled to one vote per equity share. The dividend is recommended by the Board of Directors and is subject to the approval of the members at the ensuing Annual General Meeting. The Board of Directors have a right to deduct from the dividend payable to any member any sum due from him to the Company.
In the event of winding-up, the holders of equity shares shall be entitled to receive remaining assets of the Company after distribution of all preferential amounts. The distribution will be in proportion to the number of equity shares held by shareholders.
The shareholders have all other rights as available to equity shareholders as per the provision of the Companies Act, 1956, read together with the Memorandum of Association and Articles of Association of the Company, as applicable.
Shares in the Company held by each shareholder holding more than 5% of
the number of equity shares
|
Equity Shares |
Number of shares |
% Holding |
|
Instant Holdings Limited |
1,15,10,812 |
32.01% |
|
Goodhope Sales Private Limited *` |
-- |
-- |
|
Swallow Associates LLP # |
44,84,624 |
12.47% |
|
Societe Ceat D Investissementen Asie S A |
-- |
-- |
* Merged with Instant Holdings Limited w.e.f. 15th May, 2012
# Swallow Associates Limited upto 30th October, 2012
FINANCIAL DATA
[all figures are
in Rupees Million]
ABRIDGED BALANCE
SHEET
|
SOURCES OF FUNDS |
31.03.2014 |
31.03.2013 |
31.03.2012 |
|
I.
EQUITY
AND LIABILITIES |
|
|
|
|
(1)Shareholders'
Funds |
|
|
|
|
(a) Share Capital |
359.557 |
342.435 |
342.435 |
|
(b) Reserves & Surplus |
9311.448 |
7087.676 |
6184.604 |
|
(c) Money
received against share warrants |
0.000 |
36.397 |
36.397 |
|
|
|
|
|
|
(2)
Share Application money pending allotment |
0.000 |
0.000 |
0.000 |
|
Total
Shareholders’ Funds (1) + (2) |
9671.005 |
7466.508 |
6563.436 |
|
|
|
|
|
|
(3) Non-Current
Liabilities |
|
|
|
|
(a) long-term borrowings |
4224.918 |
4216.689 |
5793.423 |
|
(b) Deferred tax liabilities (Net) |
1090.950 |
745.207 |
334.284 |
|
(c) Other long term
liabilities |
14.220 |
14.220 |
14.220 |
|
(d) long-term
provisions |
202.104 |
120.069 |
80.418 |
|
Total Non-current
Liabilities (3) |
5532.192 |
5096.185 |
6222.345 |
|
|
|
|
|
|
(4) Current Liabilities |
|
|
|
|
(a) Short
term borrowings |
5747.816 |
3821.581 |
5011.587 |
|
(b) Trade
payables |
6692.598 |
7760.612 |
6443.290 |
|
(c) Other
current liabilities |
5469.078 |
5762.251 |
5776.650 |
|
(d) Short-term
provisions |
664.030 |
654.359 |
209.184 |
|
Total Current
Liabilities (4) |
18573.522 |
17998.803 |
17440.711 |
|
|
|
|
|
|
TOTAL |
33776.719 |
30561.496 |
30226.492 |
|
|
|
|
|
|
II.
ASSETS |
|
|
|
|
(1) Non-current assets |
|
|
|
|
(a) Fixed
Assets |
|
|
|
|
(i)
Tangible assets |
14129.557 |
14419.224 |
14595.374 |
|
(ii)
Intangible Assets |
612.548 |
610.080 |
645.269 |
|
(iii)
Capital work-in-progress |
302.304 |
99.354 |
134.159 |
|
(iv)
Intangible assets under development |
0.000 |
0.000 |
0.200 |
|
(b) Non-current Investments |
1243.356 |
447.084 |
441.632 |
|
(c) Deferred tax assets (net) |
0.000 |
0.000 |
0.000 |
|
(d) Long-term Loan and Advances |
752.869 |
1182.919 |
452.755 |
|
(e) Other
Non-current assets |
100.481 |
105.728 |
113.473 |
|
Total Non-Current
Assets |
17141.115 |
16864.389 |
16382.862 |
|
|
|
|
|
|
(2) Current assets |
|
|
|
|
(a)
Current investments |
0.000 |
0.000 |
303.196 |
|
(b)
Inventories |
7182.781 |
5314.401 |
5796.059 |
|
(c) Trade
receivables |
7158.424 |
6357.459 |
6142.276 |
|
(d) Cash
and cash equivalents |
1029.560 |
813.501 |
371.534 |
|
(e)
Short-term loans and advances |
932.125 |
1048.570 |
1122.763 |
|
(f) Other
current assets |
332.714 |
163.176 |
107.802 |
|
Total
Current Assets |
16635.604 |
13697.107 |
13843.630 |
|
|
|
|
|
|
TOTAL |
33776.719 |
30561.496 |
30226.492 |
PROFIT & LOSS
ACCOUNT
|
|
PARTICULARS |
31.03.2014 |
31.03.2013 |
31.03.2012 |
|
|
|
SALES |
|
|
|
|
|
|
|
Revenue from operations |
53548.105 |
48814.447 |
44757.318 |
|
|
|
Other Income |
205.406 |
214.759 |
287.098 |
|
|
|
TOTAL |
53753.511 |
49029.206 |
45044.416 |
|
|
|
|
|
|
|
|
Less |
EXPENSES |
|
|
|
|
|
|
|
Cost of Materials Consumed |
34513.883 |
33432.626 |
32716.056 |
|
|
|
Purchases of Stock-in-Trade |
1170.821 |
687.093 |
516.073 |
|
|
|
Changes in inventories of finished goods, work-in-progress
and Stock-in-Trade |
(1012.331) |
(341.931) |
258.996 |
|
|
|
Employees benefits expense |
2890.719 |
2690.974 |
2165.281 |
|
|
|
Other expenses |
9800.756 |
8265.602 |
6632.875 |
|
|
|
Exceptional Items |
100.393 |
276.956 |
31.564 |
|
|
|
TOTAL |
47464.241 |
45011.320 |
42320.845 |
|
|
|
|
|
|
|
|
|
PROFIT/
(LOSS) BEFORE INTEREST, TAX,
DEPRECIATION AND AMORTISATION |
6289.270 |
4017.886 |
2723.571 |
|
|
|
|
|
|
|
|
|
Less |
FINANCIAL
EXPENSES |
1691.589 |
1778.907 |
1921.615 |
|
|
|
|
|
|
|
|
|
|
PROFIT
/ (LOSS) BEFORE TAX, DEPRECIATION AND AMORTISATION |
4597.681 |
2238.979 |
801.956 |
|
|
|
|
|
|
|
|
|
Less/ Add |
DEPRECIATION/
AMORTISATION |
826.332 |
781.648 |
704.741 |
|
|
|
|
|
|
|
|
|
|
PROFIT/
(LOSS) BEFORE TAX |
3771.349 |
1457.331 |
97.215 |
|
|
|
|
|
|
|
|
|
Less |
TAX |
1233.527 |
393.816 |
21.830 |
|
|
|
|
|
|
|
|
|
|
PROFIT/
(LOSS) AFTER TAX |
2537.822 |
1063.515 |
75.385 |
|
|
|
|
|
|
|
|
|
Add |
PREVIOUS
YEARS’ BALANCE BROUGHT FORWARD |
3328.717 |
2535.455 |
2499.868 |
|
|
|
|
|
|
|
|
|
Less |
APPROPRIATIONS |
|
|
|
|
|
|
|
Proposed Dividend on Equity Shares |
366.406 |
136.974 |
34.244 |
|
|
|
Corporate Tax on Proposed Dividend |
52.610 |
23.279 |
5.554 |
|
|
|
Transfer to General Reserve |
253.800 |
110.000 |
0.000 |
|
|
BALANCE CARRIED
TO THE B/S |
5193.723 |
3328.717 |
2535.455 |
|
|
|
|
|
|
|
|
|
|
EARNINGS IN
FOREIGN CURRENCY |
|
|
|
|
|
|
|
Export Sales calculated on FOB basis |
10749.429 |
10899.587 |
9927.588 |
|
|
|
Royalty |
43.299 |
36.984 |
36.264 |
|
|
|
Dividend |
83.716 |
56.847 |
64.641 |
|
|
|
Technical Development Charges |
33.423 |
0.000 |
4.500 |
|
|
TOTAL EARNINGS |
10909.867 |
10993.418 |
10032.993 |
|
|
|
|
|
|
|
|
|
|
IMPORTS |
|
|
|
|
|
|
|
Raw Materials |
15905.465 |
13489.009 |
13874.172 |
|
|
|
Traded Goods |
333.921 |
264.068 |
137.452 |
|
|
|
Components & Spares |
42.240 |
68.156 |
27.913 |
|
|
|
Capital Goods |
219.783 |
156.069 |
770.488 |
|
|
TOTAL IMPORTS |
16501.409 |
13977.302 |
14810.025 |
|
|
|
|
|
|
|
|
|
|
Earnings /
(Loss) Per Share (Rs.) |
|
|
|
|
|
|
Basic |
71.66 |
31.06 |
2.20 |
|
|
|
Diluted |
71.24 |
30.44 |
2.20 |
|
KEY RATIOS
|
PARTICULARS |
|
31.03.2014 |
31.03.2013 |
31.03.2012 |
|
Net Profit Margin |
(%) |
4.74 |
2.18 |
0.17 |
|
|
|
|
|
|
|
Operating Profit Margin |
(%) |
11.75 |
8.23 |
6.09 |
|
|
|
|
|
|
|
Return on Total Assets (PBT/Total Assets} |
(%) |
11.70 |
4.86 |
0.33 |
|
|
|
|
|
|
|
Return on Investment (ROI) (PBT/Networth) |
|
0.39 |
0.20 |
0.01 |
|
|
|
|
|
|
|
Debt Equity Ratio (Total Debt/Networth) |
|
1.03 |
1.08 |
1.65 |
|
|
|
|
|
|
|
Current Ratio (Current Asset/Current Liability) |
|
0.90 |
0.76 |
0.79 |
FINANCIAL ANALYSIS
[all figures are
in Rupees Million]
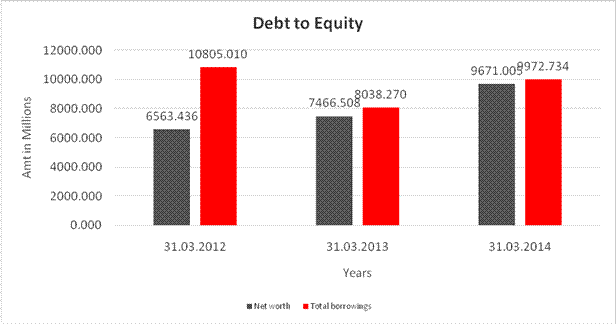
DEBT EQUITY RATIO
|
Particular |
31.03.2012 |
31.03.2013 |
31.03.2014 |
|
|
(Rs. In Million) |
(Rs. In Million) |
(Rs. In Million) |
|
Share Capital |
342.435 |
342.435 |
359.557 |
|
Reserves & Surplus |
6184.604 |
7087.676 |
9311.448 |
|
Money received against
share warrants |
36.397 |
36.397 |
0.000 |
|
Net worth |
6563.436 |
7466.508 |
9671.005 |
|
|
|
|
|
|
long-term borrowings |
5793.423 |
4216.689 |
4224.918 |
|
Short term borrowings |
5011.587 |
3821.581 |
5747.816 |
|
Total borrowings |
10805.010 |
8038.270 |
9972.734 |
|
Debt/Equity ratio |
1.646 |
1.077 |
1.031 |
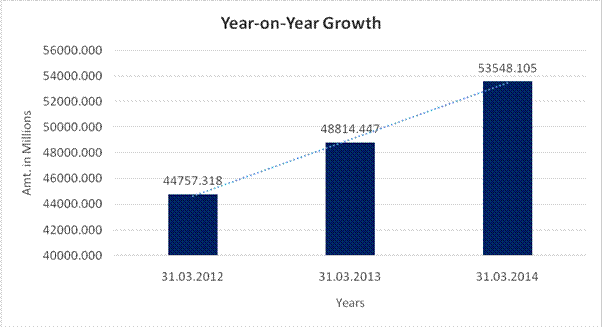
YEAR-ON-YEAR GROWTH
|
Year on Year Growth |
31.03.2012 |
31.03.2013 |
31.03.2014 |
|
|
(Rs. In Million) |
(Rs. In Million) |
(Rs. In Million) |
|
Revenue from operations |
44757.318 |
48814.447 |
53548.105 |
|
|
|
9.065 |
9.697 |
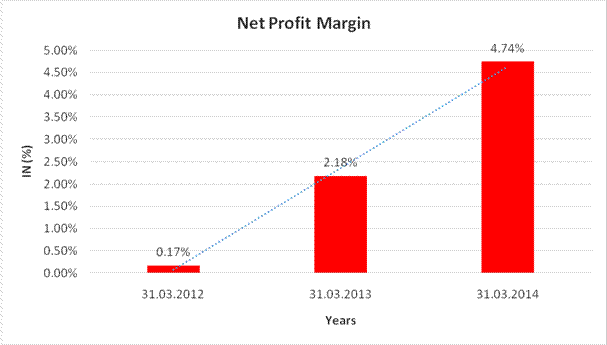
NET PROFIT MARGIN
|
Net Profit Margin |
31.03.2012 |
31.03.2013 |
31.03.2014 |
|
|
(Rs. In Million) |
(Rs. In Million) |
(Rs. In Million) |
|
Revenue from operations |
44757.318 |
48814.447 |
53548.105 |
|
Profit |
75.385 |
1063.515 |
2537.822 |
|
|
0.17% |
2.18% |
4.74% |
LOCAL AGENCY FURTHER INFORMATION
|
Sr. No. |
Check List by Info Agents |
Available in
Report (Yes / No) |
|
1] |
Year of Establishment |
Yes |
|
2] |
Locality of the firm |
Yes |
|
3] |
Constitutions of the firm |
Yes |
|
4] |
Premises details |
Yes |
|
5] |
Type of Business |
Yes |
|
6] |
Line of Business |
Yes |
|
7] |
Promoter's background |
No |
|
8] |
No. of employees |
Yes |
|
9] |
Name of person contacted |
Yes |
|
10] |
Designation of contact
person |
Yes |
|
11] |
Turnover of firm for last
three years |
Yes |
|
12] |
Profitability for last
three years |
Yes |
|
13] |
Reasons for variation
<> 20% |
----- |
|
14] |
Estimation for coming
financial year |
No |
|
15] |
Capital in the business |
Yes |
|
16] |
Details of sister
concerns |
Yes |
|
17] |
Major suppliers |
No |
|
18] |
Major customers |
No |
|
19] |
Payments terms |
Yes |
|
20] |
Export / Import details
(if applicable) |
Yes |
|
21] |
Market information |
----- |
|
22] |
Litigations that the firm
/ promoter involved in |
Yes |
|
23] |
Banking Details |
Yes |
|
24] |
Banking facility details |
Yes |
|
25] |
Conduct of the banking
account |
----- |
|
26] |
Buyer visit details |
----- |
|
27] |
Financials, if provided |
Yes |
|
28] |
Incorporation details, if
applicable |
Yes |
|
29] |
Last accounts filed at
ROC |
Yes |
|
30] |
Major Shareholders, if
available |
Yes |
|
31] |
Date of Birth of
Proprietor/Partner/Director, if available |
No |
|
32] |
PAN of
Proprietor/Partner/Director, if available |
No |
|
33] |
Voter ID No of
Proprietor/Partner/Director, if available |
No |
|
34] |
External Agency Rating,
if available |
Yes |
LITIGATION DETAILS
|
HIGH COURT OF
BOMBAY |
|
CASE DETAILS BENCH: BOMBAY |
|
Presentation
Date:- 02.01.2015 |
|
Lodging No.:- CEXAL/1/2014 Filing Date:- 02.01.2015 |
|
|
|
Petitioner: THE COMMISSIONER OF CENTRAL EXCIS- Respondent: CEAT LIMITED Petn. Adv : SIDU DINKAR BHOSALE (I5095) District: THANE |
|
Bench: DIVISION Status: Pre-Admission
Category: CENTRAL EXCISE APPEAL (CEXA) |
|
Act: Central Excise and Salt Act UNDER SECTION: 35(G) |
UNSECURED LOANS
|
PARTICULAR |
31.03.2014 (Rs.
In Million) |
31.03.2013 (Rs.
In Million) |
|
LONG TERM
BORROWINGS |
|
|
|
Public Deposits |
528.730 |
738.986 |
|
Deferred Sales Tax Incentive |
418.424 |
449.405 |
|
|
0 |
0 |
|
SHORT TERM BORROWINGS |
0 |
0 |
|
Export Packing Credit |
387.682 |
0.000 |
|
Term Loan from Bank |
535.962 |
0.000 |
|
Public Deposit |
18.012 |
28.315 |
|
|
0 |
0 |
|
Total |
1888.810 |
1216.706 |
INDEX OF CHARGES
|
S.No. |
Charge ID |
Date of Charge
Creation/Modification |
Charge amount secured |
Charge Holder |
Address |
Service Request Number
(SRN) |
|
1 |
10348599 |
28/03/2012 |
700,000,000.00 |
ICICI BANK LIMITED |
LANDMARKRACE COURCE CIRCLE, ALKAPURI, BARODA,
Gujarat - 390015, INDIA |
B37260502 |
|
2 |
10247473 |
21/10/2010 |
1,164,600,000.00 |
ICICI BANK LIMITED |
LANDMARKRACE COURCE CIRCLE, ALKAPURI,
BARODA, Gujarat - 390015, INDIA |
A96947650 |
|
3 |
10231597 |
21/06/2010 |
500,000,000.00 |
Bank of Baroda |
Industrial Finance Branch, Baroda House,
Cawasjee |
A89904403 |
|
4 |
10230552 |
21/06/2010 |
1,000,000,000.00 |
Export-Import Bank of India |
Centre One Building, Floor 21, World Trade
Centre Complex, Cuffe Parade, Mumbai, Maharashtra - 400005, INDIA |
A89559595 |
|
5 |
10230550 |
21/06/2010 |
1,300,000,000.00 |
ICICI BANK LIMITED |
LANDMARKRACE COURCE CIRCLE, ALKAPURI, BARODA,
Gujarat - 390015, INDIA |
A89552947 |
|
6 |
10212609 |
21/06/2010 * |
1,000,000,000.00 |
Bank of India |
Mumbai Large Corporate Branch, Bank of
India Bldg, |
A89770556 |
|
7 |
10179171 |
21/06/2010 * |
1,100,000,000.00 |
IDBI Bank Limited |
IDBI TOWERWTC COMPLEX, CUFFE PARADE,
MUMBAI, Maharashtra - 400005, INDIA |
A89762595 |
|
8 |
10125671 |
21/06/2010 * |
576,550,000.00 |
ICICI BANK LIMITED |
LANDMARKRACE COURCE CIRCLE, ALKAPURI,
BARODA, Gujarat - 390015, INDIA |
A90037847 |
|
9 |
80004608 |
27/09/2013 * |
12,000,000,000.00 |
Bank of India |
Mumbai Large Corporate Branch, Oriental
Building, 364, D. N. Road, Mumbai, Maharashtra - 400001, |
B87292843 |
* Date of charge modification
CORPORATE INFORMATION
Subject is a public company domiciled in India and incorporated under the provisions of the Companies Act, 1956. The company’s principal business is manufacturing of automotive tyres, tubes and flaps. The company started operations in 1958 as CEAT Tyres of India Limited and was renamed as CEAT Limited in 1990. The company caters to both domesticand international markets.
INDUSTRY SCENARIO
The
challenges faced by the Indian economy during the last fiscal continued during
FY 2013-14 as well. India continued to grapple with problems like slowdown in
industrial and economic activity, increased inflation and fiscal imbalances.
However, the second half of the year witnessed some positive developments in
the form of policy announcements and global economic recovery.
The growth of
the automotive industry was not impressive in FY 2013-14 with commercial
vehicles and passenger vehicles dragging down volumes even as tractors and
scooters continued their positive trend.
Export sales
however, grew by about 7.2 percent during the period from April 2013 to March
2014.
The Indian
tyre industry, following the trends of the automotive industry, has not registered
any significant growth. The total tyre volume growth during the year has been 2
to 4 percent due to higher than anticipated weakness in the passenger car and
truck and bus segments.
The domestic
tyre demand from the Original Equipment Manufacturers (OEM) segment is largely
flat for the second consecutive year during FY 2013-14, with contraction across
all segments, barring scooters and tractors. Replacement tyre volume demand
during FY 2013-14 grew by 5-6 percent. The continued decline in the Medium and
Heavy Commercial Vehicles (M&HCV) industry and delayed replacement of
vehicles by fleet owners translated into higher replacement demand for tyres in
this segment.
PERFORMANCE
During the
year, Subject outperformed the industry and has emerged as one of the fastest
growing tyre companies in the industry. The Company registered a turnover of
Rs. 53041.000 Million during the year, registering a robust growth of 9.6 per
cent over Rs. 48367.000 Million in the previous fiscal.
The net
profit of the Company surged from Rs. 1064.000 Million in FY 2012-13 to Rs.
25380.000 Million in during the year on the back of changing product mix,
higher capacity utilisation, reduced interest cost, and expanding presence in
the international markets as well as lower natural rubber prices.
Subject has
continuously focussed on new product launches and has launched over a 100 new
products in FY 2013-14. Product ranges like ‘Gripp LN (low noise)’ for
passenger car radials and ‘Zoom’ for motorcycle tyres have been very successful.
The Company will continue to invest steadily in new product development to
cater to the ever changing needs of the modern consumer.
Over the last
few years, subject has focussed on changing its product portfolio by increasing
volumes in non-truck segment like two wheelers and passenger cars which have
better margins. A favourable product mix has contributed positively to the
bottom line of the Company.
The Company
has strategically enhanced its OEM network, which significantly contributed to
its growth. It has also entered into new partnerships with companies like
Renault-Nissan.
Subject is
looking at expanding its rural presence and its operations in the two-wheeler
and Passanger Car Radial (PCR) replacement market. Expansion of Subjects hoppe is
a key initiative taken by the Company to develop an exclusive retail channel to
improve service levels and reach in the market. At present, the Company has
more than 135 Subjects hoppes as compared to 100 as on March 31, 2013. Subjects
hoppe has positively contributed to the company’s sales, especially in the
passenger car tyre segment accounting for 32 percent of passenger car
radials/utility vehicle radials sales.
In order to
boost its international presence, the Company has identified specific geographic
clusters for expansion, and for this purpose, it has already set up an office
in Indonesia in addition to the one in Middle East. This has helped establish a
local connect with the dealers through on-ground marketing activities.
During the
year, the Company launched the Dhoom 3 branded, high-speed, special-edition
tyres and also released video games based on the box-office monster. Its new
Dhoom 3 tyre is targeted at the younger segment and has provided a boost to the
Company’s image as a quality tyre manufacturer. The Company’s advertisement
campaigns have garnered the award under the “Best Ongoing Campaign” at the
Effies, a prestigious advertising award.
FUTURE OUTLOOK
The Indian tyre
industry is expected to show a muted 2 to 3 percent growth in revenues in FY
2014-15 over the current estimate for FY 2013-14. Sluggishness in the OEM
automotive industry is expected to continue. However, the demand in the
domestic replacement market is expected to be comparatively stronger supported
by a large vehicle user base that has been accumulated over the last 3-4 years
of strong automobile sales.
Raw material
prices are expected to be stable thereby assisting operating margins of tyre
manufacturers. However, with stable raw material prices and a subdued demand
scenario, there might be pricing pressure that can impact operating margins
negatively. The Company will continue to focus on profitable product
categories, market segments and key international geographies.
MANAGEMENT DISCUSSION AND
ANALYSIS
GLOBAL ECONOMIC REVIEW
The global
economic balance shifted back towards developed nations in 2013. Encouraging
economic data in the form of decreasing unemployment and growth in the services
sector in advanced economies validated the shift. Fiscal stimulus, low interest
rates and reassurance by central bankers acted as the support system to these
economies. In contrast, there was a slowdown in emerging economies like India
and Brazil owing to subdued consumer demand and inflationary pressure.
Going
forward, it is expected that emerging economies will grow, backed by structural
policies that support investments. Improving macroeconomic fundamentals will
provide the necessary fillip for global growth, with expected growth rates
pegged at an average rate of 3.7 percent in 2014 against 3 percent in 2013.
INDIAN ECONOMIC REVIEW
The
challenges in the Indian economy persisted last year in the form of slow
growth, high inflation and fiscal imbalances. However, there were some positive
developments as well, in the form of the continuation of policy changes, normal
monsoons and global recovery towards the second half of FY 2013. It is expected
that the GDP will grow by 5.4 percent in FY 2014-15 against a projected 4.6
percent in FY 2013-14 (Source: IMF).
THE GLOBAL TYRE INDUSTRY
The global
tyre market size is estimated to reach $276 billion by 2017, growing 7.9
percent annually. The rise in demand of tyres will be driven by the emerging
economies in the Asia-Pacific region, especially China and India. However,
improved economic conditions in the developed economies of North America and
Western Europe will also accelerate such demand. These developments are likely
to take global tyre demand to 2.9 billion units by 2017, a growth of 4.3
percent every year. Motor vehicles capture the largest proportion of tyre
demand and are likely to form about 73 percent of the global tyre demand by
2017.
The
Asia-Pacific region
The
Asia-Pacific region is likely to account for almost two-thirds of the global
tyre growth till 2017. China is the largest as well as the fastest growing tyre
market globally. Japan and India are also among the major tyre markets. It is
expected that India will outperform Japan in terms of market size, owing to the
strong demand for tyres by the end of 2017.
The North
American / Western European region
These regions
are forecasted to grow at around 2 percent annually through 2017. An improved
economic environment will provide thrust to vehicle demand and, in turn, to
tyre demand. However, the delayed replacement of personal vehicles could limit
such growth. With 13 percent of the global pie, the US is likely to continue to
hold the second rank globally in terms of the tyre market in 2017.
FIXED ASSETS
œ Land
œ Buildings
œ Plants and Equipment’s
œ Furniture and Fixtures
œ Office Equipment’s
œ Vehicles
STATEMENT OF
STANDALONE UNAUDITED RESULTS FOR THE QUARTER AND NINE MONTHS ENDED ON
31.12.2014
(Rs.
In Million)
|
|
|
Particulars |
Quarter
ended |
Nine
months ended |
|
|
|
|
31.12.2014 |
30.09.2014 |
31.12.2014 |
|
|
|
|
Unaudited |
Unaudited |
Unaudited |
|
|
1 |
Income from Operations |
|
|
|
|
|
|
Sales/Income from Operations (Gross) |
14972.500 |
15127.900 |
45556.900 |
|
|
|
Less: Excise Duty |
1422.600 |
1436.300 |
4306.800 |
|
|
|
a) Net Sales/Income from Operations (net of excise duty) |
13549.900 |
13691.600 |
41250.100 |
|
|
|
b) Other Operating Income |
106.800 |
124.800 |
330.000 |
|
|
|
Total Income from Operations (Net) |
13656.700 |
13816.400 |
41580.100 |
|
|
2 |
Expenses |
|
|
|
|
|
|
a) |
Cost of Materials consumed |
8138.900 |
8165.700 |
24596.200 |
|
|
b) |
Purchase of stock in-trade |
278.200 |
286.800 |
936.900 |
|
|
c) |
Changes in inventories of finished goods, work-in-progress and
stock-in-trade |
(265.200) |
72.000 |
398.000 |
|
|
d) |
Employee benefit expenses |
895.600 |
832.900 |
2530.100 |
|
|
e) |
Depreciation and amortization expense |
232.000 |
214.200 |
656.300 |
|
|
f) |
Other
expenses |
2902.900 |
2836.800 |
8504.000 |
|
|
Total Expenses |
12182.400 |
12408.400 |
37621.500 |
|
|
3 |
|
Profit /(Loss)
from operations before other income, finance costs and exceptional items
(1-2) |
1474.300 |
1408.000 |
3958.600 |
|
4 |
Other
Income |
46.700 |
156.100 |
224.300 |
|
|
5 |
|
Profit /(Loss)
from ordinary activities before finance costs and exceptional items (3+4) |
1521.000 |
1564.100 |
4182.900 |
|
6 |
Finance
Costs |
305.500 |
346.100 |
1041.500 |
|
|
7 |
|
Profit /(Loss)
from ordinary activities after finance costs but before exceptional items
(5-6) |
1215.500 |
1218.000 |
3141.400 |
|
8 |
Exceptional
Items |
-- |
-- |
-- |
|
|
9 |
Profit /(Loss) from ordinary activities
before tax |
1215.500 |
1218.000 |
3141.400 |
|
|
10 |
Tax
Expense |
409.200 |
397.000 |
1046.100 |
|
|
11 |
Net Profit /(Loss) from ordinary activities
after tax (9-10) |
806.300 |
821.000 |
2095.300 |
|
|
12 |
Extraordinary
items (net of tax expense) |
-- |
--- |
-- |
|
|
13 |
Net Profit /(Loss) for the period (11-12) |
806.300 |
821.000 |
2095.300 |
|
|
14 |
Paid up
equity share capital (Eq. shares of
Rs.10/- each) |
404.500 |
359.600 |
404.500 |
|
|
15 |
Reserve
excluding revaluation reserves |
-- |
-- |
-- |
|
|
16 |
|
Earnings per
share (before/after extraordinary items) of
Rs.10/- each |
|
|
|
|
|
|
Basic |
21.43 |
22.83 |
57.39 |
|
|
|
Diluted |
21.43 |
22.83 |
57.39 |
|
A |
|
PARTICULARS OF
SHAREHOLDING |
|
|
|
|
1 |
|
Public Shareholding |
|
|
|
|
|
|
- No. of Shares |
19916354 |
15421972 |
19916354 |
|
|
|
-
Percentage of Shareholding |
49.24 |
42.89 |
49.24 |
|
2 |
|
Promoters and promoter group shareholding |
|
|
|
|
|
|
a) Pledged/Encumbered |
|
|
|
|
|
|
- Number
of shares |
-- |
-- |
-- |
|
|
|
-
Percentage of shares ( as a % of the total shareholding of the promoter and
promoter group) |
-- |
-- |
-- |
|
|
|
-
Percentage of shares (as a % of the total share capital of the Company) |
-- |
-- |
-- |
|
|
|
b) Non-
encumbered |
|
|
|
|
|
|
- Number
of shares |
20533738 |
20533738 |
20533738 |
|
|
|
-
Percentage of shares ( as a % of the total shareholding of the promoter and
promoter group) |
100.00 |
100.00 |
100.00 |
|
|
|
- Percentage
of shares (as a % of the total share capital of the Company) |
50.76 |
57.11 |
50.76 |
|
|
Particulars |
Quarter
ended 31.12.2014 |
Quarter
ended 30.09.2014 |
|
|
B |
|
Investor Complaints |
|
|
|
|
|
Pending at
the beginning of the quarter |
3 |
3 |
|
|
|
Received
during the quarter |
7 |
5 |
|
|
|
Disposed
during the quarter |
9 |
5 |
|
|
|
Remaining
unresolved at the end of the quarter |
1 |
3 |
NOTE:
1. The above results were reviewed by the Audit Committee and thereafter approved by the Board of Directors at their meeting held on February 05, 2015.
2. Pursuant to the Companies Act, 2013 ("the Act"), the management,
based on external technical evaluation has reassessed the useful life of fixed
assets. Consequently, the depreciation charge for the quarter ended September
30, 2014, December 31, 2014 and nine months ended was higher by Rs. 19.200
Million, Rs. 14.000 Million and Rs. 40.200 Million respectively. In accordance
with the Act, the carrying value of the fixed assets as at April 01, 2014 is
depreciated over the revised residual life of the fixed assets and where the
revised residual life of the fixed assets is nil as at that date, the carrying
value of the fixed assets, after retaining the residual value, has been
adjusted to the General Reserve. Consequently, the General Reserve has been
reduced by Rs. 216.200 Million (Net of Deferred Tax Rs. 8.800 Million).
3. Exceptional Items for the year ended March 31, 2014 include:
a. The Company had introduced a Voluntary Retirement Scheme (VRS) for its employees. The compensation in respect of employees who opted for VRS aggregated to Rs. 68.900 Million which was disclosed as an exceptional item.
b. The Company's Plant at Bhandup, Mumbai, had an incident
of fire at its Raw Material Store on February 23, 2014. Fixed assets of written
down value of Rs. 23.100 Million and stock of Rs. 253.800 Million, were
destroyed in the fire. In terms of the Company's insurance coverage, management
is confident of recovering an amount of Rs. 2556 Lacs from the Insurance
Company. An amount of Rs. 31.500 Million being the net unrecoverable amount,
including incidental expenses incurred, was disclosed as an exceptional item.
Subsequent to March 31, 2014 out of the total receivable, the Company has
received Rs. 178.300 Million from the Insurance Company.
4. During the quarter ended December 31, 2014, pursuant to the Qualified
Institutions Placement (QIP), the Company allotted 44,94,382 equity shares of Rs.
10 each fully paid up at a premium of Rs. 880 per share, to Qualified
Institutional Buyers.
5. During the quarter ended December 31, 2014, the Company acquired 100% stake in CEAT Specialty Tyres Limited (previously known as CEAT Specialty Tyres Private Limited) by purchasing 10,000 shares of Rs. 10 each at face value. This subsidiary will focus exclusively on 'Off-the-Road' and specialty tyres, for sale in India and abroad.
6. The Company has only one business segment "Tyres".
7. The figures have been regrouped / reclassified wherever considered necessary to conform to current period classification and grouping.
PRESS RELEASE
NEWS / ARTICLE
CEAT EXPECTS RS
4000-5000 MILLION TURNOVER FROM BANGLADESH MKT
August 26, 2014
Ceat has aggressive expansion plans of around Rs 9000 Million said managing director, Aannt Goenka in an interview to CNBC-TV18’s Sumaira Abidi and Nigel D’Souza. He expects FY15 to be a strong year for the company.
The Bangladesh plant would be ready in 14-16 months, said Goenka. The company expects a turnover of Rs 4000-5000 Million from Bangladesh market, he added.
Ceat is looking at expansion in the two-wheeler market. It plans to expand the capacity in Bangladesh plant to 65 tonnes per day and the Halol plant capacity to 100 tonnes per day.
The company also expects a turnaround in the commercial vehicle sector in the next 6-8 months.
As of now the board has approved an enabling resolution of raising Rs 5000 Million but that is the not the final amount said Goenka.
The company would also be looking at funding the expansions through internal accrual, debt and as well as through equity, said Goenka.
The debt for the company is likely to go up marginally due to these expansions. The current debt for the company stands at Rs 11250 Million in first quarter versus Rs 9950 Million year on year (Y-o-Y).
Below is the transcript of Anant Goenka’s interview to CNBC-TV18’s Sumaira Abidi and Nigel D’Souza
Sumaira: I understand you have approval to raise Rs 5000 Million but between your two choices which is paring down your debt and the aggressive expansion that we believe you have lined up, what would these funds be utilised for? How will you choose between the two?
A: We have two large projects that we are looking at doing which we have already announced. One is the Bangladesh project which is already underway where we have been investing about Rs 3000 Million and we have a project in Halol where we are adding some passenger car radial capacity that is about Rs 6500 Million expansions. So it is a total of about Rs 9000 Million expansion and some of these funds will be used for that. Some will be used for some further expansion plans, opportunities that could come up in the next six-eight months time as well.
Nigel: So that Rs 5000 Million you are going to be raising would be used partly for your expansion plan but as you stated you have expansion plans of around Rs 900 crore odd. So how would you fund the remaining Rs 4000 Million?
A: We have not yet absolutely decided to raise Rs 5000 Million. We have got an enabling resolution for up to Rs 5000 Million, the exact amount is still to be worked out and decided. Secondly, the Rs 9000 Million expansion that we have will be a mix of internal accrual, some debt, as well as some equity raising so it is a mix of all of the three. We also require some funds for future expansions which could come underway in the next six months time.
Sumaira: You didn’t mention any plans to pare down debt with this money but already your debt to equity stands at about 1:1 so is that a level you are comfortable with this Rs 110 Million debt that you have, is that a level you are comfortable maintaining and could this level be higher going forward?
A: Yes debt level we are very comfortable with 1:1. We certainly can take it up even to 1:1.2, we would even be comfortable at such levels. So with Rs 9000 Million of expansion debt levels are expected to go up, certainly it will help debt levels come down if we do an equity issuance. So it is a mix of whether you put it in capex or debt reduction. Largely, it is for capex because we have a large amount of capex plans going forward.
Nigel: So none of these funds will be used to pare down your debt because you are quite comfortable at Rs 1100 crore?
A: That is right we are quite comfortable with debt as well as the year is looking to be good, we had a good 12 months gone by, the next few months also continue to look similar. Internal accruals are also expected to continue to be at comfortable levels.
Nigel: With regard to your two-wheeler business last year itself you were eating into a lot of market share, there was a big surge; your market share at the end of last year was around 20-22 percent. What is your current market share in the two-wheeler business and also going ahead what is the target on that one?
A: Yes so our market share has been somewhere around 18-19 percent in the replacement segment. It is now at 22-23 percent, so we are seeing some good improvement in two-wheelers. It continues to be an area of focus and is growing very well whether it is on the auto growth side or whether it is even in the tyre growth side both sides the two-wheeler particularly the scooter segment is growing extremely well.
We continue to remain very bullish and extremely focused in that area.
Sumaira: What about your margin performance because last quarter you all couldn’t take the benefit of the lower rubber prices. So, with the kind of visibility that you now have on Q2 and perhaps FY15, could you tell us how lower rubber prices are going to be trending and what kind of an impact it will have on your margins?
A: We expect rubber prices to continue to be at similar levels, they have come down from Q4 of last year by about 1-2 percent and we expect these prices to continue to remain low.
On the other side we expect some upside on the auto demand side as well; the passenger car side is already beginning to see some positivity and I think in the next eight months or so, we will start seeing a turnaround in the commercial vehicle side as well.
Therefore, both sides the industry is expected to be in an even more comfortable position and we too are geared up to take advantage of this opportunity. In terms of our margins, I think there should be some improvement perhaps from Q1 but difficult to give you any specific numbers.
Nigel: You were very successful in Sri Lanka so are you looking to replicate that in Bangladesh? Give us an outlook with regard to your Bangladesh joint venture, when exactly will it reach those higher capacity utilization levels and when are we looking at commissioning?
A: We are still at quite an early stage in the Bangladesh plant setup; we are still undergoing the civil work at this point of time. It will take a little bit over 14-16 months for the plant to be ready and then perhaps another 10-12 months for capacity utilization to go up to 75-80 percent. So we are still over two years away from high capacity utilizations in Bangladesh.
Secondly, Bangladesh itself is not a very large market so the kind of benefit or turnover increase will not be substantial. At peak perhaps our turnover would be around Rs 400-500 crore but margin should be attractive and long-term profitability is expected to be good because competition there is very limited, and like in Sri Lanka there is place for only one player in Bangladesh and we hope to occupy that very quickly from a manufacturing perspective.
Therefore we will be able to provide a lot of benefit with respect to after sales service to the Bangladesh consumer as well as lower costs because of having a manufacturing base out there.
YET TO SEE IMPROVEMENT IN OEM MARKET FOR
TRUCKS: CEAT
Feb 06, 2015,
Speaking to CNBC-TV18 post Q3 earnings, CFO A Subba Rao said the company is not
seeing any unusual inventory build-up. The midcap company reported flat
domestic volume in Q3.
Tyre maker Ceat reported an increase of 32.50 percent in its standalone net profit to Rs 806.3 Million for the third quarter ended December 31, 2014. The company had posted a net profit of Rs 608.5 Million in the October-December period of the 2013-14 fiscal.
Speaking to CNBC-TV18 post Q3 earnings, CFO A Subba Rao said the company is not seeing any unusual inventory build-up. The midcap company reported flat domestic volume in Q3.
ao further said the company is yet to see any improvement in original equipment manufacturer (OEM) market for trucks. Ceat saw a deceleration of 6 percent in OEM in Q3.
Below is verbatim transcript of the interview:
Q: Your revenue has dipped by a percent, could you take us
through that, was it the volumes or the prices?
A: It’s both. The realisations have come down in the export market; the volumes
have also come down in the export markets because of intense Chinese
competition where they have significantly dropped prices and that’s the main
reason for the drop in both the volumes as well as revenue.
On the domestic front there is a kind of pricing action from the competition but it is not significant in the quarter and is mainly on account of exports. This is an aberration for the current quarter.
Q: Were your domestic volumes flattish? A: Yes, domestic volumes are flattish for the quarter. Q: The key problem is with regards to exports. If I am not wrong, the last time we touch base, it’s around 20 percent of your total revenues?
A: Yes, approximately 20 percent.
Q: Your margins are big positive. You managed to maintain your margins around 12.9 percent odd on year on year basis as well. It has moved up close to 190 bps. Are you looking to maintain it at these levels? Do you think it’s achievable given that your raw material cost have been low or do you think you can better this performance?
A: There are two moving parts here – prices are moving because of competition as well as raw material prices but we should be around same range in the next quarter also as we have been.
Q: Looking at your profit and loss (P&L) account, it appears that there is some inventory. Could you take us through what is your current inventory you are sitting on because there is some credit if I look at it? What is that figure?
A: There is no unusual inventory. The inventory levels are as per our estimates, in tune with our sales volumes but there is no unusual inventory build-up anywhere.
Q: There is no big pickup in demand with regards to trucks as well as buses. Do you think that’s going to turnaround? Now we are talking so much about coal production going up, in fact a lot of that transportation is done via trucks. Do you expect those numbers to improve going ahead?
A: The negative growth in the truck industry has come down but it takes time to translate into replacement market. There are two markets – original equipment manufacturers (OEMs) market and replacement market. The replacement market will not suddenly change either adversely or positively. Unfortunately the OEM market has not significantly improved for the trucks because the economic turnaround has to happen still. We have been waiting for it but it’s not happened so far.
Q: With regard to your OEMs as well as replacement market, can you give us growth numbers on those two segments?
A: Replacement year on year basis is about 2 percent growth.
OEMs – there is deceleration to the extent of about 7 percent and export also
there is a deceleration of about 6-7 percent. I think overall deceleration of
about 1 percent.
Q: You must be quite optimistic about the future because you have huge capacity
coming up in the next couple of years. How are you going to work on that front?
A: As I said this quarter is a kind of aberration in terms of volumes and revenue growth and we have a capacity shortage of 30 percent in motorcycle today which is a stockout situation, in the case of passenger vehicles we have stockout situation of 20 percent which means we have 30 percent more capacity in the case of motorcycles, we should be able to sell that. In the case of passenger vehicles if we have more capacity of 20 percent, we should be able to sell that. So that’s a long-term trend and that is why there is an aberration. We are confident that we would be able to use up the capacity that we are building up.
Q: Bikes and scooters business give you better margins, you would be looking to scale up your margins as well going ahead?
A: That is a strategy, we are moving towards passenger which
is a kind of branded segment in this business. We are moving towards high revenue
pie of passenger base size which is two-wheelers, four-wheelers and also the
specialty segment where we are going to augment and emerging markets. The total
capex is in the high margin business.
Q: With regard to traction on demand front, are you seeing any turnaround. We
are just one month into the new calendar year, are things improving on the
ground?
A: Nothing substantial to quote as of now.
CMT REPORT (Corruption, Money Laundering & Terrorism]
The Public Notice information has been collected from various sources
including but not limited to: The Courts,
1] INFORMATION ON
DESIGNATED PARTY
No exist designating subject or any of its beneficial owners,
controlling shareholders or senior officers as terrorist or terrorist
organization or whom notice had been received that all financial transactions
involving their assets have been blocked or convicted, found guilty or against
whom a judgement or order had been entered in a proceedings for violating money-laundering,
anti-corruption or bribery or international economic or anti-terrorism sanction
laws or whose assets were seized, blocked, frozen or ordered forfeited for
violation of money laundering or international anti-terrorism laws.
2] Court Declaration :
No exist to suggest that subject is or was
the subject of any formal or informal allegations, prosecutions or other
official proceeding for making any prohibited payments or other improper
payments to government officials for engaging in prohibited transactions or
with designated parties.
3] Asset Declaration :
No records exist to suggest that the property or assets of the subject
are derived from criminal conduct or a prohibited transaction.
4] Record on Financial
Crime :
Charges or conviction
registered against subject: None
5] Records on Violation of
Anti-Corruption Laws :
Charges or
investigation registered against subject: None
6] Records on Int’l
Anti-Money Laundering Laws/Standards :
Charges or investigation
registered against subject: None
7] Criminal Records
No
available information exist that suggest that subject or any of its principals
have been formally charged or convicted by a competent governmental authority
for any financial crime or under any formal investigation by a competent
government authority for any violation of anti-corruption laws or international
anti-money laundering laws or standard.
8] Affiliation with
Government :
No record
exists to suggest that any director or indirect owners, controlling
shareholders, director, officer or employee of the company is a government
official or a family member or close business associate of a Government
official.
9] Compensation Package :
Our market
survey revealed that the amount of compensation sought by the subject is fair
and reasonable and comparable to compensation paid to others for similar
services.
10] Press Report :
No press reports / filings exists on
the subject.
CORPORATE GOVERNANCE
MIRA INFORM as part of its Due Diligence do provide comments on
Corporate Governance to identify management and governance. These factors often
have been predictive and in some cases have created vulnerabilities to credit
deterioration.
Our Governance Assessment focuses principally on the interactions
between a company’s management, its Board of Directors, Shareholders and other
financial stakeholders.
CONTRAVENTION
Subject is not known to have contravened any existing local laws,
regulations or policies that prohibit, restrict or otherwise affect the terms
and conditions that could be included in the agreement with the subject.
FOREIGN EXCHANGE RATES
|
Currency |
Unit
|
Indian Rupees |
|
US Dollar |
1 |
Rs.61.94 |
|
|
1 |
Rs.96.24 |
|
Euro |
1 |
Rs.70.39 |
INFORMATION DETAILS
|
Information
Gathered by : |
SVA |
|
|
|
|
Analysis Done by
: |
SUB |
|
|
|
|
Report Prepared
by : |
SNT |
SCORE & RATING EXPLANATIONS
|
SCORE FACTORS |
RANGE |
POINTS |
|
HISTORY |
1~10 |
8 |
|
PAID-UP CAPITAL |
1~10 |
7 |
|
OPERATING SCALE |
1~10 |
7 |
|
FINANCIAL CONDITION |
|
|
|
--BUSINESS SCALE |
1~10 |
7 |
|
--PROFITABILIRY |
1~10 |
7 |
|
--LIQUIDITY |
1~10 |
7 |
|
--LEVERAGE |
1~10 |
7 |
|
--RESERVES |
1~10 |
7 |
|
--CREDIT LINES |
1~10 |
7 |
|
--MARGINS |
-5~5 |
-- |
|
DEMERIT POINTS |
|
|
|
--BANK CHARGES |
YES/NO |
YES |
|
--LITIGATION |
YES/NO |
YES |
|
--OTHER ADVERSE INFORMATION |
YES/NO |
NO |
|
MERIT POINTS |
|
|
|
--SOLE DISTRIBUTORSHIP |
YES/NO |
NO |
|
--EXPORT ACTIVITIES |
YES/NO |
NO |
|
--AFFILIATION |
YES/NO |
YES |
|
--LISTED |
YES/NO |
YES |
|
--OTHER MERIT FACTORS |
YES/NO |
YES |
|
DEFAULTER |
|
|
|
--RBI |
YES/NO |
NO |
|
--EPF |
YES/NO |
NO |
|
TOTAL |
|
64 |
This score serves as a reference to assess SC’s
credit risk and to set the amount of credit to be extended. It is calculated
from a composite of weighted scores obtained from each of the major sections of
this report. The assessed factors and their relative weights (as indicated
through %) are as follows:
Financial
condition (40%) Ownership
background (20%) Payment
record (10%)
Credit history
(10%) Market trend (10%) Operational size
(10%)
RATING EXPLANATIONS
|
RATING |
STATUS |
PROPOSED CREDIT LINE |
|
|
>86 |
Aaa |
Possesses an extremely sound financial base with the strongest
capability for timely payment of interest and principal sums |
Unlimited |
|
71-85 |
Aa |
Possesses adequate working capital. No caution needed for credit
transaction. It has above average (strong) capability for payment of interest
and principal sums |
Large |
|
56-70 |
A |
Financial & operational base are regarded healthy. General
unfavourable factors will not cause fatal effect. Satisfactory capability for
payment of interest and principal sums |
Fairly Large |
|
41-55 |
Ba |
Overall operation is considered normal. Capable to meet normal
commitments. |
Satisfactory |
|
26-40 |
B |
Capability to overcome financial difficulties seems comparatively
below average. |
Small |
|
11-25 |
Ca |
Adverse factors are apparent. Repayment of interest and principal sums
in default or expected to be in default upon maturity |
Limited with
full security |
|
<10 |
C |
Absolute credit risk exists. Caution needed to be exercised |
Credit not
recommended |
|
-- |
NB |
New Business |
-- |
This report is issued at your request without any
risk and responsibility on the part of MIRA INFORM PRIVATE LIMITED (MIPL)
or its officials.