MIRA INFORM REPORT
|
Report No. : |
310223 |
|
Report Date : |
28.02.2015 |
IDENTIFICATION DETAILS
|
Name : |
SRF LIMITED |
|
|
|
|
Registered
Office : |
C-8, Safdarjung Development Area, New Delhi – 110016 |
|
|
|
|
Country : |
India |
|
|
|
|
Financials (as
on) : |
31.03.2014 |
|
|
|
|
Date of
Incorporation : |
09.01.1970 |
|
|
|
|
Com. Reg. No.: |
55-005197 |
|
|
|
|
Capital
Investment / Paid-up Capital : |
Rs. 584.356 Millions |
|
|
|
|
CIN No.: [Company Identification
No.] |
L18101DL1970PLC005197 |
|
|
|
|
IEC No.: |
Not Available |
|
|
|
|
TAN No.: [Tax Deduction &
Collection Account No.] |
DELS33266C |
|
|
|
|
PAN No.: [Permanent Account No.] |
AAACS0206P |
|
|
|
|
Legal Form : |
A Public Limited Liability Company. The Company’s Shares are Listed on
the Stock Exchanges. |
|
|
|
|
Line of Business
: |
Manufacturing and Distribution of a wide range of products in
Technical Textiles, Chemicals and Packing Films Industries. |
|
|
|
|
No. of Employees
: |
2000 (Approximately) |
RATING & COMMENTS
|
MIRA’s Rating : |
A (66) |
|
RATING |
STATUS |
PROPOSED CREDIT LINE |
|
|
56-70 |
A |
Financial & operational base are regarded healthy. General unfavourable
factors will not cause fatal effect. Satisfactory capability for payment of
interest and principal sums |
Fairly Large |
|
Status : |
Good |
|
|
|
|
Payment Behaviour : |
Regular |
|
|
|
|
Litigation : |
Clear |
|
|
|
|
Comments : |
Subject is an established company having good track
record. Financial position of the company is sound. Fundamentals of the
company are strong and healthy. Trade relations are reported as fair. Business is active. Payment terms
are reported to be regular and as per commitement. The company can be considered normal for business dealings at usual
trade terms and conditions. |
NOTES :
Any query related to this report can be made
on e-mail : infodept@mirainform.com
while quoting report number, name and date.
ECGC Country Risk Classification List – December 31, 2014
|
Country Name |
Previous Rating (30.09.2014) |
Current Rating (31.12.2014) |
|
India |
A1 |
A1 |
|
Risk Category |
ECGC
Classification |
|
Insignificant |
A1 |
|
Low |
A2 |
|
Moderate |
B1 |
|
High |
B2 |
|
Very High |
C1 |
|
Restricted |
C2 |
|
Off-credit |
D |
EXTERNAL AGENCY RATING
|
Rating Agency Name |
INDIA RATING |
|
Rating |
Non-Convertible Dentures Programme Ind = AA |
|
Rating Explanation |
High degree of safety and very low credit risk. |
|
Date |
17th September 2014 |
RBI DEFAULTERS’ LIST STATUS
Subject’s name is not enlisted as a defaulter in
the publicly available RBI Defaulters’ list.
EPF (Employee Provident Fund) DEFAULTERS’ LIST STATUS
Subject’s name is not enlisted as a defaulter
in the publicly available EPF (Employee Provident Fund) Defaulters’ list as of
31-03-2014.
INFORMATION DENIED
Management non-cooperative (Tel No.: 91-124-4354400)
LOCATIONS
|
Registered Office : |
C-8, Commercial Complex, Safdarjung Development Area, New Delhi –
110016, India |
|
Tel. No.: |
91-11-26857141 |
|
Fax No.: |
91-11-26510428 |
|
E-Mail : |
|
|
Website : |
|
|
|
|
|
Corporate Office : |
Block – C, Sector – 45, Gurgaon -122003, Haryana, India |
|
Tel. No.: |
91-124-4354400 |
|
Fax No.: |
91-124-4354500 |
|
E-Mail : |
|
|
|
|
|
TECHNICAL TEXTILES BUSINESS |
|
|
|
|
|
Factory 1 : |
Manali
Industrial Area, Manali, Chennai – 600068, Tamilnadu, India |
|
Tel. No.: |
91-44-25946000 |
|
Fax No.: |
91-44-25941159 |
|
|
|
|
Factory 2 : |
Industrial Area,
Malanpur, District Bhind – 477116, Madhya Pradesh, India |
|
Tel. No.: |
91-7539-283164 |
|
Fax No.: |
91-7539-283427 |
|
|
|
|
Factory 3 : |
Plot No 1,
SIPCOT Industrial Area Complex, Gummidipoondi, District Thiruvallur – 601201,
Tamilnadu, India |
|
Tel. No.: |
91-44-27923212-22 |
|
Fax No.: |
91-44-27922718/
27922888 |
|
|
|
|
Factory 4 : |
Viralimalai,
District Pudukottai – 621316, Tamilnadu, India |
|
Tel. No.: |
91-4339-220808 |
|
Fax No.: |
91-4339-220284 |
|
|
|
|
Factory 5 : |
Plot No. 12, Rampura, Ramnagar Road,
District Udham Singh Nagar, Kashipur –
244713, Uttaranchal, India. |
|
Tel. No.: |
91-5947-275604/
05 |
|
Fax No.: |
91-5947-275606 |
|
|
|
|
INTERNATIONAL OPERATIONS |
|
|
|
|
|
Factory 7 : |
SRF Overseas Limited P.O. Box 61101,
Jebel Ali Free Zone, Dubai, U.A.E. |
|
Tel. No.: |
+97-14-8836717 |
|
Fax No.: |
+97-14-8838341 |
|
|
|
|
Factory 8 : |
SRF Industex Belting (Pty) Limited PO Box 4038, Korsten, Port Elizabeth, 6014, Republic of South Africa |
|
Tel. No.: |
+2741-4068700 |
|
Fax No.: |
+2741-4511558/ 4514012 |
|
|
|
|
Factory 9 : |
SRF Technical Textiles (Thailand) Limited 3, Map Ta Phut Industrial Estate, I-1 Road, Amphur Muang, P.O. Box 61, Rayong Province, Thailand |
|
Tel. No.: |
+66-(38)-683600-7 |
|
Fax No.: |
+66-(38)-683609 |
|
|
|
|
CHEMICALS AND POLYMERS BUSINESS |
|
|
|
|
|
Factory 10 : |
Village and PO - Jhiwana, Tehsil Tijara, District Alwar – 301018,
Rajasthan, India |
|
Tel. No.: |
91-1493-220288/
517838/ 517839 |
|
Fax No.: |
91-1493-221125/ 517837 |
|
|
|
|
|
Manali Industrial Area, Manali, Chennai - 600068, Tamilnadu, India |
|
|
|
|
|
Plot No. 14 C, Sector 9, IIE Pantnagar, District Udham Singh Nagar -
263153, Uttarakhand, India |
|
|
|
|
Factory 11 : |
D II/I GIDC, PCPIR,
GIDC, Phase II, Tal Vagra, Village Dahej, District Bharuch - 392130, Gujarat,
India |
|
|
|
|
PACKAGING FILMS BUSINESS |
|
|
|
|
|
Factory 12 : |
Plot No 12,
Rampura, Ramnagar Road, District Udham Singh Nagar, Kashipur – 244713,
Uttaranchal, India |
|
Tel. No.: |
91-5947-275604 |
|
Fax No.: |
91-5947-275606 |
|
|
|
|
Factory 13 : |
Plot No. C –
1-8, C-21-30, Sector – 3, Indore Special Economic Zone, District Dhar,
Pitampur – 454775, Madhya Pradesh, India |
|
Tel. No.: |
91-7292-400526 |
|
Fax No.: |
91-7292-401745 |
|
|
|
|
ENGINEERING PLASTICS BUSINESS |
|
|
|
|
|
Factory 14 : |
Manali Industrial Area,
Manali, Chennai - 600068,
Tamilnadu, India |
|
Tel. No.: |
91-44-25941073 |
|
Fax No.: |
91-44-25943073 |
|
|
|
|
Factory 15 : |
Plot No. 14 C, Sector 9,
Industrial Estate, Pant Nagar, District U S Nagar – 244713, Uttaranchal, India |
|
Fax No.: |
91-5944-250098 |
DIRECTORS
As On 31.03.2014
|
Name : |
Mr. Arun Bharat Ram |
|
|
Designation : |
Chairman |
|
|
Date of Birth/Age : |
72 Years |
|
|
Qualification : |
B.SC (Indl. Engineering) |
|
|
Experience : |
46 Years |
|
|
|
|
|
|
Name : |
Mr. Ashish Bharat Ram |
|
|
Designation : |
Managing Director |
|
|
Date of Birth/Age : |
44 Years |
|
|
Qualification : |
MBA |
|
|
Experience : |
22 Years |
|
|
|
|
|
|
Name : |
Mr. Kartik Bharat Ram |
|
|
Designation : |
Deputy Managing Director |
|
|
Date of Birth/Age : |
42 Years |
|
|
Qualification : |
MBA |
|
|
Experience : |
19 Years |
|
|
|
|
|
|
Name : |
Mr. K. Ravichandra |
|
|
Designation : |
Director (Safety and Environment) |
|
|
|
|
|
|
Name : |
Mr. Vellayan Subbiah |
|
|
Designation : |
Director |
|
|
|
|
|
|
Name : |
Mr. Vinayak Chatterjee |
|
|
Designation : |
Director |
|
|
|
|
|
|
Name : |
Mr. L Lakshman |
|
|
Designation : |
Director |
|
|
|
|
|
|
Name : |
Mr. Tejpreet S Chopra |
|
|
Designation : |
Director |
|
|
|
|
|
|
Name : |
Mr. Pramod B Bhasin |
|
|
Designation : |
Director |
|
KEY EXECUTIVES
|
Name : |
Mr. Anoop K. Joshi |
|
Date of Birth/Age : |
52 Years |
|
Designation : |
Company Secretary |
|
Qualification : |
FCA, FCS |
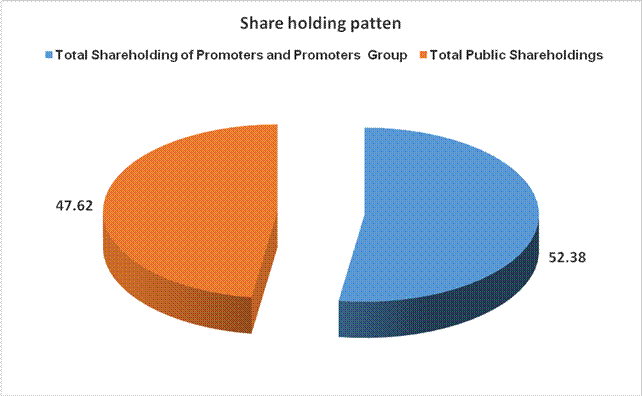
MAJOR SHAREHOLDERS / SHAREHOLDING PATTERN
AS ON 31.12.2014
|
Category of
Shareholder |
No. of Shares |
% of Holdings |
|
(A) Shareholding
of Promoter and Promoter Group |
||
|
|
|
|
|
|
30075500 |
52.38 |
|
|
30075500 |
52.38 |
|
|
|
|
|
Total
shareholding of Promoter and Promoter Group (A) |
30075500 |
52.38 |
|
(B) Public
Shareholding |
||
|
|
|
|
|
|
6418653 |
11.18 |
|
|
160018 |
0.28 |
|
|
646472 |
1.13 |
|
|
7315987 |
12.74 |
|
|
14541130 |
25.32 |
|
|
|
|
|
|
2963066 |
5.16 |
|
|
|
|
|
|
8388196 |
14.61 |
|
|
1059092 |
1.84 |
|
|
393516 |
0.69 |
|
|
227108 |
0.40 |
|
|
110259 |
0.19 |
|
|
56099 |
0.10 |
|
|
50 |
0.00 |
|
|
12803870 |
22.30 |
|
Total Public
shareholding (B) |
27345000 |
47.62 |
|
Total (A)+(B) |
57420500 |
100.00 |
|
(C) Shares held
by Custodians and against which Depository Receipts have been issued |
0 |
0.00 |
|
|
0 |
0.00 |
|
|
0 |
0.00 |
|
|
0 |
0.00 |
|
Total
(A)+(B)+(C) |
57420500 |
0.00 |
BUSINESS DETAILS
|
Line of Business : |
Manufacturing and Distribution of a wide range of products in
Technical Textiles, Chemicals and Packing Films Industries. |
||||||||
|
|
|
||||||||
|
Products : |
|
||||||||
|
|
|
||||||||
|
Brand Names : |
Not Available |
||||||||
|
|
|
||||||||
|
Agencies Held : |
Not Available |
||||||||
|
|
|
||||||||
|
Exports : |
Not Divulged |
||||||||
|
|
|
||||||||
|
Imports : |
Not Divulged |
||||||||
|
|
|
||||||||
|
Terms : |
Not Divulged |
PRODUCTION STATUS ON 31.03.2013
|
Particulars |
Unit |
Installed Capacity |
Actual Production |
|
Synthetic Filament Yarn including Industrial Yarn / Tyre Cord @/
Twine@@ |
MT |
68040 |
11540.32 |
|
Nylon Tyre Cord Fabric / Industrial Yarn Fabric / Polyester Tyre Cord
Fabric* |
MT |
71384 |
49400.78 |
|
Laminated Fabric |
Lakhs SQM |
900 |
559.32 |
|
Nylon / PBT / PC Compounding Chips@@ |
MT |
14500 |
9042.40 |
|
Fluorocarbon Refrigerant Gases |
MT |
57500 |
11632.90 |
|
HFC 134a |
MT |
5000 |
2852.70 |
|
Hydrofluoric Acid (Anhydrous)@ |
MT |
12000 |
-- |
|
Gypsum (By product) |
MT |
44550 |
36452.30 |
|
Hydrochloric Acid (By Product) |
MT |
77220 |
6659.22 |
|
Chloromethanes@ |
MT |
40000 |
24174.42 |
|
Fluorospecialities Chemicals |
MT |
12005 |
2379.12 |
|
Packaging Films |
MT |
59500 |
54003.89 |
Installed capacity
is as certified by management
@ Excludes captive
consumption
* Includes Nil
(Previous Year – 1068.98 MT) of nylon tyre cord fabric / industrial yarn fabric
produced outside the Company by the Company’s conversion contractors
@@ Includes 15.20 MT
(Previous Year – 106.55 MT) of nylon compounding chips produced outside the
Company by the Company’s conversion contractors.
GENERAL INFORMATION
|
Suppliers : |
Not Divulged |
||||||||||||||||||||||||||||||||||||
|
|
|
||||||||||||||||||||||||||||||||||||
|
Customers : |
Not Divulged |
||||||||||||||||||||||||||||||||||||
|
|
|
||||||||||||||||||||||||||||||||||||
|
No. of Employees : |
2000 (Approximately) |
||||||||||||||||||||||||||||||||||||
|
|
|
||||||||||||||||||||||||||||||||||||
|
Bankers : |
|
||||||||||||||||||||||||||||||||||||
|
|
|
||||||||||||||||||||||||||||||||||||
|
Facilities : |
|
|
|
|
|
Auditors : |
|
|
Name : |
Deloitte Haskins and Sells Chartered Accountants |
|
|
|
|
Holding Company
: |
KAMA Holdings Limited with effect from 3 August 2012 |
|
|
|
|
Subsidiaries : |
|
|
|
|
|
Fellow
subsidiaries with effect from 3 August 2012 : |
|
|
|
|
|
Enterprises over
which have significant influence : |
|
|
|
|
CAPITAL STRUCTURE
As On 31.03.2014
Authorised Capital :
|
No. of Shares |
Type |
Value |
Amount |
|
|
|
|
|
|
120000000 |
Equity Shares |
Rs.10/- each |
Rs.1200.000 Millions |
|
1000000 |
Preference Shares |
Rs.100/- each |
Rs.100.000 Millions |
|
1200000 |
Cumulative Convertible Preference Shares |
Rs.50/- each |
Rs.60.000 Millions |
|
20000000 |
Cumulative Preference Shares |
Rs.100/- each |
Rs. 2000.000 Millions |
|
|
|
|
|
|
|
Total |
|
Rs.3360.000
Millions |
Issued Capital :
|
No. of Shares |
Type |
Value |
Amount |
|
|
|
|
|
|
61477255 |
Equity Shares |
Rs.10/- each |
Rs.614.773 Millions |
|
|
|
|
|
Subscribed & Paid-up Capital :
|
No. of Shares |
Type |
Value |
Amount |
|
|
|
|
|
|
57420500* |
Equity Shares |
Rs.10/- each |
Rs.574.205 Millions |
|
|
Add: Forfeited shares - Amount originally paid up |
|
Rs. 10.151 Millions |
|
|
|
|
|
|
|
Total |
|
Rs. 584.356
Millions |
* 3,00,00,000 equity shares held by KAMA Holdings Limited, the holding company.
·
Reconciliation of equity shares
|
|
Number of shares |
Rs. in millions |
|
As at April 1, 2012 |
57420500 |
574.205 |
|
Less: Shares bought back during the year |
-- |
-- |
|
As at March 31, 2013 |
57420500 |
574.205 |
|
Add: Movement during the year |
-- |
-- |
|
As at March 31, 2014 |
57420500 |
574.205 |
The shares bought back in the current year were cancelled / extinguished
during the year.
·
Shareholders holding more than 5% shares in the
Company
|
Name of the shareholder |
Number of shares |
% of total |
|
|
|
|
|
KAMA Holdings Limited |
30000000 |
52.25% |
· The Company has bought back 1,04,64,505 equity shares in aggregate in the last five financial years.
·
Terms/rights
attached to equity shares
The Company has only one class of equity shares having a par value of ` 10 per share. Each holder of equity shares is entitled to one vote per share. The Company declares and pays dividends in Indian rupees. The final dividend proposed by the Board of Directors is subject to the approval of the shareholders in the ensuing Annual General Meeting. The Board may from time to time pay to the members such interim dividends as appear to it to be justified by the profits of the Company.
During the year ended 31 March 2014, the amount of interim dividend recognised as distributions to equity shareholders was Rs.10 per share.
In the event of liquidation of the Company, the holders of equity shares will be entitled to receive remaining assets of the Company, after distribution
FINANCIAL DATA
[all figures are
in Rupees Million]
ABRIDGED BALANCE
SHEET
|
SOURCES OF FUNDS |
31.03.2014 |
31.03.2013 |
31.03.2012 |
|
I.
EQUITY
AND LIABILITIES |
|
|
|
|
(1)Shareholders' Funds |
|
|
|
|
(a) Share Capital |
584.356 |
584.356 |
584.356 |
|
(b) Reserves & Surplus |
21050.763 |
19540.768 |
17882.650 |
|
(c) Money
received against share warrants |
0.000 |
0.000 |
0.000 |
|
|
|
|
|
|
(2) Share Application money pending
allotment |
0.000 |
0.000 |
0.000 |
|
Total
Shareholders’ Funds (1) + (2) |
21635.119 |
20125.124 |
18467.006 |
|
|
|
|
|
|
(3)
Non-Current Liabilities |
|
|
|
|
(a) long-term borrowings |
8445.786 |
5766.234 |
5793.068 |
|
(b) Deferred tax liabilities (Net) |
2900.275 |
2548.779 |
2170.930 |
|
(c) Other long term
liabilities |
0.000 |
0.000 |
0.000 |
|
(d) long-term
provisions |
135.308 |
118.894 |
104.038 |
|
Total Non-current
Liabilities (3) |
11481.369 |
8433.907 |
8068.036 |
|
|
|
|
|
|
(4) Current
Liabilities |
|
|
|
|
(a) Short
term borrowings |
2836.143 |
2416.311 |
2944.297 |
|
(b) Trade
payables |
5826.630 |
4309.917 |
4448.887 |
|
(c) Other
current liabilities |
2725.333 |
3234.559 |
2180.807 |
|
(d) Short-term
provisions |
147.400 |
73.541 |
134.054 |
|
Total Current
Liabilities (4) |
11535.506 |
10034.328 |
9708.045 |
|
|
|
|
|
|
TOTAL |
44651.994 |
38593.359 |
36243.087 |
|
|
|
|
|
|
II.
ASSETS |
|
|
|
|
(1)
Non-current assets |
|
|
|
|
(a) Fixed
Assets |
|
|
|
|
(i)
Tangible assets |
27415.637 |
21651.735 |
18403.520 |
|
(ii)
Intangible Assets |
184.360 |
178.050 |
204.296 |
|
(iii)
Capital work-in-progress |
1213.800 |
2196.929 |
4142.646 |
|
(iv)
Intangible assets under development |
0.000 |
0.000 |
0.000 |
|
(b) Non-current Investments |
931.872 |
926.122 |
922.972 |
|
(c) Deferred tax assets (net) |
0.000 |
0.000 |
0.000 |
|
(d) Long-term Loan and Advances |
775.434 |
1206.852 |
951.665 |
|
(e) Other
Non-current assets |
38.683 |
23.015 |
30.437 |
|
Total Non-Current
Assets |
30559.786 |
26182.703 |
24655.536 |
|
|
|
|
|
|
(2)
Current assets |
|
|
|
|
(a)
Current investments |
250.276 |
1351.306 |
1264.027 |
|
(b)
Inventories |
6311.613 |
4959.098 |
4121.961 |
|
(c) Trade
receivables |
5451.830 |
4525.678 |
4080.289 |
|
(d) Cash
and cash equivalents |
746.392 |
769.642 |
1292.067 |
|
(e)
Short-term loans and advances |
1317.715 |
797.247 |
821.774 |
|
(f) Other
current assets |
14.382 |
7.685 |
7.433 |
|
Total
Current Assets |
14092.208 |
12410.656 |
11587.551 |
|
|
|
|
|
|
TOTAL |
44651.994 |
38593.359 |
36243.087 |
PROFIT & LOSS
ACCOUNT
|
|
PARTICULARS |
31.03.2014 |
31.03.2013 |
31.03.2012 |
|
|
|
SALES |
|
|
|
|
|
|
|
Income |
34171.468 |
33225.443 |
35272.183 |
|
|
|
Other Income |
247.142 |
437.534 |
310.581 |
|
|
|
TOTAL |
34418.610 |
33662.977 |
35582.764 |
|
|
|
|
|
|
|
|
Less |
EXPENSES |
|
|
|
|
|
|
|
Cost of materials consumed |
20168.379 |
19137.355 |
20211.628 |
|
|
|
Purchases of traded goods |
160.162 |
90.170 |
64.016 |
|
|
|
(Increase)\Decrease in inventories of finished goods, stock-in-process
and traded goods |
(47.635) |
(224.961) |
(65.239) |
|
|
|
Employee benefits expenses |
2327.227 |
2024.352 |
1640.487 |
|
|
|
Other expenses |
6497.020 |
6420.892 |
5415.499 |
|
|
|
TOTAL |
29105.153 |
27447.808 |
27266.391 |
|
|
|
|
|
|
|
|
Less |
PROFIT
BEFORE INTEREST, TAX, DEPRECIATION AND AMORTISATION |
5313.457 |
6215.169 |
8316.373 |
|
|
|
|
|
|
|
|
|
Less |
FINANCIAL
EXPENSES |
700.201 |
846.483 |
1040.932 |
|
|
|
|
|
|
|
|
|
|
PROFIT
BEFORE TAX, DEPRECIATION AND AMORTISATION |
4613.256 |
5368.686 |
7275.441 |
|
|
|
|
|
|
|
|
|
Less |
DEPRECIATION/
AMORTISATION |
1904.648 |
1842.759 |
1616.807 |
|
|
|
|
|
|
|
|
|
|
PROFIT BEFORE
TAX |
2708.608 |
3525.927 |
5658.634 |
|
|
|
|
|
|
|
|
|
Less |
TAX |
543.154 |
940.857 |
1784.834 |
|
|
|
|
|
|
|
|
|
|
PROFIT AFTER TAX
|
2165.454 |
2585.070 |
3873.800 |
|
|
|
|
|
|
|
|
|
Add |
PREVIOUS
YEARS’ BALANCE BROUGHT FORWARD |
11958.675 |
11040.332 |
9315.563 |
|
|
|
|
|
|
|
|
|
Add |
Recognition of
stock of Certified Emission Reductions as at 1 April 2012 |
0.000 |
9.135 |
0.000 |
|
|
|
|
|
|
|
|
|
Less |
APPROPRIATIONS |
|
|
|
|
|
|
|
Interim Dividend |
574.205 |
574.205 |
812.262 |
|
|
|
Corporate Dividend Tax |
95.887 |
93.150 |
131.769 |
|
|
|
Transfer to General Reserve |
216.545 |
258.507 |
400.000 |
|
|
|
Debenture redemption reserve |
0.000 |
750.000 |
750.000 |
|
|
|
Transfer to Special Economic Zone reinvestment allowance reserve |
0.000 |
0.000 |
55.000 |
|
|
BALANCE CARRIED
TO THE B/S |
13237.492 |
11958.675 |
11040.332 |
|
|
|
|
|
|
|
|
|
|
EARNINGS IN
FOREIGN CURRENCY |
|
|
|
|
|
|
|
Export of goods calculated on FOB Value |
9753.535 |
10835.460 |
12203.695 |
|
|
|
Interest |
2.734 |
4.286 |
1.264 |
|
|
|
Profit on sale of investment in subsidiary / others |
0.000 |
0.000 |
4.284 |
|
|
|
Service fee including recovery of actual expenses incurred |
85.901 |
45.654 |
32.611 |
|
|
TOTAL EARNINGS |
9842.170 |
10885.400 |
12241.854 |
|
|
|
|
|
|
|
|
|
|
IMPORTS |
|
|
|
|
|
|
|
Raw Materials |
10284.330 |
8490.562 |
6431.004 |
|
|
|
Stores & Spares |
136.391 |
107.696 |
214.827 |
|
|
|
Capital Goods |
369.096 |
279.059 |
403.584 |
|
|
TOTAL IMPORTS |
10789.817 |
8877.317 |
7049.415 |
|
|
|
|
|
|
|
|
|
|
Earnings Per
Share (Rs.) |
37.71 |
45.02 |
65.55 |
|
QUARTERLY /
SUMMARISED RESULTS
(Rs.
In Millions)
|
Particulars |
|
30.06.2014 (Unaudited) |
30.09.2014 (Unaudited) |
|
|
|
1st
Quarter |
2nd
Quarter |
|
Net sales |
|
9420.900 |
9281.700 |
|
Total Expenditure |
|
7715.800 |
7440.800 |
|
PBIDT (Excluding Other Income) |
|
1705.100 |
1840.900 |
|
Other income |
|
304.400 |
45.700 |
|
Operating Profit |
|
2009.500 |
1886.600 |
|
Interest |
|
234.000 |
273.300 |
|
Exceptional Items |
|
0.000 |
0.000 |
|
PBDT |
|
1775.500 |
1613.300 |
|
Depreciation |
|
491.100 |
521.500 |
|
Profit Before Tax |
|
1284.400 |
1091.800 |
|
Tax |
|
289.700 |
323.300 |
|
Profit after tax |
|
994.700 |
768.500 |
KEY RATIOS
|
PARTICULARS |
|
31.03.2014 |
31.03.2013 |
31.03.2012 |
|
|
|
|
|
|
|
Net Profit Margin PAT / Sales |
(%) |
6.34
|
7.80 |
10.98 |
|
|
|
|
|
|
|
Operating Profit Margin (PBDIT/Sales) |
(%) |
15.55
|
18.71 |
23.58 |
|
|
|
|
|
|
|
Return on Total Assets (PBT/Total Assets} |
(%) |
6.37 |
9.94 |
18.15 |
|
|
|
|
|
|
|
Return on Investment (ROI) (PBT/Networth) |
|
0.13 |
0.18 |
0.31 |
|
|
|
|
|
|
|
Debt Equity Ratio (Total Liability/Networth) |
|
0.52 |
0.41 |
0.47 |
|
|
|
|
|
|
|
Current Ratio (Current Asset/Current Liability) |
|
1.22 |
1.24 |
1.19 |
FINANCIAL ANALYSIS
[all figures are
in Rupees Million]
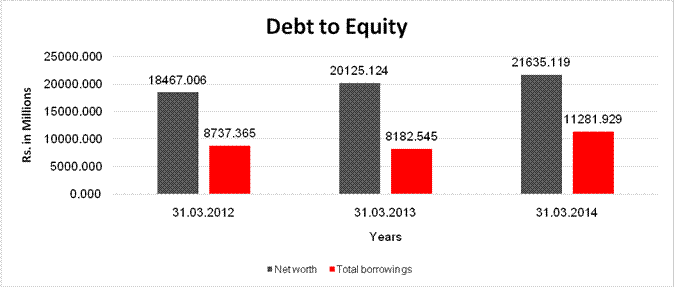
DEBT EQUITY RATIO
|
Particular |
31.03.2012 |
31.03.2013 |
31.03.2014 |
|
|
Rs.
In Millions |
Rs.
In Millions |
Rs.
In Millions |
|
Share Capital |
584.356 |
584.356 |
584.356 |
|
Reserves & Surplus |
17882.650 |
19540.768 |
21050.763 |
|
Net
worth |
18467.006 |
20125.124 |
21635.119 |
|
|
|
|
|
|
long-term borrowings |
5793.068 |
5766.234 |
8445.786 |
|
Short term borrowings |
2944.297 |
2416.311 |
2836.143 |
|
Total
borrowings |
8737.365 |
8182.545 |
11281.929 |
|
Debt/Equity
ratio |
0.473 |
0.407 |
0.521 |
YEAR-ON-YEAR GROWTH
|
Year
on Year Growth |
31.03.2012 |
31.03.2013 |
31.03.2014 |
|
|
Rs.
In Millions |
Rs.
In Millions |
Rs.
In Millions |
|
Sales |
35272.183 |
33225.443 |
34171.468 |
|
|
|
(5.803) |
2.847 |
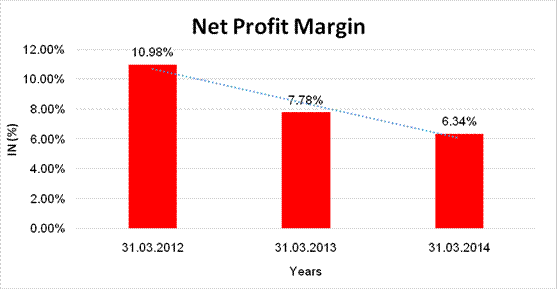
NET PROFIT MARGIN
|
Net
Profit Margin |
31.03.2012 |
31.03.2013 |
31.03.2014 |
|
|
Rs.
In Millions |
Rs.
In Millions |
Rs.
In Millions |
|
Sales
|
35272.183 |
33225.443 |
34171.468 |
|
Profit |
3873.800 |
2585.070 |
2165.454 |
|
|
10.98% |
7.78% |
6.34% |
LOCAL AGENCY FURTHER INFORMATION
|
Sr. No. |
Check List by Info Agents |
Available in
Report (Yes / No) |
|
1] |
Year of Establishment |
Yes |
|
2] |
Locality of the firm |
Yes |
|
3] |
Constitutions of the firm |
Yes |
|
4] |
Premises details |
No |
|
5] |
Type of Business |
Yes |
|
6] |
Line of Business |
Yes |
|
7] |
Promoter's background |
Yes |
|
8] |
No. of employees |
Yes |
|
9] |
Name of person contacted |
No |
|
10] |
Designation of contact
person |
No |
|
11] |
Turnover of firm for last
three years |
Yes |
|
12] |
Profitability for last
three years |
Yes |
|
13] |
Reasons for variation
<> 20% |
----------- |
|
14] |
Estimation for coming
financial year |
No |
|
15] |
Capital in the business |
Yes |
|
16] |
Details of sister
concerns |
Yes |
|
17] |
Major suppliers |
No |
|
18] |
Major customers |
No |
|
19] |
Payments terms |
No |
|
20] |
Export / Import details (if
applicable) |
No |
|
21] |
Market information |
---------- |
|
22] |
Litigations that the firm
/ promoter involved in |
---------- |
|
23] |
Banking Details |
Yes |
|
24] |
Banking facility details |
Yes |
|
25] |
Conduct of the banking
account |
---------- |
|
26] |
Buyer visit details |
---------- |
|
27] |
Financials, if provided |
Yes |
|
28] |
Incorporation details, if
applicable |
Yes |
|
29] |
Last accounts filed at
ROC |
Yes |
|
30] |
Major Shareholders, if
available |
Yes |
|
31] |
Date of Birth of Proprietor/Partner/Director,
if available |
Yes |
|
32] |
PAN of
Proprietor/Partner/Director, if available |
No |
|
33] |
Voter ID No of
Proprietor/Partner/Director, if available |
No |
|
34] |
External Agency Rating,
if available |
Yes |
UNSECURED LOAN:
|
Particulars |
31.03.2014 Rs.
In Millions |
31.03.2013 Rs.
In Millions |
|
Long Term
Borrowings |
|
|
|
Nil (Previous year - 1500), 10.60%, listed, unsecured redeemable non-convertible debentures of Rs 10 lakhs each |
0.000 |
1500.000 |
|
Term loans from banks |
157.696 |
142.865 |
|
Less: Current maturities of long term borrowings Nil (Previous year - 1500), 10.60%, listed, unsecured redeemable non-convertible debentures of Rs 10 lakhs each |
0.000 |
(1500.000) |
|
Total
[A] |
157.696 |
142.865 |
|
|
|
|
|
Short Term
Borrowings |
|
|
|
Term loans from banks |
1980.233 |
1791.335 |
|
Total
[B] |
1980.233 |
1791.335 |
|
|
|
|
|
TOTAL
[A+B] |
2137.929 |
1934.200 |
OPERATIONS REVIEW
Net sales of the Company
increased marginally by 2.69 per cent from Rs.33127.700 Millions in 2012-13 to
Rs.34021.000 Millions in 2013- 14. Due to increase in cost of materials
consumed and employee benefit expenses, Profit before interest, depreciation
and tax (PBIDT) including ‘other income’ decreased from Rs.6192.900 Millions in
2012-13 to Rs.5263.900 Millions in 2013-14. Profit before Tax (PBT) decreased
by 23.18% per cent from Rs.3525.900 Millions in 2012-13 to Rs.2708.600 Millions
in 2013-14. After accounting for the provision for taxation of Rs.543.200
Millions, Profit after Tax (PAT) fell by 16.24 per cent from Rs.2585.100
Millions in 2012-13 to Rs.2165.400 Millions in 2013-14.
MANAGEMENT
DISCUSSION & ANALYSIS
As a manufacturer of
chemical-based industrial intermediates, SRF produces a wide range of products
that touch everyone’s life in more ways than one. Businesses With operations in
three countries namely India, Thailand and
South Africa, SRF
is the market leader in most of its products and also enjoys significant global
presence in some of its businesses. It classifies its main businesses as:
Technical Textiles Business (TTB), Chemicals & Polymers Business (CPB) and
Packaging Films Business (PFB).
Technical Textiles Business
The lackluster
status of the Indian economy has had its effect, though limited, on the
Technical Textiles Business (TTB) since several of the sectors that the
business serves saw low growth and in some cases de-growth. Nevertheless, in
spite of such circumstances, the business performed reasonably with revenues
growing by 8% approx. over the previous year and the profitability improving by
double digits.
Tyre Cord Reinforcement
With radialisation
percentage in the Commercial Vehicle segment reaching around 25% and the
fortunes of the Transport Industry being in doldrums due to the state of the
economy, the Bias Tyre segment of the commercial vehicle showed marginal
de-growth. The business, however, leveraging its strong market position as a
leader of Nylon Tyre Cord Fabrics (NTCF), posted an improved performance.
As a major step
towards improving the competitiveness of the business, SRF closed the
operations of its plant at the Jebel Ali Free Zone, UAE which had become
unviable due to high cost of production and economic slowdown. Currently, the
Company is in the process of relocating/disposing its assets and affecting
closure. On its part, SRF successfully organised approvals from customers for
supplies from its other units to retain the businesses developed.
The Thailand unit
suffered a setback during the year on account of a fire in its Dipping Unit,
which disrupted business for around 45 days; otherwise, the unit’s performance
has been satisfactory. In the Polyester Fabrics and Yarn segment, SRF shifted
gears by focusing on yarn business for diversified industrial applications,
keeping in view the fall in automotive production. This has helped this segment
to keep its head above water.
Belting Fabrics
In the current
global circumstances, the Company changed its strategy in this business segment
by focusing on domestic markets and expanding its range of value-added
products. This, coupled with a reduction in turnaround time of orders, has
enabled it to substantially increase its market share in the domestic market,
leading to an improved performance in India.
The South African
subsidiary, which did well in the first few months of the year, struggled in
the second half of the year due to lack of orders. This situation arose on
account of mining being adversely affected in South Africa as well as one of
its key customers preferring to import from low cost countries rather than
buying locally. Corrective steps were undertaken through redesign of product to
lower costs and offer a better solution to the customer.
Coated and Laminated Fabrics
The Laminated
Fabrics business saw entry of several new players during the year, with a blood
bath for market shares. This led to significant margin erosion in a highly
competitive industry, which saw a flat growth this year as against double digit
growth in previous years. But this being a cyclical business, one may expect to
see a more rational approach with regard to the market dynamics.
In the Coated Fabrics
business, many new products introduced by the Company settled down with better
prospects in the coming year. The Company is in the process of developing more
products, which shall be launched in the ensuing year.
Whilst this
business segment struggled during the year particularly due to slow down in the
transport sector where tarpaulins were the main stay of the business, the
prospect looks better as the market improves.
Industrial Yarn
SRF continues to hold its position in different applications of Industrial
Yarns with stable performance.
OUTLOOK
The NTCF volume is
likely to improve as the economy picks up in 2014-15. The assumption is based
on the fact that the business remained stable even during 2012-13, a year of
high radialisation (due to a strong push by the commercial vehicle producers
and tyre companies with new radial capacities) and marginal de-growth. It is,
therefore, natural to expect that the foundation business of the Company will
continue to make a significant contribution for years to come.
The fortunes of
the Laminated Fabrics segment are likely to gain traction as the demand picks
up in the second half of 14-15. In the Coated Fabrics segment, the recovery of
the transport sector and new product launches would spur an improved performance.
The prospect of a
resolution of the long pending issues with regard to mining and infrastructure
projects, in particular, augurs well for Belting Fabrics which are essentially
used as reinforcement in the conveyor belts. As a result, the business expects
higher volumes adding to both – the top and the bottom line.
STANDALONE
UNAUDITED FINANCIAL RESULTS FOR THE QUARTER / HALF YEAR ENDED 31ST
DECEMBER 2014
(Rs. In Millions)
|
Particulars |
3 Months Ended |
3 Months Ended |
9 Months Ended |
|
|
31.12.2014 |
30.09.2014 |
31.12.2014 |
|
|
Unaudited |
Unaudited |
Unaudited |
|
1.
Income from operations |
|
|
|
|
a) Net sales/ Income from operation (net of excise duty) |
8702.220 |
9168.700 |
27233.400 |
|
b) Other operating income |
113.600 |
113.000 |
285.000 |
|
Total
income from Operations(net) |
8815.800 |
9281.700 |
27518.400 |
|
2.Expenditure |
|
|
|
|
a) Cost of material consumed |
4727.100 |
5163.000 |
15103.50 |
|
b) Purchases of stock in trade |
107.400 |
98.000 |
275.000 |
|
c) Changes in inventories of finished goods,
work-in-progress and stock-in-trade |
2.500 |
(532.000) |
(467.700) |
|
d) Employees benefit expenses |
653.200 |
641.200 |
1909.800 |
|
e) Depreciation and amortization expenses |
519.200 |
521.500 |
1531.800 |
|
f) Power and Fuel |
833.600 |
947.100 |
2777.800 |
|
g) Other expenditure |
846.400 |
1095.500 |
2699.200 |
|
Total expenses |
7689.400 |
7934.300 |
23829.400 |
|
3. Profit from operations before other income and financial
costs |
1126.400 |
1347.400 |
3689.000 |
|
4. Other income |
48.200 |
45.700 |
398.300 |
|
5. Profit from ordinary activities before finance costs |
1174.600 |
1393.100 |
4087.300 |
|
6. Finance costs |
266.100 |
273.300 |
773.400 |
|
7. Net profit/(loss) from ordinary activities
after finance costs but before exceptional items |
908.500 |
1119.800 |
3313.900 |
|
8. Exchange Currency Fluctuation Loss/ (Gain) |
35.100 |
28.000 |
64.300 |
|
9. Profit from ordinary activities before tax Expense: |
873.400 |
1091.800 |
3249.600 |
|
10.Tax expenses |
|
|
|
|
-- Current Tax |
182.000 |
225.000 |
675.000 |
|
-- MAT (Credit) / Reversal |
266.100 |
16.400 |
(100.000) |
|
-- Deferred Tax |
102.900 |
81.900 |
241.300 |
|
11.Net Profit / (Loss) from
ordinary activities after tax (9-10) |
(56.100) |
768.500 |
(56.100) |
|
12.Extraordinary Items (net of tax expense) |
-- |
-- |
-- |
|
13.Net Profit / (Loss) for the period (11 -12) |
726.200 |
768.500 |
2489.400 |
|
14.Paid-up equity share capital (Nominal value Rs.10/- per share) |
574.200 |
574.200 |
574.200 |
|
15. Paid uo Debt Capital |
|
|
|
|
16. Reserve excluding Revaluation Reserves as per
balance sheet of previous accounting year |
|
|
|
|
17.i) Earnings per share (before extraordinary
items) of Rs.10/- each) (not annualised): |
|
|
|
|
(a) Basic and diluted |
12.64 |
13.38 |
43.35 |
|
18. Debt equity ratio ** |
|
|
|
|
19. Debt service coverage ratio
*** |
|
|
|
|
20. Interest service coverage
ratio **** |
|
|
|
|
|
|
|
|
|
A. Particulars of shareholding |
|
|
|
|
1. Public Shareholding |
|
|
|
|
- Number of shares |
27345000 |
27345000 |
27345000 |
|
- Percentage of shareholding |
47.62% |
47.62% |
47.62% |
|
2. Promoters and Promoters group Shareholding- |
|
|
|
|
a) Pledged /Encumbered |
|
|
|
|
Number of shares |
-- |
-- |
-- |
|
Percentage of shares (as a % of total shareholding of the
promoter and promoter group) |
-- |
-- |
-- |
|
Percentage of shares (as a % of total share capital of the
company) |
-- |
-- |
-- |
|
|
|
|
|
|
b) Non Encumbered |
|
|
|
|
Number of shares |
30075500 |
30075500 |
30075500 |
|
Percentage of shares (as a % of total shareholding of the promoter
and promoter group) |
100.00% |
100.00% |
100.00% |
|
Percentage of shares (as a % of total share capital of the
company) |
52.38% |
52.38% |
52.38% |
|
|
|
|
|
|
B.
Investor Complaints |
|
|
|
|
Pending at the beginning of the quarter |
1 |
|
|
|
Receiving during the quarter |
90 |
|
|
|
Disposed of during the quarter |
91 |
|
|
|
Remaining unreserved at the end of the quarter |
-- |
|
|
SEGMENT WISE
REVENUE, RESULTS AND CAPITAL EMPLOYED UNDER CLAUSE 41 OF THE LISTING AGREEMENT FOR
THE QUARTER / HALF YEAR ENDED 30TH SEPTEMBER 2014
(Rs. In Millions)
|
Particulars |
3
Months Ended |
3
Months Ended |
9
Months Ended |
|
|
31.12.2014 |
30.09.2014 |
31.12.2014 |
|
|
Unaudited |
Unaudited |
Unaudited |
|
1. Segment
Revenue |
|
|
|
|
a)
Technical Textiles Business (TTB) |
4184.000 |
4346.200 |
13072.800 |
|
b)
Chemicals and Polymers Business (CPB) |
3066.000 |
3195.800 |
9467.000 |
|
c)
Packaging Film Business (PFB) |
1587.700 |
1762.400 |
5046.700 |
|
Total segment
revenue |
8837.700 |
9304.400 |
27586.500 |
|
Less: Inter –
segment revenue |
21.900 |
22.700 |
68.100 |
|
Total income
from operations (net sales) |
8815.800 |
9281.700 |
27518.400 |
|
|
|
|
|
|
2. Segment
Results |
|
|
|
|
Profit/ (loss)
before tax and interest |
|
|
|
|
a)
Technical Textiles Business (TTB) |
414.400 |
516.500 |
1377.500 |
|
b)
Chemicals and Polymers Business (CPB) |
746.300 |
857.100 |
2371.600 |
|
c)
Packaging Film Business (PFB) |
69.400 |
160.000 |
335.400 |
|
Total segment
results |
1230.100 |
1533.600 |
4084.500 |
|
(Add)/Less:
Finance Costs |
266.100 |
273.300 |
773.400 |
|
Other
un-allocable expenditure net off un-allocable other operating income |
90.600 |
168.500 |
61.500 |
|
Total Profit
Before Tax |
873.400 |
1091.800 |
3249.600 |
|
|
|
|
|
|
3. Capital
Employed |
|
|
|
|
(Segment Assets
– Segment Liabilities) |
|
|
|
|
a) Technical Textiles Business (TTB) (Including Capital Work In
Progress Rs.284.100 Millions as at 31st March, 2014) |
11358.900 |
11144.100 |
11358.900 |
|
b) Chemicals and Polymers Business (CPB) (Including Capital Work In
Progress Rs.975.300 Millions as at 31st March, 2014) |
22266.500 |
20690.400 |
22266.500 |
|
c) Packaging Film Business (PFB) (Including Capital Work In Progress Rs.77.700
Millions as at 31st March, 2014) |
4302.100 |
4037.000 |
4302.100 |
|
Total
Capital Employed |
37927.500 |
35871.500 |
37927.500 |
|
Add
: Unallocable Assets Less Liabilities |
2179.300 |
4832.500 |
2179.300 |
|
|
|
|
|
|
Total
Capital Employed In the Company |
40106.800 |
40704.000 |
40106.800 |
INDEX OF CHARGES
|
Sr. No. |
Charge ID |
Date of Charge
Creation/Modification |
Charge amount
secured |
Charge Holder |
Address |
Service Request
Number (SRN) |
|
1 |
10523691 |
17/09/2014 |
1,222,800,000.00 |
THE BANK OF NOVA SCOTIA ASIA LIMITED |
1,
RAFFLES QUAY,, #20-01 NORTH TOWER, SINGAPORE, |
C25482464 |
|
2 |
10470481 |
17/12/2013 |
500,000,000.00 |
STATE BANK OF INDIA |
CAG BRANCH, 3RD FLOOR,SIGAPPI AACHI BUILDING,, RUKMINI LAKSHMIPATHY ROAD, EGMORE, CHENNAI, TAMIL NADU - 600008, INDIA |
B93613347 |
|
3 |
10453831 |
16/07/2014 * |
2,000,000,000.00 |
HDFC BANK LIMITED |
HDFC
BANK HOUSE, "A" BLOCK, VATIKA ATRIUM,, GOLF |
C15425101 |
|
4 |
10416615 |
03/04/2013 |
1,087,770,000.00 |
STANDARD CHARTERED BANK |
(ACTING AS AN SECURITY AGENT) C D U, NARAIN MANZIL, 23, BARAKHAMBA ROAD, NEW DELHI, DELHI - 110001, INDIA |
B72248024 |
|
5 |
10359022 |
08/10/2012 * |
300,000,000.00 |
DBS BANK LTD |
UPPER GROUND FLOOR, BIRLA TOWER, 25 BARAKHAMBA ROAD, NEW DELHI, DELHI - 110001, INDIA |
B61411591 |
|
6 |
10359024 |
08/10/2012 * |
1,000,000,000.00 |
DBS BANK LTD |
UPPER GROUND FLOOR, BIRLA TOWER, 25 BARAKHAMBA ROAD, NEW DELHI, DELHI - 110001, INDIA |
B61412284 |
|
7 |
10359025 |
08/10/2012 * |
1,250,000,000.00 |
DBS BANK LTD |
UPPER GROUND FLOOR, BIRLA TOWER, 25 BARAKHAMBA ROAD, NEW DELHI, DELHI - 110001, INDIA |
B61412615 |
|
8 |
10348917 |
08/10/2012 * |
480,000,000.00 |
STATE BANK OF INDIA |
3RD
FLOOR, SIGAPI ACHI BUILDING,, RUKMINI LAKSHMI |
B61060182 |
|
9 |
10269304 |
06/08/2012 * |
1,104,800,000.00 |
STATE BANK OF INDIA |
3RD
FLOOR, SIGAPI ACHI BUILDING, RUKMINI LAKSHMIP |
B45274453 |
|
10 |
10204921 |
06/08/2012 * |
380,000,000.00 |
STATE BANK OF INDIA |
3RD
FLOOR, SIGAPI ACHI BUILDING, RUKMINI LAKSHMIP |
B45374022 |
|
11 |
80011848 |
06/08/2012 * |
1,000,000,000.00 |
STATE BANK OF
INDIA |
3RD FLOOR,
SIGAPI ACHI BUILDING, RUKMINI LAKSHMIP |
B45274099 |
|
12 |
80011846 |
06/08/2012 * |
500,000,000.00 |
STATE BANK OF
MYSORE |
3,4&5, DDA
BUILDING, NEHRU PLACE, NEW DELHI, DELHI - 110019, INDIA |
B45363090 |
|
13 |
90056713 |
27/06/1997 * |
200,000,000.00 |
THE INDUSTRIAL
DEVELOPMENT BANK OF INDIA |
INDIAN RED CROSS
SOCIETY BLDG., 1; RED CROSS ROAD, NEW DELHI, DELHI - 110001, INDIA |
- |
|
14 |
90056604 |
29/01/1998 * |
250,000,000.00 |
GLOBAL TRUST
BANK LIMITED |
G - 36.,
CONNAUGHT CIRCUS, NEW DELHI, DELHI - 110001, INDIA |
- |
|
15 |
80007309 |
13/05/2014 * |
12,000,000,000.00 |
ICICI BANK
LIMITED |
BANDRA-KURLA
COMPLEX, MUMBAI, MAHARASHTRA - 400051, INDIA |
C04851051 |
|
16 |
90063650 |
14/05/1990 * |
13,370,000.00 |
INDUSTRIAL
FINANCE CORPORATION OF INDIA |
BANK OF BARODA BUILDING,
16; SANSAD MARG, NEW DELHI, DELHI - 110001, INDIA |
- |
|
17 |
90063615 |
18/02/1987 * |
9,000,000.00 |
GENERAL
INSURANCE CORPORATION OF INDIA |
INDUSTRIAL
ASSURANCE BLDG., CHURCHGATE, BOMBAY, MAHARASHTRA - 400020, INDIA |
- |
|
18 |
90056072 |
30/03/1993 * |
120,000,000.00 |
INDIAN BANK |
HARBOUR BRANCH,
MADRAS, TAMIL NADU - 600001, INDIA |
- |
|
19 |
90056070 |
23/04/1992 * |
120,000,000.00 |
INDIAN BANK |
HARBOUR BRANCH,
MADRAS, TAMIL NADU - 600001, INDIA |
- |
|
20 |
90063602 |
10/08/1990 * |
120,000,000.00 |
INDIAN BANK |
HARBOUR BRANCH,
MADRAS, TAMIL NADU, INDIA |
- |
*Date of modification Charges
FIXED ASSETS
·
Freehold Land
·
Leasehold Land
·
Roads
·
Buildings
·
Plant and Machinery
·
Furniture, Fixtures and Office Equipments
·
Vehicles
·
Goodwill
·
Technical Knowhow
·
Software
PRESS RELEASE
SRF Q3 PAT Stands at Rs. 726.200 MILLION
- All
the three businesses posted a growth in operating profits as compared to
CPLY
- EBIDTA
for the quarter is at Rs. 1693.800 million, a growth of 13% as compared to
CPLY
- Exchange Currency Fluctuation Loss of Rs. 35.100 million in Q3 2014-2015 vs a gain of 63.900 million in Q3 2013-14
- Board has approved an Interim Dividend of Rs. 5 per share
Gurgaon, 10th February 2015:
SRF Limited, a multi-business entity engaged in the manufacture
of chemical based industrial intermediates, posted a profit after tax (PAT) of
Rs. 726.200 million from Rs. 720.600 million during the third quarter ended
December 31, 2014 over the corresponding period last year (CPLY).
Net sales of SRF during the third quarter of 2014-15 increased marginally to
Rs. 8702.200 million against Rs. 8594.400 million during CPLY in spite of
reduction in commodity prices. SRF rsquo;s profit before tax (PBT) declined by
4.9% from Rs. 918.800 million to Rs. 873.400 million for Q3 due to increased
depreciation amp; interest expense. The financial results of SRF were approved
by the SRF Board in a meeting held this afternoon.
MD’s Comment on the
Q3 performance:
“The operations have performed as per expectations. While some adverse impact of the sharp fall in the commodity prices was felt in the current quarter, a residual impact will be experienced in the next quarter. The company continues its journey on the stated strategic path by making focused investments”
Segment Results
While the Technical Textiles Business recorded 6.2% decrease in its
segment revenue from Rs. 4461.600 million to Rs. 4184.000 million during the
period, its operating profit increased 7.5% from Rs. 385.300 million to Rs.
414.400 million.
The Chemicals amp; Polymers Business stood out with 13.57% increase in its
segment revenue from Rs. 2699.600 million to Rs. 3066.000 million during the Q3
period of 2014-15 over CPLY. Operating profit of the Chemicals amp; Polymers
Business also grew by 7.16% from Rs. 696.400 million to Rs. 746.300 million
during the period.
The Packaging Films Business reported an operating profit of Rs. 69.400 million
as compared to a loss of Rs.0.700 milion during corresponding period last year
(CPLY). Segment revenue of the Packaging Films Business rose 7.5% from Rs.
1476.900 million to Rs. 1587.700 million during the period.
CAPEX Approved
The board in its meeting approved capex proposals worth 250.000 million
(approximately) for enhancing the R amp;D capability of the chemical business
for faster turnaround of customer requests. In addition, a capex of Rs. 660.000
million (approximately) for modernization of Technical Textile Plant at Gwalior
was also approved.
Interim Dividend
In today rsquo;s meeting, the Board also approved an interim dividend at the rate of 50% amounting to Rs. 5 per share.
About SRF
Established in 1973, SRF as a group has today grown into a global entity with
operations in 3 countries. Apart from Technical Textiles Business, in which it
enjoys a global leadership position, SRF is a domestic leader in Refrigerants,
Engineering Plastics and Industrial Yarns as well. The company also enjoys a
significant presence among the key domestic manufacturers of Polyester Films
and Fluorospecialities. Building on its in-house R amp;D facilities for
Chemicals Business and Technical Textiles Business, the company strives to stay
ahead in business through innovations in operations and product development. A
winner of the prestigious Deming Application Prize for two of its businesses
namely Tyre Cord and Chemicals, SRF continues to redefine its work and
corporate culture with the TQM as its management way.
SRF acquires Global
DuPont™ Dymel® HFC 134a Pharma Business
- SRF owns the Dymel® brand
- SRF receives the technology
for setting up its own cGMP
- SRF becomes one of the
world’s few suppliers of the pharma grade of HFC 134a
Gurgaon, 1st January 2015:
SRF Ltd, a multi business entity and one of the leading manufacturers
of refrigerants in India, signed a binding agreement on 31 st December 2014 to
purchase the global 134a regulated medical pharmaceutical propellant business
from DuPont, a world leader in innovation and science. This DuPont
Fluorochemicals business is part of the Performance Chemicals segment which
DuPont anticipates separating by mid-2015. The acquisition comes into force
with immediate effect.
Under the transaction, SRF will own the DuPont Dymel® brand and will also receive the technology and know-how for setting up its own ‘current Good Manufacturing Practices’ (cGMP) facility for manufacturing HFC 134a Pharma grade. DuPont and SRF have entered an agreement under which DuPont will supply SRF with product until SRF’s production facility is approved.
SRF is the only Indian manufacturer of HFC 134a and also has the rare distinction of developing the product with indigenous technology. For SRF, this transaction provides immediate access to DuPont’s technology, brand and customers, thus enabling an instant entry into the niche pharmaceutical segment at a global level. SRF has two manufacturing facilities for HFCs in India. Through this transaction SRF would not only utilise its existing HFC 134a facilities better, but would also become one of the world’s few suppliers of the pharma grade of HFC 134a, a product with stringent purity and handling parameters, and superior margins.
In the long run, the access to the pharma segment allows SRF to move up the value chain and cater to the growing demand for the pharma grade HFC 134a, which, as per the global health standards, is approved as a long-term environment friendly alternative propellant for a growing number of medical applications.
Additionally, with the possibility of some drugs going off patent by 2019, it is likely that India will witness a significant growth in the demand of pharma grade of HFC 134a and SRF, as the only Indian supplier of the product, looks well positioned to reap the benefits.
Commenting on the transaction, Mr. Ashish Bharat Ram, Managing Director, SRF Ltd. stated, “This acquisition is in sync with our long term strategy to move up the value chain and will enable us to enter the niche pharma product segment. The growth in the Metered Dose Inhalers (MDI) sector is expected to be reasonably robust in the years to come and with India playing a major role in this sector we are ideally positioned to take benefit of this opportunity. This will also offer great synergy with our existing HFC plants going forward.”
Providing a rationale for the transaction Kathryn K. McCord,
Global Business Director, DuPont Fluorochemicals, said, “DuPont is making this
move to enable a stronger focus on developing and commercializing the company’s
new family of products.” She further added, “We believe this business is an
excellent fit for SRF, which already supplies to the pharmaceutical industry.”
CMT REPORT (Corruption, Money Laundering & Terrorism]
The Public Notice information has been collected from various sources
including but not limited to: The Courts,
1] INFORMATION ON
DESIGNATED PARTY
No exist designating subject or any of its beneficial owners,
controlling shareholders or senior officers as terrorist or terrorist organization
or whom notice had been received that all financial transactions involving
their assets have been blocked or convicted, found guilty or against whom a
judgement or order had been entered in a proceedings for violating
money-laundering, anti-corruption or bribery or international economic or
anti-terrorism sanction laws or whose assets were seized, blocked, frozen or
ordered forfeited for violation of money laundering or international
anti-terrorism laws.
2] Court Declaration :
No exist to suggest that subject is or was
the subject of any formal or informal allegations, prosecutions or other
official proceeding for making any prohibited payments or other improper
payments to government officials for engaging in prohibited transactions or
with designated parties.
3] Asset Declaration :
No records exist to suggest that the property or assets of the subject
are derived from criminal conduct or a prohibited transaction.
4] Record on Financial
Crime :
Charges or conviction
registered against subject: None
5] Records on Violation of
Anti-Corruption Laws :
Charges or
investigation registered against subject: None
6] Records on Int’l
Anti-Money Laundering Laws/Standards :
Charges or
investigation registered against subject: None
7] Criminal Records
No
available information exist that suggest that subject or any of its principals
have been formally charged or convicted by a competent governmental authority
for any financial crime or under any formal investigation by a competent government
authority for any violation of anti-corruption laws or international anti-money
laundering laws or standard.
8] Affiliation with
Government :
No record
exists to suggest that any director or indirect owners, controlling
shareholders, director, officer or employee of the company is a government
official or a family member or close business associate of a Government
official.
9] Compensation Package :
Our market
survey revealed that the amount of compensation sought by the subject is fair
and reasonable and comparable to compensation paid to others for similar
services.
10] Press Report :
No press reports / filings exists on
the subject.
CORPORATE GOVERNANCE
MIRA INFORM as part of its Due Diligence do provide comments on Corporate
Governance to identify management and governance. These factors often have been
predictive and in some cases have created vulnerabilities to credit
deterioration.
Our Governance Assessment focuses principally on the interactions
between a company’s management, its Board of Directors, Shareholders and other
financial stakeholders.
CONTRAVENTION
Subject is not known to have contravened any existing local laws,
regulations or policies that prohibit, restrict or otherwise affect the terms
and conditions that could be included in the agreement with the subject.
FOREIGN EXCHANGE RATES
|
Currency |
Unit
|
Indian Rupees |
|
US Dollar |
1 |
Rs. 61.79 |
|
|
1 |
Rs. 95.42 |
|
Euro |
1 |
Rs. 69.29 |
INFORMATION DETAILS
|
Information Gathered
by : |
HNA |
|
|
|
|
Analysis Done by
: |
DIV |
|
|
|
|
Report Prepared
by : |
JYO |
SCORE & RATING EXPLANATIONS
|
SCORE FACTORS |
RANGE |
POINTS |
|
HISTORY |
1~10 |
8 |
|
PAID-UP CAPITAL |
1~10 |
7 |
|
OPERATING SCALE |
1~10 |
8 |
|
FINANCIAL CONDITION |
|
|
|
--BUSINESS SCALE |
1~10 |
8 |
|
--PROFITABILITY |
1~10 |
7 |
|
--LIQUIDITY |
1~10 |
7 |
|
--LEVERAGE |
1~10 |
7 |
|
--RESERVES |
1~10 |
7 |
|
--CREDIT LINES |
1~10 |
7 |
|
--MARGINS |
-5~5 |
-- |
|
DEMERIT POINTS |
|
|
|
--BANK CHARGES |
YES/NO |
YES |
|
--LITIGATION |
YES/NO |
NO |
|
--OTHER ADVERSE INFORMATION |
YES/NO |
NO |
|
MERIT POINTS |
|
|
|
--SOLE DISTRIBUTORSHIP |
YES/NO |
NO |
|
--EXPORT ACTIVITIES |
YES/NO |
NO |
|
--AFFILIATION |
YES/NO |
YES |
|
--LISTED |
YES/NO |
YES |
|
--OTHER MERIT FACTORS |
YES/NO |
YES |
|
DEFAULTER |
|
|
|
--RBI |
YES/NO |
NO |
|
--EPF |
YES/NO |
NO |
|
TOTAL |
|
66 |
This score serves as a reference to assess
SC’s credit risk and to set the amount of credit to be extended. It is calculated
from a composite of weighted scores obtained from each of the major sections of
this report. The assessed factors and their relative weights (as indicated
through %) are as follows:
Financial
condition (40%) Ownership
background (20%) Payment record
(10%)
Credit history
(10%) Market trend (10%) Operational size
(10%)
RATING EXPLANATIONS
|
RATING |
STATUS |
PROPOSED CREDIT LINE |
|
|
>86 |
Aaa |
Possesses an extremely sound financial base with the strongest capability
for timely payment of interest and principal sums |
Unlimited |
|
71-85 |
Aa |
Possesses adequate working capital. No caution needed for credit
transaction. It has above average (strong) capability for payment of interest
and principal sums |
Large |
|
56-70 |
A |
Financial & operational base are regarded healthy. General
unfavourable factors will not cause fatal effect. Satisfactory capability for
payment of interest and principal sums |
Fairly Large |
|
41-55 |
Ba |
Overall operation is considered normal. Capable to meet normal
commitments. |
Satisfactory |
|
26-40 |
B |
Capability to overcome financial difficulties seems comparatively
below average. |
Small |
|
11-25 |
Ca |
Adverse factors are apparent. Repayment of interest and principal sums
in default or expected to be in default upon maturity |
Limited with
full security |
|
<10 |
C |
Absolute credit risk exists. Caution needed to be exercised |
Credit not
recommended |
|
-- |
NB |
New Business |
-- |
This report is issued at your request without any
risk and responsibility on the part of MIRA INFORM PRIVATE LIMITED (MIPL)
or its officials.