MIRA INFORM REPORT
|
Report No. : |
301465 |
|
Report Date : |
06.01.2015 |
IDENTIFICATION DETAILS
|
Name : |
NITCO LIMITED |
|
|
|
|
Registered
Office : |
Nitco House, Recondo Compound, Inside Municipal Asphalt Compound, S K
Ahire Marg, Worli, Mumbai – 400 030, |
|
|
|
|
Country : |
India |
|
|
|
|
Financials (as
on) : |
31.03.2014 |
|
|
|
|
Date of
Incorporation : |
25.07.1966 |
|
|
|
|
Com. Reg. No.: |
11-016547 |
|
|
|
|
Capital
Investment / Paid-up Capital : |
Rs. 546.993
Millions |
|
|
|
|
CIN No.: [Company Identification
No.] |
L26920MH1966PLC016547 |
|
|
|
|
IEC No.: |
Not Available |
|
|
|
|
TAN No.: [Tax Deduction & Collection
Account No.] |
MUMN09559E |
|
|
|
|
PAN No.: [Permanent Account No.] |
AAACN1674N |
|
|
|
|
Legal Form : |
A Public Limited Liability Company. The Company’s Shares are Listed on
the Stock Exchanges. |
|
|
|
|
Line of Business
: |
Subject is engaged in manufacturing and selling of various tile
products and also involved in real estate development activities. |
|
|
|
|
No. of Employees
: |
1061 (Approximately) |
RATING & COMMENTS
|
MIRA’s Rating : |
B (29) |
|
RATING |
STATUS |
PROPOSED CREDIT LINE |
|
|
26-40 |
B |
Capability to overcome financial difficulties seems comparatively
below average. |
Small |
|
Status : |
Moderate |
|
|
|
|
Payment Behaviour : |
Slow but correct |
|
|
|
|
Litigation : |
Clear |
|
|
|
|
Comments : |
Subject is an established company having moderate track record. Rating reflects moderate financial risk profile due to loss incurred
from its operation in the year 2014. However, trade relation are fair. Business is active. Payment terms
are slow but correct. The company can be considered for business dealing with some
caution. |
NOTES :
Any query related to this report can be made
on e-mail : infodept@mirainform.com
while quoting report number, name and date.
RBI DEFAULTERS’ LIST STATUS
Subject’s name is not enlisted as a defaulter
in the publicly available RBI Defaulters’ list.
EPF (Employee Provident Fund) DEFAULTERS’ LIST STATUS
Subject’s name is not enlisted as a defaulter
in the publicly available EPF (Employee Provident Fund) Defaulters’ list as of
31-03-2014.
INFORMATION DECLINED
Management non-cooperative (91-22-66164555)
LOCATIONS
|
Registered Office / Factory 1 : |
Nitco House, Recondo Compound, Inside Municipal Asphalt Compound, S K
Ahire Marg, Worli, Mumbai – 400 030, |
|
Tel. No.: |
91-22-24919922 / 66164555 |
|
Fax No.: |
91-22-66164657 |
|
E-Mail : |
|
|
Website : |
|
|
|
|
|
Head Office : |
86-A, 8th Floor, Maker Chambers III, Nariman Point, Mumbai
– 400 021, |
|
Tel. No.: |
91-22-67521555 |
|
Fax No.: |
91-22-66608248 |
|
|
|
|
Factory 2 : |
Ceramic tile
division Village Shrigaon, Taluka Alibaug, Post Poynad, District Raigad - 402108, Maharashtra, India |
|
|
|
|
Corporate Office / Factory 3: |
Marble division
(Mumbai) Nitco Marble Land, Plot no. 3, Kanjur village Road, Kanjur Marg (East), Mumbai – 400 078, Maharashtra, India |
|
|
|
|
Factory 4 : |
Marble division
(Silvassa) Survey No. 176, Village Silli, Silvassa – 330 396, Dadra and Nagar Haveli |
|
|
|
|
Showrooms : |
Located at
|
|
|
|
|
Branch Office : |
Located at
|
DIRECTORS
As on 31.03.2014
|
Name : |
Mr. Vivek Talwar |
|
Designation : |
Managing Director |
|
|
|
|
Name : |
Mr. Pradeep Saxena |
|
Designation : |
Director |
|
|
|
|
Name : |
Mr. Vishal Malik |
|
Designation : |
Director |
|
|
|
|
Name : |
Mr. Rohan Talwar |
|
Designation : |
Director |
|
|
|
|
Name : |
Mr. Rakesh Kumar |
|
Designation : |
Nominee Director |
KEY EXECUTIVES
|
Name : |
Mr. B. G. Borkar |
|
Designation : |
Chief Finance Officer |
|
|
|
|
Name : |
Mr. Ashok Goyal |
|
Designation : |
Chief Executive Officer |
|
|
|
|
Name : |
Mrs. Reena Raje |
|
Designation : |
Company Secretary and Compliance Officer |
MAJOR SHAREHOLDERS / SHAREHOLDING PATTERN
As on 30.09.2014
|
Category of Shareholders |
No. of Shares |
Percentage of Holding |
|
(A) Shareholding of Promoter and Promoter Group |
|
|
|
|
|
|
|
|
7957448 |
14.55 |
|
|
30082858 |
55.00 |
|
|
38040306 |
69.54 |
|
|
|
|
|
Total shareholding of Promoter and Promoter Group (A) |
38040306 |
69.54 |
|
(B) Public Shareholding |
|
|
|
|
|
|
|
|
2585 |
0.00 |
|
|
2151034 |
3.93 |
|
|
2153619 |
3.94 |
|
|
|
|
|
|
5029567 |
9.19 |
|
|
|
|
|
|
2488841 |
4.55 |
|
|
4586669 |
8.39 |
|
|
2400336 |
4.39 |
|
|
|
|
|
|
1379154 |
2.52 |
|
|
195901 |
0.36 |
|
|
825281 |
1.51 |
|
|
14505413 |
26.52 |
|
Total Public shareholding (B) |
16659032 |
30.46 |
|
Total (A)+(B) |
54699338 |
100.00 |
|
(C) Shares held by Custodians and against which Depository Receipts
have been issued |
|
|
|
|
0 |
0.00 |
|
|
0 |
0.00 |
|
|
0 |
0.00 |
|
Total (A)+(B)+(C) |
54699338 |
0.00 |

Shareholding
belonging to the category "Promoter and Promoter Group"
|
Sl.No. |
Name of the Shareholder |
Details of Shares held |
Total shares (including underlying shares assuming full conversion of
warrants and convertible securities) as a % of diluted share capital |
|
|
No. of Shares held |
As a % of grand total |
|||
|
1 |
Aurella Estates and Investments Private Limited |
2,56,76,949 |
46.94 |
46.94 |
|
2 |
Vivek Prannath Talwar |
63,23,669 |
11.56 |
11.56 |
|
3 |
Watco Engineering Company Private Limited |
16,16,712 |
2.96 |
2.96 |
|
4 |
Nitco Paints Private Limited |
15,98,299 |
2.92 |
2.92 |
|
5 |
Anjali Talwar |
5,43,146 |
0.99 |
0.99 |
|
6 |
Prannath Amarnath Talwar |
5,03,837 |
0.92 |
0.92 |
|
7 |
Rajeshwari Prannath Talwar Jointly with Prannath Talwar
and Vivek Talwar |
3,22,151 |
0.59 |
0.59 |
|
8 |
Rang Mandir Builders Private Limited |
2,80,269 |
0.51 |
0.51 |
|
9 |
Ushakiran Builders Private Limited |
2,09,417 |
0.38 |
0.38 |
|
10 |
Lavender Properties Private Limited |
2,08,072 |
0.38 |
0.38 |
|
11 |
Prakalp Properties Private Limited |
1,75,785 |
0.32 |
0.32 |
|
12 |
Eden Garden Builders Private Limited |
1,56,951 |
0.29 |
0.29 |
|
13 |
Lovraj Talwar |
87,301 |
0.16 |
0.16 |
|
14 |
Nitco Tiles and Marble Industries Andhra Private Limited |
85,517 |
0.16 |
0.16 |
|
15 |
Sanjnaa Talwar |
85,517 |
0.16 |
0.16 |
|
16 |
Enjoy Builders Private Limited |
72,646 |
0.13 |
0.13 |
|
17 |
Poonam Wasan |
62,562 |
0.11 |
0.11 |
|
18 |
Vivek Prannath Talwar HUF |
27,264 |
0.05 |
0.05 |
|
19 |
Northern India Tiles Corporation |
2,240 |
0.00 |
0.00 |
|
20 |
Northern India Tiles (Sales) Corporation |
1 |
0.00 |
0.00 |
|
21 |
A N Talwar HUF |
2,001 |
0.00 |
0.00 |
|
|
Total |
3,80,40,306 |
69.54 |
69.54 |
Shareholding
belonging to the category "Public" and holding more than 1% of the
Total No. of Shares
|
Sl. No. |
Name of the
Shareholder |
No. of Shares
held |
Shares as % of
Total No. of Shares |
Total shares
(including underlying shares assuming full conversion of warrants and
convertible securities) as a % of diluted share capital |
|
|
1 |
Prasam Trading and Finance
Private Limited |
1740042 |
3.18 |
3.18 |
|
|
2 |
Tusk Investments 2 Limited |
1837747 |
3.36 |
3.36 |
|
|
3 |
Sanjeev Raj Kapoor |
1200000 |
2.19 |
2.19 |
|
|
4 |
Agri Care Limited |
825281 |
1.51 |
1.51 |
|
|
5 |
Sea Glimpse Investments
Private Limited |
1247465 |
2.28 |
2.28 |
|
|
|
Total |
6850535 |
12.52 |
12.52 |
BUSINESS DETAILS
|
Line of Business : |
Subject is engaged in manufacturing and selling of various tile products
and also involved in real estate development activities. |
|
|
|
|
Products : |
Not Available |
|
|
|
|
Brand Names : |
Not Available |
|
|
|
|
Agencies Held : |
Not Available |
|
|
|
|
Exports : |
Not Divulged |
|
|
|
|
Imports : |
Not Divulged |
|
|
|
|
Terms : |
Not Divulged |
GENERAL INFORMATION
|
Suppliers : |
|
|||||||||||||||||||||||||||||||||||||||||||||||||||||||||||||||||||||||||||||||||||||||||||||||
|
|
|
|||||||||||||||||||||||||||||||||||||||||||||||||||||||||||||||||||||||||||||||||||||||||||||||
|
Customers : |
|
|||||||||||||||||||||||||||||||||||||||||||||||||||||||||||||||||||||||||||||||||||||||||||||||
|
|
|
|||||||||||||||||||||||||||||||||||||||||||||||||||||||||||||||||||||||||||||||||||||||||||||||
|
No. of Employees : |
1061 (Approximately) |
|||||||||||||||||||||||||||||||||||||||||||||||||||||||||||||||||||||||||||||||||||||||||||||||
|
|
|
|||||||||||||||||||||||||||||||||||||||||||||||||||||||||||||||||||||||||||||||||||||||||||||||
|
Bankers : |
|
|||||||||||||||||||||||||||||||||||||||||||||||||||||||||||||||||||||||||||||||||||||||||||||||
|
|
|
|||||||||||||||||||||||||||||||||||||||||||||||||||||||||||||||||||||||||||||||||||||||||||||||
|
Facilities : |
(Rs.
In Millions)
LONG TERM BORROWING The Company’s proposal
for restructuring of its debts was sanctioned by the Corporate Debt
Restructuring Empowered Group (CDREG) vide sanction letter dated December 26,
2012 read along with letter dated 31st December 2012. i. Term loans
include Working Capital Term Loan (WCTL) and Funded Interest Term loan
(FITL). ii. Loans
received from NBFCs and foreign bank have not been restructured. iii. Repayment of
term loan shall be in 32 structured quarterly installments commencing from
June 30, 2014 and carrying interest rate at 11.25%
per annum; repayment of WCTL shall be in 24 quarterly structured installments
commencing from June 30, 2014 and carrying
interest rate at 10.75% per annum; repayment of FITL shall be in 24 quarterly
structured installments commencing from
June 30, 2014 and carrying interest rate at 10.75% per annum; iv. Working
capital loan carries interest at 11% per annum. Security Offered i. The existing
term loans including new WCTL and FITL are secured by first pari passu charge
on the fixed assets and parri passu second charge on the current assets of
the Company. ii. The existing
and fresh working capital facilities are secured by the first pari passu
charge on current assets and second pari passu charge on fixed assets of the Company. iii. Lenders
having exclusive charge over securities prior to restructuring are continuing
to have exclusive charge over those securities post restructuring. iv. First pari passu
charge over all bank accounts of the Company, including the Trust and
Retention Accounts (and all sub- accounts thereof). v. Pledge of
shares in the Company held by both Mr. Vivek Talwar and Aurella Estates and
Investments Private Limited. vi. Personal
guarantee from Mr. Vivek Talwar and corporate guarantee from Aurella Estates
and Investments Private Limited for the entire debt of the Company including
the sacrifices made by the lenders. vii. The entire
debt is further secured by the corporate guarantees from certain subsidiaries
who hold real estate assets, offered as additional securities to lenders. Maturity profile
of Secured Term Loans is as below: (Rs. in Millions)
The CDR package
envisages disposal of certain real estate assets owned by the Company and
some of its subsidiaries which will be used for repayment of restructured
loan. |
|||||||||||||||||||||||||||||||||||||||||||||||||||||||||||||||||||||||||||||||||||||||||||||||
|
Auditors : |
|
|
Name : |
A Husein Noumanali and Company Chartered Accountant |
|
Address : |
Mumbai, Maharshtra, India |
|
|
|
|
Memberships : |
Not Available |
|
|
|
|
Collaborators : |
Not Available |
|
|
|
|
Subsidiaries : |
|
|
|
|
|
Fellow Subsidiaries |
|
|
|
|
|
Enterprises over which Key Managerial Personnel are able to exercise significant influence |
|
CAPITAL STRUCTURE
As on 31.03.2014
Authorised Capital :
|
No. of Shares |
Type |
Value |
Amount |
|
|
|
|
|
|
60000000 |
Equity Shares |
Rs.10/- each |
Rs. 600.000 Millions |
|
|
|
|
|
Issued, Subscribed & Paid-up Capital :
|
No. of Shares |
Type |
Value |
Amount |
|
|
|
|
|
|
54699338 |
Equity Shares |
Rs.10/- each |
Rs. 546.993
Millions |
|
|
|
|
|
Out of the above equity shares, 4,180,299
equity shares have been allotted pursuant to court approved schemes of amalgamation
/ merger for consideration other than cash and 22,099,206 equity shares have
been allotted during the year on preferential basis at a price of Rs.25.20 per
share (including premium of Rs. 15.20 per share) pursuant to the Corporate Debt
Restructuring Scheme
Terms, Rights, Preferences and restrictions attached to equity shares:
The Company has only one class of equity
shares having a face value of Rs. 10 per share. Each holder of equity share is
entitled to one vote on show of hands and in case of poll, one vote per equity
share. A member shall not have any right to vote whilst any call or other sum
shall be due and payable to the Company in respect of any of the shares of such
member. All equity shares of the Company rank pari passu in all respects
including the right to dividend.
Reconciliation of the number of shares and amount outstanding at the
beginning and at the end of the reporting period:
|
Particulars |
31.03.2014 |
|
Equity
shares at the beginning of the year |
32600132 |
|
Add:
Shares issued on account of Merger |
22099206 |
|
Equity shares at the end of the year |
54699338 |
The details of shareholder holding more than 5% shares (other than those
stated in above)
|
Particulars |
31.03.2014 |
|
|
|
No of Shares |
% held |
|
Aurella Estates and Investments Private Limited |
25676949 |
46.94 |
|
Vivek Prannath Talwar |
6323669 |
11.56 |
|
Prasam Trading And Finance Private Limited |
2514042 |
4.60 |
|
Rogers Asset Management Limited A/C Tusk Investments Fund 2 |
1937747 |
3.54 |
FINANCIAL DATA
[all figures are
in Rupees Millions]
ABRIDGED BALANCE
SHEET
|
SOURCES OF FUNDS |
31.03.2014 |
31.03.2013 |
31.03.2012 |
|
I.
EQUITY
AND LIABILITIES |
|
|
|
|
(1)Shareholders' Funds |
|
|
|
|
(a) Share Capital |
546.993 |
326.001 |
326.001 |
|
(b) Reserves & Surplus |
384.938 |
2161.367 |
4474.749 |
|
(c) Money
received against share warrants |
0.000 |
0.000 |
0.000 |
|
|
|
|
|
|
(2) Share Application money pending
allotment |
0.000 |
280.000 |
0.000 |
|
Total
Shareholders’ Funds (1) + (2) |
931.931 |
2767.368 |
4800.750 |
|
|
|
|
|
|
(3)
Non-Current Liabilities |
|
|
|
|
(a) long-term borrowings |
8679.186 |
11389.969 |
3006.165 |
|
(b) Deferred tax liabilities (Net) |
203.484 |
203.484 |
203.484 |
|
(c) Other long term
liabilities |
128.607 |
113.220 |
246.573 |
|
(d) long-term
provisions |
0.000 |
0.000 |
0.000 |
|
Total Non-current
Liabilities (3) |
9011.277 |
11706.673 |
3456.222 |
|
|
|
|
|
|
(4)
Current Liabilities |
|
|
|
|
(a) Short
term borrowings |
471.947 |
238.348 |
3215.919 |
|
(b) Trade
payables |
1551.320 |
844.240 |
4895.260 |
|
(c) Other
current liabilities |
3371.847 |
256.566 |
1183.133 |
|
(d) Short-term
provisions |
9.372 |
8.275 |
6.958 |
|
Total Current
Liabilities (4) |
5404.486 |
1347.429 |
9301.270 |
|
|
|
|
|
|
TOTAL |
15347.694 |
15821.470 |
17558.242 |
|
|
|
|
|
|
II.
ASSETS |
|
|
|
|
(1)
Non-current assets |
|
|
|
|
(a) Fixed
Assets |
|
|
|
|
(i)
Tangible assets |
6712.281 |
7095.441 |
7375.801 |
|
(ii)
Intangible Assets |
0.000 |
0.000 |
0.000 |
|
(iii)
Capital work-in-progress |
45.659 |
29.501 |
33.829 |
|
(iv)
Intangible assets under development |
0.000 |
0.000 |
0.000 |
|
(b) Non-current Investments |
312.375 |
312.375 |
118.408 |
|
(c) Deferred tax assets (net) |
0.000 |
0.000 |
0.000 |
|
(d) Long-term Loan and Advances |
1794.526 |
1776.597 |
1565.546 |
|
(e) Other
Non-current assets |
0.000 |
0.000 |
0.000 |
|
Total Non-Current
Assets |
8864.841 |
9213.914 |
9093.584 |
|
|
|
|
|
|
(2)
Current assets |
|
|
|
|
(a)
Current investments |
1.035 |
0.927 |
1.000 |
|
(b)
Inventories |
2003.468 |
2327.099 |
3893.651 |
|
(c)
Inventories – Real Estate |
1859.078 |
1860.077 |
1929.075 |
|
(c) Trade
receivables |
1275.663 |
950.056 |
953.315 |
|
(d) Cash
and cash equivalents |
134.435 |
232.802 |
570.809 |
|
(e)
Short-term loans and advances |
348.119 |
301.977 |
332.809 |
|
(f) Other
current assets |
861.055 |
934.618 |
783.999 |
|
Total
Current Assets |
6482.853 |
6607.556 |
8464.658 |
|
|
|
|
|
|
TOTAL |
15347.694 |
15821.470 |
17558.242 |
PROFIT & LOSS
ACCOUNT
|
|
PARTICULARS |
31.03.2014 |
31.03.2013 |
31.03.2012 |
|
|
|
SALES |
|
|
|
|
|
|
|
Income |
7594.519 |
7702.817 |
8400.589 |
|
|
|
Other Income |
4.407 |
7.117 |
3.636 |
|
|
|
TOTAL |
7598.926 |
7709.934 |
8404.225 |
|
|
|
|
|
|
|
|
Less |
EXPENSES |
|
|
|
|
|
|
|
Cost of Materials Consumed |
1516.523 |
1329.200 |
1757.798 |
|
|
|
Purchases of Stock-in-Trade |
3376.774 |
2212.298 |
4689.914 |
|
|
|
Changes in inventories of
finished goods, work-in-progress and Stock-in-Trade |
349.373 |
1731.763 |
(962.235) |
|
|
|
Employees benefits expense |
687.926 |
685.889 |
466.509 |
|
|
|
Other expenses |
1923.868 |
2147.115 |
1584.229 |
|
|
|
Exceptional l Items |
|
|
344.748 |
|
|
|
TOTAL |
7854.464 |
8106.265 |
7880.963 |
|
|
|
|
|
|
|
|
Less |
PROFIT/
(LOSS) BEFORE INTEREST, TAX,
DEPRECIATION AND AMORTISATION |
(255.538) |
(396.331) |
523.262 |
|
|
|
|
|
|
|
|
|
Less |
FINANCIAL
EXPENSES |
1436.930 |
1516.739 |
751.139 |
|
|
|
|
|
|
|
|
|
|
PROFIT/
(LOSS) BEFORE TAX, DEPRECIATION AND AMORTISATION |
(1692.468) |
(1913.070) |
(227.877) |
|
|
|
|
|
|
|
|
|
Less/ Add |
DEPRECIATION/
AMORTISATION |
419.869 |
400.313 |
326.587 |
|
|
|
|
|
|
|
|
|
|
PROFIT/ (LOSS)
BEFORE TAX |
(2112.337) |
(2313.383) |
(554.464) |
|
|
|
|
|
|
|
|
|
Less |
TAX |
0.000 |
0.000 |
0.000 |
|
|
|
|
|
|
|
|
|
|
PROFIT/ (LOSS)
AFTER TAX |
(2112.337) |
(2313.383) |
(554.464) |
|
|
|
|
|
|
|
|
|
Add |
PREVIOUS
YEARS’ BALANCE BROUGHT FORWARD |
(1594.583) |
718.800 |
1273.264 |
|
|
|
|
|
|
|
|
|
|
BALANCE CARRIED
TO THE B/S |
(3706.920) |
(1594.583) |
718.800 |
|
|
|
|
|
|
|
|
|
|
EARNINGS IN
FOREIGN CURRENCY |
|
|
|
|
|
|
|
F.O.B. Value of Exports |
153.819 |
122.025 |
83.527 |
|
|
|
Revenue from Carbon Credits |
0.000 |
1.349 |
1.329 |
|
|
|
TOTAL
EARNINGS |
153.819 |
123.374 |
84.856 |
|
|
IMPORTS |
|
|
|
|
|
|
|
Goods for Resale |
247.406 |
635.012 |
3320.054 |
|
|
|
Raw Materials |
344.114 |
334.811 |
234.028 |
|
|
|
Components and Stores parts |
22.600 |
40.900 |
2.833 |
|
|
|
Capital Goods |
55.298 |
64.746 |
44.149 |
|
|
|
TOTAL
IMPORTS |
667.418 |
1075.469 |
3601.064 |
|
|
|
|
|
|
|
|
|
Earnings Per
Share (Rs.) |
(55.41) |
(70.96) |
(17.01) |
|
KEY RATIOS
|
PARTICULARS |
|
31.03.2014 |
31.03.2013 |
31.03.2012 |
|
Net Profit Margin (PAT/Sales) |
(%) |
(27.81) |
(30.03) |
(6.60) |
|
|
|
|
|
|
|
Operating Profit Margin (PBDIT / Sales) |
(%) |
(3.36) |
(5.15) |
6.23 |
|
|
|
|
|
|
|
Return on Total Assets (PBT/Total Assets} |
(%) |
(14.09) |
(14.94) |
(3.19) |
|
|
|
|
|
|
|
Return on Investment (ROI) (PBT/Networth) |
|
(2.27) |
(0.84) |
(0.12) |
|
|
|
|
|
|
|
Debt Equity Ratio (Total Debt /Networth) |
|
9.82 |
4.20 |
1.30 |
|
|
|
|
|
|
|
Current Ratio (Current Asset/Current Liability) |
|
1.20 |
4.90 |
0.91 |
FINANCIAL ANALYSIS
[all figures are
in Rupees Millions]
DEBT EQUITY RATIO
|
Particular |
31.03.2012 |
31.03.2013 |
31.03.2014 |
|
|
(Rs.
In Millions) |
(Rs.
In Millions) |
(Rs.
In Millions) |
|
Share Capital |
326.001 |
326.001 |
546.993 |
|
Reserves & Surplus |
4474.749 |
2161.367 |
384.938 |
|
Share
Application money pending allotment |
0.000 |
280.000 |
0.000 |
|
Net
worth |
4800.750 |
2767.368 |
931.931 |
|
|
|
|
|
|
long-term borrowings |
3006.165 |
11389.969 |
8679.186 |
|
Short term borrowings |
3215.919 |
238.348 |
471.947 |
|
Total
borrowings |
6222.084 |
11628.317 |
9151.133 |
|
Debt/Equity
ratio |
1.296 |
4.202 |
9.820 |

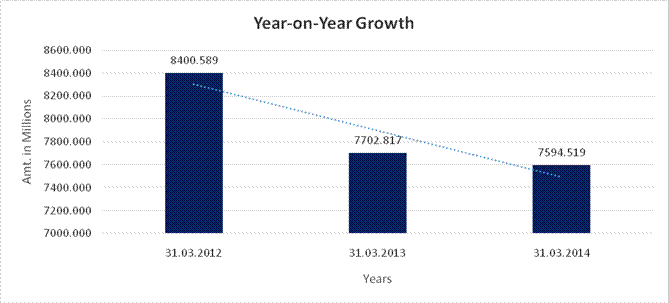
YEAR-ON-YEAR GROWTH
|
Year
on Year Growth |
31.03.2012 |
31.03.2013 |
31.03.2014 |
|
|
(Rs.
In Millions) |
(Rs.
In Millions) |
(Rs.
In Millions) |
|
Sales |
8400.589 |
7702.817 |
7594.519 |
|
|
|
(8.306) |
(1.406) |
NET PROFIT MARGIN
|
Net
Profit Margin |
31.03.2012 |
31.03.2013 |
31.03.2014 |
|
|
(Rs.
In Millions) |
(Rs.
In Millions) |
(Rs.
In Millions) |
|
Sales |
8400.589 |
7702.817 |
7594.519 |
|
Profit |
(554.464) |
(2313.383) |
(2112.337) |
|
|
(6.60)% |
(30.03)% |
(27.81)% |

LOCAL AGENCY FURTHER INFORMATION
CURRENT MATURITIES OF
LONG-TERM DEBT
Rs. In Millions
|
Particular |
31.03.2014 |
31.03.2013 |
31.03.2012 |
|
|
|
|
|
|
Current maturities of long-term debt |
3364.862 |
160.480 |
986.271 |
|
|
|
|
|
|
Sr. No. |
Check List by Info Agents |
Available in
Report (Yes / No) |
|
1] |
Year of Establishment |
Yes |
|
2] |
Locality of the firm |
Yes |
|
3] |
Constitutions of the firm |
Yes |
|
4] |
Premises details |
No |
|
5] |
Type of Business |
Yes |
|
6] |
Line of Business |
Yes |
|
7] |
Promoter's background |
No |
|
8] |
No. of employees |
Yes |
|
9] |
Name of person contacted |
No |
|
10] |
Designation of contact
person |
No |
|
11] |
Turnover of firm for last
three years |
Yes |
|
12] |
Profitability for last
three years |
Yes |
|
13] |
Reasons for variation
<> 20% |
---------------------- |
|
14] |
Estimation for coming
financial year |
No |
|
15] |
Capital in the business |
Yes |
|
16] |
Details of sister
concerns |
Yes |
|
17] |
Major suppliers |
No |
|
18] |
Major customers |
No |
|
19] |
Payments terms |
No |
|
20] |
Export / Import details
(if applicable) |
No |
|
21] |
Market information |
---------------------- |
|
22] |
Litigations that the firm
/ promoter involved in |
---------------------- |
|
23] |
Banking Details |
Yes |
|
24] |
Banking facility details |
Yes |
|
25] |
Conduct of the banking
account |
---------------------- |
|
26] |
Buyer visit details |
---------------------- |
|
27] |
Financials, if provided |
Yes |
|
28] |
Incorporation details, if
applicable |
Yes |
|
29] |
Last accounts filed at
ROC |
Yes |
|
30] |
Major Shareholders, if
available |
Yes |
|
31] |
Date of Birth of Proprietor/Partner/Director,
if available |
No |
|
32] |
PAN of
Proprietor/Partner/Director, if available |
No |
|
33] |
Voter ID No of
Proprietor/Partner/Director, if available |
No |
|
34] |
External Agency Rating,
if available |
No |
UNSECURED LOAN
(Rs.
In Million)
|
Particulars |
As
on 31.03.2014 |
As
on 31.03.2013 |
|
Short Term
Borrowing |
|
|
|
From Banks |
0.000 |
37.500 |
|
Total |
0.000 |
37.500
|
INDEX OF CHARGES
|
S.No. |
Charge ID |
Date of Charge
Creation/Modification |
Charge amount secured |
CHARGE HOLDER |
ADDRESS |
Service Request
Number (SRN) |
|
1 |
10438345 |
30/10/2013 * |
17,921,000,000.00 |
IDBI TRUSTEESHIP
SERVICES LIMITED |
ASIAN BUILDING,
GROUND FLOOR, 17, R. KAMANI MARG, |
B89377253 |
|
2 |
10423135 |
30/06/2014 * |
17,921,000,000.00 |
JM FINANCIAL
ASSET RECONSTRUCTION COMPANY PRIVATE |
7TH FLOOR,
CNERGY, APPASAHEB MARATHE MARG, PRABHADEVI, MUMBAI, MAHARASHTRA - 400025,
INDIA |
C29381068 |
|
3 |
10364819 |
25/06/2012 |
200,000,000.00 |
CATHOLIC SYRIAN
BANK LIMITED |
INDUSTRIAL
FINANCE BRANCH, 53 EAST AND WEST, BUILDING, MUMBAI SAMACHAR MARG, FORT,
MUMBAI, MAHARASHTRA - 400023, INDIA |
B43340512 |
|
4 |
10364821 |
25/06/2012 |
150,000,000.00 |
INDIAN OVERSEAS BANK |
RADHASWAMI
APARTMENTS, T. P. S.- III, 36TH ROAD, BANDRA (WEST), MUMBAI, MAHARASHTRA -
400050, INDIA |
B43343680 |
|
5 |
10343133 |
25/06/2012 * |
200,000,000.00 |
DENA BANK |
SHARE BAZAR
BRANCH, AMBALAL DOSHI MARG, MUMBAI, MAHARASHTRA - 400023, INDIA |
B43339712 |
|
6 |
10335519 |
23/01/2012 |
250,000,000.00 |
STATE BANK OF
TRAVANCORE |
COMMERCIAL
BRANCH, 3RD FLOOR, VAYUDHOOT CHAMBERS |
B32109878 |
|
7 |
10320369 |
25/10/2011 |
200,000,000.00 |
IDBI BANK
LIMITED |
MITTAL COURT,
224 A- WING, 2ND FLOOR, NARIMAN POINT, MUMBAI, MAHARASHTRA - 400021, INDIA |
B26465039 |
|
8 |
10311846 |
26/09/2011 |
200,000,000.00 |
TATA CAPITAL
LIMITED |
ONE FORBES, DR V
B GANDHI MARG,FORT, MUMBAI, MAHARASHTRA - 400001, INDIA |
B23173859 |
|
9 |
10312745 |
26/09/2011 |
250,000,000.00 |
CORPORATION BANK |
FORT-MID
CORPORATE BRANCH, VEENA CHAMBERS, 21, DALAL STREET, FORT, MUMBAI, MAHARASHTRA
- 400023, INDIA |
B23429335 |
|
10 |
10312794 |
26/09/2011 |
200,000,000.00 |
STATE BANK OF
HYDERABAD |
11-C MITTAL
TOWER, 210, NARIMAN POINT, MUMBAI, |
B23438187 |
|
11 |
10311218 |
20/09/2011 |
200,000,000.00 |
TATA CAPITAL
LIMITED |
ONE FORBES, DR V
B GANDHI MARG,FORT, MUMBAI, MAHARASHTRA - 400001, INDIA |
B22955629 |
|
12 |
10297236 |
30/06/2011 |
150,000,000.00 |
LAKSHMI VILAS
BANK LIMITED |
64, DR. V. B.
GANDHI MARG, P. B. NO. 1783, FORT, MUMBAI, MAHARASHTRA - 400001, INDIA |
B16790255 |
|
13 |
10296556 |
26/09/2011 * |
150,000,000.00 |
LAKSHMI VILAS
BANK LIMITED |
64, DR. V. B.
GANDHI MARG P. B. NO. 1783, FORT, MUMBAI, MAHARASHTRA - 400001, INDIA |
B22959548 |
|
14 |
10293622 |
27/05/2011 |
200,000,000.00 |
L & T
FINANCE LIMITED |
L&T HOUSE, BALLARD
ESTATE, MUMBAI, MAHARASHTRA |
B15521222 |
|
15 |
10284961 |
21/04/2011 |
80,000,000.00 |
TATA CAPITAL
LIMITED |
ONE FORBES, DR V
B GANDHI MARG,FORT, MUMBAI, MAHARASHTRA - 400001, INDIA |
B11942281 |
|
16 |
10278317 |
17/03/2011 |
190,000,000.00 |
CORPORATION BANK |
FORT-MID
CORPORATE BRANCH, VEENA CHAMBERS, 21, DA |
B09942962 |
|
17 |
10274443 |
22/02/2011 |
250,000,000.00 |
STATE BANK OF
HYDERABAD |
11-C, MITTAL TOWER,,
210, NARIMAN POINT, MUMBAI, |
B08545600 |
|
18 |
10258122 |
22/02/2011 * |
300,000,000.00 |
IDBI BANK
LIMITED |
MITTAL COURT,
224 A- WING, 2ND FLOOR, NARIMAN POINT, MUMBAI, MAHARASHTRA - 400021, INDIA |
B08585523 |
|
19 |
10251769 |
28/10/2010 |
150,000,000.00 |
INDIAN OVERSEAS
BANK |
RADHASWAMI
APARTMENTS, T. P. S.- III, 36TH ROAD, BANDRA (WEST), MUMBAI, MAHARASHTRA -
400050, IND |
A98586134 |
|
20 |
10251772 |
07/10/2010 |
150,000,000.00 |
INDIAN OVERSEAS
BANK |
RADHASWAMI
APARTMENTS, T. P. S.- III, 36TH ROAD, BANDRA (WEST), MUMBAI, MAHARASHTRA -
400050, INDIA |
A98586480 |
|
21 |
10224600 |
21/04/2010 |
700,000,000.00 |
AXIS BANK
LIMITED |
UNIT 6, CORPORATE
PARK,, SION TROMBAY ROAD, CHEMBUR, MUMBAI, MAHARASHTRA - 400071, INDIA |
A87264370 |
|
22 |
10209932 |
11/03/2010 |
200,000,000.00 |
VIJAYA BANK |
INDUSTRIAL
FINANCE BRANCH, WALLACE STREET,, NEW E |
A81779647 |
|
23 |
10208772 |
11/03/2010 |
200,000,000.00 |
STATE BANK OF
MYSORE |
DALAL STREET
BRANCH, 24/26,, CAMA BUILDING, FORT, |
A81456964 |
|
24 |
10208943 |
11/03/2010 |
300,000,000.00 |
STATE BANK OF
HYDERABAD |
11-C, MITTAL
TOWER, 210, NARIMAN POINT, MUMBAI, |
A81662835 |
|
25 |
10195048 |
11/03/2010 * |
200,000,000.00 |
CATHOLIC SYRIAN
BANK LIMITED |
INDUSTRIAL FINANCE
BRANCH, 53 EAST AND WEST, BUIL |
A82243627 |
|
26 |
10186000 |
11/03/2010 * |
250,000,000.00 |
STATE BANK OF
INDORE |
STERLING CENTER,
DR. ANNIE BESANT ROAD, WORLI, MUMBAI, MAHARASHTRA - 400018, INDIA |
A82435710 |
|
27 |
10167299 |
09/07/2009 |
1,830,000.00 |
BANK OF INDIA |
21-22, TURNER
ROAD, BANDRA (WEST), MUMBAI, MAHARASHTRA - 400050, INDIA |
A65493157 |
|
28 |
10163557 |
30/06/2014 * |
250,000,000.00 |
JM FINANCIAL
ASSET RECONSTRUCTION COMPANY PRIVATE |
7TH FLOOR,
CNERGY, APPASAHEB MARATHE MARG, PRABH |
C29380466 |
|
29 |
10164118 |
18/08/2009 * |
402,400,000.00 |
IDBI TRUSTEESHIP
SERVICES LIMITED |
ASIAN BLDG,
GROUND FLOOR, 17, R.KAMANI MARG, BA |
A69851970 |
|
30 |
10136102 |
31/12/2008 |
300,000,000.00 |
STATE BANK OF
PATIALA |
COMMERCIAL BRANCH,
ATLANTA 1ST FLOOR, JAMANALAL |
A53712659 |
|
31 |
10131966 |
30/06/2014 * |
250,000,000.00 |
JM FINANCIAL
ASSET RECONSTRUCTION COMPANY PRIVATE |
7TH FLOOR, CNERGY,
APPASAHEB MARATHE MARG, PRABHADEVI, MUMBAI, MAHARASHTRA - 400025, INDIA |
C29379583 |
|
32 |
10132539 |
03/11/2008 |
300,000,000.00 |
STATE BANK OF
PATIALA |
ATLANTA, 1ST
FLOOR, JAMNALAL BAJAJ MARG NARIMAN |
A51833879 |
|
33 |
10123137 |
30/12/2008 * |
300,000,000.00 |
EXPORT IMPORT
BANK OF INDIA |
CENTRE ONE
BUILDING, FLOOR 21 WORLD TRADE CENTRE, |
A54012943 |
|
34 |
10069102 |
15/11/2007 * |
250,000,000.00 |
LIFE INSURANCE
CORPORATION OF INDIA |
"YOGAKSHEMA",
JEEVAN BIMA MARG, POST BOX NO. 19953, MUMBAI, MAHARASHTRA - 400021, INDIA |
A26936005 |
|
35 |
10059494 |
03/07/2007 |
250,000,000.00 |
STATE BANK OF
INDORE |
STERLING CENTER,
WORLI, MUMBAI, MAHARASHTRA - 400018, INDIA |
A18841726 |
|
36 |
10043246 |
09/03/2007 |
250,000,000.00 |
STATE BANK OF
INDORE |
STERLING CENTER,
DR. ANNIE BESANT ROAD, WORLI, MUMBAI 400018, MUMBAI, MAHARASHTRA - 400018,
INDIA |
A12870697 |
|
37 |
90243986 |
24/12/2005 |
65,000,000.00 |
UTI BANK LIMITED |
RETAIL ASSETS
CENTRE COURT CHAMBERS, NEW MARINE L |
- |
|
38 |
90241650 |
17/11/2005 |
450,000,000.00 |
PUNJAB NATIONAL
BANK |
RAHEJA CHAMBER; 1ST
FLOOR; NARIMON POINT, MUMBAI, |
- |
|
39 |
90241229 |
08/10/2008 * |
324,500,000.00 |
CORPORATION BANK |
INDUSTRIAL
FINANCE BRANCH, BHARAT HOUSE, NO.104, |
A53650115 |
|
40 |
90218564 |
16/04/2004 |
50,000,000.00 |
PUNJABA NATIONAL
BANK |
GEN J BHOSALE
MARG; NARIMAN POINT, MUMBAI, MAHARASHTRA - 400021, INDIA |
- |
|
41 |
90218383 |
22/12/2000 |
16,000,000.00 |
PUNJAB NATIONAL
BANK |
FORESHORE ROAD BRANCH;
BENA VISTA; GEN J BHOSALE, |
- |
|
42 |
90238345 |
25/11/2005 * |
202,000,000.00 |
PUNJAB NATIONAL
BANK |
FORESHORE
BRANCH; RAHEJA CHAMBER; NARIMON POINT, MUMBAI, MAHARASHTRA - 400021, INDIA |
- |
|
43 |
90218303 |
04/11/1999 |
202,000,000.00 |
PUNJAB NATIONAL
BANK |
GEN JAGANNATH
BHOSALE MARG, MUMBAI, MAHARASHTRA - |
- |
|
44 |
90218179 |
30/06/2014 * |
8,218,200,000.00 |
JM FINANCIAL
ASSET RECONSTRUCTION COMPANY PRIVATE |
7TH FLOOR,
CNERGY,, APPASAHEB MARATHE MARG, PRABH |
C29382272 |
|
45 |
90244265 |
30/06/2014 * |
324,500,000.00 |
JM FINANCIAL
ASSET RECONSTRUCTION COMPANY PRIVATE |
7TH FLOOR, CNERGY,APPASAHEB
MARATHE MARG, PRABH |
C34296848 |
|
46 |
90218070 |
30/06/2014 * |
8,218,200,000.00 |
JM FINANCIAL
ASSET RECONSTRUCTION COMPANY PRIVATE |
7TH FLOOR, CNERGY,,
APPASAHEB MARATHE MARG, PRABHADEVI, MUMBAI, MAHARASHTRA - 400025, INDIA |
C29381472 |
|
47 |
90218006 |
04/07/2003 * |
225,271,000.00 |
PUNJAB NATIONAL
BANK |
GEN ; J BHOSALE
MARG; NARIMAN POINT, MUMBAI, MAHAR |
- |
|
48 |
90238293 |
28/09/2012 * |
4,625,000,000.00 |
PUNJAB NATIONAL
BANK |
FORESHORE ROAD
BRANCH, RAHEJA CHAMBERS, NARIMAN |
B62268958 |
|
49 |
90216982 |
03/05/1985 |
100,000,000.00 |
PUNJABA NATIONAL
BANK |
FORE SHORE ROAD,
MUMBAI, MAHARASHTRA, INDIA |
- |
* Date of charge modification
REVIEW OF OPERATION
The Company’s business model until FY11-12 was
dependent on large imports of vitrified tiles from China. However, sudden steep
drop in the value of rupee vs USD towards later part of FY 11-12, rendered the
business of import of vitrified tiles and distribution within India unviable.
The Company at that time was saddled with large inventories which were imported
at a higher cost (due to rupee depreciation) and had to take steps to liquidate
the inventories at a loss. The Company thereafter took steps to move away from
China based sourcing strategy to domestic led sourcing. The China led sourcing
strategy required setting up a huge infrastructure in terms of mother
warehouses and regional depots across the country to facilitate distribution of
imported tiles. With imports suddenly becoming unviable, Company had to deal
with high distribution costs which had to be scaled down gradually in line with
reduction in the inventory. Being a brick and mortar Company, this significant
change in the business model has taken time to correct and has resulted in
adverse performance during the last two financial years.
The slump in real estate and overall state of the
economy has made a quick revival that much more time consuming. Due to
competitive pressures and subdued state of the economy, sales volume could not
be increased as desired Consequently the gross sales of the Company during the
year ended 31st March 2014 has dropped to Rs. 8401.900 Millions as
against Rs. 8779.800 Millions during the previous year ended 31st March 2013.
The power and fuel costs which form a
significant part of the manufacturing costs in the tile industry have
relentlessly increased every month which could not be fully passed on resulting
in losses at the EBITDA level. Despite lower sales, due to strict control on
other costs, the EBITDA loss for FY 13-14 was lower at Rs. 255.500 Millions as
compared to Rs. 396.400 Millions during the previous year. The impact of
increased fuel costs on own manufacturing was Rs. 126.300 Millions and increase
in the procurement cost from vendors on account of fuel cost increase was Rs.
64.000 Millions. Thus the total impact of increased fuel costs on the financials
of the Company was Rs. 190.300 Millions and was the main reason for the EBITDA
losses incurred during the year.
Due to significant losses incurred during last
two financial years, the net worth of the Company has been eroded by more than
50% and it will require reference to BIFR. Considering the tremendous brand
equity enjoyed by the Company, non core assets identified for sale, and several
steps taken for improving the performance of the Company, the management is
hopeful of a turnaround in near future. The management therefore believes, it
is appropriate to prepare the financial statement on a going concern basis.
MANAGEMENT
DISCUSSION AND ANALYSIS
GLOBAL
ECONOMY
The
global GDP growth decelerated for the third year on the trot – 3.9% in 2011 to
3.1% in 2012 and 3% in 2013. In the aftermath of the financial crisis, most
developed economies continued to address challenges by taking appropriate
remedial actions in terms of fiscal policies. Besides, a number of emerging
economies, which had already experienced a slowdown in the past two years,
encountered new domestic and international headwinds.
INDIAN ECONOMY
India’s
economic growth rate in 2013-14 stood at 4.70%, higher than the 4.50% growth
reported in the previous fiscal, mainly on account of an improved performance
in the agriculture and allied sectors. According to the CSO’s advance
estimates, the electricity, gas and water supply segment grew 5.9 per cent,
more than double the 2.3 per cent growth in 2012-13. Trade, hotels, transport
and communication increased three per cent, against 5.1 per cent in 2012-13.,
as against 5.1 per cent in the previous financial year. Community, social and
personal services, largely supported by the government, grew 5.6 per cent,
against 5.3 per cent in 2012-13.
GLOBAL CERAMIC TILES INDUSTRY
The
global ceramic tiles industry was valued at USD 55.79 billion in 2011 and is
expected to reach USD 102.79 billion by 2018, growing at a 9.2% CAGR. In terms
of volumes, demand for ceramic tiles stood at 10,370 million m in 2011 and is
expected to reach 18,154 million m by 2018, growing at a CAGR of 8.4%.
Demand
for ceramic tiles was driven by the growing construction and infrastructure
industries, mainly in the Asian economies of China, India and Indonesia.
There was a discernible shift towards replacing paints, metal slabs,
marble floors and other home decorative products with ceramic tiles. However,
volatility in raw material prices and tightening of regulatory guidelines
to address growing environmental concerns increased production
costs for ceramic tiles manufacturers.
Floor
tiles are expected to be the fastest growing segment of the ceramic tiles
market, growing at an estimated CAGR of 9.4% over the next five years. The wall
tiles segment is expected to lose its pole position to floor tiles by 2018.
INDIAN CERAMIC TILES INDUSTRY
The
Indian ceramic tiles industry grew by around 11% in 2013-14. The industry is
expected to reach a size of Rs. 301 billion by 2016, growing at a 15% CAGR market was ranked third globally and accounted for over 6% of the total global production. The organized segment made up approximately 50% of the sector; the top eight manufacturers constituted over 75% of the organised market.
TRENDS IN THE CERAMIC TILES MARKET IN INDIA
Introduction of nanotechnology: Use
of nanotechnology helped enhance shelf life and tile strength, making tiles
resistant to dirt and bacteria. These tiles are gaining popularity in areas
where hygiene is important - hospitals, laboratories and food processing
plants, among others.
Eco-friendly tiles: Use
of ecofriendly tiles is expected to increase as consumers become more
environment conscious. Eco-friendly tiles are usually made from natural and
renewable substances.
Designer tiles and introduction of 3D
tiles: Tiles are becoming a style statement and used in bedroom
and living room walls as well. 3D tiles are also being used for outdoor
cladding, wall cladding and elevations, among others.
Shift towards vitrified tiles:
Vitrified tiles, comprising nearly 50% of the ceramic tiles market, witnessed
increasing growth over the past five years due to durability and easy
maintenance
DEMAND DRIVERS
The
ceramic tiles market is driven by rapid urbanisation, a taste for high-end
tiles, the increasing share of pucca houses in India and a growing share of
tiles as flooring material. The share of pucca households is expected to
increase from 63% in 2011 to 79% in 2021. The share of tiles used in flooring
material has increased from
7% in
2001 to over 10% in 2011 and expected to reach 16% by 2021.
Some
of the other demand drivers include:
Increasing population:
India’s current population of 1.27 billion is growing annually at a rate of
1.58%.
Urbanisation: The
2011 census states that there are 53 million-plus cities accounting for 43% of
India’s urban population. The number of towns in India increased from 5,161 in
2001 to 7,935 in 2011. India’s current urban population of Rs.410.00 million
people is expected to grow to
Rs.
814.000 million by 2050.
Real estate sector growth: The
market size of the Indian real estate sector stood at USD 55.6 billion in
2010-11 and expected to touch USD 180 billion by 2020, with Tier-I cities
expected to account for about 40% of this growth.
Rising incomes:
India’s per capita income is projected to soar by 10.4% to Rs 0.075 million in
2013-14 from Rs
0.069 million in 2012-13.
• Rising middle class segment: India’s
middle-class segment could swell to 250 million or 20% of the
country’s
population by 2015. The growth in this segment will spur the demand for
tiles in the country.
Hospitality
industry: The size of the hospitality industry stood at USD 117.70 billion in
2014. The industry grew at a CAGR of 36.50% during the last five years and is
expected to grow at a forecasted CAGR of 15.15% to a size of USD 418.90 billion
by 2022.
Organised retail sector: The organised
retail industry is estimated to grow at a CAGR of 24% and attain 10.2% share of
the total retail market by 2016-17.
OUTLOOK
The Indian ceramic tiles industry is likely to invest in
enhancing production capacities; production is likely to grow at a 12.7% CAGR
to cross the 1,000 million m mark by 2015.
FIXED ASSETS
- Freehold Land
- Leasehold Land
- Buildings
- Office Equipment
- Plant and Machinery
- Electrical Installations
- Furniture and Fixtures
- Motor Vehicles
- Windmill
STATEMENT OF STANDALONE AUDITED RESULTS FOR THE QUARTER AND HALF
ENDED 30TH SEPTEMBER 2014
(Rs. in Million)
|
Sr. No |
|
Standalone |
|||
|
Quarter Ended |
Half Year Ended |
||||
|
30.09.2014 |
30.06.2014 |
30.09.2014 |
|||
|
Audited |
Unaudited |
Audited |
|||
|
1 |
Income From
Operations |
|
|
|
|
|
|
a. Gross sales |
2339.867 |
2154.218 |
4494.085 |
|
|
|
b. Net Sales/ Income from Operations (Net of Excise Duty) |
2137.120 |
1962.709 |
4499.829 |
|
|
|
c. Other Operating Income |
8.002 |
9.635 |
17.637 |
|
|
|
Total Income from
Operations (Net) |
2145.122 |
1972.344 |
4517.466 |
|
|
2 |
Expenditure |
|
|
|
|
|
|
a. Cost of material Consumed |
523.675 |
305.677 |
829.352 |
|
|
|
b. Purchase of Stock-in trade |
1024.879 |
1068.068 |
2092.947 |
|
|
|
c. Changes in inventory of finished Goods, work- in-progress and Stock-in-trade |
(8.322) |
33.318 |
24.996 |
|
|
|
d. Power and Fuel |
158.151 |
128.948 |
287.099 |
|
|
|
e. Employees Benefit Expenses |
181.751 |
185.888 |
367.639 |
|
|
|
f. Depreciation and Amortisation Expenses |
155.503 |
155.977 |
311.480 |
|
|
|
g. Freight, forwding, and distribution expense |
89.528 |
93.942 |
183.470 |
|
|
|
f. Other expenses |
200.792 |
214.177 |
414.969 |
|
|
|
Total Expenses |
2325.957 |
2185.995 |
4511.952 |
|
|
3 |
Profit from
Operations before Other Income, Interest and Exceptional Items |
(180.835) |
(213.651) |
(394.486) |
|
|
4 |
Other Income |
1.158 |
1.926 |
3.084 |
|
|
5 |
Profit from
ordinary activities before finance cost & exceptional items |
(179.677) |
(211.725) |
(391.402) |
|
|
6 |
Finance Costs |
385.172 |
359.259 |
742.431 |
|
|
7 |
Profit from
ordinary activities after finance costs & exceptional items |
(564.849) |
(568.984) |
(1133.833) |
|
|
8 |
Exceptional items |
- |
- |
- |
|
|
9 |
Profit from
ordinary activities before tax |
(564.849) |
(568.984) |
(1133.833) |
|
|
10 |
Tax Expense |
- |
- |
- |
|
|
|
- Income Tax |
- |
- |
- |
|
|
|
- Deferred Tax |
- |
- |
- |
|
|
11 |
Net Profit from
ordinary activity after tax |
(564.849) |
(568.984) |
(1133.833) |
|
|
12 |
Extraordinary Items |
- |
- |
- |
|
|
13 |
Net Profit After
Tax |
(564.849) |
(568.984) |
(1133.833) |
|
|
14 |
Paid-up equity share capital (face value of Rs.10 per share) |
546.993 |
546.993 |
546.993 |
|
|
15 |
Reserves excluding Revaluation Reserve as per balance sheet of previous accounting Year |
|
|
|
|
|
16 |
Earning Per Share (of Rs.10 each) (not annualized) |
|
|
|
|
|
|
Basic EPS |
(10.33) |
(10.40) |
(20.73) |
|
|
|
Diluted EPS |
(10.33) |
(10.40) |
(20.73) |
|
|
|
|
|
|
|
|
|
A |
PARTICULARS OF
SHAREHOLDING |
|
|
|
|
|
17 |
Public Shareholding |
|
|
|
|
|
|
- No. of shares |
16659032 |
16659032 |
16659032 |
|
|
|
- Percentage of shareholding |
30.46 |
30.46 |
30.46 |
|
|
18 |
Promoter &
Promoter Group Shareholding |
|
|
|
|
|
|
a)
Pledged/Encumbered |
|
|
|
|
|
|
- No. of shares |
33225170 |
33225270 |
33225270 |
|
|
|
- Percentage of shareholding (as a % of the total shareholding of promoter and promoter group) |
87.34 |
87.34 |
87.4 |
|
|
|
- Percentage of shareholding (as a % of the total share capital of the company) |
60.74 |
60.74 |
60.74 |
|
|
|
b) Non-encumbered |
|
|
|
|
|
|
- No. of shares |
4815036 |
4815036 |
4815036 |
|
|
|
- Percentage of shareholding (as a % of the total shareholding of promoter and promoter group) |
12.66 |
12.66 |
12.66 |
|
|
|
- Percentage of shareholding (as a % of the total share capital of the company) |
8.80 |
8.80 |
8.80 |
|
|
|
Particulars |
Quarter ended 30.09.2014 |
|
B |
Investor Complaints |
|
|
|
Pending at the beginning of the quarter |
NIL |
|
|
Received during the quarter |
1 |
|
|
Disposed off during the quarter |
1 |
|
|
Remaining unresolved at the end of the
quarter |
NIL |
SEGMENTWISE REVENUE, RESULTS AND CAPITAL EMPLOYED
FOR QUARTER AND HALF YEAR ENDED SEPETEMBET 30, 2014
(Rs. In Millions)
|
Particulars |
Quarter
Ended (
Unaudited) |
Year
Ended (
Unaudited) |
|
|
|
30.09.014 |
30.06.2014 |
30.09.2014 |
|
|
|
|
|
|
1. Net Sales / Income
from Operation |
|
|
|
|
-Tiles and other
related products |
2052.346 |
1968.012 |
4020.358 |
|
-Real estate |
92.776 |
4.332 |
97.108 |
|
Total
Revenue |
2145.122 |
1972.344 |
4117.466 |
|
|
|
|
|
|
|
|
|
|
-Tiles and other
related products |
(197.740) |
(208.466) |
(406.208) |
|
-Real estate |
18.063 |
(3.259) |
14.804 |
|
Total
Segment Profit Before Interest and Tax |
(179.677) |
(211.725) |
(391.402) |
|
|
|
|
|
|
Less : Interest and other financial cost |
384.183 |
953.355 |
737.538 |
|
Foreign exchange loss (gain) |
0.989 |
9.904 |
4.893 |
|
Profit Before Tax |
(564.849) |
(568.984) |
(1133.833) |
|
|
|
|
|
|
3. Capital Employed (Segment
Assets-Segment Liabilities) |
|
|
|
|
-Tiles and other
related products |
9099.437 |
9536.324 |
9099.437 |
|
-Real estate |
3572.244 |
3637.947 |
3572.244 |
|
-Unallocated
Corporate |
653.597 |
663.204 |
653.597 |
|
Total |
13325.278 |
13837.475 |
13325.278 |
STANDALONE STATEMENT OF ASSETS AND LIABILITIES
(Rs. in Million
|
SOURCES OF FUNDS |
|
|
As on 30.09.2014 (Unaudited) |
|
I.
EQUITY
AND LIABILITIES |
|
|
|
|
(1)Shareholders'
Funds |
|
|
|
|
(a)
Share Capital |
|
|
546.993 |
|
(b) Reserves & Surplus |
|
|
(799.867) |
|
Sub-total
Shareholders' Funds |
|
|
(252.874) |
|
|
|
|
|
|
(2)
Minority Interest |
|
|
-- |
|
|
|
|
|
|
(3) Non-Current
Liabilities |
|
|
|
|
(a) long-term borrowings |
|
|
8119.918 |
|
(b) Deferred tax liabilities (Net) |
|
|
203.484 |
|
(c) Other long term
liabilities |
|
|
136.420 |
|
(d) long-term
provisions |
|
|
-- |
|
Sub Total
Non-Current Liabilities |
|
|
8459.822 |
|
|
|
|
|
|
(4) Current Liabilities |
|
|
|
|
(a) Short
term borrowings |
|
|
899.837 |
|
(b) Trade
payables |
|
|
1626.229 |
|
(c) Other
current liabilities |
|
|
4279.592 |
|
(d) Short-term
provisions |
|
|
3.800 |
|
Sub Total- Current Liabilities |
|
|
6809.458 |
|
|
|
|
|
|
TOTAL- EQUITY AND LIABILITIES |
|
|
15016.406 |
|
|
|
|
|
|
II.
ASSETS |
|
|
|
|
(1) Non-current assets |
|
|
|
|
(a) Fixed
Assets |
|
|
6412.548 |
|
(b)Goodwill
on Consolidation |
|
|
-- |
|
(c) Non-current Investments |
|
|
312.375 |
|
(d) Deferred tax assets (net) |
|
|
-- |
|
(e) Long-term Loan and Advances |
|
|
1779.585 |
|
(f) Other
Non-current assets |
|
|
-- |
|
Sub
Total- Non-current
assets |
|
|
8504.508 |
|
(2) Current assets |
|
|
|
|
(a)
Current investments |
|
|
1.328 |
|
(b)
Inventories |
|
|
2120.111 |
|
(c)Inventories
– Real Estate |
|
|
1788.216 |
|
(c) Trade
receivables |
|
|
1182.387 |
|
(d) Cash
and cash equivalents |
|
|
142.640 |
|
(e)
Short-term loans and advances |
|
|
437.873 |
|
(f) Other
current assets |
|
|
839.343 |
|
Sub Total- Current
assets |
|
|
6511.898 |
|
|
|
|
|
|
TOTAL
ASSETS |
|
|
15016.406 |
CMT REPORT (Corruption, Money Laundering & Terrorism]
The Public Notice information has been collected from various sources
including but not limited to: The Courts,
1] INFORMATION ON
DESIGNATED PARTY
No exist designating subject or any of its beneficial owners,
controlling shareholders or senior officers as terrorist or terrorist
organization or whom notice had been received that all financial transactions
involving their assets have been blocked or convicted, found guilty or against
whom a judgement or order had been entered in a proceedings for violating
money-laundering, anti-corruption or bribery or international economic or
anti-terrorism sanction laws or whose assets were seized, blocked, frozen or
ordered forfeited for violation of money laundering or international
anti-terrorism laws.
2] Court Declaration :
No exist to suggest that subject is or was
the subject of any formal or informal allegations, prosecutions or other
official proceeding for making any prohibited payments or other improper
payments to government officials for engaging in prohibited transactions or
with designated parties.
3] Asset Declaration :
No records exist to suggest that the property or assets of the subject
are derived from criminal conduct or a prohibited transaction.
4] Record on Financial
Crime :
Charges or conviction
registered against subject: None
5] Records on Violation of
Anti-Corruption Laws :
Charges or
investigation registered against subject: None
6] Records on Int’l
Anti-Money Laundering Laws/Standards :
Charges or
investigation registered against subject: None
7] Criminal Records
No
available information exist that suggest that subject or any of its principals
have been formally charged or convicted by a competent governmental authority
for any financial crime or under any formal investigation by a competent
government authority for any violation of anti-corruption laws or international
anti-money laundering laws or standard.
8] Affiliation with
Government :
No record
exists to suggest that any director or indirect owners, controlling
shareholders, director, officer or employee of the company is a government
official or a family member or close business associate of a Government
official.
9] Compensation Package :
Our market
survey revealed that the amount of compensation sought by the subject is fair
and reasonable and comparable to compensation paid to others for similar
services.
10] Press Report :
No press reports / filings exists on
the subject.
CORPORATE GOVERNANCE
MIRA INFORM as part of its Due Diligence do provide comments on Corporate
Governance to identify management and governance. These factors often have been
predictive and in some cases have created vulnerabilities to credit
deterioration.
Our Governance Assessment focuses principally on the interactions
between a company’s management, its Board of Directors, Shareholders and other
financial stakeholders.
CONTRAVENTION
Subject is not known to have contravened any existing local laws,
regulations or policies that prohibit, restrict or otherwise affect the terms
and conditions that could be included in the agreement with the subject.
FOREIGN EXCHANGE RATES
|
Currency |
Unit
|
Indian Rupees |
|
US Dollar |
1 |
Rs.63.28 |
|
|
1 |
Rs.98.38 |
|
Euro |
1 |
Rs.76.30 |
INFORMATION DETAILS
|
Information
Gathered by : |
SVA |
|
|
|
|
Analysis Done by
: |
SUM |
|
|
|
|
Report Prepared
by : |
KLS |
SCORE & RATING EXPLANATIONS
|
SCORE FACTORS |
RANGE |
POINTS |
|
HISTORY |
1~10 |
4 |
|
PAID-UP CAPITAL |
1~10 |
3 |
|
OPERATING SCALE |
1~10 |
3 |
|
FINANCIAL
CONDITION |
|
|
|
--BUSINESS SCALE |
1~10 |
4 |
|
--PROFITABILITY |
1~10 |
3 |
|
--LIQUIDITY |
1~10 |
3 |
|
--LEVERAGE |
1~10 |
3 |
|
--RESERVES |
1~10 |
3 |
|
--CREDIT LINES |
1~10 |
3 |
|
--MARGINS |
-5~5 |
-- |
|
DEMERIT POINTS |
|
|
|
--BANK CHARGES |
YES/NO |
YES |
|
--LITIGATION |
YES/NO |
NO |
|
--OTHER ADVERSE INFORMATION |
YES/NO |
NO |
|
MERIT POINTS |
|
|
|
--SOLE DISTRIBUTORSHIP |
YES/NO |
NO |
|
--EXPORT ACTIVITIES |
YES/NO |
NO |
|
--AFFILIATION |
YES/NO |
YES |
|
--LISTED |
YES/NO |
YES |
|
--OTHER MERIT FACTORS |
YES/NO |
YES |
|
DEFAULTER
|
|
|
|
--RBI |
YES/NO |
NO |
|
--EPF |
YES/NO |
NO |
|
TOTAL |
|
29 |
This score serves as a reference to assess
SC’s credit risk and to set the amount of credit to be extended. It is calculated
from a composite of weighted scores obtained from each of the major sections of
this report. The assessed factors and their relative weights (as indicated
through %) are as follows:
Financial
condition (40%) Ownership
background (20%) Payment record
(10%)
Credit history
(10%) Market trend (10%) Operational size
(10%)
RATING EXPLANATIONS
|
RATING |
STATUS |
PROPOSED CREDIT LINE |
|
|
>86 |
Aaa |
Possesses an extremely sound financial base with the strongest capability
for timely payment of interest and principal sums |
Unlimited |
|
71-85 |
Aa |
Possesses adequate working capital. No caution needed for credit
transaction. It has above average (strong) capability for payment of interest
and principal sums |
Large |
|
56-70 |
A |
Financial & operational base are regarded healthy. General
unfavourable factors will not cause fatal effect. Satisfactory capability for
payment of interest and principal sums |
Fairly Large |
|
41-55 |
Ba |
Overall operation is considered normal. Capable to meet normal
commitments. |
Satisfactory |
|
26-40 |
B |
Capability to overcome financial difficulties seems comparatively
below average. |
Small |
|
11-25 |
Ca |
Adverse factors are apparent. Repayment of interest and principal sums
in default or expected to be in default upon maturity |
Limited with
full security |
|
<10 |
C |
Absolute credit risk exists. Caution needed to be exercised |
Credit not
recommended |
|
-- |
NB |
New Business |
-- |
This report is issued at your request without any
risk and responsibility on the part of MIRA INFORM PRIVATE LIMITED (MIPL)
or its officials.