MIRA INFORM REPORT
|
Report No. : |
303370 |
|
Report Date : |
14.01.2015 |
IDENTIFICATION DETAILS
|
Name : |
RELIANCE INDUSTRIES LIMITED |
|
|
|
|
Registered
Office : |
3rd Floor, Maker Chamber IV, 222, Nariman Point, Mumbai – 400021, |
|
|
|
|
Country : |
India |
|
|
|
|
Financials (as
on) : |
31.03.2014 |
|
|
|
|
Date of
Incorporation : |
08.05.1973 |
|
|
|
|
Com. Reg. No.: |
11-019786 |
|
|
|
|
Capital Investment
/ Paid-up Capital : |
Rs.32320.000 Millions |
|
|
|
|
CIN No.: [Company Identification
No.] |
L17110MH1973PLC019786 |
|
|
|
|
IEC No.: |
Not Available |
|
|
|
|
TAN No.: [Tax Deduction &
Collection Account No.] |
Not Available |
|
|
|
|
PAN No.: [Permanent Account No.] |
Not Available |
|
|
|
|
Legal Form : |
A Public Limited Liability Company. The Company’s Shares are Listed on
the Stock Exchanges. |
|
|
|
|
Line of Business
: |
Manufacturer and Marketer
of Fabrics, Polyester Filament Yarn, Polyester Staple Fibers, PTA, LAB,
Ethylene Glycol, PVC, PE, PP, Crude Oil, Gas, Norman Paraffin, Fiber Fill,
Ethylene, Propylene, Benzene, Xylene and Toluene. |
|
|
|
|
No. of Employees
: |
23853 (Approximately) |
RATING & COMMENTS
|
MIRA’s Rating : |
Aa (80) |
|
RATING |
STATUS |
PROPOSED CREDIT LINE |
|
|
71-85 |
Aa |
Possesses adequate working capital. No caution needed for credit
transaction. It has above average (strong) capability for payment of interest
and principal sums |
Large |
|
Status : |
Excellent |
|
|
|
|
Payment Behaviour : |
Regular |
|
|
|
|
Litigation : |
Exist |
|
|
|
|
Comments : |
Subject is
India’s largest private sector enterprise with businesses across the energy and
materials value chain, along with a significant presence in retail and
telecom sectors. It is the first Indian private sector company to feature in
Fortune Global 500 list of ‘World’s Largest Corporations’ and has been
consistently featuring in it for the last ten consecutive years. It is a
well-established and reputed company having excellent track record. The rating
reflects company’s leadership position in the petrochemical segment and strong
financial risk profile characterised by robust capital structure, and highly
integrated nature of operations with presence across the entire energy value
chain. Trade relations
are reported as trustworthy. Business is active. Payments are reported to be
regular and as per commitments. The company can
be considered good for normal business dealings at usual trade terms and
conditions. |
NOTES :
Any query related to this report can be made
on e-mail : infodept@mirainform.com
while quoting report number, name and date.
EXTERNAL AGENCY RATING
|
Rating Agency Name |
CRISIL |
|
Rating |
Long Term Rating AAA |
|
Rating Explanation |
Highest degree of safety and Lowest credit risk. |
|
Date |
November 05. 2014 |
RBI DEFAULTERS’ LIST STATUS
Subject’s name is not enlisted as a defaulter
in the publicly available RBI Defaulters’ list.
EPF (Employee Provident Fund) DEFAULTERS’ LIST STATUS
Subject’s name is not enlisted as a defaulter
in the publicly available EPF (Employee Provident Fund) Defaulters’ list as of
31-03-2014.
LOCATIONS
|
Registered/ Corporate Office : |
3rd
Floor, Maker Chambers IV, 222, Nariman Point, Mumbai – 400021, |
|
Tel. No.: |
91-22-30325000/ 30327000/ 22785000/ 22785185 |
|
Fax No.: |
91-22-22785111/
30322268/ 22785185 |
|
E-Mail : |
|
|
Website : |
http://www.ril.com |
|
|
|
|
Head Office : |
Reliance Corporate Park, Building No. 7, C-Wing, 2nd Floor, 5, TTC Industrial Area, Thane-Belapur Road, Ghansoli, Navi Mumbai – 400701, Maharashtra, India |
|
Tel. No.: |
91-22-44780912 |
|
Fax No.: |
91-22-44779050 |
|
E-Mail : |
|
|
|
|
|
Factory : |
·
Allahabad A/10-A/27, UPSIDC Industrial Area, P. O. T.S.L., Allahabad - 211 010,
Uttar Pradesh, India ·
Barabanki Dewa Road, P.O. Somaiya Nagar, Barabanki - 225 123, Uttar Pradesh,
India ·
Dahej P. O. Dahej, Vagra,
Bharuch - 392 130, Gujarat, India ·
Hazira Complex Village Mora,
Bhatha P.O. Surat-Hazira Road, Surat 394 510, Gujarat, India ·
Nagothane
Complex P. O.
Petrochemicals Township, Nagothane, Raigad - 402 125, Maharashtra, India ·
Patalganga Complex B-1 to B-5 and
A3, MIDC Industrial Area, P.O. Rasauani, Patalganga, Near Panvel, District
Raigad - 410207, Maharashtra, India ·
Vadodara Complex P. O.
Petrochemicals, Vadodara - 391 346, Gujarat, India ·
Gadimoga Tallarevu
Mandal, East Godavari District, Gadimoga – 533463, Andhra Pradesh, India ·
Jamnagar Village Meghpar
/ Padana, Taluka Lalpur, Jamnagar – 361280, Gujarat, India ·
Hoshiarpur Dharmshala Road,
V.P.O. Chohal District Hoshiarpur - 146 024, Punjab, India ·
Nagpur Village Dahali, Mouda
Ramtek Road Tehsil Mouda – 441 104, District Nagpur Maharashtra, India. ·
Naroda 103/106, Naroda
Industrial Estate Naroda, Ahmedabad - 382 330, Gujarat, India. ·
Silvassa 342, Kharadpada,
Naroli, Near Silvassa Union Territory of Dadra and Nagar Haveli – 396235,
India |
|
|
|
|
Factory 2: |
Unit of Reliance Jamnagar Sez Polymer Export Division Fortune 2000 5th
Floor C – 3 G Block Bkc Bandra (East) Mumbai – 400051, Maharashtra, India |
|
|
|
|
Corporate
Communication Center : |
Maker Chambers
IV, 1st Floor, Nariman Point, Mumbai – 400021, |
|
Tel No. : |
91-22-22785568 /
22785585 / 22785000 |
|
Fax No. : |
91-22-22785185 |
|
Email : |
|
|
Web Site: |
DIRECTORS
As on 31.03.2014
|
Name : |
Mr. Mukesh D.
Ambani |
|
Designation : |
Chairman and Managing Director (Finance) |
|
Date of
Appointment: |
31.07.2002 |
|
Qualification: |
Chemical Engineer from |
|
|
|
|
Name : |
Mr. Nikhil R.
Meswani |
|
Designation : |
Executive Director |
|
Appointment: |
Since 1990 |
|
Qualification: |
Chemical Engineer |
|
|
|
|
Name : |
Mr. Hital R.
Meswani |
|
Designation : |
Executive Director |
|
|
|
|
Name : |
Mr. P.M.S.
Prasad |
|
Designation : |
Executive Director |
|
|
|
|
Name : |
Mr. Pawan Kumar Kapil |
|
Designation : |
Executive Director |
|
|
|
|
Name : |
Mr. Ramiklal H.
Ambani |
|
Designation : |
Non-Executive Director |
|
|
|
|
Name : |
Mr. Mansingh L.
Bhakta |
|
Designation : |
Non-Executive Director |
|
|
|
|
Name : |
Mr. Yogendra P.
Trivedi |
|
Designation : |
Non-Executive Director |
|
|
|
|
Name : |
Dr. Dharam Vir
Kapur |
|
Designation : |
Non-Executive Director |
|
|
|
|
Name : |
Mr. Mahesh P.
Modi |
|
Designation : |
Non-Executive Director |
|
|
|
|
Name : |
Prof. Ashok Mishra |
|
Designation : |
Non-Executive Director |
|
|
|
|
Name : |
Prof. Dipak C. Jain |
|
Designation : |
Non-Executive Director |
|
|
|
|
Name : |
Dr. Raghunath A. Mashelkar |
|
Designation : |
Director |
|
Date of
Appointment : |
09.06.2007 |
|
|
|
|
Name : |
Mr. Adil Zainulbhai |
|
Designation : |
Independent Director |
KEY EXECUTIVES
|
Name : |
Mr. Alok Agarwal |
|
Designation : |
Chief Financial Officer |
|
|
|
|
Name : |
Mr. K. Sethuraman |
|
Designation : |
Group Company Secretary and Chief Compliance Officer |
|
|
|
|
Name : |
Mr. Kanga and Company |
|
Designation : |
Solicitors and Advocates |
|
|
|
|
Audit Committee
: |
Mr. Yogendra P.
Trivedi (Chairman) Mr. Mahesh P.
Modi Dr. Raghunath A. Mashelkar Mr. Adil Zainulbhai |
|
|
|
|
Corporate Governance and Stakeholders' Interface
Committee : |
Mr. Yogendra P.
Trivedi (Chairman) Mr. Nikhil R.
Meswani Dr. Dharam Vir
Kapur Dr. Raghunath A. Mashelkar |
|
|
|
|
Finance
Committee : |
Mr. Mukesh D.
Ambani (Chairman) Mr. Nikhil R.
Meswani Mr. Hital R.
Meswani |
|
|
|
|
Health, Safety
and Environment
Committee : |
Mr. Hital R.
Meswani (Chairman) Dr. Dharam Vir
Kapur Mr. P.M.S. Prasad Mr. Pawan Kumar
Kapil |
|
|
|
|
Stakeholders Relationship
Committee: |
Mr. Yogendra P.
Trivedi (Chairman) Mr. Nikhil R.
Meswani Mr. Hital R. Meswani Prof. Ashok Misra |
|
|
|
|
Human Resources, Nomination and
Remuneration Committee : |
Mr. Adil Zainulbhai Mr. Yogendra P. Trivedi Dr. Dharam Vir
Kapur Dr. Raghunath A. Mashelkar |
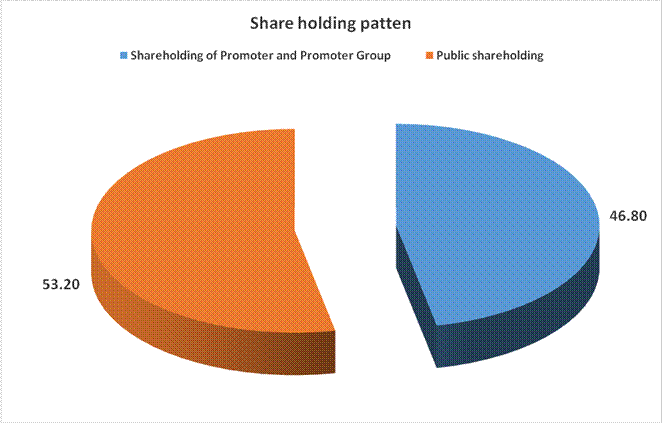
MAJOR SHAREHOLDERS / SHAREHOLDING PATTERN
As on 31.12.2014
|
Category of
Shareholder |
No.
of Shares |
Percentage
of Holding |
|
(A) Shareholding of Promoter and Promoter Group |
|
|
|
|
|
|
|
|
21172646 |
0.68 |
|
|
1322318328 |
42.27 |
|
|
120471003 |
3.85 |
|
|
120471003 |
3.85 |
|
|
1463961977 |
46.80 |
|
|
|
|
|
|
|
|
|
Total shareholding of
Promoter and Promoter Group (A) |
1463961977 |
46.80 |
|
|
|
|
|
(B) Public
Shareholding |
|
|
|
|
|
|
|
|
73943397 |
2.36 |
|
|
4985325 |
0.16 |
|
|
3915881 |
0.13 |
|
|
305529499 |
9.77 |
|
|
611394357 |
19.55 |
|
|
999768459 |
31.96 |
|
|
|
|
|
|
|
|
|
|
116688127 |
3.73 |
|
|
|
|
|
|
|
|
|
|
320525953 |
10.25 |
|
|
26870265 |
0.86 |
|
|
|
|
|
|
200249870 |
6.40 |
|
|
20211628 |
0.65 |
|
|
1988978 |
0.06 |
|
|
171883624 |
5.49 |
|
|
6165640 |
0.20 |
|
|
664334215 |
21.24 |
|
|
|
|
|
Total Public
shareholding (B) |
1664102674 |
53.20 |
|
|
|
|
|
Total (A)+(B) |
3128064651 |
100.00 |
|
(C) Shares held by Custodians
and against which Depository Receipts have been issued |
|
|
|
|
0 |
0 |
|
|
0 |
0 |
|
|
0 |
0 |
|
|
|
|
|
Total (A)+(B)+(C) |
3235069941 |
0.000 |
Shareholding
belonging to the category "Promoter and Promoter Group"
|
Sl.No. |
Name of the Shareholder |
Details of Shares held |
Total shares (including underlying shares assuming full conversion of
warrants and convertible securities) as a % of diluted share capital |
|
|
No. of Shares held |
As a % of grand total |
|||
|
1 |
Kankhal Investments And Trading
Company Private Limited |
14,84,90,952 |
4.59 |
4.59 |
|
2 |
Bhuvanesh Enterprises Limited
Liability Partnership |
13,46,16,811 |
4.16 |
4.16 |
|
3 |
Ajitesh Enterprises Limited
Liability Partnership |
12,70,41,799 |
3.93 |
3.93 |
|
4 |
Badri Commercials Limited Liability
Partnership |
12,70,41,799 |
3.93 |
3.93 |
|
5 |
Abhayaprada Enterprises Limited
Liability Partnership |
12,45,14,168 |
3.85 |
3.85 |
|
6 |
Trilokesh Commercials Limited
Liability Partnership |
12,45,13,168 |
3.85 |
3.85 |
|
7 |
Petroleum Trust (Through
Trustees For Sole Beneficiary-M/S Reliance Industrial Investments And
Holdings Limited.) |
12,04,71,003 |
3.72 |
3.72 |
|
8 |
Farm Enterprises Limited |
11,89,78,113 |
3.68 |
3.68 |
|
9 |
Taran Enterprises Limited Liability
Partnership |
10,63,73,069 |
3.29 |
3.29 |
|
10 |
Pitambar Enterprises Limited
Liability Partnership |
10,49,00,070 |
3.24 |
3.24 |
|
11 |
Adisesh Enterprises Limited
Liability Partnership |
8,10,99,093 |
2.51 |
2.51 |
|
12 |
Rishikesh Enterprises Limited
Liability Partnership |
6,04,09,418 |
1.87 |
1.87 |
|
13 |
Pavana Enterprises Limited
Liability Partnership |
3,56,73,400 |
1.10 |
1.10 |
|
14 |
K D Ambani |
73,31,074 |
0.23 |
0.23 |
|
15 |
Shreeji Comtrade Limited Liability
Partnership |
66,77,500 |
0.21 |
0.21 |
|
16 |
Shrikrishna Tradecom Limited
Liability Partnership |
66,77,500 |
0.21 |
0.21 |
|
17 |
Kamalakar Enterprises Limited
Liability Partnership |
63,70,016 |
0.20 |
0.20 |
|
18 |
Nagothane Agrofarms Private Limited |
56,00,000 |
0.17 |
0.17 |
|
19 |
M D Ambani |
36,15,846 |
0.11 |
0.11 |
|
20 |
Nita Ambani |
33,98,146 |
0.11 |
0.11 |
|
21 |
Isha M Ambani |
33,64,390 |
0.10 |
0.10 |
|
22 |
Akash M Ambani |
33,63,190 |
0.10 |
0.10 |
|
23 |
Reliance Welfare Association |
25,05,468 |
0.08 |
0.08 |
|
24 |
Narahari Enterprises Limited Liability Partnership |
6,16,840 |
0.02 |
0.02 |
|
25 |
Reliance Industrial
Infrastructure Limited |
1,72,000 |
0.01 |
0.01 |
|
26 |
Master Anant M Ambani |
1,00,000 |
0.00 |
0.00 |
|
27 |
Saumya Finance And Leasing
Company Private Limited |
21,200 |
0.00 |
0.00 |
|
28 |
Exotic Investments And Trading
Company Private Limited |
12,988 |
0.00 |
0.00 |
|
29 |
Carat Holdings And Trading Co
Private Limited |
5,100 |
0.00 |
0.00 |
|
30 |
Ekansha Enterprise Private
Limited |
2,550 |
0.00 |
0.00 |
|
31 |
Amudha Venture Capital Private
Limited |
900 |
0.00 |
0.00 |
|
32 |
Neutron Enterprises Private
Limited |
861 |
0.00 |
0.00 |
|
33 |
Futura Commercials Private
Limited |
845 |
0.00 |
0.00 |
|
34 |
Relcom Venture Capital Private
Limited |
600 |
0.00 |
0.00 |
|
35 |
Deccan Finvest Private Limited |
300 |
0.00 |
0.00 |
|
36 |
Reliance Consultancy Services
Private Limited |
200 |
0.00 |
0.00 |
|
37 |
Chakradev Enterprises Limited Liability
Partnership |
100 |
0.00 |
0.00 |
|
38 |
Chakradhar Commercials Limited
Liability Partnership |
100 |
0.00 |
0.00 |
|
39 |
Chakresh Enterprises Limited
Liability Partnership |
100 |
0.00 |
0.00 |
|
40 |
Chhatrabhuj Enterprises Limited Liability
Partnership |
100 |
0.00 |
0.00 |
|
41 |
Devarshi Commercials Limited
Liability Partnership |
100 |
0.00 |
0.00 |
|
42 |
Harinarayan Enterprises Limited
Liability Partnership |
100 |
0.00 |
0.00 |
|
43 |
Janardan Commercials Limited
Liability Partnership |
100 |
0.00 |
0.00 |
|
44 |
Karuna Commercials Limited
Liability Partnership |
100 |
0.00 |
0.00 |
|
45 |
Samarjit Enterprises Limited
Liability Partnership |
100 |
0.00 |
0.00 |
|
46 |
Shripal Enterprises Limited
Liability Partnership |
100 |
0.00 |
0.00 |
|
47 |
Srichakra Commercials Limited
Liability Partnership |
100 |
0.00 |
0.00 |
|
48 |
Svar Enterprises Limited
Liability Partnership |
100 |
0.00 |
0.00 |
|
49 |
Synergy Synthetics Private
Limited |
100 |
0.00 |
0.00 |
|
50 |
Tattvam Enterprises Limited
Liability Partnership |
100 |
0.00 |
0.00 |
|
51 |
Vasuprada Enterprises Limited
Liability Partnership |
100 |
0.00 |
0.00 |
|
52 |
Vishatan Enterprises Limited
Liability Partnership |
100 |
0.00 |
0.00 |
|
|
Total |
1,46,39,61,977 |
45.25 |
45.25 |
Shareholding
belonging to the category "Public" and holding more than 1% of the
Total No. of Shares
|
Sl. No. |
Name of the
Shareholder |
No. of Shares
held |
Shares as % of
Total No. of Shares |
Total shares (including
underlying shares assuming full conversion of warrants and convertible
securities) as a % of diluted share capital |
|
|
1 |
Life Insurance Corporation Of
India |
280374746 |
8.67 |
8.67 |
|
|
2 |
Reliance Chemicals Limited |
62239998 |
1.92 |
1.92 |
|
|
3 |
Reliance Polyolefins Limited |
61194924 |
1.89 |
1.89 |
|
|
|
Total |
403809668 |
12.48 |
12.48 |
Shareholding of securities (including shares, warrants,
convertible securities) of persons (together with PAC) belonging to the category
“Public” and holding more than 5% of the total number of shares of the company
|
Sl. No. |
Name(s) of the
shareholder(s) and the Persons Acting in Concert (PAC) with them |
No. of Shares |
Shares as % of
Total No. of Shares |
Total shares (including
underlying shares assuming full conversion of warrants and convertible
securities) as a % of diluted share capital |
|
|
1 |
Life
Insurance Corporation Of India |
280374746 |
8.67 |
8.67 |
|
|
|
Total |
280374746 |
8.67 |
8.67 |
BUSINESS DETAILS
|
Line of Business : |
Manufacturer and
Marketer of Fabrics, Polyester Filament Yarn, Polyester Staple Fibers, PTA,
LAB, Ethylene Glycol, PVC, PE, PP, Crude Oil, Gas, Norman Paraffin, Fiber Fill,
Ethylene, Propylene, Benzene, Xylene and Toluene. |
||||||||||||
|
|
|
||||||||||||
|
Products : |
|
||||||||||||
|
|
|
||||||||||||
|
Brand Names : |
Not Available |
||||||||||||
|
|
|
||||||||||||
|
Agencies Held : |
Not Available |
||||||||||||
|
|
|
||||||||||||
|
Exports : |
Not Available |
||||||||||||
|
|
|
||||||||||||
|
Imports : |
Not Available |
||||||||||||
|
|
|
||||||||||||
|
Terms : |
Not Available |
PRODUCTION STATUS (AS ON 31.03.2014)
|
Particulars |
Electricity (KWH) |
Furnace Oil/HSD/HFHSD (Ltrs) |
LSHS (Kgs) |
Gas (SM3) |
|
|
|
|
|
|
|
Fabrics (per 1000 mtrs) |
4,407 |
2 |
- |
505 |
|
PFY (Per MT) |
784 |
5 |
7 |
50 |
|
PSF (Per MT) |
367 |
10 |
- |
53 |
|
PTA
(Per MT) |
313 |
0 |
- |
9 |
|
LAB
(Per MT) |
606 |
354 |
- |
140 |
|
MEG
(Per MT) |
421 |
5 |
2 |
66 |
|
PVC
(Per MT) |
407 |
3 |
1 |
57 |
|
HDPE
(Per MT) |
534 |
- |
0 |
12 |
|
PP
(Per MT) |
290 |
7 |
0 |
37 |
|
FF
(Per MT) |
577 |
53 |
- |
38 |
|
PET
(Per MT) |
244 |
- |
- |
68 |
|
PX
(Per MT) |
197 |
83 |
- |
229 |
|
Petro-Products
(Per MT) |
73 |
10 |
- |
66 |
|
PBR
(Per MT) |
666 |
137 |
- |
373 |
|
Caustic
Soda (Per MT) |
2473 |
- |
4 |
87 |
|
Acrylonitrile
(Per MT) |
510 |
66 |
- |
(52) |
|
Cyclohexane
(per MT) |
39 |
- |
- |
- |
GENERAL INFORMATION
|
Suppliers : |
|
||||||||||||||||||||||||||||||||||||||||||||||||
|
|
|
||||||||||||||||||||||||||||||||||||||||||||||||
|
Customers : |
|
||||||||||||||||||||||||||||||||||||||||||||||||
|
|
|
||||||||||||||||||||||||||||||||||||||||||||||||
|
No. of Employees : |
23853 (Approximately) |
||||||||||||||||||||||||||||||||||||||||||||||||
|
|
|
||||||||||||||||||||||||||||||||||||||||||||||||
|
Bankers : |
·
Allahabad Bank ·
Andhra Bank ·
Bank of ·
Bank of ·
Bank of ·
Bank of ·
Canara Bank ·
Central Bank of ·
Citibank N.A ·
Credit Agricole Corporate and Investment Bank ·
Corporation Bank ·
Deutsche Bank ·
The Hong Kong and ·
Corporation Limited ·
HDFC Bank Limited ·
ICICI Bank Limited ·
IDBI Bank Limited ·
Indian Bank ·
Indian Overseas Bank ·
Oriental Bank of Commerce ·
Punjab National Bank ·
Standard Chartered Bank ·
State Bank of ·
State Bank of ·
State Bank of ·
Syndicate Bank ·
The Royal Bank of ·
Union Bank of ·
Vijaya Bank |
||||||||||||||||||||||||||||||||||||||||||||||||
|
|
|
||||||||||||||||||||||||||||||||||||||||||||||||
|
Facilities : |
|
||||||||||||||||||||||||||||||||||||||||||||||||
|
Auditors 1 : |
|
|
Name : |
Chaturvedi and Shah Chartered Accountants |
|
|
|
|
Auditors 2 : |
|
|
Name : |
Rajendra and Company Chartered Accountants |
|
|
|
|
Auditors 3 : |
|
|
Name : |
Deloitte Haskins and Sells Chartered Accountants |
|
|
|
|
Memberships : |
Not Available |
|
|
|
|
Collaborators : |
Not Available |
|
|
|
|
Subsidiary Companies : |
1 Reliance Industrial Investments and Holdings Limited 2 Reliance Ventures Limited 3 Reliance Strategic Investments Limited 4 Reliance Industries (Middle East) DMCC 5 Reliance Retail Limited (Erstwhile, amalgamated with Reliance Fresh Limited w.e.f. 01.04.2012) 6 Reliance Retail Limited (Formerly known as Reliance Fresh Limited) 7 Reliance Haryana SEZ Limited 8 Retail Concepts and Services (India) Limited (amalgamated with
Reliance Financial Distribution and Advisory Services Limited w.e.f.
01.04.2012) 9 Reliance Retail Insurance Broking Limited 10 Reliance Dairy Foods Limited 11 Reliance Exploration and Production DMCC 12 Reliance Retail Finance Limited 13 RESQ Limited (amalgamated with Erstwhile Reliance Fresh Limited
w.e.f. 01.04.2012) 14 Reliance Retail Ventures Limited # 15 Reliancedigital Retail Limited (amalgamated with Erstwhile Reliance
Trends Limited w.e.f. 01.04.2012) 16 Reliance Financial Distribution and Advisory Services Limited 17 RIL (Australia) Pty Limited 18 Gapco Kenya Limited 19 Gapco Rwanda Limited 20 Gapco Tanzania Limited 21 Gapco Uganda Limited 22 Gapoil (Zanzibar) Limited 23 Gulf Africa Petroleum Corporation 24 Transenergy Kenya Limited 25 Recron (Malaysia) Sdn Bhd 26 Reliance Payment Solutions Limited 27 Reliance Brands Limited 28 Reliance Footprint Limited (amalgamated with Erstwhile Reliance
Trends Limited w.e.f. 01.04.2012) 29 Reliance Trading Limited ## 30 Reliance Lifestyle Holdings Limited 31 Reliance Universal Ventures Limited (amalgamated with Reliance
Industrial Investments and Holdings Limited w.e.f. 01.10.2013) 32 Delight Proteins Limited 33 Reliance Autozone Limited (amalgamated with Erstwhile Reliance
Fresh Limited w.e.f. 01.04.2012) 34 Reliance F&B Services Limited 35 Reliance Gems and Jewels Limited (amalgamated with Erstwhile
Reliance Trends Limited w.e.f. 01.04.2012) 36 Reliance Integrated Agri Solutions Limited (amalgamated with
Reliance Financial Distribution and Advisory Services Limited w.e.f. 01.04.2012) 37 Strategic Manpower Solutions Limited 38 Reliance Agri Products Distribution Limited (amalgamated with
Reliance Financial Distribution and Advisory Services Limited w.e.f.
01.04.2012) 39 Reliance Digital Media Limited (amalgamated with Erstwhile Reliance
Fresh Limited w.e.f. 01.04.2012) 40 Reliance Food Processing Solutions Limited 41 Reliance Home Store Limited (amalgamated with Reliance Financial
Distribution and Advisory Services Limited w.e.f. 01.04.2012) 42 Reliance Leisures Limited (amalgamated with Erstwhile Reliance
Trends Limited w.e.f. 01.04.2012) 43 Reliance Loyalty and Analytics Limited (amalgamated with Reliance
Financial Distribution and Advisory Services Limited w.e.f. 01.04.2012) 44 Reliance Retail Securities and Broking Company Limited (amalgamated
with Reliance Financial Distribution and Advisory Services Limited w.e.f.
01.04.2012) 45 Reliance Supply Chain Solutions Limited (amalgamated with Reliance
Financial Distribution and Advisory Services Limited w.e.f. 01.04.2012) 46 Reliance Trade Services Centre Limited (amalgamated with Reliance
Financial Distribution and Advisory Services Limited w.e.f. 01.04.2012) 47 Reliance Vantage Retail Limited 48 Wave Land Developers Limited 49 Reliance-GrandOptical Private Limited 50 Reliance Universal Commercial Limited 51 Reliance Petroinvestments Limited 52 Reliance Global Commercial Limited 53 Reliance People Serve Limited 54 Reliance Infrastructure Management Services Limited 55 Reliance Global Business B.V. 56 Reliance Gas Corporation Limited 57 Reliance Global Energy Services Limited 58 Kanhatech Solutions Limited 59 Reliance Global Energy Services (Singapore) Pte. Limited 60 Reliance Personal Electronics Limited (amalgamated with Reliance
Financial Distribution and Advisory Services Limited w.e.f. 01.04.2012) 61 Reliance Polymers (India) Limited (amalgamated with Reliance
Industrial Investments and Holdings Limited w.e.f. 01.10.2013) 62 Reliance Polyole"ns Limited 63 Reliance Aromatics and Petrochemicals Limited Subsidiary Companies 64 Reliance Energy and Project Development Limited 65 Reliance Chemicals Limited 66 Reliance Universal Enterprises Limited 67 Reliance Review Cinema Limited 68 Reliance Replay Gaming Limited (amalgamated with Erstwhile Reliance
Fresh Limited w.e.f. 01.04.2012) 69 Reliance Nutritious Food Products Limited* 70 RIL USA Inc. 71 Reliance Commercial Land and Infrastructure Limited 72 Reliance Corporate IT Park Limited 73 Reliance Eminent Trading and Commercial Private Limited 74 Reliance Progressive Traders Private Limited 75 Reliance Proli"c Traders Private Limited 76 Reliance Universal Traders Private Limited 77 Reliance Proli"c Commercial Private Limited 78 Reliance Comtrade Private Limited 79 Reliance Ambit Trade Private Limited 80 Reliance Petro Marketing Limited 81 LPG Infrastructure (India) Limited 82 Reliance Corporate Centre Limited 83 Reliance Convention and Exhibition Centre Limited 84 Central Park Enterprises DMCC 85 Reliance International B. V. (Liquidated w.e.f. 18.03.2014) 86 Reliance Corporate Services Limited 87 Indiawin Sports Private Limited 88 Reliance Holding USA Inc. 89 Reliance Marcellus LLC 90 Reliance Jio Infocomm Limited 91 Reliance Strategic (Mauritius) Limited 92 Reliance Eagleford Midstream LLC 93 Reliance Eagleford Upstream LLC 94 Reliance Eagleford Upstream GP LLC 95 Reliance Eagleford Upstream Holding LP 96 Mark Project Services Private Limited 97 Reliance Energy Generation and Distribution Limited 98 Reliance Marcellus II LLC 99 Reliance Security Solutions Limited 100 Reliance Industries Investment and Holding Limited 101 Reliance O$ce Solutions Private Limited (amalgamated with Reliance
Financial Distribution and Advisory Services Limited w.e.f. 01.04.2012) 102 Reliance Style Fashion India Private Limited 103 GenNext Innovation Ventures Limited 104 Reliance Home Products Limited (amalgamated with Reliance
Financial Distribution and Advisory Services Limited w.e.f. 01.04.2012) 105 Infotel Telecom Limited 106 Reliance Styles India Limited 107 Rancore Technologies Private Limited 108 Omni Symmetry LLC (amalgamated with Reliance Jio Infocomm USA Inc
w.e.f. 31.03.2014) 109 Reliance Sibur Elastomers Private Limited 110 Surela Investment and Trading Private Limited 111 Model Economic Township Limited 112 Delta Corp East Africa Limited 113 Delta Square Limited (Desubsidiarized w.e.f. 20.08.2013) 114 Kaizen Capital LLP 115 A$nity Names Inc 116 Reliance USA Gas Marketing LLC 117 Reliance Aerospace Technologies Limited 118 Reliance Gas Pipelines Limited 119 Achman Commercial Private Limited 120 Reliance Jio Infocomm Pte Limited 121 Reliance do Brasil Industria e Comercio de Produtos Texteis,
Quimicos, Petroquimicos e Derivados Ltda. 122 Reliance Jio Electronics Private Limited 123 Reliance Jio Infocomm USA Inc 124 Reliance Jio Infocomm UK Limited 125 Reliance Clothing India Private Limited 126 Reliance Agri Ventures Private Limited 127 Reliance World Trade Private Limited 128 Reliance Marcellus Holding LLC |
|
|
|
|
Associates : |
1.
Reliance Industrial Infrastructure Limited 2.
Reliance Europe Limited 3.
Reliance LNG Limited 4.
Indian Vaccines Corporation Limited 5.
Gujarat Chemical Port Terminal Company Limited 6.
Reliance Utilities and Power Private Limited 7.
Reliance Utilities Private Limited 8.
Reliance Ports and Terminals Limited 9.
Reliance Gas Transportation Infrastructure
Limited 10.
Reliance Commercial Dealers Limited |
|
|
|
|
Enterprises over which Key Managerial Personnel are able to exercise
significant influence : |
1.
Dhirubhai Ambani Foundation 2.
Jamnaben Hirachand Ambani Foundation 3.
Hirachand Govardhandas Ambani Public Charitable
Trust 4.
HNH Trust and HNH Research Society 5.
Reliance Foundation |
CAPITAL STRUCTURE
As on 18.06.2014
Authorised Capital : Rs.60000.000 Millions
Issued, Subscribed & Paid-up Capital : Rs.32346.040
Millions
As on 31.03.2014
Authorised Capital :
|
No. of Shares |
Type |
Value |
Amount |
|
|
|
|
|
|
5000000000 |
Equity Shares |
Rs.10/- each |
Rs.50000.000 Millions |
|
1000000000 |
Preference Shares |
Rs.10/- each |
Rs.10000.000 Millions |
|
|
Total |
|
Rs.60000.000
Millions |
Issued, Subscribed & Paid-up Capital :
|
No. of Shares |
Type |
Value |
Amount |
|
|
|
|
|
|
3231901858 |
Equity Shares |
Rs.10/- each |
Rs.32320.000 Millions |
|
|
|
|
|
FINANCIAL DATA
[all figures are
in Rupees Millions]
ABRIDGED BALANCE
SHEET
|
SOURCES OF FUNDS |
31.03.2014 |
31.03.2013 |
31.03.2012 |
|
I.
EQUITY
AND LIABILITIES |
|
|
|
|
(1)Shareholders'
Funds |
|
|
|
|
(a) Share Capital |
32320.000 |
32290.000 |
32710.000 |
|
(b) Reserves & Surplus |
1938420.000 |
1767660.000 |
1628250.000 |
|
(c) Money
received against share warrants |
0.000 |
0.000 |
0.000 |
|
|
|
|
|
|
(2) Share Application money pending
allotment |
170.000 |
250.000 |
0.000 |
|
Total Shareholders’
Funds (1)+(2) |
1970910.000 |
1800200.000 |
1660960.000 |
|
|
|
|
|
|
(3) Non-Current
Liabilities |
|
|
|
|
(a) long-term borrowings |
627110.000 |
430120.000 |
480340.000 |
|
(b) Deferred tax liabilities (Net) |
122150.000 |
121930.000 |
121220.000 |
|
(c) Other long term
liabilities |
0.000 |
0.000 |
0.000 |
|
(d) long-term
provisions |
0.000 |
0.000 |
0.000 |
|
Total Non-current
Liabilities (3) |
749260.000 |
552050.000 |
601560.000 |
|
|
|
|
|
|
(4) Current Liabilities |
|
|
|
|
(a) Short
term borrowings |
227700.000 |
115110.000 |
105930.000 |
|
(b) Trade
payables |
578620.000 |
457870.000 |
403240.000 |
|
(c) Other
current liabilities |
107670.000 |
216400.000 |
137130.000 |
|
(d) Short-term
provisions |
41670.000 |
43480.000 |
42580.000 |
|
Total Current
Liabilities (4) |
955660.000 |
832860.000 |
688880.000 |
|
|
|
|
|
|
TOTAL |
3675830.000 |
3185110.000 |
2951400.000 |
|
|
|
|
|
|
II.
ASSETS |
|
|
|
|
(1) Non-current assets |
|
|
|
|
(a) Fixed
Assets |
|
|
|
|
(i)
Tangible assets |
804240.000 |
829620.000 |
880010.000 |
|
(ii)
Intangible Assets |
289820.000 |
267860.000 |
257220.000 |
|
(iii) Capital
work-in-progress |
326730.000 |
135250.000 |
36950.000 |
|
(iv)
Intangible assets under development |
90430.000 |
55910.000 |
40590.000 |
|
(b) Non-current Investments |
526920.000 |
241430.000 |
269790.000 |
|
(c) Deferred tax assets (net) |
0.000 |
0.000 |
0.000 |
|
(d) Long-term Loan and Advances |
284360.000 |
215280.000 |
143400.000 |
|
(e) Other
Non-current assets |
0.000 |
0.000 |
0.000 |
|
Total Non-Current
Assets |
2322500.000 |
1745350.000 |
1627960.000 |
|
|
|
|
|
|
(2) Current assets |
|
|
|
|
(a)
Current investments |
333700.000 |
283660.000 |
270290.000 |
|
(b)
Inventories |
429320.000 |
427290.000 |
359550.000 |
|
(c) Trade
receivables |
106640.000 |
118800.000 |
184240.000 |
|
(d) Cash
and cash equivalents |
366240.000 |
495470.000 |
395980.000 |
|
(e)
Short-term loans and advances |
112770.000 |
109740.000 |
110890.000 |
|
(f) Other
current assets |
4660.000 |
4800.000 |
2490.000 |
|
Total
Current Assets |
1353330.000 |
1439760.000 |
1323440.000 |
|
|
|
|
|
|
TOTAL |
3675830.000 |
3185110.000 |
2951400.000 |
PROFIT & LOSS
ACCOUNT
|
|
PARTICULARS |
31.03.2014 |
31.03.2013 |
31.03.2012 |
|
|
|
SALES |
|
|
|
|
|
|
|
Income |
3901170.000 |
3602970.000 |
3299040.000 |
|
|
|
Other Income |
89360.000 |
79980.000 |
61920.000 |
|
|
|
TOTAL (A) |
3990530.000 |
3682950.000 |
3360960.000 |
|
|
|
|
|
|
|
|
Less |
EXPENSES |
|
|
|
|
|
|
|
Cost of materials consumed |
3293130.000 |
3061270.000 |
2748140.000 |
|
|
|
Purchases of stock-in-trade |
5240.000 |
5020.000 |
14410.000 |
|
|
|
Changes in inventories of finished goods, stock-in-process and stock-in-trade |
4120.000 |
(33170.000) |
(8720.000) |
|
|
|
Employee benefits expense |
33700.000 |
33540.000 |
28620.000 |
|
|
|
Other expenses |
256210.000 |
228440.000 |
180400.000 |
|
|
|
TOTAL (B) |
3592400.000 |
3295100.000 |
2962850.000 |
|
|
|
|
|
|
|
|
Less |
PROFIT
BEFORE INTEREST, TAX, DEPRECIATION AND AMORTISATION (A-B) (C) |
398130.000 |
387850.000 |
398110.000 |
|
|
|
|
|
|
|
|
|
Less |
FINANCIAL
EXPENSES (D) |
32060.000 |
30360.000 |
26670.000 |
|
|
|
|
|
|
|
|
|
|
PROFIT
BEFORE TAX, DEPRECIATION AND AMORTISATION (C-D) (E) |
366070.000 |
357490.000 |
371440.000 |
|
|
|
|
|
|
|
|
|
Less/ Add |
DEPRECIATION/
AMORTISATION (F) |
87890.000 |
94650.000 |
113940.000 |
|
|
|
|
|
|
|
|
|
|
PROFIT BEFORE
TAX (E-F) (G) |
278180.000 |
262840.000 |
257500.000 |
|
|
|
|
|
|
|
|
|
Less |
TAX (H) |
58340.000 |
52810.000 |
57100.00 |
|
|
|
|
|
|
|
|
|
|
PROFIT AFTER TAX
(G-H) (I) |
219840.000 |
210030.000 |
200400.000 |
|
|
|
|
|
|
|
|
|
Add |
On Amalgamation |
0.000 |
11160.000 |
0.000 |
|
|
|
|
|
|
|
|
|
Add |
PREVIOUS
YEARS’ BALANCE BROUGHT FORWARD |
86100.000 |
76090.000 |
65140.000 |
|
|
|
|
|
|
|
|
|
Less |
APPROPRIATIONS |
|
|
|
|
|
|
|
Transferred to General Reserve |
180000.000 |
180000.000 |
160000.000 |
|
|
|
Transferred to Capital Redemption Reserve on buy back of Equity Shares |
0.000 |
430.000 |
40.000 |
|
|
|
Proposed Dividend on Equity Shares |
27930.000 |
26280.000 |
25310.000 |
|
|
|
Tax on Dividend |
4750.000 |
4470.000 |
4100.000 |
|
|
BALANCE CARRIED
TO THE B/S |
93260.000 |
86100.000 |
76090.000 |
|
|
|
|
|
|
|
|
|
|
EARNINGS IN
FOREIGN CURRENCY |
|
|
|
|
|
|
|
FOB Value for Exports |
2611180.000 |
2278830.000 |
1982690.000 |
|
|
|
Interest Earnings |
50.000 |
20.000 |
10.000 |
|
|
|
Other Earnings |
2430.000 |
2070.000 |
2040.000 |
|
|
TOTAL EARNINGS |
2613660.000 |
2280920.000 |
1984740.000 |
|
|
|
|
|
|
|
|
|
|
IMPORTS |
|
|
|
|
|
|
|
Raw Materials and Stock-in-Trade |
3026300.000 |
2817190.000 |
2542480.000 |
|
|
|
Stores, Chemicals and Packing Materials |
37190.000 |
32600.000 |
31200.000 |
|
|
|
Capital goods |
42180.000 |
22040.000 |
3250.000 |
|
|
TOTAL IMPORTS |
3105670.000 |
2871830.000 |
2576930.000 |
|
|
|
|
|
|
|
|
|
|
Earnings Per
Share (Rs.) |
68.05 |
64.82 |
61.21 |
|
KEY RATIOS
|
PARTICULARS |
|
31.03.2014 |
31.03.2013 |
31.03.2012 |
|
Net Profit Margin (PAT/Sales) |
(%) |
5.64 |
5.83 |
6.07 |
|
|
|
|
|
|
|
Operating Profit Margin (PBDIT / Sales) |
(%) |
10.21 |
10.76 |
12.07 |
|
|
|
|
|
|
|
Return on Total Assets (PBT/Total Assets} |
(%) |
10.18 |
9.55 |
9.89 |
|
|
|
|
|
|
|
Return on Investment (ROI) (PBT/Networth) |
|
0.14 |
0.15 |
0.16 |
|
|
|
|
|
|
|
Debt Equity Ratio (Total Debt /Networth) |
|
0.43 |
0.30 |
0.35 |
|
|
|
|
|
|
|
Current Ratio (Current Asset/Current Liability) |
|
1.42 |
1.73 |
1.92 |
FINANCIAL ANALYSIS
[all figures are
in Rupees Millions]
DEBT EQUITY RATIO
|
Particular |
31.03.2012 |
31.03.2013 |
31.03.2014 |
|
|
(INR in Mlns.) |
(INR in Mlns.) |
(INR in Mlns.) |
|
Share Capital |
32710.000 |
32290.000 |
32320.000 |
|
Reserves & Surplus |
1628250.000 |
1767660.000 |
1938420.000 |
|
Share Application money
pending allotment |
0.000 |
250.000 |
170.000 |
|
Net worth |
1660960.000 |
1800200.000 |
1970910.000 |
|
|
|
|
|
|
long-term borrowings |
480340.000 |
430120.000 |
627110.000 |
|
Short term borrowings |
105930.000 |
115110.000 |
227700.000 |
|
Total borrowings |
586270.000 |
545230.000 |
854810.000 |
|
Debt/Equity ratio |
0.353 |
0.303 |
0.434 |
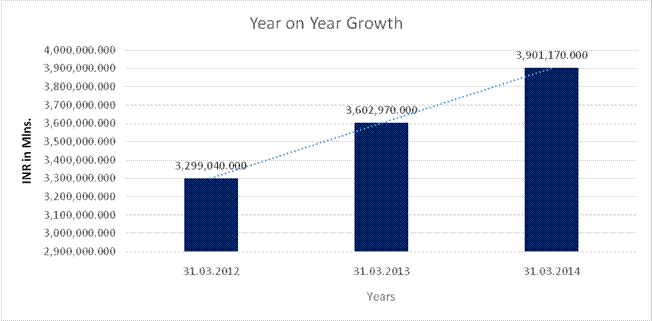
YEAR-ON-YEAR GROWTH
|
Year on Year Growth |
31.03.2012 |
31.03.2013 |
31.03.2014 |
|
|
(INR in Mlns) |
(INR in Mlns) |
(INR in Mlns) |
|
Revenue from Operations |
32,99,040.000 |
36,02,970.000 |
39,01,170.000 |
|
|
|
9.213 |
8.277 |
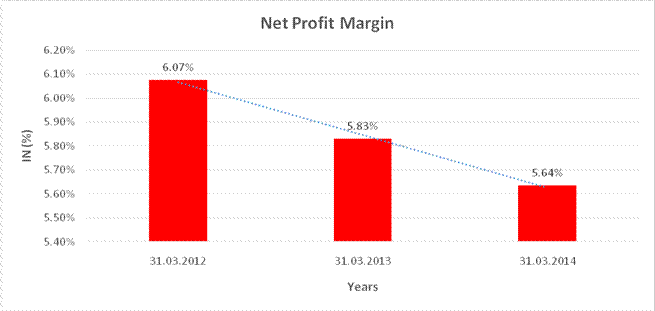
NET PROFIT MARGIN
|
Net Profit Margin |
31.03.2012 |
31.03.2013 |
31.03.2014 |
|
|
(INR in Mlns) |
(INR in Mlns) |
(INR in Mlns) |
|
Revenue from Operations |
32,99,040.000 |
36,02,970.000 |
39,01,170.000 |
|
Profit |
2,00,400.000 |
2,10,030.000 |
2,19,840.000 |
|
|
6.07% |
5.83% |
5.64% |
LOCAL AGENCY FURTHER INFORMATION
CURRENT MATURITIES OF
LONG-TERM DEBT
Rs. In Millions
|
Particular |
31.03.2014 |
31.03.2013 |
31.03.2012 |
|
|
|
|
|
|
Current maturities of long-term debt |
44620.000 |
178820.000 |
98000.000 |
|
|
|
|
|
|
Sr. No. |
Check List by Info Agents |
Available in
Report (Yes / No) |
|
1] |
Year of Establishment |
Yes |
|
2] |
Locality of the firm |
Yes |
|
3] |
Constitutions of the firm |
Yes |
|
4] |
Premises details |
No |
|
5] |
Type of Business |
Yes |
|
6] |
Line of Business |
Yes |
|
7] |
Promoter's background |
Yes |
|
8] |
No. of employees |
Yes |
|
9] |
Name of person contacted |
No |
|
10] |
Designation of contact
person |
No |
|
11] |
Turnover of firm for last
three years |
Yes |
|
12] |
Profitability for last
three years |
Yes |
|
13] |
Reasons for variation
<> 20% |
---------------------- |
|
14] |
Estimation for coming
financial year |
No |
|
15] |
Capital in the business |
Yes |
|
16] |
Details of sister
concerns |
Yes |
|
17] |
Major suppliers |
No |
|
18] |
Major customers |
No |
|
19] |
Payments terms |
No |
|
20] |
Export / Import details
(if applicable) |
No |
|
21] |
Market information |
---------------------- |
|
22] |
Litigations that the firm
/ promoter involved in |
---------------------- |
|
23] |
Banking Details |
Yes |
|
24] |
Banking facility details |
Yes |
|
25] |
Conduct of the banking
account |
---------------------- |
|
26] |
Buyer visit details |
---------------------- |
|
27] |
Financials, if provided |
Yes |
|
28] |
Incorporation details, if
applicable |
Yes |
|
29] |
Last accounts filed at
ROC |
Yes |
|
30] |
Major Shareholders, if
available |
Yes |
|
31] |
Date of Birth of Proprietor/Partner/Director,
if available |
No |
|
32] |
PAN of
Proprietor/Partner/Director, if available |
No |
|
33] |
Voter ID No of
Proprietor/Partner/Director, if available |
No |
|
34] |
External Agency Rating,
if available |
Yes |
|
LITIGATION DETAILS |
||||||
|
Bench:- Bombay |
||||||
|
Presentation Date:- |
06.01.2014 |
|||||
|
Lodging
No.:- |
CEXAL/3/2014 |
Filing
Date:- |
24.02.2014 |
|||
|
Petitioner:- |
THE COMMISSIONER OF CENTRAL EXCISE |
Respondent:- |
M/S. RELIANCE INDUSTRIES LIMITED |
|||
|
Petn.Adv:- |
JITENDRA BRIJBHUSHAN MISHRA (I2937) |
Resp. Adv:- |
M/S. A. S. DAYAL AND ASSOCIATES |
|||
|
District:- |
MUMBAI |
|||||
|
Bench:- |
DIVISION |
Category:- |
CENTRAL EXCISE APPEAL (CEXA) |
|||
|
Status:- |
Pre-Admission |
Stage : |
FRESH ADMISSION |
|||
|
Last
Coram:- |
HON’BLE SHRI JUSTICE S.C. DHARMADHIKARI |
|||||
|
|
HON’BLE SHRI JUSTICE A. K. MENON |
|||||
|
Act :- |
Central Excise and Salt Act |
Under
Section:- 35(G) |
||||
UNSECURED LOAN
(Rs.
In Million)
|
Particulars |
31.03.2014 |
31.03.2013 |
|
Long Term
Borrowings |
|
|
|
Bonds |
99410.000 |
90660.000 |
|
Term Loans- from banks |
512110.000 |
319510.000 |
|
Deferred payment liabilities |
30.000 |
60.000 |
|
|
|
|
|
Short Term
Borrowings |
|
|
|
Other Loans and
Advances |
|
|
|
From Banks |
|
|
|
Foreign Currency Loans - Buyers/Packing credit |
135820.000 |
109780.000 |
|
Rupee Loans |
0.000 |
1000.000 |
|
Total |
747370.000 |
521010.000 |
INDEX OF CHARGES
|
Sr. No. |
Charge ID |
Date of Charge
Creation/Modification |
Charge amount
secured |
CHARGE HOLDER |
ADDRESS |
Service Request
Number (SRN) |
|
1 |
10233708 |
18/08/2010 |
5,000,000,000.00 |
AXIS TRUSTEE SERVICES LIMITED |
MAKER TOWERS 'F', 13TH FLOOR, CUFFE PARADE, COLABA, MUMBAI, MAHARASHTRA - 400005, INDIA |
A91847947 |
|
2 |
10143663 |
24/08/2009 * |
50,000,000,000.00 |
AXIS BANK LIMITED |
13TH FLOOR, "F" WING, MAKER TOWERS, CUFFE PARADE, MUMBAI, MAHARASHTRA - 400005, INDIA |
A69480861 |
|
3 |
10141936 |
12/02/2009 |
10,000,000,000.00 |
IDBI TRUSTEESHIP SERVICES LIMITED |
ASIAN BUILDING, GROUND FLOOR, 17, R.KAMANI MARG, BALLARD ESTATE, MUMBAI, MAHARASHTRA - 400001, INDIA |
A56494032 |
|
4 |
10142081 |
12/02/2009 |
10,000,000,000.00 |
AXIS BANK LIMITED |
13TH FLOOR, "F" WING, MAKER TOWERS, CUFFE PARADE, MUMBAI, MAHARASHTRA - 400005, INDIA |
A56507494 |
|
5 |
10143216 |
12/02/2009 |
5,000,000,000.00 |
AXIS BANK LIMITED |
13TH FLOOR, "F" WING, MAKER TOWERS, CUFFE PARADE, MUMBAI, MAHARASHTRA - 400005, INDIA |
A56639206 |
|
6 |
10082527 |
30/12/2010 * |
126,500,000,000.00 |
STATE BANK OF INDIA |
MADAME CAMA ROAD, NARIMAN POINT, MUMBAI, MAHARASHTRA - 400021, INDIA |
B03977386 |
|
7 |
10269725 |
20/12/2007 |
126,500,000,000.00 |
STATE BANK OF INDIA |
STATE BANK BHAVAN, MADAM CAMA ROAD, MUMBAI, MAHARASHTRA - 400021, INDIA |
A70629001 |
|
8 |
10208261 |
23/07/2007 |
20,200,000,000.00 |
STATE BANK OF INDIA |
STATE BANK BHAVAN, MADAME CAMA ROAD, MUMBAI, MAHARASHTRA - 400021, INDIA |
A70629233 |
|
9 |
10058972 |
12/06/2007 |
500,000,000.00 |
DENA BANK |
INDUSTRIAL FINANCE BRANCH, MAKER TOWER, CUFFE PARADE, MUMBAI, MAHARASHTRA - 400005, INDIA |
A16943219 |
|
10 |
10021285 |
27/10/2006 |
450,973,700.00 |
UTI BANK LIMITED |
TRISHUL 3RD FLOOR OPPOSITE SAMARTHESHWAR TEMPLE, LAW GARDEN ELLISBRIDGE, AHMEDABAD, GUJARAT - 380006, INDIA |
A05375266 |
|
11 |
80012912 |
30/12/2008 * |
264,000,000,000.00 |
SYNDICATE BANK |
3RD FLOOR, 10 HOMJI STREET, FORT, MUMBAI, MAHARASHTRA - 400023, INDIA |
A54800883 |
* Date of charge modification
CONTINGENT
LIABILITIES
(Rs. In Millions)
|
Particular |
31.03.2014 |
31.03.2013 |
31.03.2012 |
|
Claims against the company
/ disputed liabilities not acknowledged as debts |
|
|
|
|
In respect of Joint Ventures |
4140.000 |
-- |
-- |
|
In respect of others |
14330.000 |
16630.000 |
13430.000 |
|
Guarantees |
|
|
|
|
Guarantees to Banks
and Financial Institutions against credit facilities extended to third
parties |
|
|
|
|
In respect of others |
323080.000 |
310800.000 |
295830.000 |
|
Performance
Guarantees |
|
|
|
|
In respect of others |
2900.000 |
2580.000 |
1590.000 |
|
Outstanding
guarantees furnished to Banks and Financial Institutions including in respect
of Letters of Credits |
|
|
|
|
In respect of joint ventures |
7000.000 |
1600.000 |
2280.000 |
|
In respect of others |
48430.000 |
50990.000 |
51670.000 |
|
Other Money for
which the company is contingently liable |
|
|
|
|
Liability in respect of bills discounted with Banks (Including third party bills discounting) |
|
|
|
|
In respect of others |
49700.000 |
39610.000 |
6310.000 |
RESULTS OF OPERATIONS
Operating in a volatile and
uncertain environment, the Company demonstrated the resilience of its business
model. The Company’s best-in-class refining configuration and integrated
petrochemical business enabled it to deliver robust profits in the financial
year 2013-14. The highlights of the Company’s performance are as under:
·
Revenue from operations increased by 8.1% to Rs.4013020.000 Millions
($ 67.0 billion)
·
Exports increased by 15.3% to Rs.2758250.000 Millions
($ 46.0 billion)
·
PBDIT increased by 2.7% at Rs.398130.000 Millions ($ 6.6 billion)
·
Profit Before Tax increased by 5.8% at Rs.278180.000 Millions
($ 4.6 billion)
·
Cash Profit increased by 1.0% to Rs.307950.000 Millions
($ 5.1 billion)
·
Net
profit increased by 4.7% to Rs.219840.000 Millions ($ 3.7 billion)
·
Gross Refining Margin was $ 8.1 / BBL for the year
ended March 31, 2014.
The consolidated revenue
from operations of the Company for the year ended March 31, 2014 was
Rs.4463390.000 Millions ($ 74.5 billion), an increase of 9.3% on a year-on-year
basis.
The Company is one of
India’s largest contributors to the national exchequer primarily by way of
payment of taxes and duties to various government agencies. During the year, a
total of Rs.313740.000 Millions ($ 5.2 billion) was paid in the form of various
taxes and duties.
The Company featured in the
Fortune Global 500 list of the world’s largest corporations for the tenth
consecutive year and was ranked 107th in terms of revenues and 128th in terms
of profits.
MANAGEMENT’S
DISCUSSION AND ANALYSIS
OVERVIEW
The global economy began its modest recovery in FY 2013-14 with improved
demand from OECD economies in the second half of 2013. While the trend is
expected to accelerate in the current year, the positive outlook is subdued by
the potential consequences of ‘tapering’ of some of the US Federal Reserve’s
Quantitative Easing (QE) policies which were undertaken in the aftermath of
global financial crises. Emerging markets like India faced multiple challenges:
capital outflows, intense exchange rate pressures and volatile current account
movement. A combination of persistent intention, fiscal imbalances, external
sector vulnerabilities and low investments resulted in sluggish domestic demand
growth. Fiscal and monetary initiatives taken by the Indian government and the
Reserve Bank of India (RBI) helped stabilise financial market conditions, but
the domestic macro-economic environment still remains challenging.
Economic recovery in the US and Europe had a positive impact on oil
demand, which increased by 1.3 million barrels per day (MMBPD) in 2013. Crude
oil prices fluctuated extensively, driven by supply concerns in Libya, South
Sudan, West Africa and Iraq. Higher US shale oil production helped offset the
impact of these disruptions with Brent crude oil prices averaging marginally
lower at $ 108.7 per barrel in 2013.
Operating in a volatile and uncertain environment, Reliance Industries
Limited (RIL) demonstrated the resilience of its business model. RIL’s
best-in-class raining configuration and integrated petrochemical business
enabled it to deliver robust profits in FY 2013-14. The Company achieved:
·
Highest
ever Revenue of Rs.4013020.000 Millions ($ 67.0 billion) and Net profit of
Rs.219840.000 Millions ($ 3.7 billion)
·
Record
Exports of Rs.2758250.000 Millions ($ 46.0 billion)
·
Record
Refining business EBIT Rs.132200.000 Millions ($ 2.2 billion)
·
Highest
ever consolidated Revenue and Net profit of Rs.4463390.000 Millions ($ 74.5
billion) and Rs.224930.000 Millions ($ 3.8 billion) respectively
·
Dividend
of 95%, highest ever pay-out of Rs.32680.000 Millions ($ 545 million).
Operationally, downstream
segments continued to deliver superior performance with operating rates of over
100%. RIL processed 68.0 million tonnes (MMT) of crude oil at its Jamnagar
refinery complex. The KG-D6 (JV) facility produced 2.31 million barrels (MMBL)
of crude and condensate and 178.3 billion cubic feet (BCF) of natural gas.
RIL’s share of gross JV production in US Shale was 154 BCFe in 2013 reflecting
a growth of 52% over previous year.
The Company featured in the
Fortune Global 500 list of the world’s largest corporations for the tenth
consecutive year and was ranked 107th in terms of revenues and 128th in terms of profits.
FINANCIAL PERFORMANCE
AND REVIEW
Revenue
from operations
of Rs.4013020.000 Millions ($ 67.0 billion), increased 8.1% on a y-o-y basis.
Higher prices accounted for 7.7% growth in revenue and increase in volumes
accounted for 0.4% growth in revenue. Revenues were positively impacted by a
sharp movement in exchange rate, with a 10.4% depreciation of the Indian rupee
vis-à-vis the US dollar. Exports were higher by 15.3% at Rs.2758250.000
Millions ($ 46.0 billion) as against Rs.2392660.000 Millions in FY 2012- 13.
·
Reining business contributes 78% of revenues
(including inter-divisional transfer) and grew by 8.4% as compared to previous
year. The growth in revenue was driven by 8.1% increase in prices and 0.3%
higher volumes.
·
Petrochemicals business accounted for 21% of
revenues and grew by 9.5% as compared to previous year. The growth in revenue
was contributed by 8.6% increase in price and 0.9% higher volumes.
·
Oil and gas business revenue declined by 26.7% as
compared to previous year largely on account of 39.7% decline in production
OUTLOOK
A two trillion dollar
economy catering to a billion-plus population, more than half of which is below
the age of 30. Such a scenario, a rarity in the world’s demographic profile,
represents the foundation for India’s retail sector growth.
India’s organised retail is
witnessing a new surge of optimism and is projected to touch a 20% share of the
total retail market by 2020 vis-à-vis 8% now.
CHARGES
|
ENTITY |
PERSON |
COMPETENT AUTHORITY |
REGULATORY CHARGES |
REGULATORY ACTION (S) / DATE OF ORDER |
FURTHER DEVELOPMENTS |
|
RELIANCE INDUSTRIES LIMITED |
EPFO |
EXEMPTED AND UNEXEMPTED ESTABLISHMENTS DEFAULTED WITH EPFO INCLUDING PROVIDENT FUND, PENSION AND EDLI CONTRIBUTION, ADMINISTRATION CHARGES AND PENAL DAMAGES OF RS.83.55 LAKHS |
AMONG OTHER
ACTIONS, NAMES OF DEFAULTERS PUT ON THE EPFO WEBSITE |
||
|
RELIANCE INDUSTRIES LIMITED |
NSDL |
HIGH PENDING DEMAT REQUESTS |
PUT UP ON NSDL
WEBSITE FOR PUBLIC NOTICE |
NOT APPEARING IN THE LIST DATED 15/04/2011 |
|
|
RELIANCE INDUSTRIES LIMITED |
CDSL |
HIGH PENDING DEMAT REQUESTS |
PUT UP ON CDSL
WEBSITE FOR PUBLIC NOTICE |
NOT APPEARING IN THE LIST DATED 16/04/2011 |
|
|
RELIANCE INDUSTRIES LIMITED |
NSE |
HIGHEST NUMBER OF COMPLAINTS PENDING AS ON 28-FEBRUARY-2007 |
PUT UP ON NSE
WEBSITE FOR PUBLIC NOTICE |
NOT APPEARING IN LIST AS ON 31-MARCH-2007 |
|
|
RELIANCE INDUSTRIES LIMITED |
SEBI |
DID NOT COMPLY WITH SEBI TAKEOVER REGULATIONS, 1997 |
IMPOSED PENALTY RS.4,75,000
|
SAT: IMPUGNED ORDER SET ASIDE WITH NO ORDER AS TO COSTS |
UNAUDITED
STANDALONE FINANCIAL RESULT FOR THE QUARTER / HALF ENDED
30TH
SEPTEMBER, 2014
(Rs. In Millions)
|
Particulars |
Quarter –ended |
Half Year Ended |
|
|
30.09.2014 |
30.06.2014 |
30.09.2014 |
|
|
|
Unaudited |
|
|
|
Income from
Operations |
|
|
|
|
Net sales/Income from Operations |
964860.000 |
963510.000 |
1928370.000 |
|
Total Income
from Operations (Net) |
964860.000 |
963510.000 |
1928370.000 |
|
Expenses |
|
|
|
|
Consumption of Raw Materials |
788510.000 |
809660.000 |
1598170.000 |
|
Purchase of Stock-in-trade |
17360.000 |
17160.000 |
34520.000 |
|
Changes in inventories of Finished Goods, Work in Progress and
Stock-in-Trade |
(5760.000) |
(21200.000) |
(26960.000) |
|
Employee Benefit Expenses |
9320.000 |
9290.000 |
18610.000 |
|
Depreciation and Amortization |
22270.000 |
20240.000 |
42510.000 |
|
Other Expenses |
73080.000 |
73300.000 |
146380.000 |
|
Total |
904780.000 |
908450.000 |
1813230.000 |
|
Profit/ (Loss) from Operations before other Income and Finance Cost |
60080.000 |
55060.000 |
115140.000 |
|
Other income |
21400.000 |
20460.000 |
41860.000 |
|
Profit/ (Loss) from Ordinary Activities before Finance Cost |
81480.000 |
75520.000 |
157000.000 |
|
Finance Costs |
7580.000 |
3240.000 |
10820.000 |
|
Profit/ (Loss) from ordinary Activities after Finance Cost and before
tax |
73900.000 |
72280.000 |
146180.000 |
|
Tax Expenses |
16480.000 |
15790.000 |
32270.000 |
|
Net Profit/ (Loss) from Ordinary Activities After Tax |
57420.000 |
56490.000 |
113910.000 |
|
Paid up Equity Share Capital (Face value of Rs. 10/- each) |
32340.000 |
32330.000 |
32340.000 |
|
Reserves excluding Revaluation Reserve |
|
|
|
|
Earning per shares of Rs. 10/- each |
|
|
|
|
Basic |
17.7 |
17.5 |
35.2 |
|
Diluted (not annualized) |
17.7 |
17.5 |
35.2 |
|
Particulars |
Quarter –ended |
Half Year Ended |
|
|
30.06.2014 |
30.06.2014 |
30.09.2014 |
|
|
Public Shareholding |
|
|
|
|
-Number of Shares |
177.02 |
176.87 |
177.02 |
|
-Percentage of Shareholding |
54.74 |
54.71 |
54.74 |
|
Promoter and Promoter Group Shareholding |
|
|
|
|
Pledged /
Encumbered |
|
|
|
|
-Number of shares |
- |
- |
- |
|
-Percentage of shares (as a % of the total
shareholding of promoter and promoter group) |
- |
- |
- |
|
-Percentage of shares (as a % of the total share
capital of the company) |
- |
- |
- |
|
Non- encumbered |
|
|
|
|
-Number of shares |
146.40 |
146.40 |
146.40 |
|
-Percentage of shares (as a % of the total
shareholding of promoter and
promoter group) |
100 |
100 |
100 |
|
-Percentage of shares (as a % of the total share
capital of the company) |
45.26 |
45.29 |
45.26 |
Notes:
1.
The figures for the corresponding previous period
have been reworked/regrouped wherever necessary, to make them comparable.
2.
The Government of India (GoI), by its letters dated
2nd May, 2012, 14th November, 2013 and 10th July, 2014 has communicated that it
proposes to disallow certain costs which the
Production Sharing Contract (PSC), relating to Block KG-DWN-98/3
entitles the Company to recover. Based on legal advice received, the Company
continues to maintain that a Contractor is entitled to recover all of its costs
under the terms of the PSC and there are no provisions that entitle the
Government to disallow the recovery of any Contract Cost as defined in the PSC.
The Company has already referred the issue to arbitration and already
communicated the same to GoI for
resolution of disputes.
3.
Pursuant to the enactment of the Companies Act 2013
(the 'Act'), the Company has, effective
1st April 2014, reviewed and revised the estimated useful lives of its
fixed assets, generally in accordance
with the provisions of Schedule II to the Act. The consequential impact (after
considering the transition provision specified in Schedule II) on the
depreciation charged and on the results for the quarter is not material.
4.
Based on alternate interpretation for calculation
of diluted EPS as per Accounting Standard (AS)
20 the diluted EPS for the quarter ending Sept 14, June 14 & Sept
13, Half year ending Sept 14 & Sept
13 and Year ended Mar 14 is Rs. 17.7, Rs. 17.4, Rs. 17.0 , Rs. 35.1 , Rs. 33.5
and Rs. 67.9 respectively.
5.
There were no investors’ complaints pending as on
1st July 2014. All the 759 complaints received during the quarter ended 30th
September 2014 were resolved and no complaints were outstanding as on 30th
September 2014.
6.
The Audit Committee has reviewed the above results
and the Board of Directors have approved the above results and its release at
their respective meetings held on 13th October 2014. The Statutory Auditors of
the Company have carried out a Limited Review of the aforesaid results.
STANDALONE
STATEMENT OF ASSETS AND LIABILITIES
|
Particulars |
As at 30th September
2014 (Unaudited) |
|
I.
EQUITY
AND LIABILITIES |
|
|
(1)Shareholders'
Funds |
|
|
(a) Share Capital |
32340.000 |
|
(b) Reserves & Surplus |
2050520.000 |
|
Subtotal
- Shareholders' funds |
2082860.000 |
|
|
|
|
(2)
Share Application money pending allotment |
240.000 |
|
|
|
|
|
|
|
(3) Non-Current
Liabilities |
|
|
(a) long-term borrowings |
679750.000 |
|
(b) Deferred Payment Liabilities |
30.000 |
|
(c) Deferred tax
liabilities (Net) |
123960.000 |
|
Subtotal -Non-current
Liabilities (3) |
803740.000 |
|
|
|
|
(4) Current Liabilities |
|
|
(a) Short
term borrowings |
117500.000 |
|
(b) Trade
payables |
665890.000 |
|
(c) Other current
liabilities |
131250.000 |
|
(d) Short-term
provisions |
12300.000 |
|
Subtotal- Current
Liabilities (4) |
926940.000 |
|
|
|
|
TOTAL- EQUITY AND
LIABILITIES |
3813780.000 |
|
|
|
|
II.
ASSETS |
|
|
(1) Non-current assets |
|
|
(a) Fixed Assets |
1643850.000 |
|
(b) Non-current Investments |
526710.000 |
|
(c) Long-term Loan and Advances |
308970.000 |
|
Subtotal
-Non-Current Assets |
2479530.000 |
|
|
|
|
(2) Current assets |
|
|
(a)
Current investments |
365370.000 |
|
(b) Inventories |
476540.000 |
|
(c) Trade
receivables |
101630.000 |
|
(d) Cash
and bank balance |
261620.000 |
|
(e)
Short-term loans and advances |
123140.000 |
|
(f) Other
current assets |
5950.000 |
|
Subtotal - Current
Assets |
1334250.000 |
|
|
|
|
TOTAL
ASSETS |
3813780.000 |
UNAUDITED
STANDALONE SEGMENT INFORMATION FOR THE QUARTER / HALF YEAR ENDED
30th
SEPTEMBER 2014
|
Particulars |
Quarter – ended |
Half Year Ended |
|
|
30.09.2014 |
30.06.2014 |
30.09.2014 |
|
|
1.Segment
Revenue |
|
|
|
|
- Petrochemicals |
249320.000 |
237150.000 |
486470.000 |
|
- Refining |
917810.000 |
909980.000 |
1827790.000 |
|
- Oil and Gas |
13800.000 |
15570.000 |
29370.000 |
|
- Others |
2210.000 |
1930.000 |
4140.000 |
|
Gross Turnover (Turnover and Inter
Segment Transfers) |
1183140.000 |
1164630.000 |
2347770.000 |
|
Less: Inter Segment Transfers |
185440.000 |
170790.000 |
356230.000 |
|
Turnover |
997700.000 |
993840.000 |
1991540.000 |
|
Less: Excise Duty / Service Tax Recovered |
32840.000 |
30330.000 |
63170.000 |
|
Net Turnover |
964860.000 |
963510.000 |
1928370.000 |
|
|
|
|
|
|
2. Segment
Results |
|
|
|
|
- Petrochemicals |
24030.000 |
18850.000 |
42880.000 |
|
- Refining |
37880.000 |
37730.000 |
75610.000 |
|
- Oil and Gas |
3320.000 |
4870.000 |
8190.000 |
|
- Others |
660.000 |
520.000 |
1180.000 |
|
Total Segment
Profit before Interest and Tax |
65890.000 |
61970.000 |
127860.000 |
|
(i) Interest Expense |
(7580.000) |
(3240.000) |
(10820.000) |
|
(ii) Interest Income |
14410.000 |
13570.000 |
27980.000 |
|
(iii) Other Un-allocable Income (Net of Expenditure) |
1180.000 |
(20.000) |
1160.000 |
|
Profit before
Tax |
73900.000 |
72280.000 |
146180.000 |
|
(i) Provision for Current Tax |
(15390.000) |
(15070.000) |
(30460.000) |
|
(ii) Provision for Deferred Tax |
(1090.000) |
(720.000) |
(1810.000) |
|
Profit
after Tax |
57420.000 |
56490.000 |
113910.000 |
|
|
|
|
|
|
3.Capital
Employed (Segment Assets –
Segment Liabilities) |
|
|
|
|
- Petrochemicals |
471580.000 |
449940.000 |
471580.000 |
|
- Refining |
708880.000 |
709460.000 |
708880.000 |
|
- Oil and Gas |
307010.000 |
290730.000 |
307010.000 |
|
- Others |
383760.000 |
385660.000 |
383760.000 |
|
-Unallocated |
1177620.000 |
1161320.000 |
1177620.000 |
|
Total Capital Employed |
3048850.000 |
2997110.000 |
3025360.000 |
Notes to Segment
Information (Standalone) for the Quarter/ Half Year Ended 30th September 2014
- As per Accounting Standard 17 on
‘Segment Reporting’ (AS 17), the Company has reported ‘Segment
Information’, as described below:
a)
The petrochemicals segment includes production and
marketing operations of petrochemical products namely, High density Polyethylene,
Low density Polyethylene, Linear Low density Polyethylene, Polypropylene,
PolyvinylChloride, Polyester Yarn, Polyester Fibres, Purified Terephthalic
Acid, Paraxylene, Ethylene Glycol, Olefins, Aromatics, Linear Alkyl Benzene,
Butadiene, Acrylonitrile, Poly Butadiene Rubber, Caustic Soda and Polyethylene
Terephthalate.
b)
The refining segment includes production and
marketing operations of the petroleum products.
c)
The oil and gas segment includes exploration,
development and production of crude oil and natural gas.
d)
The smaller business segments not separately
reportable have been grouped under the others segment.
e)
Capital
employed on other investments / assets and income from the same are considered
under unallocable.
FIXED ASSETS:
Tangible Assets
- Leasehold Land
- Freehold Land
- Buildings
- Plant and Machinery
- Electrical Installations
- Equipments
- Furniture and Fixtures
- Vehicles
- Ships
- Aircrafts and Helicopters
Intangible Assets
- Technical Knowhow fees
- Software
- Development Rights
MEDIA
RELEASE
PLANNED
TURNAROUND AT NAGOTHANE MANUFACTURING SITE
Mumbai, December 27, 2014: Reliance
Industries Limited (RIL) has scheduled a planned turnaround at its Nagothane
manufacturing site. The cracker and some of the downstream units will be shut
for approximately four weeks, starting around mid-January 2015.
This opportunity will be used to carry out
routine maintenance activities and for implementing other profit improvement
and energy conservation measures. RIL’s crackers and other downstream units at
other locations will continue at normal levels of operations.
With advance planning and inventory
management, impact on external sales is likely to be
minimal.
About RIL
Reliance Industries Limited (RIL) is India’s
largest private sector company, with a consolidated turnover of Rs. 4463390.000
millions (US$ 74.5 billion), cash profit of Rs. 339800.000 millions (US$ 5.7
billion) and net profit of Rs. 224930.000 millions (US$ 3.8 billion) for the
year ended March 31, 2014.
RIL is the first private sector company from
India to feature in Fortune’s Global 500 list of ‘World’s Largest Corporations’
and continues to be featured for the 11th consecutive year, currently ranking
114th in terms of revenues and 155th in terms of profits. RIL ranks 194th in
the Financial Times’ FT Global 500 2014 list of the world’s largest companies.
As per Newsweek’s Green Rankings 2014, RIL is India’s greenest and most
environment-friendly company, ranking 185th among the world’s largest 500
companies.
CMT REPORT (Corruption, Money Laundering & Terrorism]
The Public Notice information has been collected from various sources
including but not limited to: The Courts,
1] INFORMATION ON
DESIGNATED PARTY
No exist designating subject or any of its beneficial owners,
controlling shareholders or senior officers as terrorist or terrorist
organization or whom notice had been received that all financial transactions
involving their assets have been blocked or convicted, found guilty or against
whom a judgement or order had been entered in a proceedings for violating
money-laundering, anti-corruption or bribery or international economic or
anti-terrorism sanction laws or whose assets were seized, blocked, frozen or
ordered forfeited for violation of money laundering or international
anti-terrorism laws.
2] Court Declaration :
No exist to suggest that subject is or was
the subject of any formal or informal allegations, prosecutions or other
official proceeding for making any prohibited payments or other improper
payments to government officials for engaging in prohibited transactions or
with designated parties.
3] Asset Declaration :
No records exist to suggest that the property or assets of the subject
are derived from criminal conduct or a prohibited transaction.
4] Record on Financial
Crime :
Charges or conviction
registered against subject: None
5] Records on Violation of
Anti-Corruption Laws :
Charges or
investigation registered against subject: None
6] Records on Int’l
Anti-Money Laundering Laws/Standards :
Charges or
investigation registered against subject: None
7] Criminal Records
No available
information exist that suggest that subject or any of its principals have been
formally charged or convicted by a competent governmental authority for any
financial crime or under any formal investigation by a competent government
authority for any violation of anti-corruption laws or international anti-money
laundering laws or standard.
8] Affiliation with
Government :
No record
exists to suggest that any director or indirect owners, controlling
shareholders, director, officer or employee of the company is a government
official or a family member or close business associate of a Government
official.
9] Compensation Package :
Our market
survey revealed that the amount of compensation sought by the subject is fair
and reasonable and comparable to compensation paid to others for similar
services.
10] Press Report :
No press reports / filings exists on
the subject.
CORPORATE GOVERNANCE
MIRA INFORM as part of its Due Diligence do provide comments on Corporate
Governance to identify management and governance. These factors often have been
predictive and in some cases have created vulnerabilities to credit
deterioration.
Our Governance Assessment focuses principally on the interactions
between a company’s management, its Board of Directors, Shareholders and other
financial stakeholders.
CONTRAVENTION
Subject is not known to have contravened any existing local laws,
regulations or policies that prohibit, restrict or otherwise affect the terms
and conditions that could be included in the agreement with the subject.
FOREIGN EXCHANGE RATES
|
Currency |
Unit
|
Indian Rupees |
|
US Dollar |
1 |
Rs.62.10 |
|
|
1 |
Rs.94.10 |
|
Euro |
1 |
Rs.73.42 |
INFORMATION DETAILS
|
Analysis Done by
: |
KAR |
|
|
|
|
Report Prepared
by : |
KLS |
SCORE & RATING EXPLANATIONS
|
SCORE FACTORS |
RANGE |
POINTS |
|
HISTORY |
1~10 |
8 |
|
PAID-UP CAPITAL |
1~10 |
9 |
|
OPERATING SCALE |
1~10 |
9 |
|
FINANCIAL
CONDITION |
|
|
|
--BUSINESS SCALE |
1~10 |
9 |
|
--PROFITABILITY |
1~10 |
9 |
|
--LIQUIDITY |
1~10 |
9 |
|
--LEVERAGE |
1~10 |
9 |
|
--RESERVES |
1~10 |
9 |
|
--CREDIT LINES |
1~10 |
9 |
|
--MARGINS |
-5~5 |
- |
|
DEMERIT POINTS |
|
|
|
--BANK CHARGES |
YES/NO |
YES |
|
--LITIGATION |
YES/NO |
YES |
|
--OTHER ADVERSE INFORMATION |
YES/NO |
NO |
|
MERIT POINTS |
|
|
|
--SOLE DISTRIBUTORSHIP |
YES/NO |
NO |
|
--EXPORT ACTIVITIES |
YES/NO |
NO |
|
--AFFILIATION |
YES/NO |
YES |
|
--LISTED |
YES/NO |
YES |
|
--OTHER MERIT FACTORS |
YES/NO |
YES |
|
DEFAULTER
|
|
|
|
--RBI |
YES/NO |
NO |
|
--EPF |
YES/NO |
NO |
|
TOTAL |
|
80 |
This score serves as a reference to assess
SC’s credit risk and to set the amount of credit to be extended. It is calculated
from a composite of weighted scores obtained from each of the major sections of
this report. The assessed factors and their relative weights (as indicated
through %) are as follows:
Financial
condition (40%) Ownership
background (20%) Payment record
(10%)
Credit history
(10%) Market trend (10%) Operational size
(10%)
RATING EXPLANATIONS
|
RATING |
STATUS |
PROPOSED CREDIT LINE |
|
|
>86 |
Aaa |
Possesses an extremely sound financial base with the strongest capability
for timely payment of interest and principal sums |
Unlimited |
|
71-85 |
Aa |
Possesses adequate working capital. No caution needed for credit
transaction. It has above average (strong) capability for payment of interest
and principal sums |
Large |
|
56-70 |
A |
Financial & operational base are regarded healthy. General
unfavourable factors will not cause fatal effect. Satisfactory capability for
payment of interest and principal sums |
Fairly Large |
|
41-55 |
Ba |
Overall operation is considered normal. Capable to meet normal
commitments. |
Satisfactory |
|
26-40 |
B |
Capability to overcome financial difficulties seems comparatively
below average. |
Small |
|
11-25 |
Ca |
Adverse factors are apparent. Repayment of interest and principal sums
in default or expected to be in default upon maturity |
Limited with
full security |
|
<10 |
C |
Absolute credit risk exists. Caution needed to be exercised |
Credit not
recommended |
|
-- |
NB |
New Business |
-- |
This report is issued at your request without any
risk and responsibility on the part of MIRA INFORM PRIVATE LIMITED (MIPL)
or its officials.