MIRA INFORM
REPORT
|
Report No. : |
302881 |
|
Report Date : |
15.01.2015 |
IDENTIFICATION DETAILS
|
Name : |
OR DE VENDOME |
|
|
|
|
Registered Office : |
6 PL Vendome - 75001 Paris 1 |
|
|
|
|
Country : |
France |
|
|
|
|
Financials (as on) : |
31.12.2013 |
|
|
|
|
Date of Incorporation : |
June 1982 |
|
|
|
|
Com. Reg. No.: |
8 324 613 371 |
|
|
|
|
Legal Form : |
Limited Liability Company |
|
|
|
|
Line of Business : |
Retail Articles watches and jewelery |
|
|
|
|
No. of Employees : |
6 to 9 |
RATING & COMMENTS
|
MIRA’s Rating : |
Ba |
|
RATING |
STATUS |
PROPOSED CREDIT LINE |
|
|
41-55 |
Ba |
Overall operation is considered normal. Capable to meet normal commitments. |
Satisfactory |
|
Status : |
Satisfactory |
|
Payment Behaviour : |
No complaints |
|
Litigation : |
Clear |
NOTES :
Any query related to this report can be made
on e-mail : infodept@mirainform.com
while quoting report number, name and date.
ECGC Country Risk Classification List – September 30, 2014
|
Country Name |
Previous Rating (30.06.2014) |
Current Rating (30.09.2014) |
|
France |
A1 |
A1 |
|
Risk Category |
ECGC
Classification |
|
Insignificant |
A1 |
|
Low |
A2 |
|
Moderate |
B1 |
|
High |
B2 |
|
Very High |
C1 |
|
Restricted |
C2 |
|
Off-credit |
D |
FRANCE - ECONOMIC OVERVIEW
The French economy is
diversified across all sectors. The government has partially or fully privatized
many large companies, including Air France, France Telecom, Renault, and
Thales. However, the government maintains a strong presence in some sectors,
particularly power, public transport, and defense industries. With at least 82
million foreign tourists per year, France is the most visited country in the
world and maintains the third largest income in the world from tourism.
France's leaders remain committed to a capitalism in which they maintain social
equity by means of laws, tax policies, and social spending that mitigate
economic inequality. France's real GDP stagnated in 2012 and 2013. The
unemployment rate (including overseas territories) increased from 7.8% in 2008
to 10.2% in 2013. Youth unemployment in metropolitan France decreased from a
high of 25.4% in the fourth quarter of 2012 to 22.8% in the fourth quarter of
2013. Lower-than-expected growth and high spending have strained France's
public finances. The budget deficit rose sharply from 3.3% of GDP in 2008 to
7.5% of GDP in 2009 before improving to 4.1% of GDP in 2013, while France's
public debt rose from 68% of GDP to nearly 94% over the same period. In
accordance with its EU obligations, France is targeting a deficit of 3.6% of
GDP in 2014 and 2.8% in 2015. The administration of President Francois HOLLANDE
has implemented greater state support for employment, the separation of banks'
traditional deposit taking and lending activities from more speculative
businesses, increasing the top corporate and personal tax rates, including a
temporary 75% tax on wages over one million euros, and hiring an additional
60,000 teachers during his five-year term. In January 2014 HOLLANDE proposed a
“Responsibility Pact” aimed primarily at lowering labor costs in return for
businesses’ commitment to create jobs. Despite stagnant growth and fiscal
challenges, France's borrowing costs have declined in recent years because
investors remain attracted to the liquidity of France’s bonds
|
Source
: CIA |
Company
name and address
Name: OR DE VENDOME
Company number : 32461337100016
Address : 6 PL
VENDOME - 75001 PARIS 1
Tel: 01
42 96 42 34
Company
summary
Trade name REPOSSI
EUR VAT
Number FR89324613371
Activity (APE)
Retail Articles
watches and jewelery
specialty shop (4777Z)
Legal form Limited
Liability Company
Phone 01
42 96 42 34
RCS Registration RCS
Paris 8 324 613 371
Share capital
488,000 Euros
Address
OR DE VENDOME
6 PL VENDOME
75001 PARIS 1
Incorporated Date 06/1982
Nationality France
Status
Economically active
Trading to Date 12/31/2013
12/31/2012 12/31/2011
Turnover 4,579,620
€ 2,805,999 € 2,422,390 €
Gross Operating Surplus 10.51
% Turnover -5.24 % Turnover -3.08 % Turnover
Shareholders' equity
801,295 € -554,743 € -600,871 €
Net result 514,038 € 46,128 €
-568,828 €
Employees
6 to 9 employees –
Company
details
Activity (APE) Retail
Articles watches and jewelery
RCS Registration RCS
Paris 8 324 613 371
Share capital 488,000
Euros
Registration Court
Paris (75)
Legal form Limited
Liability Company
Court Registry Number 19 8 2B05884
EUR VAT Number FR89324613371
Incorporation Date 06/1982
Formation Date 05/1982
Last account Date 31/12/2013
Nationality France
DIRECTORS/MANAGEMENT
Current Directors
1
Directors
Name M.
GIOVE LUCA
Manager position Manager
Date of birth
20/05/1982
Place of birth TURIN(ITALIE)
Previous Directors
Manager position Title
and name Date of
Birth/Place of Birth
Manager M
GIANCARLO GIORDANO ---
Manager M
LUCA GIOVE 5/20/1982
- TURIN(ITALIE)
Manager M
VITO GIOVE 6/16/1947
- TURIN ITALIE
NEGATIVE
INFORMATION
Judgements
Collective procedures
No judgment information for the company
SHARE
& SHARE CAPITAL INFORMATION
Share capital 488,000 Euros
PAYMENT
INFORMATION
Payment Information Summary - Trade Payment Data
Total number of Invoices available 1
Total number of Invoices paid within or up to 30 days after the due date
0
Total number of Invoices paid more than 30 days after the due date 0
Total number of Invoices currently outstanding where the due date has
not yet been reached 1
Total number of Invoices currently outstanding beyond the due date
GROUP
STRUCTURE & AFFILIATED COMPANIES
Group data
Group Structure
No group information available for the company
Linkages
No Linkages information available for the company
FINANCIAL INFORMATION
|
Display para meter |
|
|
Currency |
Euro |
|
Comparison mode |
Median |
|
Annual Accounts |
31/1 2/2013 |
31/1 2/2012 |
31/1 2/2011 |
|
Account period (month) |
12 |
12 |
12 |
|
Account Type |
Normal |
Normal |
Normal |
|
Date of capture |
16/10/2014 |
05/09/2013 |
15/10/2012 |
|
Activity Code |
4777Z |
4777Z |
4777Z |
|
Employees |
12 |
9 |
9 |
Active
account
|
Annual Accounts |
31/1 2/2013 |
|
31/1 2/2012 |
|
31/1 2/2011 |
Secto p rveaian ju\s |
|
|
Capital not called |
0 |
0% |
0 |
0% |
0 |
0 |
0% |
|
Total fixed assets |
234,267 |
3.6% |
226,204 |
0.3% |
225,501 |
86,949 |
169.4% |
|
- Intangible assets |
121,959 |
0% |
121,959 |
0% |
121,959 |
53,291 |
128.9% |
|
- Targible assets |
93,284 |
9.5% |
85,221 |
0.9% |
84,488 |
13,408 |
595.7% |
|
- Financial assets |
19J024 |
0% |
19J024 |
-0,2% |
19J054 |
1,600,50 |
1088,6% |
|
Net current assets |
2,076,110 |
20.3% |
1,725,717 |
-3.6% |
1,789
£59 |
207,796.50 |
899.1% |
|
-Stocks |
404,535 |
-33.2% |
605,405 |
28.1% |
472,583 |
131,742 |
207.1% |
|
- Advanced payments |
0 |
20,3% |
0 |
0% |
0 |
0 |
0% |
|
- Receivables |
1,508,509 |
54.9% |
973,594 |
-19.9% |
1,215,548 |
13,405.50 |
11152.9% |
|
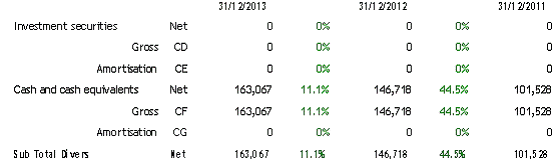
- Securities and cash |
163,067 |
11.1% |
146,718 |
44.5% |
101,528 |
22J080 |
638.5% |
|
- Prepaid expenses |
- |
- |
- |
- |
- |
1,083 |
- |
|
Accounts of |
|
|
|
|
|
|
|
|
regularization |
u |
|
u |
|
u |
u |
J* |
|
Total Assets |
2,310,311 |
18.4* |
1,951,921 |
■3.1* |
2,015,160 |
31/, 646 |
62/.35S |
Passive
Account

Results

Accounts - Active
Grand
Total - Passive Accounts (I to IV)
|
Display
para meter |
|
|
Currency |
Euro |
|
Normal Account |
31/1 2/2013 |
31/1
2/2012 |
31/1 2/2011 |
|
Months |
12 |
12 |
12 |
|
|
|
31/1
2/2013 |
|
31/1
2/2012 |
|
31/1
2/2011 |
|
Grand Total (1 to VI) |
Hot |
2,310,3/7 |
18.4S |
1,95
1,921 |
■3,156 |
2,015,160 |
|
Gross |
CO |
2,5/7,436 |
16.556 |
2,211,816 |
■2,056 |
2,25
7,991 |
|
Amortisation |
1A |
26/.0
59 |
2.856 |
259,8
95 |
7.056 |
242,8
31 |
|
|
|
31/1 2/2013 |
|
31/1 2/2012 |
|
31/1 2/2011 |
|
Total Active fixed asset
(II) |
Net |
234,26/ |
3,656 |
226,204 |
0,356 |
225,501 |
|
Gross |
BJ |
474,561 |
3,3% |
459,334 |
4,0% |
441,567 |
|
Amortisation |
BK |
240,294 |
3,1% |
233,130 |
7,9% |
216,066 |
Intangilble
fixed assets
|
|
|
31/1 2/2013 |
|
31/1 2/2012 |
|
31/1 2/2011 |
|
Start-up cost |
Net |
0 |
0% |
0 |
0% |
0 |
|
Gross |
AB |
0 |
0% |
0 |
0% |
0 |
|
Amortisation |
AC |
0 |
0% |
0 |
0% |
0 |
|
R&D expenses |
Net |
0 |
0% |
0 |
0% |
0 |
|
Gross |
CX |
0 |
0% |
0 |
0% |
0 |
|
Amortisation |
AE |
0 |
0% |
0 |
0% |
0 |
|
Distributorships, patents |
Net |
0 |
0% |
0 |
0% |
0 |
|
Gross |
AF |
0 |
0% |
0 |
0% |
0 |
|
Amortisation |
AG |
0 |
0% |
0 |
0% |
0 |
|
Goodwill |
Net |
121,959 |
0% |
121,959 |
0% |
121,959 |
|
Gross |
AH |
121,959 |
0% |
121,959 |
0% |
121,959 |
|
Amortisation |
Al |
0 |
0% |
0 |
0% |
0 |
|
Other intangible fixed assets |
Net |
0 |
0% |
0 |
0% |
0 |
|
Gross |
AJ |
0 |
0% |
0 |
0% |
0 |
|
Amortisation |
AK |
0 |
0% |
0 |
0% |
0 |
|
Pre-payments
and doiAjnpayments |
Net |
u |
us |
u |
us |
u |
|
Gross |
AL |
0 |
0% |
0 |
0% |
0 |
|
Amortisation |
AM |
0 |
0% |
0 |
0% |
0 |
|
Sub Total Intangible
Assets |
Het |
121,959 |
056 |
121,959 |
056 |
121,959 |
Intangilble
fixed assets
|
|
|
31/1 2/2013 |
|
31/1 2/2012 |
|
31/1 2/2011 |
|
Lands |
Net |
0 |
0% |
0 |
0% |
0 |
|
Gross |
AN |
0 |
0% |
0 |
0% |
0 |
|
Amortisation |
AO |
0 |
0% |
0 |
0% |
0 |
|
Buildings |
Net |
0 |
0% |
0 |
0% |
0 |
|
Gross |
AP |
0 |
0% |
0 |
0% |
0 |
|
Amortisation |
AQ |
0 |
0% |
0 |
0% |
0 |
|
Plant |
Net |
0 |
0% |
0 |
0% |
0 |
|
Gross |
AR |
0 |
0% |
0 |
0% |
0 |
|
Amortisation |
AS |
0 |
0% |
0 |
0% |
0 |
|
Other tangible fixed assets |
Net |
93,284 |
9,5% |
85,221 |
0,9% |
84,488 |
|
Gross |
AT |
333,578 |
4,8% |
318,351 |
5,9% |
300,554 |
|
Amortisation |
AU |
240,294 |
3,1% |
233,130 |
7,9% |
216,066 |
|
Fixed assets in construction |
Net |
0 |
0% |
0 |
0% |
0 |
|
Gross |
AV |
0 |
0% |
0 |
0% |
0 |
|
Amortisation |
AW |
0 |
0% |
0 |
0% |
0 |
|
Advances and payments on |
|
|
|
|
|
|
|
account |
|
u |
U?c |
u |
|
u |
|
|
|
|
|
|
|
|
|
Gross |
AX |
0 |
0% |
0 |
0% |
0 |
|
Amortisation |
AY |
0 |
0% |
0 |
0% |
0 |
|
Sub Total Tangible asset |
Net |
93,284 |
|
85,221 |
|
84,488 |
Financial
assets
|
|
|
31/1 2/2013 |
|
31/1 2/2012 |
|
31/1 2/2011 |
|
Associates at equity |
Net |
0 |
0% |
0 |
0% |
0 |
|
Gross |
CS |
0 |
0% |
0 |
0% |
0 |
|
Amortisation |
CT |
0 |
0% |
0 |
0% |
0 |
|
Other participations |
Net |
0 |
0% |
0 |
0% |
0 |
|
Gross |
CU |
0 |
0% |
0 |
0% |
0 |
|
Amortisation |
CV |
0 |
0% |
0 |
0% |
0 |
|
Inter-company receivables |
Net |
0 |
0% |
0 |
0% |
0 |
|
Gross |
BB |
0 |
0% |
0 |
0% |
0 |
|
Amortisation |
BC |
0 |
0% |
0 |
0% |
0 |
|
Other investment
securities |
Net |
0 |
0% |
0 |
0% |
0 |
|
Gross |
BD |
0 |
0% |
0 |
0% |
0 |
|
Amortisation |
BE |
0 |
0% |
0 |
0% |
0 |
|
Loans |
Net |
0 |
0% |
0 |
0% |
0 |
|
Gross |
BF |
0 |
0% |
0 |
0% |
0 |
|
Amortisation |
BG |
0 |
|
0 |
|
0 |
|
Other financial assets |
Net |
19J024 |
0% |
19J024 |
-0,2% |
19J054 |
|
Gross |
BH |
19J024 |
0% |
19J024 |
-0,2% |
19J054 |
|
Amortisation |
Bl |
0 |
0% |
0 |
0% |
0 |
|
Sub Total Fi nancial
Assets |
|
19,024 |
|
19,024 |
|
19,054 |
Financial
assets
|
|
|
31/1 2/2013 |
|
31/1
2/2012 |
|
31/1 2/2011 |
|
Total Assets |
Net |
2,0/6,110 |
20 . 35S |
1,725,71
7 |
-3.6SS |
1,78 9,659 |
|
Gross |
CJ |
2,102 £75 |
20,0% |
1,752/162 |
-3,5% |
1,816/124 |
|
Amortisation |
CK |
26,765 |
0% |
26,765 |
0% |
26,765 |
Stocks
|
|
|
31/1 2/2013 |
|
31/1 2/2012 |
|
31/1 2/2011 |
|
Raw materials |
Net |
3,430 |
-54.7% |
7,500 |
-26.4% |
10,194 |
|
Gross |
BL |
3,400 |
-54.7% |
7,500 |
-26.4% |
10,194 |
|
Amortisation |
BM |
0 |
0% |
0 |
0% |
0 |
|
Work in progress ^oods) |
Net |
0 |
0% |
0 |
0% |
0 |
|
Gross |
BN |
0 |
0% |
0 |
0% |
0 |
|
Amortisation |
BO |
0 |
0% |
0 |
0% |
0 |
|
Work in progress
(services) |
Net |
0 |
0% |
0 |
0% |
0 |
|
Gross |
BP |
0 |
0% |
0 |
0% |
0 |
|
Amortisation |
BQ |
0 |
0% |
0 |
0% |
0 |
|
Semi-finished and finished |
|
|
|
|
|
|
|
products |
1461 |
u |
|
u |
|
u |
|
Gross |
BR |
0 |
0% |
0 |
0% |
0 |
|
Amortisation |
BS |
0 |
0% |
0 |
0% |
0 |
|
Goods for resale |
Net |
401,135 |
-32,9% |
597,905 |
29,3% |
462,389 |
|
Gross |
BT |
427,900 |
-31.5% |
624,670 |
27.7% |
489,154 |
|
Amortisation |
BU |
26,765 |
0% |
26,765 |
0% |
26,765 |
|
Sub Total Stocks |
Met |
404,5 35 |
■33,26 |
605,405 |
28,156 |
472,583 |
Advance
payments to suppliers
|
|
|
31/1 2/2013 |
|
31/1 2/2012 |
|
31/1 2/2011 |
|
Advance payments to |
|
|
|
|
|
|
|
suppliers |
|
u |
|
u |
|
u |
|
|
|
|
|
|
|
|
|
Gross |
BV |
0 |
0% |
0 |
0% |
0 |
|
Amortisation |
BW |
0 |
0% |
0 |
0% |
0 |
Debtu rs
|
|
|
31/1 2/2013 |
|
31/1 2/2012 |
|
31/1 2/2011 |
|
Total shareholders' equity [Total 1) |
UL |
OU 1 ,£1\> |
|
-3Llt,H) |
i. >xi |
-OUU ,0 1 1 |
|
Equity and shareholders' equity |
UH |
<400,UUU |
|
DUU,UUU |
|
□
UUjUUU |
|
Issue and merger premiums |
DB |
0 |
0% |
0 |
0% |
0 |
|
Revaluation differentials |
DC |
0 |
0% |
0 |
0% |
0 |
|
Of which equity
differential |
EK |
0 |
0% |
0 |
0% |
0 |
|
Legal reserve |
DD |
26£41 |
0% |
26
£41 |
0% |
26 £41 |
|
Statutory or contractual reserve |
|
u |
|
u |
|
u |
|
Special regulated reserves |
DF |
0 |
0% |
0 |
0% |
0 |
|
Of which special reserve
of |
|
|
|
|
|
|
|
provisions for current |
B1 n |
|
0 |
0% |
0 |
0% |
|
fluctuation |
u |
|
|
|
|
|
|
Other reserves |
DG |
0 |
0% |
0 |
0% |
0 |
|
Of which reserve for
buying |
|
|
|
|
|
|
|
or^tials works from alive |
EJ 0 |
|
0 |
|
0 |
0% |
|
artists |
|
|
|
|
|
|
|
Profits or losses brought
forward |
UM |
-£Li
,JtM |
Q'l.SJt |
-'I ,L£.tfi \l |
|
-OH,OQq |
|
Profit or loss for the
period |
Dl |
514,038 |
1014.4% |
46,128 |
108.1% |
-568,828 |
|
|
n i |
n |
|
n |
|
n |
|
Special tax-allowable
reserves |
DK |
0 |
0% |
0 |
0% |
0 |
Debtu rs

Divers
Prepaid
expenses

Equalization
accounts (IV to VI)
Accounts
- Passive
Grand
Total - Passive Accounts (I to IV)
![]()
Shareholder
Equity (I)

Liabilities
(IV)
|
|
|
31/1 2/2013 |
|
31/1 2/2012 |
|
31/1 2/2011 |
|
Total Liabilities (Total
IV) |
EC |
1,509
JO 82 |
-39.8% |
2,506
£64 |
3.9% |
2,412J031 |
|
Convertible debentures |
DS |
0 |
0% |
0 |
0% |
0 |
|
Other debentures |
DT |
0 |
0% |
0 |
0% |
0 |
|
Bank loans and liabilities |
DU |
0 |
0% |
0 |
0% |
0 |
|
Sundry loans and financial |
|
|
|
|
|
|
|
liabilities |
uv |
|
-vv.vs |
4titi,zVI |
us |
|
|
Of which participating
loans |
El |
0 |
0% |
0 |
0% |
0 |
|
Advance payments received |
|
|
|
|
|
|
|
for current orders |
|
u |
US |
u |
us |
u |
|
Trade accounts payables |
DX |
201,662 |
-78.4% |
933,964 |
6.1% |
880,444 |
|
Tax and social security |
|
|
|
|
|
|
|
liabilities |
ur |
|
|
|
D. US |
|
|
Fixed asset liabilities |
DZ |
0 |
0% |
0 |
0% |
0 |
|
Other debts |
EA |
1,100,932 |
21.2% |
|?08,707 |
3.7% |
875,950 |
|
|
|
31/1 2/2013 |
|
31/1
2/2012 |
|
31/1 2/2011 |
|
Tra nslati o n loss (Total
V) |
ED |
0 |
05K |
0 |
OS |
0 |
|
|
|
31/1 2/2013 |
|
31/1 2/2012 |
|
31/1 2/2011 |
|
Of which tax-allowable |
|
|
|
|
|
|
|
reserve |
tr |
u |
us |
u |
us |
u |
|
Deferred income and |
|
|
|
|
|
|
|
liabilities |
tu |
|
us |
u |
us |
u |
|
Of which current bank |
|
|
|
|
|
|
|
facilities |
en |
u |
|
u |
U^t |
u |
|
|
|
31/1 2/2013 |
31/1 2/2012 |
31/1
2/2011 |
|
Operati ng result (Total
Ml) |
|
463,1 24 1058,256 |
39,988 113.556 |
-295,458 |
|
! - Financial result (V - |
VI) |
|
|
|
|
|
|
31/1 2/2013 |
31/1 2/2012 |
31/1
2/2011 |
|
Fi nandal result (Total
V-VI) |
c-v |
0 056 |
-49 8 /, 856 |
-403 |
|
4 - Extraordinary result (VII-VIII) |
|||
|
31/1 2/2013 |
31/1
2/2012 |
|
31/1 2/2011 |
|
Extraordinary result
(Total |
CUB1* |
|
|
|
Profit or loss |
|||
|
31/1 2/2013 |
31/1
2/2012 |
|
31/1 2/2011 |
|
Profit or loss 1h 514,0 38 101
4,456 |
46,128 |
108,156 |
-568,8 28 |
![]()
|
|
|
31/1 2/2013 |
|
31/1 2/2012 |
|
31/1 2/2011 |
|
Sale of goods for resale |
FC |
3,999,136 |
70,4% |
2,347
£42 |
20,2% |
1,952,993 |
|
France |
FA |
1,223,294 |
37,6% |
888,724 |
9,7% |
809,855 |
|
Export |
FB |
2,775
£32 |
90,3% |
1,458
£18 |
27,6% |
1,143,138 |
|
Sale of goods produced |
FF |
0 |
0% |
0 |
0% |
0 |
|
France |
FD |
0 |
0% |
0 |
0% |
0 |
|
Export |
FE |
0 |
0% |
0 |
0% |
0 |
|
Sale of services |
FI |
580,494 |
26,6% |
458,657 |
-2,3% |
469,397 |
|
France |
FG |
579,994 |
26,8% |
457,552 |
-2,3% |
468,497 |
|
Export |
FH |
500 |
-54,8% |
1,105 |
22,8% |
900 |
|
Net turnover |
FL |
4,579
£20 |
63,2% |
2,805,999 |
15,8% |
2,422
£90 |
|
France |
FJ |
1,803,288 |
33,9% |
1,346,276 |
5,3% |
1,278
£52 |
|
Export |
FK |
2,776
£32 |
90,2% |
1,459,723 |
27,6% |
1,144
£38 |
|
Stocked production |
FM |
0 |
0% |
0 |
0% |
0 |
|
Self-constructed assets |
FN |
0 |
0% |
0 |
0% |
0 |
|
Operating grants |
FO |
0 |
0% |
0 |
0% |
0 |
|
Release of reserves and |
|
|
|
|
|
|
|
|
rr |
u |
U^ |
ZUH,UUU |
|
u |
|
provisions |
|
|
|
|
|
|
|
Other income |
FQ |
0 |
0% |
0 |
0% |
0 |
Exploitation Charges

Reserve for depreciation
Situation
and movement of reserve for depreciation
Grand total (l-ll-lll)
|
|
|
31/1 2/2013 |
|
31/1 2/2012 |
|
31/1 2/2011 |
|
Gross value |
VT |
1,527,532 |
53,9% |
992,617 |
-19,6% |
1,234 £01 |
|
1 year at most |
VU |
1,527,532 |
53,9% |
992,617 |
-18,3% |
1,215,547 |
|
More than one year |
W |
0 |
0% |
0 |
0% |
19J054 |
|
tate of bans |
||||||
|
|
|
31/1 2/2013 |
|
31/1 2/2012 |
|
31/1 2/2011 |
|
Claims related to |
|
|
|
|
|
|
|
shareholdings (1 year at |
UM 0 |
0 |
|
0% |
0 |
0% |
|
most) |
|
|
|
|
|
|
|
Loans (gross) |
UP |
0 |
0% |
0 |
0% |
0 |
|
Loans (1 year at most) |
UR |
0 |
0% |
0 |
0% |
0 |
|
Other financial assets
feross) |
UT |
19JQ24 |
0% |
19J024 |
-0,2% |
19J054 |
|
at most |
||||||
|
|
|
31/1 2/2013 |
|
31/1 2/2012 |
|
31/1 2/2011 |
|
Customers doubtful or disputed |
|
u |
|
u |
|
u |
|
Other claims customer |
ux |
461,135 |
116.8% |
212,732 |
-62.6% |
568,621 |
|
Receivables represent
Loaned Securities |
uu |
u |
us |
u |
us |
u |
|
Provision for depreciation
previously established |
ULJ |
u |
us |
u |
us |
u |
|
Personnel and associated
accounts |
U T |
u |
us |
u |
us |
u |
|
Social Security and other
social organizations |
|
u |
us |
u |
us |
u |
|
Income taxes |
Wi |
3,750 |
0% |
3,750 |
0% |
3,750 |
|
Value added tax |
VB |
8,642 |
-68.9% |
27,777 |
-21.0% |
35,162 |
|
Group and Associates |
VC |
0 |
0% |
0 |
0% |
0 |
|
Accounts receivable |
|
|
|
|
|
|
|
(including
claims relating to the operation of pension titles) |
VR |
1,001,688 |
46,0% |
685,936 |
19,4% |
57 |
|
|
|
31/1 2/2013 |
|
31/1
2/2012 |
|
31/1 2/2011 |
|
Prepaid |
VS |
33,293 |
-23.2% |
43 £49 |
29.8% |
33,408 |
|
|
|
31/1 2/2013 |
|
31/1
2/2012 |
|
31/1 2/2011 |
|
Total debt (gross) |
VY |
1,50 9,081 |
-3 9.856 |
2,50
6,664 |
3.9* |
2,41 2,0 31 |
|
1 year at most |
VZ2 |
1,509 £81 |
-9,3% |
1,664,161 |
117,8% |
764,119 |
|
More than 5 years |
VZ4 |
0 |
0% |
488,291 |
-42.0% |
842,503 |
|
Other liabilities (gross) |
fill |
J82.635 |
97.45K |
396,551 |
40.8* |
281,5 60 |
|
1 year at most |
3K2 |
782,635 |
97.4% |
396,551 |
40.3% |
281,560 |
|
Debt representative of |
|
|
|
|
|
|
|
borrowed securities |
SZ1 |
0 |
05K |
|
0 |
OS |
|
(gross) |
0 |
|
|
|
|
|
|
1 year at most |
SZ2 |
0 |
0% |
0 |
0% |
0 |
|
|
|
31/1 2/2013 |
|
31/1 2/2012 |
|
31/1 2/2011 |
|
Loans made during the
period |
VJ |
0 |
0% |
0 |
0% |
0 |
|
Debt repaid during the
period |
w |
0 |
0% |
0 |
0% |
0 |
Table
allocation results and other information Dividends distributed
|
|
|
31/1 2/2013 |
|
31/1 2/2012 |
|
31/1 2/2011 |
|
|
Dividends |
ZE |
0 |
0% |
0 |
0% |
0 |
|
|
iommitments |
|||||||
|
|
|
31/1 2/2013 |
|
31/1 2/2012 |
|
31/1 2/2011 |
|
|
Commitments
leasing furniture |
|
u |
uk |
u |
UK |
u |
|
|
Commitments
Real Estate Leasing |
1 K |
u |
us |
u |
UK |
u |
|
|
Effects
brought to the discount and unmatured |
1 i |
u |
|
u |
UK |
u |
|
|
)ther charges Externes |
|||||||
|
|
|
31/1 2/2013 |
|
31/1 2/2012 |
|
31/1 2/2011 |
|
|
Subcontracting |
YT |
0 |
0% |
0 |
0% |
0 |
|
|
Rentals,
rental charges and condominiums |
|
z 1 :,ooo |
US) |
u |
UK |
u |
|
|
Staff outside the company |
YU |
0 |
0% |
0 |
0% |
0 |
|
|
Remuneration intermediaries and fees (excluding fees) |
ii |
1/yBBS. |
US |
u |
US |
u |
|
|
Fees,
commissions and brokerage |
TV |
u |
us |
u |
us |
u |
|
|
Other accounts |
ST |
1,059,274 |
0% |
0 |
0% |
0 |
|
|
Total Other purchases and external |
£J |
|
us |
u |
us |
u |
|
|
31/1 2/2013 |
31/1
2/2012 |
31/1 2/2011 |
|||||
|
Business tax |
YW |
8,090 |
0% |
0 |
0% |
0 |
|
|
Other taxes and payments assimilated |
■iL. |
ZUJU^O |
us |
u |
us |
u |
|
|
Total taxes and fees |
YX |
28,138 |
0% |
0 |
0% |
0 |
|
|
|
|||||||
|
|
|
31/1 2/2013 |
|
31/1 2/2012 |
|
31/1 2/2011 |
|
|
Amount VAT collected |
YY |
338,980 |
0% |
0 |
0% |
0 |
|
|
Total VAT on goods and services |
1L |
|
us |
u |
us |
u |
|
Ratios
Structure and Liquidity
|
|
31/1 2/2013 |
|
31/1 2/2012 |
|
31/1 2/2011 |
Sectu r ttedian
2U13 |
|
|
Margin |
|
|
|
|
|
|
|
|
trading |
|
b.BS |
4H./HS |
|
|
4b.VZJt |
|
|
Profitability |
|
|
|
|
|
|
|
|
of the |
10,51 |
300,6% |
-5,24 |
-70,1% |
|
3,08 |
5.09% |
|
business |
|
|
|
|
|
|
|
|
Net profit |
11,22% |
534,1% |
1.64% |
107.0% |
-23.48% |
2.59% |
333.2% |
|
Growth |
|
|
|
|
|
|
|
|
rate of |
|
|
|
|
|
|
|
|
turnover |
63,21% |
299,1% |
15,84% |
8900% |
-0 |
18% |
5,23% 1C |
|
(excluding |
|
|
|
|
|
|
|
|
|
31/1 2/2013 |
|
31/1 2/2012 |
|
31/1 2/2011 |
Sector rtedian ans |
|
|
Cash flow |
|
|
|
|
|
|
|
|
from
the overall |
11,79% |
424,0% |
2,25% |
109.9% |
-22, |
?8% |
4,77% |
|
profitability |
|
|
|
|
|
|
|
|
Rates of |
|
|
|
|
|
|
|
|
economic |
60% |
-72,9% |
221% |
234,3% |
|
66% |
7.93% |
|
profitability |
|
|
|
|
|
|
|
|
Financial |
|
|
|
|
|
|
|
|
profitability |
tsuuvss |
|
|
|
-GUUH/'IS |
tJioVUS |
|
|
Return on |
|
|
|
|
|
|
|
|
|
31/1 2/2013 |
|
31/1
2/2012 |
|
31/1
2/2011 |
Sector
Median 2U13 |
|
|
Turnover |
4,5/9,620 |
63.236 |
2,80
5,999 |
15.836 |
2,422,3
90 |
324,730
t |
1310.356 |
|
|
31/1 2/2013 |
|
31/1
2/2012 |
|
31/1
2/2011 |
Sector
Median 2U13 |
|
|
Turnover |
4,5/9,620 |
63.236 |
2,80
5,999 |
15.836 |
2,422,3
90 |
324,730
t |
1310.356 |
|
Gross operati ng surplus |
481,203 i |
427.556 |
-146,948 i |
-9 7.156 |
- 74,54 5 i |
1 3,60 3 i |
343
7.556 |
|
+ Release of reserves and |
|
|
|
|
|
|
|
|
+ Other operating income |
0 |
0% |
0 |
0% |
0 |
|
|
|
- Other charges |
0 |
0% |
0 |
0% |
0 |
|
|
|
Operati ng result |
463,1 24 i 10.11 56 |
1058,256 |
39,98 8 i |
113,556 |
295,458 t CA |
10,066 i |
4500.956 Wi .t)Si |
FOREIGN
EXCHANGE RATES
Na
ADDITIONAL
INFORMATION
This company is not under monitoring
Establishment
details
Trade name REPOSSI
Postal Address
OR DE VENDOME
6 PL VENDOME
75001 PARIS 1
Trading Address 6 PLACE
VENDOME
75001 PARIS 1
Telephone 01
42 96 42 34
Formation Date 05/1982
Location surface
From 300 m² to less
than
400 m²
Seasonality
Department Paris
(75)
Region
Ile-de-France
District 1
Area 99
City PARIS
1
Size of urban area Paris
conglomeration
Other
establishments
Branches 1 branch entities in this
company
Head office
> OR DE VENDOME <<<
- Commerce de détail
d'articles d'horlogerie et de bijouterie
en magasin spécialisé (4777Z) in PARIS 1 (75001)
Secondary
establishments
Regionality Legal unit with all establishments in same area
Mono-activity
status
Legal unit having all establishments with the same
main activity
Workforces
Workforce at address 6 to 9 employees Company workforce 6 to 9
employees
Event History
Status history
No Status History
![]()
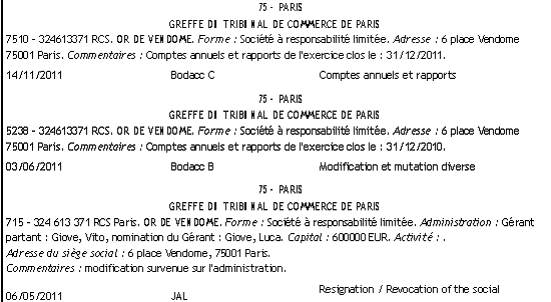

Company
events history
Date Description
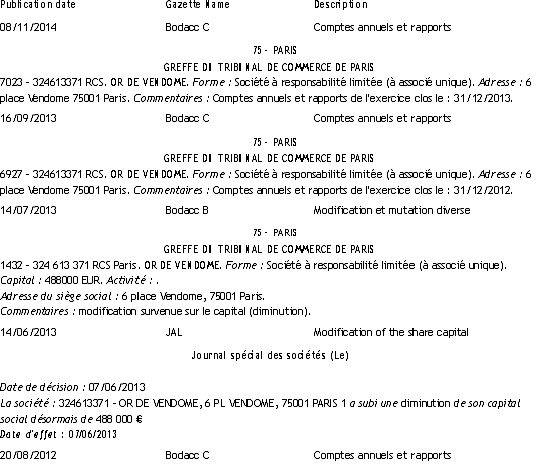
08/11/2014 Bodacc C :
Deposit accounts notice
17/10/2014 Consideration of
a balance sheet that has led to a
reassessment of this
company's creditworthiness
31/12/2013 New accounts
available
16/09/2013 Bodacc C :
Deposit accounts notice
06/09/2013
Consideration of a balance sheet that has
led to a
reassessment of this company's
creditworthiness
14/07/2013 Bodacc B:
Various editing or changing
27/06/2013 New legal form –
new category
27/06/2013 Capital increase
27/06/2013 Capital
reduction
27/06/2013 Minutes of
general meeting of shareholders
27/06/2013 Updated articles
of association
27/06/2013 Amendment
07/06/2013 Other
modification of Establishment
07/06/2013 Legal Gazette:
Modification of the share capital
31/12/2012 New accounts
available
17/10/2012 Consideration of
a balance
20/08/2012 Bodacc C :
Deposit accounts notice
31/12/2011 New accounts
available
14/11/2011 Bodacc C :
Deposit accounts notice
01/10/2011 Consideration of
a balance sheet that has led to a
03/06/2011 Bodacc B: Various
editing or changing
18/05/2011 New manager
18/05/2011 Minutes of
general meeting of shareholders
18/05/2011 Appointment/resignation
of company officers
06/05/2011 Legal Gazette:
Resignation / Revocation of the
social
representative
31/12/2010 New accounts available
27/09/2010 Bodacc C : Deposit accounts notice
31/12/2009 New accounts available
01/10/2009 Bodacc C : Deposit accounts notice
31/12/2008 New accounts available
26/09/2008 Bodacc C : Deposit accounts notice
31/12/2007 New accounts available
31/12/2006 New accounts available
31/12/2005 New accounts available
31/12/2004 New accounts available
25/11/2004 Minutes of general meeting of shareholders
25/11/2004 Minutes of general meeting of shareholders
25/11/2004 PV d'Assemblée
25/11/2004 Private document
25/11/2004 Private document
25/11/2004 Capital reduction
25/11/2004 Capital reduction
25/11/2004 Réduction de Capital
25/11/2004 Capital increase
25/11/2004 Capital increase
31/12/2003 New accounts available
12/12/2002 Acte sous seing privé
12/12/2002 Statuts mis à jour
12/12/2002 PV d'Assemblée
12/12/2002 Modification de l'objet social
18/10/2002Continuation malgré perte supérieure à la moitié du
capital
18/10/2002 Acte sous seing privé
18/10/2002 Reconstitution de l'Actif Net
18/10/2002 PV d'Assemblée
06/08/2001 Reconstitution de l'Actif Net
06/08/2001 PV d'Assemblée
06/08/2001 Statuts mis à jour
06/08/2001 Acte sous seing privé
06/08/2001 Augmentation de Capital
06/08/2001 Conversion du Capital Social en Euros
06/08/2001 Réduction de Capital
21/09/1995 Acte modificatif
21/09/1995Continuation malgré perte supérieure à la moitié du capital
21/09/1995 PV d'Assemblée
NOTES
& COMMENTS
Na
FOREIGN EXCHANGE RATES
|
Currency |
Unit
|
Indian Rupees |
|
US Dollar |
1 |
Rs.62.15 |
|
UK Pound |
1 |
Rs.94.24 |
|
Euro |
1 |
Rs.73.30 |
INFORMATION DETAILS
|
Analysis Done by
: |
SUB |
|
|
|
|
Report Prepared
by : |
NIS |
RATING EXPLANATIONS
|
RATING |
STATUS |
PROPOSED CREDIT LINE |
|
|
|
>86 |
Aaa |
Possesses an extremely sound financial base with the strongest
capability for timely payment of interest and principal sums |
Unlimited |
|
|
71-85 |
Aa |
Possesses adequate working capital. No caution needed for credit
transaction. It has above average (strong) capability for payment of interest
and principal sums |
Large |
|
|
56-70 |
A |
Financial & operational base are regarded healthy. General
unfavourable factors will not cause fatal effect. Satisfactory capability for
payment of interest and principal sums |
Fairly Large |
|
|
41-55 |
Ba |
Overall
operation is considered normal. Capable to meet normal commitments. |
Satisfactory |
|
|
26-40 |
B |
Capability to overcome financial difficulties seems comparatively
below average. |
Small |
|
|
11-25 |
Ca |
Adverse factors are apparent. Repayment of interest and principal sums
in default or expected to be in default upon maturity |
Limited with
full security |
|
|
<10 |
C |
Absolute credit risk exists. Caution needed to be exercised |
Credit not
recommended |
|
|
-- |
NB |
New Business |
-- |
|
This score serves as a reference to assess
SC’s credit risk and to set the amount of credit to be extended. It is
calculated from a composite of weighted scores obtained from each of the major
sections of this report. The assessed factors and their relative weights (as
indicated through %) are as follows:
Financial
condition (40%) Ownership
background (20%) Payment
record (10%)
Credit history
(10%) Market trend (10%) Operational size
(10%)
This report is issued at your request without any
risk and responsibility on the part of MIRA INFORM PRIVATE LIMITED (MIPL) or
its officials.