MIRA INFORM REPORT
|
Report No. : |
303071 |
|
Report Date : |
20.01.2015 |
IDENTIFICATION DETAILS
|
Name : |
PEPE JEANS SL |
|
|
|
|
Registered Office : |
Crta. Laurea Miro, 403 -405. - Sant Feliu De Llobregat - 08980 -
Barcelona |
|
|
|
|
Country : |
Spain |
|
|
|
|
Financials (as on) : |
2013 |
|
|
|
|
Date of Incorporation : |
05.05.1998 |
|
|
|
|
Legal Form : |
Private Company |
|
|
|
|
Line of Business : |
Wholesale of Textiles. |
|
|
|
|
No. of Employee : |
787 [2013] |
RATING & COMMENTS
|
MIRA’s Rating : |
Ba |
|
RATING |
STATUS |
PROPOSED CREDIT LINE |
|
|
41-55 |
Ba |
Overall operation is considered normal. Capable to meet normal
commitments. |
Satisfactory |
|
Status : |
Satisfactory |
|
Payment Behaviour : |
No Complaints |
|
Litigation : |
Clear |
NOTES :
Any query related to this report can be made
on e-mail : infodept@mirainform.com
while quoting report number, name and date.
ECGC Country Risk Classification List – September 30, 2014
|
Country Name |
Previous Rating (30.06.2014) |
Current Rating (30.09.2014) |
|
Spain |
A2 |
A2 |
|
Risk Category |
ECGC
Classification |
|
Insignificant |
A1 |
|
Low |
A2 |
|
Moderate |
B1 |
|
High |
B2 |
|
Very High |
C1 |
|
Restricted |
C2 |
|
Off-credit |
D |
SPAIN - ECONOMIC OVERVIEW
Spain experienced a prolonged
recession in the wake of the global financial crisis. GDP contracted by 3.7% in
2009, ending a 16-year growth trend, and continued contracting through most of
2013. Economic growth resumed in late 2013, albeit only modestly, as credit
contraction in the private sector, fiscal austerity, and high unemployment
continued to weigh on domestic consumption and investment. Exports, however,
have been resilient throughout the economic downturn, partially offsetting
declines in domestic consumption and helped to bring Spain's current account
into surplus in 2013 for the first time since 1986. The unemployment rate rose
from a low of about 8% in 2007 to more than 26% in 2013, straining Spain's
public finances as spending on social benefits increased while tax revenues
fell. Spain’s budget deficit peaked at 11.4% of GDP in 2009. Spain gradually
reduced the deficit to just under 7% of GDP in 2013, slightly above the 6.5%
target negotiated between Spain and the EU. Public debt has increased
substantially – from 60.1% of GDP in 2010 to 93.4% in 2013. Rising labor
productivity, moderating labor costs, and lower inflation have helped to
improve foreign investor interest in the economy and to reduce government
borrowing costs. The government's ongoing efforts to implement reforms - labor,
pension, health, tax, and education - are aimed at supporting investor
sentiment. The government also has shored up struggling banks exposed to
Spain's depressed domestic construction and real estate sectors by successfully
completing an EU-funded restructuring and recapitalization program in December
2013.
|
Source
: CIA |
|
EXECUTIVE
SUMMARY
|
|
|
Name: |
PEPE JEANS SL |
|
NIF / Fiscal code: |
B61663555 |
|
Trade Name |
PEPE JEANS |
|
Status: |
ACTIVE WITH PARTIAL DIVISION OF CAPITAL |
|
Incorporation Date: |
05/05/1998 |
|
Register Data |
Register Section 8 Sheet 178404 |
|
Last Publication in BORME: |
13/10/2014 [Appointments] |
|
Last Published Account Deposit: |
2014 |
|
Share Capital: |
517.461,20 |
|
Localization: |
Crta. Laurea Miro, 403 -405. - Sant Feliu De Llobregat - 08980 -
Barcelona |
|
Telephone - Fax - Email - Website: |
Ph.:. 936 327 500 Email. store@pepejeans.es Website. www.pepejeans.com |
|
Number of Branches |
1 |
|
|
|
|
Activity: |
|
|
NACE: |
4641 - Wholesale of textiles |
|
Registered Trademarks: |
|
|
Audited / Opinion: |
Si / |
|
Tenders and Awards: |
0 for a total cost of 0 |
|
Subsidies: |
4 for a total cost of 316104 |
|
Quality Certificate: |
No |
|
|
|
|
Defaults, Legal
Claims and Insolvency Proceedings : |
|
|
|
|
|
|
|
Number |
Amount (€) |
Most Recent
Entry |
|
Insolvency Proceedings, Bankruptcy and Suspension of Payments |
|
Unpublished |
--- |
--- |
|
Defaults on debt with Financial Institutions and Large Companies |
|
None |
--- |
--- |
|
Judicial Claims (Notices, Executive Proceedings, Attachments, Auctions,
Bad Debt) |
|
None |
0 |
--- |
|
Proceedings heard by the Civil Court |
|
Unpublished |
0 |
--- |
|
Proceedings heard by the Labour Court |
|
Unpublished |
0 |
--- |
Partners
|
|
CARLOS ORTEGA CEDRON Y ALMUDENA OLAZABAL ARACO |
22.18 % |
|
|
DEYA CAPITAL II SCR DE REGIMEN COMUN SA |
1.86 % |
|
|
DEYA CAPITAL III FCR DE REGIMEN COMUN |
2.18 % |
|
|
PEPE JEANS EQUIPO GESTOR GRUPO |
5.92 % |
|
|
EQUIPO GESTOR TORREAL SCR, S.A. |
0.61 % |
|
|
DEYA CAPITAL S.C.R. DE REGIMEN SIMPLIFICADO SA |
12.13 % |
|
|
GRUPO TORREAL |
29.97 % |
|
|
JAVIER RAVENTOS |
3.13 % |
|
|
PEPE EUROPEAN HOLDINGS BV |
10.69 % |
|
|
SLPP, S.A. |
11.33 % |
|
|
Shares: |
1 |
|
|
Other Links: |
13 |
|
|
No. of Active Corporate Bodies: |
|
|
|
Ratios |
2013 |
2012 |
Change |
|
|
Nº of employees: |
787 |
|
|
|
|
|
|
|
Guarantees: |
|
|
Properties Registered: |
Company NO, Administrator NO |
|
Financing / Guarantee Sources : |
Sources YES, Guarantees YES |
Identification
|
|
|
Social
Denomination: |
PEPE JEANS SL |
|
Trade Name: |
PEPE JEANS |
|
NIF / Fiscal
code: |
B61663555 |
|
Corporate
Status: |
ACTIVE WITH PARTIAL DIVISION OF CAPITAL |
|
Start of
activity: |
1998 |
|
Registered
Office: |
CRTA. LAUREA MIRO, 403 -405. |
|
Locality: |
SANT FELIU DE LLOBREGAT |
|
Province: |
BARCELONA |
|
Postal Code: |
08980 |
|
Telephone: |
936 327 500 |
|
Fax: |
936 327 525 |
|
Website: |
www.pepejeans.com |
|
Email: |
store@pepejeans.es |
|
Interviewed
Person: |
This information was obtained through indirect sources, the refusal by
the responsible members of society to provide any collaboration for the
preparation of this paper. |
Branch
Offices
|
|
Address |
Postal Code |
City |
Province |
|
Alfonso XII, 30 |
28014 |
MADRID |
MADRID |
Activity
|
|
|
NACE: |
4641 |
|
Additional
Information: |
The company is engaged in the manufacturing and sale of women and men
clothing and shoes. |
|
Franchise: |
No |
|
Import / export: |
EXPORTS |
|
Future
Perspective: |
Consolidation |
|
Industry
situation: |
Maturity |
Number
of Employees
|
|
Year |
No. of employees |
Established |
Incidentals |
|
2013 |
787 |
|
|
Chronological
Summary
|
|||
|
|
Year |
Act |
|
|
|
1998 |
Appointments/ Re-elections (2) Company Formation (1) Errata (2)
Increase of Capital (1) Statutory Modifications (1) |
|
|
|
1999 |
Accounts deposit (ejer. 1999) Appointments/ Re-elections (2) Change of
Social Denomination (3) Take-over Merger (5) |
|
|
|
2000 |
Appointments/ Re-elections (1) Cessations/ Resignations/ Reversals (1) |
|
|
|
2001 |
Accounts deposit (ejer. 2000) Appointments/ Re-elections (4) Cessations/
Resignations/ Reversals (1) Change of Social address (1) Increase of Capital
(1) |
|
|
|
2002 |
Accounts deposit (ejer. 2001, 2002) Appointments/ Re-elections (3)
Cessations/ Resignations/ Reversals (1) |
|
|
|
2003 |
Accounts deposit (ejer. 2002 consolidated) Appointments/ Re-elections
(1) Cessations/ Resignations/ Reversals (1) Increase of Capital (1) |
|
|
|
2004 |
Accounts deposit (ejer. 2003 consolidated, 2004 consolidated, 2003, 2004)
Appointments/ Re-elections (5) Cessations/ Resignations/ Reversals (1)
Statutory Modifications (1) |
|
|
|
2005 |
Accounts deposit (ejer. 2005 consolidated, 2005) Appointments/
Re-elections (3) Capital Reduction (1) Cessations/ Resignations/ Reversals
(1) Increase of Capital (1) Statutory Modifications (2) |
|
|
|
2006 |
Other Concepts/ Events (1) |
|
|
|
2007 |
Accounts deposit (ejer. 2006 consolidated, 2006) Appointments/
Re-elections (2) Cessations/ Resignations/ Reversals (1) |
|
|
|
2008 |
Accounts deposit (ejer. 2007 consolidated, 2008 consolidated, 2007,
2008) Appointments/ Re-elections (6) Cessations/ Resignations/ Reversals (1) |
|
|
|
2009 |
Appointments/ Re-elections (5) Cessations/ Resignations/ Reversals (3)
Errata (1) Partial split (2) |
|
|
|
2010 |
Accounts deposit (ejer. 2009 consolidated, 2009) Appointments/ Re-elections
(4) Capital Reduction (1) Cessations/ Resignations/ Reversals (1) Other
Concepts/ Events (1) Partial split (1) Statutory Modifications (1) |
|
|
|
2011 |
Accounts deposit (ejer. 2010 consolidated, 2010) Statutory
Modifications (1) |
|
|
|
2012 |
Accounts deposit (ejer. 2011 consolidated, 2011) Appointments/
Re-elections (3) Cessations/ Resignations/ Reversals (1) Increase of Capital
(1) |
|
|
|
2013 |
Accounts deposit (ejer. 2012 consolidated, 2012) Appointments/ Re-elections
(3) Cessations/ Resignations/ Reversals (1) |
|
|
|
2014 |
Accounts deposit (ejer. 2013 consolidated, 2013) Appointments/
Re-elections (3) Cessations/ Resignations/ Reversals (1) Increase of Capital
(2) Statutory Modifications (1) |
|
|
|
2015 |
Accounts deposit (ejer. 2014 consolidated, 2014) |
|
Breakdown
of Owners' Equity
|
|
|
Registered
Capital: |
517.461,20 |
|
Paid up capital: |
517.461,20 |
Updated
Evolution of the Subscribed and Paid-in Capital
|
|||||
|
Publishing Date |
Registration
Type |
Capital
Subscribed |
Paid up capital |
Underwritten
result |
Disbursed Result |
|
26/06/1998 |
Company Formation |
480.810 |
480.810 |
480.810 |
480.810 |
|
26/06/1998 |
Increase of Capital |
120.202 |
120.202 |
601.012 |
601.012 |
|
22/11/2001 |
Increase of Capital |
8.990 |
8.990 |
610.000 |
610.000 |
|
04/02/2003 |
Increase of Capital |
152.500 |
152.500 |
762.500 |
762.500 |
|
12/07/2005 |
Increase of Capital |
1.015 |
1.015 |
763.515 |
763.515 |
|
12/07/2005 |
Capital Reduction |
-256.964 |
-256.964 |
506.551 |
506.551 |
|
13/09/2010 |
Capital Reduction |
-1.015 |
-1.015 |
505.536 |
505.536 |
|
20/11/2012 |
Increase of Capital |
6.189 |
6.189 |
511.726 |
511.726 |
|
26/02/2014 |
Increase of Capital |
513 |
513 |
512.238 |
512.238 |
|
09/09/2014 |
Increase of Capital |
5.223 |
5.223 |
517.461 |
517.461 |
Active
Social Bodies
|
|
Post published |
Social Body's
Name |
Appointment Date |
Other Positions
in this Company |
|
PRESIDENT |
DIAZ RATO REVUELTA JOSE |
16/11/2007 |
3 |
|
PRESIDENT OF THE EXECUTIVE COMM. |
ORTEGA CEDRON CARLOS VICENTE |
14/08/2012 |
8 |
|
MEMBER OF THE BOARD |
MARK LINDSAY REED |
06/06/2014 |
1 |
|
|
PHILIPPE MARIE FRANCHET |
10/07/2012 |
1 |
|
|
JOEL JAY HOROWITZ |
12/11/2010 |
1 |
|
|
ARTA CAPITAL SGECR SA |
18/10/2010 |
1 |
|
|
SLPP SA |
18/10/2010 |
1 |
|
|
DIAZ RATO REVUELTA JOSE |
09/04/2010 |
3 |
|
|
ABELLO GAMAZO JUAN CLAUDIO |
25/11/2009 |
1 |
|
|
PRA MARTOS ENRIQUE |
25/11/2009 |
1 |
|
COMBINED PROXY |
RAVENTOS NEGRA JAVIER |
10/06/2013 |
12 |
|
JOINT ATTORNEY |
CAMPS ALFARO XAVIER |
27/11/2013 |
1 |
|
|
RAVENTOS NEGRA JAVIER |
10/06/2013 |
12 |
|
JOINT ATTORNEY/COMBINED PROXY |
SOUCHEIRON MARCET ALBERTO |
08/04/2014 |
1 |
|
PROXY |
SENDINO VILLARREAL CRISTINA |
12/04/2013 |
2 |
|
|
FIGAR DE LA CALLE JAVIER |
12/04/2013 |
1 |
|
|
BART JULIEN GASPARD DENOLF |
12/04/2013 |
1 |
|
|
SOTOMAYOR FIGUERUELO JUAN JOSE |
12/04/2013 |
1 |
|
|
CARLO GALLO |
03/07/2009 |
1 |
|
|
ALEXIA MAURELLI |
03/07/2009 |
1 |
|
|
LINARES GOMEZ MARIA TERESA |
12/05/2009 |
1 |
|
|
JARABO FLORIDO MARIA ISABEL |
12/05/2009 |
1 |
|
|
FERNANDEZ PLAZA LAURA |
16/01/2009 |
1 |
|
|
NISHITH SHASHIKANT SONEJI |
16/01/2009 |
1 |
|
|
MAS RIBO RICARD |
16/01/2009 |
1 |
|
|
MARTIN ARGENTA DAVID DE LOS RIOS |
16/01/2009 |
1 |
|
|
PRIETO RUIZ MONTSE |
16/01/2009 |
1 |
|
|
NIGEL PETER MIDGLEY |
16/01/2009 |
2 |
|
|
ESTALELLA MALET SARA |
16/01/2009 |
3 |
|
|
ALVAREZ GONZALEZ JOSE |
16/01/2009 |
1 |
|
|
MARTINEZ CALATAYUD GABRIEL |
16/01/2009 |
4 |
|
|
LOPEZ LOMEÑA ANDRES |
16/01/2009 |
3 |
|
|
AMOROS VILA RAMON |
16/01/2009 |
2 |
|
|
CASTELLANO ORTEGA VICENTE |
16/01/2009 |
4 |
|
|
JIMENEZ SANCHEZ ELENA |
21/05/2002 |
1 |
|
|
ROVIRA TORRES MIGUEL |
21/05/2002 |
1 |
|
|
CARTAÑA MANTILLA JORGE |
21/05/2002 |
1 |
|
|
OÑA MORA VICTOR |
21/05/2002 |
1 |
|
|
ANGULO VALDEARENAS JUAN CARLOS |
21/05/2002 |
1 |
|
NON CONSELLOR SECRETARY |
LOPEZ LOMEÑA ANDRES |
14/08/2012 |
3 |
|
|
MARTIN GARCIA JOSE MANUEL |
12/07/2005 |
1 |
|
NON CONSELLOR ASSISTANT SECRETARY |
ESTALELLA MALET SARA |
17/08/2010 |
3 |
|
MEMBER OF THE EXECUTIVE COMM. |
ORTEGA CEDRON CARLOS VICENTE |
14/08/2012 |
8 |
|
|
CASTELLANO ORTEGA VICENTE |
14/08/2012 |
4 |
|
REPRESENTATIVE |
CARNE CASAS RAMON |
18/10/2010 |
1 |
|
|
BABECKI CAMPUZANO JULIO ANDRES |
18/10/2010 |
1 |
|
|
BILBAO SORENSE MIKEL |
05/10/2000 |
1 |
|
ACCOUNTS' AUDITOR / HOLDER |
PRICEWATERHOUSECOOPERS AUDITORES SL |
03/10/2014 |
2 |
|
CONSOLIDATED ACCOUNTS' AUDITOR |
PRICEWATERHOUSECOOPERS AUDITORES SL |
03/10/2014 |
2 |
Historical
Social Bodies
|
|
Social Body's
Name |
Post published |
End Date |
Other Positions
in this Company |
|
3I IBERICA DE INVERSIONES INDUSTRIALES SA |
MEMBER OF THE BOARD |
26/03/2004 |
2 |
|
|
MEMBER OF THE BOARD |
12/07/2005 |
|
|
ABELLO GAMAZO CRISTIAN PABLO |
MEMBER OF THE BOARD |
25/11/2009 |
1 |
|
ALDAVERO BERNALTE FRANCISCO RAMON |
NON CONSELLOR SECRETARY |
12/07/2005 |
1 |
|
AMOROS VILA RAMON |
PROXY |
16/01/2009 |
2 |
|
ANDREW LEWIS FINE |
MEMBER OF THE BOARD |
03/03/2009 |
2 |
|
|
MEMBER OF THE BOARD |
12/11/2010 |
|
|
AYALA MUÑOZ LOURDES |
NON CONSELLOR ASSISTANT SECRETARY |
12/07/2005 |
1 |
|
BILBAO SORENSEN MIKEL |
REPRESENTATIVE |
12/07/2005 |
1 |
|
CARNE MASLLORENS SILVIA |
PROXY |
30/12/2002 |
1 |
|
CASTELLANO ORTEGA VICENTE |
MEMBER OF THE BOARD |
09/04/2010 |
4 |
|
|
MEMBER OF THE BOARD |
14/08/2012 |
|
|
COMPAÑIA IMPORTADORA DE CALIFORNIA SA |
MEMBER OF THE BOARD |
26/03/2004 |
1 |
|
DEL CORRO GARCIA LOMAS PEDRO |
MEMBER OF THE BOARD |
16/11/2007 |
2 |
|
|
PRESIDENT |
16/11/2007 |
|
|
DEYA CAPITAL SCRRS SA |
MEMBER OF THE BOARD |
10/07/2012 |
1 |
|
DIAZ ANDREU GARCIA BERNARDINO |
MEMBER OF THE BOARD |
25/11/2009 |
1 |
|
DIAZ RATO REVUELTA JOSE |
MEMBER OF THE BOARD |
09/04/2010 |
3 |
|
ESTALELLA MALET SARA |
PROXY |
16/01/2009 |
3 |
|
LOPEZ LOMEÑA ANDRES |
PROXY |
16/01/2009 |
3 |
|
LUDOVICUS RUDOLF ONNINK |
REPRESENTATIVE |
27/10/2001 |
1 |
|
MARCH JUAN JUAN |
REPRESENTATIVE |
10/07/2012 |
1 |
|
MARTINEZ CALATAYUD GABRIEL |
PROXY |
16/01/2009 |
4 |
|
|
PROXY |
06/09/2001 |
|
|
|
PROXY |
30/12/2002 |
|
|
NIGEL PETER MIDGLEY |
PROXY |
16/01/2009 |
2 |
|
OLAZABAL ARACO ALMUDENA |
REPRESENTATIVE |
26/03/2004 |
1 |
|
ORTEGA CEDRON CARLOS VICENTE |
MEMBER OF THE BOARD |
09/04/2010 |
8 |
|
|
MEMBER OF THE BOARD |
14/08/2012 |
|
|
|
PROXY |
30/08/2005 |
|
|
|
PROXY |
10/06/2013 |
|
|
|
REPRESENTATIVE |
09/04/2003 |
|
|
|
REPRESENTATIVE |
25/07/2008 |
|
|
ORTEGA CEDRON FRANCISCO JAVIER |
REPRESENTATIVE |
26/03/2004 |
1 |
|
PARESHKUMAR SHAH |
REPRESENTATIVE |
26/03/2004 |
1 |
|
PEPE JEANS EUROPE BV |
MEMBER OF THE BOARD |
26/03/2004 |
1 |
|
PRICE WATERHOUSE AUDITORES SA |
ACCOUNTS' AUDITOR / HOLDER |
27/10/2001 |
1 |
|
PRICE WATERHOUSE COOPERS AUDITORES SL |
ACCOUNTS' AUDITOR / HOLDER |
17/05/2004 |
9 |
|
|
ACCOUNTS' AUDITOR / HOLDER |
17/05/2004 |
|
|
|
ACCOUNTS' AUDITOR / HOLDER |
02/11/2004 |
|
|
|
ACCOUNTS' AUDITOR / HOLDER |
07/11/2008 |
|
|
|
ACCOUNTS' AUDITOR / HOLDER |
05/10/2005 |
|
|
|
ACCOUNTS' AUDITOR / HOLDER |
10/01/2008 |
|
|
|
ACCOUNTS' AUDITOR / HOLDER |
10/01/2008 |
|
|
|
ACCOUNTS' AUDITOR / HOLDER |
03/10/2014 |
|
|
|
ACCOUNTS' AUDITOR / HOLDER |
02/02/2012 |
|
|
PUCON S.A |
MEMBER OF THE BOARD |
25/07/2008 |
1 |
|
PUCON SA |
PRESIDENT |
12/07/2005 |
3 |
|
|
MEMBER OF THE BOARD |
26/03/2004 |
|
|
|
PRESIDENT |
26/03/2004 |
|
|
RAVENTOS NEGRA JAVIER |
PROXY |
30/09/2002 |
12 |
|
|
MEMBER OF THE BOARD |
26/03/2004 |
|
|
|
PROXY |
06/09/2001 |
|
|
|
MEMBER OF THE BOARD |
09/04/2010 |
|
|
|
MEMBER OF THE BOARD |
14/08/2012 |
|
|
|
PROXY |
10/06/2013 |
|
|
|
MEMBER OF THE EXECUTIVE COMM. |
06/06/2014 |
|
|
|
MEMBER OF THE BOARD |
06/06/2014 |
|
|
|
MEMBER OF THE BOARD |
12/07/2005 |
|
|
|
PROXY |
30/08/2005 |
|
|
SANZ PONCELAS ANGELICA |
PROXY |
16/01/2009 |
1 |
|
SAPIÑA TORRENTS BEATRIZ |
PROXY |
16/01/2009 |
1 |
|
SENDINO VILLARREAL CRISTINA |
PROXY |
16/01/2009 |
2 |
|
SILAS KEI FONG CHOU |
MEMBER OF THE BOARD |
12/07/2005 |
1 |
|
VIÑAS RODRIGUEZ DANIEL |
REPRESENTATIVE |
05/10/2000 |
1 |
Executive
board
|
|
Post |
NIF |
Name |
|
FINANCIAL DIRECTOR |
|
NIGEL MIDGLEY |
|
MANAGING DIRECTOR |
|
JAVIER RAVENTOS |
Defaults, Legal Claims and Insolvency Proceedings
|
Section enabling assessment of the degree of compliance of the company queried
with its payment obligations. It provides information on the existence and
nature of all stages of Insolvency and Legal Proceedings published with
reference to the Company in the country's various Official Bulletins and
national newspapers, as well Defaults Registered in the main national credit
bureaus (ASNEF Industrial and RAI ).
> Summary
Chronological
summary
|
|
|
Number of
Publications |
Amount (_) |
Start date |
End date |
|
Insolvency Proceedings, Bankruptcy and Suspension of Payments |
|
Unpublished |
--- |
--- |
--- |
|
Request/Declaration |
|
0 |
--- |
date |
|
|
Proceedings |
|
--- |
--- |
|
--- |
|
Resolution |
|
--- |
--- |
|
--- |
|
Defaults on debt with Financial Institutions and Large Companies |
Bank and Commercial Delinquency |
None |
0 |
|
|
|
Status: Friendly |
|
--- |
|
|
|
|
Status: Pre-Litigation |
|
--- |
|
|
|
|
Status: Litigation |
|
--- |
|
|
|
|
Status: Non-performing |
|
--- |
|
|
|
|
Status: insolvency proceedings, bankruptcy and suspension of payments |
|
--- |
|
|
|
|
Other status |
|
--- |
|
|
|
|
Legal and Administrative Proceedings |
|
Unpublished |
--- |
|
|
|
Notices of defaults and enforcement |
|
--- |
--- |
|
--- |
|
Seizures |
|
--- |
--- |
|
--- |
|
Auctions |
|
--- |
--- |
|
--- |
|
Declarations of insolvency and bad debt |
|
--- |
--- |
|
--- |
|
Proceedings heard by the Civil Court |
|
Unpublished |
--- |
|
|
|
Proceedings heard by the Labour Court |
|
Unpublished |
--- |
|
|
> Details
|
Positive Factors |
Adverse Factors |
|
No judicial claims have been detected in the Official Gazettes,
regarding any Entity's outstanding debts with the Tax Bureau or Social
Security administrations, as submitted by Courts of the various court
jurisdictions. No irregular payment performance has been detected based on
information obtained from credit bureaus. It is one of the major domestic companies in terms of sales volume. PEPE JEANS SL 's borrowing cost is appropriate according to its volume
of external financing sources. The development of the structure of the debt during the last two years
indicates a decrease of the debt with credit institutions and trade creditors
in respect to all liabilities. The lower the level of debt, the lower the dependence
on suppliers capital and the more guarantee will have its financial
situation. |
PEPE JEANS SL it presents an excessive indebtedness that may
compromise their balance sheet. Reduced level of liquidity. The company shows not enough capacity to
meet its obligations with a maturity of less than one year with the available
liquid assets. Solvency decrease. Its capacity to bear the cost derived form debts
incurred with third parties has decreased significantly in its last fiscal
year. |
TREND
OF SCORING
|
> Latest Scoring Changes :
|
Scoring |
Evolution |
Date |
Event |
|
|
Neutral |
26/05/14 |
Scoring revision based on commercial investigation. |
|
Neutral |
16/04/14 |
Update of relevant information about Social Bodies |
|
|
Neutral |
07/03/14 |
Updating of financial statements. |
|
|
Neutral |
04/03/14 |
Updating of relevant commercial information. |

According to a business research conducted by axesor, this company has
been found to have regular payment performance and has paid all of its debts
timely.
Probability of default
|
> Estimated Probability of Default for the next 12 months:
0.640 %
|
Sector in which comparison is carried out: 464 Wholesale of household goods |
|
|
Relative Position:
|
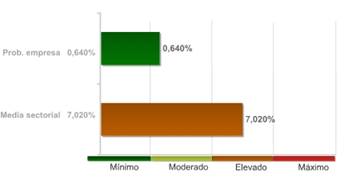
The company's comparative analysis with the rest of the companies that
comprise the sector, shows the company holds a better position with regard to
the probability of non-compliance.
The 99.00% of the companies of the sector PEPE JEANS SL belongs to show
a higher probability of non-compliance.
The probability of the company's non-compliance with its payment obligations
within deadlines estimated by our qualifications models is 0.640%.
In the event they fail to comply with the payment, the seriousness of
the loss will depend on factors such as the promptness of the commencement of
the charging management, the existence of executive documents which match the
credit or the existence of guarantees and free debt assets under the name of
the debtor. Therefore, the probability of non-compliance should not be solely
interpreted as the total loss of the owed amount.
Recommended commercial credit
|
Favourable until 3.100.000
€ (Guideline value of outstanding commercial balance that r
recommends be awarded to or maintained with the company queried)
Result
of query submitted to the R.A.I. (Spanish Bad Debt Register) on
|
LEGAL CLAIMS
|
|
Summary of Judicial Claims |
|
PROCEDURES OF
CONTEST, BANKRUPTCY AND BANKRUPTCY PROTECTION |
|
|
|
|
|
No se han publicado |
|
|
|
No se han publicado |
|
|
|
|
|
|
|
No se han publicado |
|
|
|
No se han publicado |
|
|
|
No se han publicado |
|
|
|
No se han publicado |
|
|
|
|
|
|
|
No se han publicado |
|
|
|
No se han publicado |
|
|
|
|
|
|
|
No se han publicado |
Link
List
|
|
ABSORBS TO: |
2 Entities |
|
HAS IN ITS ADMINISTRATION BOARD TO: |
1 Entities |
|
IS RELATED WITH: |
9 Entities |
|
PARTICIPATES IN: |
1 Entities |
|
SE ESCINDE PARCIALMENTE EN: |
1 Entities |
|
SHAREHOLDERS: |
10 Entities |
> Shareholders
|
Relationship |
Entity |
Province |
Shareholding
stake |
|
SHAREHOLDERS |
CARLOS ORTEGA CEDRON Y ALMUDENA OLAZABAL ARACO |
|
22.18 |
|
|
DEYA CAPITAL II SCR DE REGIMEN COMUN SA |
MADRID |
1.86 |
|
|
DEYA CAPITAL III FCR DE REGIMEN COMUN |
|
2.18 |
|
|
PEPE JEANS EQUIPO GESTOR GRUPO |
|
5.92 |
|
|
EQUIPO GESTOR TORREAL SCR, S.A. |
|
0.61 |
|
|
DEYA CAPITAL S.C.R. DE REGIMEN SIMPLIFICADO SA |
MADRID |
12.13 |
|
|
GRUPO TORREAL |
|
29.97 |
|
|
JAVIER RAVENTOS |
|
3.13 |
|
|
PEPE EUROPEAN HOLDINGS BV |
|
10.69 |
|
|
SLPP, S.A. |
|
11.33 |
|
PARTICIPATES IN |
HILFIGER STORES SPAIN SL |
BARCELONA |
100 |
> Other relationships
|
Relationship |
Entity |
Province |
Shareholding
stake |
|
IS RELATED WITH |
| | |
|
|
|
|
COACH SPAIN SL |
MADRID |
|
|
|
COACH STORES FRANCE SAS |
|
|
|
|
COACH STORES GERMANY, S.A. |
|
|
|
|
COACH STORES IRELAND, S.A. |
|
|
|
|
COACH STORES, S.A. |
|
|
|
|
COACH STORES UNIPESSOAL, S.A. |
|
|
|
|
PEP JEANS FRANCE SARL |
|
|
|
|
PEPE JEANS INTERNATIONAL BV |
|
|
|
|
TORREAL SOCIEDAD DE CAPITAL RIESGO DE REGIMEN SIMPLIFICADO S.A. |
MADRID |
|
|
ABSORBS TO |
PEPE JEANS RETAIL SA |
BARCELONA |
|
|
|
PEPE JEANS SA |
BARCELONA |
|
|
SE ESCINDE PARCIALMENTE EN |
HILFIGER STORES SPAIN SL |
BARCELONA |
|
|
HAS IN ITS ADMINISTRATION BOARD TO |
ARTA CAPITAL S.A. |
MADRID |
|
Turnover
|
|
|
Total Sales |
176.787.204 |
Estimated
Balance
|
|
CIFRAS ESTIMADAS AÑO 2.014 -NOT CURRENT
ASSESTS.....................................................156.000.000
Euro/s -CURRENT
ASSESTS.............................................................86.000.000
Euro/s -NET EQUITY...............................................................42.000.000
Euro/s -NOT CURRENT
LIABILITIES.....................................................120.000.000
Euro/s -CURRENT
LIABILITIES.............................................................80.000.000
Euro/s -TOTAL .................................................242.000.000
Euro/s -SALES
(2.014).................................................................155.000.000
Euro/s |
Financial
Accounts and Balance Sheets
|
Financial Years
Presented
|
Ejercicio |
Tipo de Cuentas Anuales |
Fecha Presentacion |
|
2014 |
Consolidadas |
January 2015 |
|
2014 |
Normales |
January 2015 |
|
2013 |
Consolidadas |
February 2014 |
|
2013 |
Normales |
February 2014 |
|
2012 |
Consolidadas |
January 2013 |
|
2012 |
Normales |
January 2013 |
|
2011 |
Consolidadas |
June 2012 |
|
2011 |
Normales |
March 2012 |
|
2010 |
Consolidadas |
December 2010 |
|
2010 |
Normales |
December 2010 |
|
2009 |
Consolidadas |
December 2009 |
|
2009 |
Normales |
December 2009 |
|
2008 |
Consolidadas |
November 2008 |
|
2008 |
Normales |
November 2008 |
|
2007 |
Consolidadas |
November 2007 |
|
2007 |
Normales |
November 2007 |
|
2006 |
Consolidadas |
November 2006 |
|
2006 |
Normales |
November 2006 |
|
2005 |
Consolidadas |
October 2005 |
|
2005 |
Normales |
October 2005 |
|
2004 |
Consolidadas |
October 2004 |
|
2004 |
Normales |
October 2004 |
|
2003 |
Consolidadas |
May 2004 |
|
2003 |
Normales |
May 2004 |
|
2002 |
Consolidadas |
February 2003 |
|
2002 |
Normales |
November 2002 |
|
2001 |
Normales |
December 2001 |
|
2000 |
Normales |
December 2000 |
|
1999 |
Normales |
September 1999 |
|
1998 |
Normales |
No publicado en BORME |
The data in the report
regarding the last Company Accounts submitted by the company is taken from the
TRADE REGISTER serving the region in which the company's address is located
31/03/2013
> Balance en formato Normal de acuerdo al Nuevo Plan General
Contable 2007
Information
corresponding to the fiscal year
2013 2012 2011 2010 2009 is taken from information
submitted to the TRADE REGISTER. Data corresponding to fiscal years before
2013 2012 2011 2010 2009 has been compiled based on
the equivalence criteria stipulated in Act JUS/206/2009. Where the provisions
of the Act did not establish relevant equivalence criteria, created such
criteria using its own methodology. To view details on the methodology.
|
|
ORIGINAL |
ORIGINAL |
ORIGINAL |
ORIGINAL |
ORIGINAL |
|
|
Assets |
2013 |
2012 |
2011 |
2010 |
2009 |
|
|
A) NON-CURRENT ASSETS: 11000 |
178.118.939,00 |
159.034.780,00 |
140.435.816,00 |
144.433.861,00 |
132.802.941,00 |
|
|
I. Intangible fixed assets : 11100 |
1.643.905,00 |
1.682.106,00 |
1.827.077,00 |
743.835,00 |
867.317,00 |
|
|
1. Development: 11110 |
0,00 |
0,00 |
0,00 |
0,00 |
0,00 |
|
|
2. Concessions: 11120 |
0,00 |
0,00 |
0,00 |
0,00 |
0,00 |
|
|
3. Patents, licencing, trade
marks and similar: 11130 |
618.269,00 |
618.269,00 |
618.269,00 |
633.231,00 |
633.231,00 |
|
|
4. Goodwill: 11140 |
0,00 |
0,00 |
0,00 |
0,00 |
0,00 |
|
|
5. IT applications:
11150 |
0,00 |
0,00 |
0,00 |
0,00 |
0,00 |
|
|
6. Investigation:
11160 |
0,00 |
0,00 |
0,00 |
110.604,00 |
0,00 |
|
|
7. Intellectual property:
11180 |
0,00 |
0,00 |
0,00 |
0,00 |
0,00 |
|
|
8. Greenhouse gas emission
allowance: 11190 |
0,00 |
0,00 |
0,00 |
0,00 |
0,00 |
|
|
9. Other intangible fixed
assets. : 11170 |
1.025.636,00 |
1.063.837,00 |
1.208.808,00 |
0,00 |
234.086,00 |
|
|
II. Tangible fixed assets : 11200 |
9.788.107,00 |
9.364.183,00 |
9.594.233,00 |
11.275.462,00 |
12.645.593,00 |
|
|
1. Land and buildings:
11210 |
0,00 |
0,00 |
0,00 |
0,00 |
0,00 |
|
|
2. Technical installations and
other tangible fixed assets: 11220 |
9.656.440,00 |
9.243.467,00 |
9.367.555,00 |
10.058.910,00 |
12.645.593,00 |
|
|
3. Tangible asset in
progress and advances: 11230 |
131.667,00 |
120.716,00 |
226.678,00 |
1.216.552,00 |
0,00 |
|
|
III. Real estate investment: 11300 |
0,00 |
0,00 |
0,00 |
0,00 |
0,00 |
|
|
1. Land: 11310 |
0,00 |
0,00 |
0,00 |
0,00 |
0,00 |
|
|
2. Buildings: 11320 |
0,00 |
0,00 |
0,00 |
0,00 |
0,00 |
|
|
IV. Long-term investments in Group companies and
associates : 11400 |
161.827.896,00 |
143.142.507,00 |
124.384.240,00 |
127.588.170,00 |
114.874.402,00 |
|
|
1. Equity instruments:
11410 |
119.609.686,00 |
115.745.308,00 |
116.771.610,00 |
117.695.645,00 |
110.342.622,00 |
|
|
2. Credits to businesses:
11420 |
42.218.210,00 |
27.397.199,00 |
7.612.630,00 |
9.892.525,00 |
4.531.780,00 |
|
|
3. Debt securities:
11430 |
0,00 |
0,00 |
0,00 |
0,00 |
0,00 |
|
|
4. Derivatives : 11440 |
0,00 |
0,00 |
0,00 |
0,00 |
0,00 |
|
|
5. Other financial assets :
11450 |
0,00 |
0,00 |
0,00 |
0,00 |
0,00 |
|
|
6. Other investments:
11460 |
0,00 |
0,00 |
0,00 |
0,00 |
0,00 |
|
|
V. Long-term financial investments: 11500 |
1.348.947,00 |
1.334.853,00 |
1.376.312,00 |
1.235.173,00 |
1.406.677,00 |
|
|
1. Equity instruments:
11510 |
0,00 |
0,00 |
0,00 |
0,00 |
0,00 |
|
|
2. Credits to third parties
: 11520 |
0,00 |
0,00 |
0,00 |
0,00 |
0,00 |
|
|
3. Debt securities:
11530 |
0,00 |
0,00 |
0,00 |
0,00 |
0,00 |
|
|
4. Derivatives : 11540 |
0,00 |
0,00 |
0,00 |
0,00 |
0,00 |
|
|
5. Other financial assets :
11550 |
1.348.947,00 |
1.334.853,00 |
1.376.312,00 |
1.235.173,00 |
1.406.677,00 |
|
|
6. Other investments:
11560 |
0,00 |
0,00 |
0,00 |
0,00 |
0,00 |
|
|
VI. Assets for deferred tax : 11600 |
3.510.084,00 |
3.511.131,00 |
3.253.954,00 |
3.591.221,00 |
3.008.952,00 |
|
|
VII. Non-current trade debts : 11700 |
0,00 |
0,00 |
0,00 |
0,00 |
0,00 |
|
|
B) CURRENT ASSETS: 12000 |
98.533.183,00 |
120.213.217,00 |
120.547.509,00 |
89.275.137,00 |
92.119.115,00 |
|
|
I. Non-current assets held for sale : 12100 |
0,00 |
0,00 |
0,00 |
0,00 |
0,00 |
|
|
II. Stocks: 12200 |
26.508.348,00 |
29.771.472,00 |
26.805.710,00 |
20.186.227,00 |
29.004.120,00 |
|
|
1. Commercial: 12210 |
26.508.348,00 |
29.771.472,00 |
26.805.710,00 |
20.186.227,00 |
29.004.120,00 |
|
|
2. Primary material and
other supplies: 12220 |
0,00 |
0,00 |
0,00 |
0,00 |
0,00 |
|
|
3. Work in progress:
12230 |
0,00 |
0,00 |
0,00 |
0,00 |
0,00 |
|
|
a) Of
long-term production cycle : 12231 |
0,00 |
0,00 |
0,00 |
0,00 |
0,00 |
|
|
b) Of short-term
production cycle : 12232 |
0,00 |
0,00 |
0,00 |
0,00 |
0,00 |
|
|
4. Finished goods:
12240 |
0,00 |
0,00 |
0,00 |
0,00 |
0,00 |
|
|
a) Of
long-term production cycle : 12241 |
0,00 |
0,00 |
0,00 |
0,00 |
0,00 |
|
|
b) Of
short-term production cycle : 12242 |
0,00 |
0,00 |
0,00 |
0,00 |
0,00 |
|
|
5. By-products, residues and
recycled materials: 12250 |
0,00 |
0,00 |
0,00 |
0,00 |
0,00 |
|
|
6. Advances to suppliers:
12260 |
0,00 |
0,00 |
0,00 |
0,00 |
0,00 |
|
|
III. Trade debtors and others receivable
accounts: 12300 |
70.341.448,00 |
87.738.109,00 |
80.396.492,00 |
58.180.212,00 |
53.017.688,00 |
|
|
1. Trade debtors / accounts
receivable: 12310 |
31.270.678,00 |
37.618.603,00 |
44.228.893,00 |
38.909.667,00 |
38.077.527,00 |
|
|
a)
Long-term receivables from sales and services supplied : 12311 |
0,00 |
0,00 |
0,00 |
0,00 |
0,00 |
|
|
b)
Customers for sales and provisions of services : 12312 |
31.270.678,00 |
37.618.603,00 |
44.228.893,00 |
38.909.667,00 |
0,00 |
|
|
2. Customers, Group
companies and associates : 12320 |
29.547.307,00 |
28.331.784,00 |
19.568.725,00 |
13.648.254,00 |
7.446.982,00 |
|
|
3. Other accounts
receivable: 12330 |
3.605.177,00 |
6.887.411,00 |
5.962.063,00 |
4.002.211,00 |
6.000.319,00 |
|
|
4. Personnel: 12340 |
41.692,00 |
58.510,00 |
46.930,00 |
44.210,00 |
34.530,00 |
|
|
5. Assets for deferred tax:
12350 |
284.554,00 |
563.033,00 |
0,00 |
1.575.870,00 |
856.058,00 |
|
|
6. Other debtors, including tax
and social security: 12360 |
5.592.040,00 |
14.278.768,00 |
10.589.881,00 |
0,00 |
602.272,00 |
|
|
7. Called up share capital:
12370 |
0,00 |
0,00 |
0,00 |
0,00 |
0,00 |
|
|
IV. Short-term investments in Group companies and
associates: 12400 |
0,00 |
0,00 |
10.994.224,00 |
8.455.638,00 |
8.735.387,00 |
|
|
1. Equity instruments:
12410 |
0,00 |
0,00 |
0,00 |
0,00 |
0,00 |
|
|
2. Credits to businesses:
12420 |
0,00 |
0,00 |
10.994.224,00 |
8.455.638,00 |
8.735.387,00 |
|
|
3. Debt securities:
12430 |
0,00 |
0,00 |
0,00 |
0,00 |
0,00 |
|
|
4. Derivatives : 12440 |
0,00 |
0,00 |
0,00 |
0,00 |
0,00 |
|
|
5. Other financial assets :
12450 |
0,00 |
0,00 |
0,00 |
0,00 |
0,00 |
|
|
6. Other investments:
12460 |
0,00 |
0,00 |
0,00 |
0,00 |
0,00 |
|
|
V. Short-term financial investments : 12500 |
556.189,00 |
0,00 |
215.840,00 |
1.065.835,00 |
614.774,00 |
|
|
1. Equity instruments:
12510 |
0,00 |
0,00 |
0,00 |
0,00 |
0,00 |
|
|
2. Credits to businesses:
12520 |
0,00 |
0,00 |
0,00 |
0,00 |
0,00 |
|
|
3. Debt securities:
12530 |
0,00 |
0,00 |
0,00 |
0,00 |
0,00 |
|
|
4. Derivatives : 12540 |
556.189,00 |
0,00 |
215.840,00 |
1.065.835,00 |
614.774,00 |
|
|
5. Other financial assets :
12550 |
0,00 |
0,00 |
0,00 |
0,00 |
0,00 |
|
|
6. Other investments:
12560 |
0,00 |
0,00 |
0,00 |
0,00 |
0,00 |
|
|
VI. Short-term accruals: 12600 |
0,00 |
0,00 |
0,00 |
0,00 |
0,00 |
|
|
VII. Cash and other equivalent liquid assets :
12700 |
1.127.198,00 |
2.703.636,00 |
2.135.243,00 |
1.387.225,00 |
747.146,00 |
|
|
1. Treasury: 12710 |
1.127.198,00 |
2.703.636,00 |
2.135.243,00 |
1.387.225,00 |
747.146,00 |
|
|
2. Other equivalent liquid assets:
12720 |
0,00 |
0,00 |
0,00 |
0,00 |
0,00 |
|
|
TOTAL ASSETS (A + B) : 10000 |
276.652.122,00 |
279.247.997,00 |
260.983.325,00 |
233.708.998,00 |
224.922.056,00 |
|
|
|
ORIGINAL |
ORIGINAL |
ORIGINAL |
ORIGINAL |
ORIGINAL |
|
|
Liabilities and
Net Worth |
2013 |
2012 |
2011 |
2010 |
2009 |
|
|
A) NET WORTH: 20000 |
46.011.711,00 |
34.821.961,00 |
23.237.026,00 |
5.477.902,00 |
4.081.923,00 |
|
|
A-1) Shareholders' equity: 21000 |
46.131.367,00 |
35.703.523,00 |
23.278.098,00 |
5.048.582,00 |
3.309.958,00 |
|
|
I. Capital: 21100 |
511.726,00 |
505.536,00 |
505.536,00 |
506.551,00 |
506.551,00 |
|
|
1. Registered capital :
21110 |
511.726,00 |
505.536,00 |
505.536,00 |
506.551,00 |
0,00 |
|
|
2. (Uncalled capital):
21120 |
0,00 |
0,00 |
0,00 |
0,00 |
0,00 |
|
|
II. Share premium: 21200 |
3.731.682,00 |
0,00 |
0,00 |
0,00 |
0,00 |
|
|
III. Reserves: 21300 |
33.644.006,00 |
24.432.903,00 |
4.489.349,00 |
2.803.407,00 |
1.432.668,00 |
|
|
1. Legal y estatutarias:
21310 |
152.500,00 |
152.500,00 |
152.500,00 |
152.500,00 |
152.500,00 |
|
|
2. Other reserves:
21320 |
33.491.506,00 |
24.280.403,00 |
4.336.849,00 |
2.650.907,00 |
1.280.168,00 |
|
|
3. Revaluation reserves:
21330 |
0,00 |
0,00 |
0,00 |
0,00 |
0,00 |
|
|
IV. (Common stock equity): 21400 |
0,00 |
0,00 |
0,00 |
0,00 |
0,00 |
|
|
V. Results from previous periods: 21500 |
0,00 |
0,00 |
0,00 |
0,00 |
0,00 |
|
|
1. Brought forward:
21510 |
0,00 |
0,00 |
0,00 |
0,00 |
0,00 |
|
|
2. (Negative results from
previous periods): 21520 |
0,00 |
0,00 |
0,00 |
0,00 |
0,00 |
|
|
VI. Other shareholders' contributions:
21600 |
0,00 |
0,00 |
0,00 |
0,00 |
0,00 |
|
|
VII. Result of the period: 21700 |
8.243.953,00 |
10.765.084,00 |
18.283.213,00 |
1.738.624,00 |
1.370.739,00 |
|
|
VIII. (Interim dividend): 21800 |
0,00 |
0,00 |
0,00 |
0,00 |
0,00 |
|
|
IX. Other net worth instruments: 21900 |
0,00 |
0,00 |
0,00 |
0,00 |
0,00 |
|
|
A-2) Adjustments due to changes in value:
22000 |
-364.957,00 |
-1.187.908,00 |
-334.590,00 |
83.929,00 |
430.342,00 |
|
|
I. Financial assets held for sale: 22100 |
0,00 |
0,00 |
0,00 |
0,00 |
0,00 |
|
|
II. Hedge operations: 22200 |
-364.957,00 |
-1.187.908,00 |
-334.590,00 |
83.929,00 |
430.342,00 |
|
|
III. Linked non-current assets and liabilities
held for sale : 22300 |
0,00 |
0,00 |
0,00 |
0,00 |
0,00 |
|
|
IV. Exchange rate difference: 22400 |
0,00 |
0,00 |
0,00 |
0,00 |
0,00 |
|
|
V. Other: 22500 |
0,00 |
0,00 |
0,00 |
0,00 |
0,00 |
|
|
A-3) Received subsidies, donations and legacies:
23000 |
245.301,00 |
306.346,00 |
293.518,00 |
345.391,00 |
341.623,00 |
|
|
B) NON-CURRENT LIABILITIES: 31000 |
138.477.517,00 |
126.193.212,00 |
139.566.862,00 |
154.274.925,00 |
129.193.681,00 |
|
|
I. Long-term provisions: 31100 |
0,00 |
0,00 |
0,00 |
0,00 |
0,00 |
|
|
1. Long-term employee
benefits liability: 31110 |
0,00 |
0,00 |
0,00 |
0,00 |
0,00 |
|
|
2. Environmental actions:
31120 |
0,00 |
0,00 |
0,00 |
0,00 |
0,00 |
|
|
3. Restructuring provisions:
31130 |
0,00 |
0,00 |
0,00 |
0,00 |
0,00 |
|
|
4. Other provisions:
31140 |
0,00 |
0,00 |
0,00 |
0,00 |
0,00 |
|
|
II Long-term creditors: 31200 |
27.608.342,00 |
41.255.190,00 |
51.415.411,00 |
71.995.838,00 |
86.221.260,00 |
|
|
1. Liabilities and other
securities: 31210 |
0,00 |
0,00 |
0,00 |
0,00 |
0,00 |
|
|
2. Amounts owed to credit
institutions: 31220 |
26.645.886,00 |
40.664.429,00 |
51.415.411,00 |
17.500.000,00 |
36.000.000,00 |
|
|
3. Creditors from financial
leasing: 31230 |
0,00 |
0,00 |
0,00 |
0,00 |
0,00 |
|
|
4. Derivatives : 31240 |
962.456,00 |
590.761,00 |
0,00 |
433.516,00 |
0,00 |
|
|
5. Other financial
liabilities : 31250 |
0,00 |
0,00 |
0,00 |
54.062.322,00 |
50.221.260,00 |
|
|
III. Long-term debts with Group companies and
associates: 31300 |
110.579.715,00 |
84.613.863,00 |
87.779.436,00 |
81.637.206,00 |
42.557.175,00 |
|
|
IV. Liabilities for deferred tax: 31400 |
289.460,00 |
324.159,00 |
372.015,00 |
641.881,00 |
415.246,00 |
|
|
V. Long-term accruals: 31500 |
0,00 |
0,00 |
0,00 |
0,00 |
0,00 |
|
|
VI. Non-current trade creditors : 31600 |
0,00 |
0,00 |
0,00 |
0,00 |
0,00 |
|
|
VII. Special long-term debts : 31700 |
0,00 |
0,00 |
0,00 |
0,00 |
0,00 |
|
|
C) CURRENT LIABILITIES : 32000 |
92.162.894,00 |
118.232.824,00 |
98.179.437,00 |
73.956.171,00 |
91.646.452,00 |
|
|
I. Liabilities linked to non-current assets held
for sale: 32100 |
0,00 |
0,00 |
0,00 |
0,00 |
0,00 |
|
|
II. Short-term provisions: 32200 |
3.356.814,00 |
3.788.430,00 |
2.825.266,00 |
3.360.400,00 |
4.103.900,00 |
|
|
1. Provisions from
greenhouse gas emission allowance: 32210 |
0,00 |
0,00 |
0,00 |
0,00 |
0,00 |
|
|
2. Other provisions:
32220 |
0,00 |
0,00 |
0,00 |
0,00 |
0,00 |
|
|
III. Short-term creditors : 32300 |
43.540.515,00 |
66.384.401,00 |
38.593.287,00 |
18.833.835,00 |
44.075.044,00 |
|
|
1. Liabilities and other
securities: 32310 |
0,00 |
0,00 |
0,00 |
0,00 |
0,00 |
|
|
2. Amounts owed to credit
institutions: 32320 |
43.540.515,00 |
65.278.151,00 |
37.899.462,00 |
18.321.414,00 |
44.075.044,00 |
|
|
3. Creditors from financial
leasing: 32330 |
0,00 |
0,00 |
0,00 |
0,00 |
0,00 |
|
|
4. Derivatives : 32340 |
0,00 |
1.106.250,00 |
693.825,00 |
512.421,00 |
0,00 |
|
|
5. Other financial
liabilities : 32350 |
0,00 |
0,00 |
0,00 |
0,00 |
0,00 |
|
|
IV. Short-term debts with Group companies and
associates: 32400 |
0,00 |
0,00 |
0,00 |
14.617.700,00 |
5.765.309,00 |
|
|
V. Trade creditors and other accounts payable:
32500 |
45.265.565,00 |
48.059.993,00 |
56.760.884,00 |
37.144.236,00 |
37.702.199,00 |
|
|
1. Suppliers: 32510 |
19.859.990,00 |
17.561.974,00 |
22.831.207,00 |
10.486.612,00 |
8.721.732,00 |
|
|
a)
Long-term debts : 32511 |
0,00 |
0,00 |
0,00 |
0,00 |
0,00 |
|
|
b)
Short-term debts : 32512 |
19.859.990,00 |
17.561.974,00 |
22.831.207,00 |
10.486.612,00 |
0,00 |
|
|
2. Suppliers, Group
companies and associates: 32520 |
9.393.983,00 |
10.789.376,00 |
16.593.970,00 |
11.950.611,00 |
16.900.877,00 |
|
|
3. Other creditors:
32530 |
11.200.630,00 |
12.202.405,00 |
13.005.137,00 |
11.067.898,00 |
9.127.648,00 |
|
|
4. Personnel (remuneration
due): 32540 |
3.627.872,00 |
4.988.143,00 |
3.386.825,00 |
2.497.688,00 |
2.200.914,00 |
|
|
5. Liabilities for current
tax: 32550 |
0,00 |
0,00 |
541.711,00 |
400.877,00 |
0,00 |
|
|
6. Other accounts payable to
Public Administrations.: 32560 |
1.026.581,00 |
2.309.248,00 |
268.536,00 |
737.598,00 |
751.028,00 |
|
|
7. Advances from clients:
32570 |
156.509,00 |
208.847,00 |
133.498,00 |
2.952,00 |
0,00 |
|
|
VI. Short-term accruals: 32600 |
0,00 |
0,00 |
0,00 |
0,00 |
0,00 |
|
|
VII. Special short-term debts : 32700 |
0,00 |
0,00 |
0,00 |
0,00 |
0,00 |
|
|
TOTAL NET WORTH AND LIABILITIES (A + B + C) : 30000 |
276.652.122,00 |
279.247.997,00 |
260.983.325,00 |
233.708.998,00 |
224.922.056,00 |
|
|
|
ORIGINAL |
ORIGINAL |
ORIGINAL |
ORIGINAL |
ORIGINAL |
|
|
Profit and
Loss |
2013 |
2012 |
2011 |
2010 |
2009 |
|
|
1. Net turnover: 40100 |
176.787.204,00 |
190.603.862,00 |
181.958.943,00 |
164.057.641,00 |
171.288.136,00 |
|
|
a) Sales: 40110 |
171.377.843,00 |
186.144.683,00 |
178.464.421,00 |
160.613.347,00 |
167.357.952,00 |
|
|
b) Rendering of services: 40120 |
5.409.361,00 |
4.459.179,00 |
3.494.522,00 |
3.444.294,00 |
3.930.184,00 |
|
|
c) Income of financial nature of holding
companies: 40130 |
0,00 |
0,00 |
0,00 |
0,00 |
0,00 |
|
|
2. Changes in stocks of finished goods and work in progress:
40200 |
0,00 |
0,00 |
0,00 |
0,00 |
0,00 |
|
|
3. Works carried out by the company for its assets: 40300 |
0,00 |
0,00 |
0,00 |
0,00 |
0,00 |
|
|
4. Supplies : 40400 |
-105.615.868,00 |
-111.680.754,00 |
-100.513.136,00 |
-84.219.780,00 |
-82.827.785,00 |
|
|
a) Stock consumption: 40410 |
-105.614.900,00 |
-112.341.345,00 |
-99.719.186,00 |
-84.211.042,00 |
-82.614.335,00 |
|
|
b) Consumption of raw materials and miscellaneous
consumable ones: 40420 |
0,00 |
0,00 |
0,00 |
0,00 |
0,00 |
|
|
c) Works carried out by other companies:
40430 |
0,00 |
0,00 |
0,00 |
0,00 |
0,00 |
|
|
d) Impairment of stock, primary material and
other supplies: 40440 |
-968,00 |
660.591,00 |
-793.950,00 |
-8.738,00 |
-213.450,00 |
|
|
5. Other operating income: 40500 |
23.590.670,00 |
23.290.616,00 |
21.455.873,00 |
16.670.432,00 |
20.195.365,00 |
|
|
a) Auxiliary income and other from current
management: 40510 |
23.590.670,00 |
23.290.616,00 |
21.455.873,00 |
16.670.432,00 |
20.195.365,00 |
|
|
b) Operation subsidies included in the
Period's result: 40520 |
0,00 |
0,00 |
0,00 |
0,00 |
0,00 |
|
|
6. Personnel costs: 40600 |
-28.052.162,00 |
-29.214.612,00 |
-27.889.445,00 |
-25.202.097,00 |
-25.778.839,00 |
|
|
a) Wages, salaries et al.: 40610 |
-21.965.696,00 |
-23.303.607,00 |
-22.477.720,00 |
-19.666.092,00 |
-19.864.167,00 |
|
|
b) Social security costs: 40620 |
-6.086.466,00 |
-5.911.005,00 |
-5.411.725,00 |
-5.536.005,00 |
-5.914.672,00 |
|
|
c) Provisions : 40630 |
0,00 |
0,00 |
0,00 |
0,00 |
0,00 |
|
|
7. Other operating costs: 40700 |
-56.608.519,00 |
-61.832.419,00 |
-57.288.203,00 |
-52.235.557,00 |
-61.044.679,00 |
|
|
a) External services: 40710 |
-56.124.871,00 |
-60.020.999,00 |
-57.020.235,00 |
-52.498.757,00 |
-59.611.888,00 |
|
|
b) Taxes: 40720 |
-354.647,00 |
-305.933,00 |
-218.164,00 |
-142.000,00 |
-174.297,00 |
|
|
c) Losses, impairments and variation in
provisions from trade operations : 40730 |
-129.001,00 |
-1.505.487,00 |
-49.804,00 |
405.200,00 |
-1.258.494,00 |
|
|
d) Other current management expenditure :
40740 |
0,00 |
0,00 |
0,00 |
0,00 |
0,00 |
|
|
e) Expenses due to greenhouse gas emissions:
40750 |
0,00 |
0,00 |
0,00 |
0,00 |
0,00 |
|
|
8. Amortisation of fixed assets: 40800 |
-3.713.484,00 |
-3.620.873,00 |
-3.625.706,00 |
-3.604.499,00 |
-3.817.336,00 |
|
|
9. Allocation of subsidies of non-financial fixed assets and other:
40900 |
111.858,00 |
131.676,00 |
78.141,00 |
96.414,00 |
69.754,00 |
|
|
10. Excess provisions : 41000 |
0,00 |
0,00 |
0,00 |
0,00 |
0,00 |
|
|
11. Impairment and result of transfers of fixed assets: 41100 |
-155.257,00 |
-229.960,00 |
-350.430,00 |
-88.946,00 |
33.803,00 |
|
|
a) Impairment and losses : 41110 |
-155.257,00 |
-229.960,00 |
-350.430,00 |
0,00 |
-41.259,00 |
|
|
b) Results for transfers and other : 41120 |
0,00 |
0,00 |
0,00 |
-88.946,00 |
75.062,00 |
|
|
c) Impairment and profit due to disposals of
assets of holding companies: 41130 |
0,00 |
0,00 |
0,00 |
0,00 |
0,00 |
|
|
12. Negative difference in combined businesses: 41200 |
0,00 |
0,00 |
0,00 |
0,00 |
0,00 |
|
|
13. Other results : 41300 |
0,00 |
0,00 |
0,00 |
0,00 |
0,00 |
|
|
A.1) OPERATING INCOME (1 + 2 + 3 + 4 + 5 + 6 + 7 + 8 + 9 + 10 + 11 + 12
+ 13) : 49100 |
6.344.442,00 |
7.447.536,00 |
13.826.037,00 |
15.473.608,00 |
18.118.419,00 |
|
|
14. Financial income : 41400 |
11.588.035,00 |
17.941.024,00 |
15.890.694,00 |
614.280,00 |
1.132.388,00 |
|
|
a) Of shares in equity instruments : 41410 |
10.000.000,00 |
16.200.000,00 |
15.251.000,00 |
0,00 |
1.132.388,00 |
|
|
a 1) In Group companies and
associates: 41411 |
10.000.000,00 |
16.200.000,00 |
15.251.000,00 |
0,00 |
756.029,00 |
|
|
a 2) In third parties:
41412 |
0,00 |
0,00 |
0,00 |
0,00 |
376.359,00 |
|
|
b) From negotiable securities and other financial
instruments : 41420 |
1.588.035,00 |
1.741.024,00 |
639.694,00 |
614.280,00 |
0,00 |
|
|
b 1) From Group companies
and associates : 41421 |
1.438.191,00 |
1.367.712,00 |
577.464,00 |
572.979,00 |
0,00 |
|
|
b 2) From third parties :
41422 |
149.844,00 |
373.312,00 |
62.230,00 |
41.301,00 |
0,00 |
|
|
c) Allocation of financial subsidies, donations
and legacies : 41430 |
0,00 |
0,00 |
0,00 |
0,00 |
0,00 |
|
|
15. Financial expenditure: 41500 |
-6.813.039,00 |
-8.769.904,00 |
-5.663.150,00 |
-4.319.357,00 |
-6.793.979,00 |
|
|
a) Amounts owed to Group companies and associates
: 41510 |
-3.206.402,00 |
-3.952.481,00 |
-2.936.887,00 |
-1.908.448,00 |
-3.000.348,00 |
|
|
b) For debts with third parties : 41520 |
-3.606.637,00 |
-4.817.423,00 |
-2.726.263,00 |
-2.410.909,00 |
-3.793.631,00 |
|
|
c) Stock renewal : 41530 |
0,00 |
0,00 |
0,00 |
0,00 |
0,00 |
|
|
16. Changes in fair value of financial instruments : 41600 |
0,00 |
0,00 |
-1.617.131,00 |
-4.468.925,00 |
-4.114.075,00 |
|
|
a) Trading book and other : 41610 |
0,00 |
0,00 |
-1.617.131,00 |
-4.468.925,00 |
-4.114.075,00 |
|
|
b) Allocation of financial assets held for sale
to the result for the period: 41620 |
0,00 |
0,00 |
0,00 |
0,00 |
0,00 |
|
|
17. Exchange rate differences : 41700 |
252.912,00 |
910.376,00 |
491.734,00 |
614.687,00 |
1.122.383,00 |
|
|
18. Impairment and result for transfers of financial instruments:
41800 |
-3.262.763,00 |
-5.493.289,00 |
-3.859.237,00 |
-6.157.771,00 |
-8.283.216,00 |
|
|
a) Impairment and losses : 41810 |
-3.262.763,00 |
-5.493.289,00 |
-3.859.237,00 |
-6.157.771,00 |
-8.283.216,00 |
|
|
b) Results for transfers and other : 41820 |
0,00 |
0,00 |
0,00 |
0,00 |
0,00 |
|
|
19. Other financial income and expenditure: 42100 |
0,00 |
0,00 |
0,00 |
0,00 |
0,00 |
|
|
a) Incorporation of financial expenditure to
assets: 42110 |
0,00 |
0,00 |
0,00 |
0,00 |
0,00 |
|
|
b) Financial income from arrangement with
creditors: 42120 |
0,00 |
0,00 |
0,00 |
0,00 |
0,00 |
|
|
c) Other income and expenditure: 42130 |
0,00 |
0,00 |
0,00 |
0,00 |
0,00 |
|
|
A.2) FINANCIAL REVENUE (14+15+16+17+18+19) : 49200 |
1.765.145,00 |
4.588.207,00 |
5.242.910,00 |
-13.717.086,00 |
-16.936.499,00 |
|
|
A.3) NET RESULT BEFORE TAXES (A.1+A.2) : 49300 |
8.109.587,00 |
12.035.743,00 |
19.068.947,00 |
1.956.522,00 |
1.181.920,00 |
|
|
20. Income taxes: 41900 |
134.366,00 |
-1.270.659,00 |
-785.734,00 |
-217.898,00 |
188.819,00 |
|
|
A.4) PROFIT AFTER TAXES (A.3+20) : 49400 |
8.243.953,00 |
10.765.084,00 |
18.283.213,00 |
1.738.624,00 |
1.370.739,00 |
|
|
21. Result of the year coming from interrupted operations :
42000 |
0,00 |
0,00 |
0,00 |
0,00 |
0,00 |
|
|
A.5) RESULT OF THE PERIOD (A.4+21) : 49500 |
8.243.953,00 |
10.765.084,00 |
18.283.213,00 |
1.738.624,00 |
1.370.739,00 |
|
> Normal Balance Sheet under the rules of the 1990 General Accounting
Plan (repealed since 1st January of 2008)
Information
corresponding to the fiscal year
2013 2012 2011 2010 2009 has been compiled based on
the equivalence criteria stipulated in Act JUS/206/2009. Where the provisions
of the Act did not establish relevant equivalence criteria, such criteria using
its own methodology. To view details on the methodology
2013 2012 2011 2010 2009 is taken from information
submitted to the TRADE REGISTER.
|
|
EQUIVALENCIA |
EQUIVALENCIA |
EQUIVALENCIA |
EQUIVALENCIA |
EQUIVALENCIA |
|
|
ASSETS |
2013 |
2012 |
2011 |
2010 |
2009 |
|
|
A) SHAREHOLDERS (PARTNERS) BY UNCALLED SUSCRIBED CAPITAL: |
0,00 |
0,00 |
0,00 |
0,00 |
0,00 |
|
|
B) FIXED ASSETS: |
174.608.855,00 |
155.523.649,00 |
137.181.862,00 |
140.842.640,00 |
129.793.989,00 |
|
|
I. Formation expenses: |
0,00 |
0,00 |
0,00 |
0,00 |
0,00 |
|
|
II. Intangible fixed assets: |
1.643.905,00 |
1.682.106,00 |
1.827.077,00 |
743.835,00 |
867.317,00 |
|
|
1. Research and development
costs: |
0,00 |
0,00 |
0,00 |
110.604,00 |
0,00 |
|
|
2. Concessions, patents,
licences, trademarks et al.: |
618.269,00 |
618.269,00 |
618.269,00 |
633.231,00 |
633.231,00 |
|
|
3. Goodwill: |
0,00 |
0,00 |
0,00 |
0,00 |
0,00 |
|
|
4. Key money paid for
premises: |
0,00 |
0,00 |
0,00 |
0,00 |
234.086,00 |
|
|
5. Software: |
0,00 |
0,00 |
0,00 |
0,00 |
0,00 |
|
|
6. Assets under capital
leases: |
0,00 |
0,00 |
0,00 |
0,00 |
0,00 |
|
|
7. Payments on account:
|
1.025.636,00 |
1.063.837,00 |
1.208.808,00 |
0,00 |
0,00 |
|
|
8. Provisions: |
0,00 |
0,00 |
0,00 |
0,00 |
0,00 |
|
|
9. Accumulated depreciation:
|
0,00 |
0,00 |
0,00 |
0,00 |
0,00 |
|
|
III. Tangible fixed assets: |
9.788.107,00 |
9.364.183,00 |
9.594.233,00 |
11.275.462,00 |
12.645.593,00 |
|
|
1. Land and construction:
|
0,00 |
0,00 |
0,00 |
0,00 |
0,00 |
|
|
2. Technical installations
and machinery: |
207.880,00 |
198.990,00 |
201.661,00 |
216.544,00 |
272.229,00 |
|
|
3. Other installations,
tools and furniture: |
8.719.234,00 |
8.346.342,00 |
8.458.387,00 |
9.082.643,00 |
11.418.275,00 |
|
|
4. Payments on account and
tangible fixed assets under construction: |
131.667,00 |
120.716,00 |
226.678,00 |
1.216.552,00 |
0,00 |
|
|
5. Other tangible assets:
|
729.326,00 |
698.135,00 |
707.507,00 |
759.723,00 |
955.089,00 |
|
|
6. Provisions: |
0,00 |
0,00 |
0,00 |
0,00 |
0,00 |
|
|
7. Accumulated depreciation:
|
0,00 |
0,00 |
0,00 |
0,00 |
0,00 |
|
|
IV. Financial investments: |
163.176.843,00 |
144.477.360,00 |
125.760.552,00 |
128.823.343,00 |
116.281.079,00 |
|
|
1. Equity investments in group
companies: |
119.593.041,00 |
115.729.201,00 |
116.755.360,00 |
117.679.267,00 |
110.327.267,00 |
|
|
2. Receivables from group
companies: |
42.218.210,00 |
27.397.199,00 |
7.612.630,00 |
9.892.525,00 |
4.531.780,00 |
|
|
3. Equity investment in
associated companies: |
16.645,00 |
16.107,00 |
16.250,00 |
16.378,00 |
15.355,00 |
|
|
4. Credits to associated
companies: |
0,00 |
0,00 |
0,00 |
0,00 |
0,00 |
|
|
5. Long-term securities
portfolio: |
0,00 |
0,00 |
0,00 |
0,00 |
0,00 |
|
|
6. Other receivables: |
0,00 |
0,00 |
0,00 |
0,00 |
0,00 |
|
|
7. Long term guarantees and
deposits: |
1.348.947,00 |
1.334.853,00 |
1.376.312,00 |
1.235.173,00 |
1.406.677,00 |
|
|
8. Provisions: |
0,00 |
0,00 |
0,00 |
0,00 |
0,00 |
|
|
9. Long-term receivables
from public bodies: |
0,00 |
0,00 |
0,00 |
0,00 |
0,00 |
|
|
V. Own shares: |
0,00 |
0,00 |
0,00 |
0,00 |
0,00 |
|
|
VI. Long-term trade receivables: |
0,00 |
0,00 |
0,00 |
0,00 |
0,00 |
|
|
C) Deferred expenses: |
0,00 |
0,00 |
0,00 |
0,00 |
0,00 |
|
|
D) CURRENT ASSETS: |
101.487.078,00 |
123.724.348,00 |
123.585.623,00 |
91.800.523,00 |
94.513.293,00 |
|
|
I. Called-up share capital (not paid): |
0,00 |
0,00 |
0,00 |
0,00 |
0,00 |
|
|
II. Stocks: |
26.508.348,00 |
29.771.472,00 |
26.805.710,00 |
20.186.227,00 |
29.004.120,00 |
|
|
1. Goods for resale: |
26.508.348,00 |
29.771.472,00 |
26.805.710,00 |
20.186.227,00 |
29.004.120,00 |
|
|
2. Raw materials and other
consumables: |
0,00 |
0,00 |
0,00 |
0,00 |
0,00 |
|
|
3. Goods in process and
semifinished ones: |
0,00 |
0,00 |
0,00 |
0,00 |
0,00 |
|
|
4. Finished products: |
0,00 |
0,00 |
0,00 |
0,00 |
0,00 |
|
|
5. Byproducts, scrap and recovered
materials: |
0,00 |
0,00 |
0,00 |
0,00 |
0,00 |
|
|
6. Payments on account:
|
0,00 |
0,00 |
0,00 |
0,00 |
0,00 |
|
|
7. Provisions: |
0,00 |
0,00 |
0,00 |
0,00 |
0,00 |
|
|
III. Debtors: |
73.851.532,00 |
91.249.240,00 |
83.650.446,00 |
61.771.433,00 |
56.026.640,00 |
|
|
1. Trade debtors / accounts
receivable: |
31.270.678,00 |
37.618.603,00 |
44.228.893,00 |
38.909.667,00 |
38.077.527,00 |
|
|
2. Accounts receivable,
Group companies: |
29.547.307,00 |
28.331.784,00 |
19.568.725,00 |
13.648.254,00 |
7.446.982,00 |
|
|
3. Accounts receivable,
associated companies: |
0,00 |
0,00 |
0,00 |
0,00 |
0,00 |
|
|
4. Other debtors: |
3.605.177,00 |
6.887.411,00 |
5.962.063,00 |
4.002.211,00 |
6.000.319,00 |
|
|
5. Staff: |
41.692,00 |
58.510,00 |
46.930,00 |
44.210,00 |
34.530,00 |
|
|
6. Public bodies: |
9.386.678,00 |
18.352.932,00 |
13.843.835,00 |
5.167.091,00 |
4.467.282,00 |
|
|
7. Provisions: |
0,00 |
0,00 |
0,00 |
0,00 |
0,00 |
|
|
IV. Short-term investments: |
0,00 |
0,00 |
10.994.224,00 |
8.455.638,00 |
8.735.387,00 |
|
|
1. Equity investments in
group companies: |
0,00 |
0,00 |
0,00 |
0,00 |
0,00 |
|
|
2. Receivables from group
companies: |
0,00 |
0,00 |
10.994.224,00 |
8.455.638,00 |
8.735.387,00 |
|
|
3. Equity investment in
associated companies: |
0,00 |
0,00 |
0,00 |
0,00 |
0,00 |
|
|
4. Credits to associated
companies: |
0,00 |
0,00 |
0,00 |
0,00 |
0,00 |
|
|
5. Short term securities
portfolio: |
0,00 |
0,00 |
0,00 |
0,00 |
0,00 |
|
|
6. Other receivables: |
0,00 |
0,00 |
0,00 |
0,00 |
0,00 |
|
|
7. Shor term guarantees and
deposits: |
0,00 |
0,00 |
0,00 |
0,00 |
0,00 |
|
|
8. Provisions: |
0,00 |
0,00 |
0,00 |
0,00 |
0,00 |
|
|
V. Short-term treasury shares: |
0,00 |
0,00 |
0,00 |
0,00 |
0,00 |
|
|
VI. Cash at bank and in hand: |
1.127.198,00 |
2.703.636,00 |
2.135.243,00 |
1.387.225,00 |
747.146,00 |
|
|
VII. Prepayments and accrued income: |
0,00 |
0,00 |
0,00 |
0,00 |
0,00 |
|
|
GENERAL TOTAL (A + B + C + D): |
276.095.933,00 |
279.247.997,00 |
260.767.485,00 |
232.643.163,00 |
224.307.282,00 |
|
MERCANTILE
REGISTRY.
|
|
EQUIVALENCIA |
EQUIVALENCIA |
EQUIVALENCIA |
EQUIVALENCIA |
EQUIVALENCIA |
|
|
LIABILITIES |
2013 |
2012 |
2011 |
2010 |
2009 |
|
|
A) EQUITY: |
46.246.267,00 |
36.304.530,00 |
23.509.548,00 |
5.116.230,00 |
2.721.462,00 |
|
|
I. Subscribed capital: |
511.726,00 |
505.536,00 |
505.536,00 |
506.551,00 |
0,00 |
|
|
II. Share premium: |
3.731.682,00 |
0,00 |
0,00 |
0,00 |
0,00 |
|
|
III. Revaluation reserves: |
0,00 |
0,00 |
0,00 |
0,00 |
0,00 |
|
|
IV. Reserves: |
33.758.906,00 |
25.033.910,00 |
4.720.799,00 |
2.871.055,00 |
1.350.723,00 |
|
|
1. Legal reserve: |
152.500,00 |
152.500,00 |
152.500,00 |
152.500,00 |
152.500,00 |
|
|
2. Reserves for own shares:
|
0,00 |
0,00 |
0,00 |
0,00 |
0,00 |
|
|
3. Reserves for shares of
the controlling company: |
0,00 |
0,00 |
0,00 |
0,00 |
0,00 |
|
|
4. Statutory reserves:
|
0,00 |
0,00 |
0,00 |
0,00 |
0,00 |
|
|
5. Miscellaneous reserves:
|
33.606.402,00 |
24.881.407,00 |
4.568.299,00 |
2.718.555,00 |
1.198.223,00 |
|
|
Differences due to capital
adjustement to euros: |
4,00 |
3,00 |
1,00 |
0,00 |
0,00 |
|
|
V. Profit or loss brought forward: |
0,00 |
0,00 |
0,00 |
0,00 |
0,00 |
|
|
1. Retained earnings: |
0,00 |
0,00 |
0,00 |
0,00 |
0,00 |
|
|
2. Prior year losses: |
0,00 |
0,00 |
0,00 |
0,00 |
0,00 |
|
|
3. Partners'
contributions so as to compensate losses: |
0,00 |
0,00 |
0,00 |
0,00 |
0,00 |
|
|
VI. Profit or loss for the financial year: |
8.243.953,00 |
10.765.084,00 |
18.283.213,00 |
1.738.624,00 |
1.370.739,00 |
|
|
VII. Interim dividend paid: |
0,00 |
0,00 |
0,00 |
0,00 |
0,00 |
|
|
VIII. Own shares for capital reduction: |
0,00 |
0,00 |
0,00 |
0,00 |
0,00 |
|
|
B) Deferred income: |
171.711,00 |
214.442,00 |
205.463,00 |
241.774,00 |
239.136,00 |
|
|
1. Capital grants: |
171.711,00 |
214.442,00 |
205.463,00 |
241.774,00 |
239.136,00 |
|
|
2. Unrealised exchange
gains: |
0,00 |
0,00 |
0,00 |
0,00 |
0,00 |
|
|
3. Other deferred income:
|
0,00 |
0,00 |
0,00 |
0,00 |
0,00 |
|
|
4. Public revenues to
distribute in several financial years: |
0,00 |
0,00 |
0,00 |
0,00 |
0,00 |
|
|
C) PROVISIONS FOR LIABILITIES AND CHARGES: |
0,00 |
0,00 |
0,00 |
0,00 |
0,00 |
|
|
1. Provisions for pension
fund and other similar obligations: |
0,00 |
0,00 |
0,00 |
0,00 |
0,00 |
|
|
2. Provisions for taxes:
|
0,00 |
0,00 |
0,00 |
0,00 |
0,00 |
|
|
3. Other provisions: |
0,00 |
0,00 |
0,00 |
0,00 |
0,00 |
|
|
4. Reversion fund: |
0,00 |
0,00 |
0,00 |
0,00 |
0,00 |
|
|
D) LONG TERM LIABILITIES: |
137.515.061,00 |
125.602.451,00 |
139.566.862,00 |
153.841.409,00 |
129.193.681,00 |
|
|
I. Issued debentures and other marketable
securities: |
0,00 |
0,00 |
0,00 |
0,00 |
0,00 |
|
|
1. Non-convertible
debentures: |
0,00 |
0,00 |
0,00 |
0,00 |
0,00 |
|
|
2. Convertible debentures:
|
0,00 |
0,00 |
0,00 |
0,00 |
0,00 |
|
|
3. Other debt securities:
|
0,00 |
0,00 |
0,00 |
0,00 |
0,00 |
|
|
II. Amounts owed to credit institutions: |
26.645.886,00 |
40.664.429,00 |
51.415.411,00 |
17.500.000,00 |
36.000.000,00 |
|
|
1. Loans and other
liabilities: |
26.645.886,00 |
40.664.429,00 |
51.415.411,00 |
17.500.000,00 |
36.000.000,00 |
|
|
2. Long-term liabilities
from capital leases: |
0,00 |
0,00 |
0,00 |
0,00 |
0,00 |
|
|
III. Debts with companies of the group and
affiliated ones: |
110.579.715,00 |
84.613.863,00 |
87.779.436,00 |
81.637.206,00 |
42.557.175,00 |
|
|
1. Amounts owed to group
companies: |
110.579.715,00 |
84.613.863,00 |
87.779.436,00 |
81.637.206,00 |
42.557.175,00 |
|
|
2. Amounts owed to
associated companies: |
0,00 |
0,00 |
0,00 |
0,00 |
0,00 |
|
|
IV. Other creditors: |
289.460,00 |
324.159,00 |
372.015,00 |
54.704.203,00 |
50.636.506,00 |
|
|
1. Long-term bills of
exchange payable: |
0,00 |
0,00 |
0,00 |
0,00 |
0,00 |
|
|
2. Other creditors: |
0,00 |
0,00 |
0,00 |
0,00 |
0,00 |
|
|
3. Long term guarantees and
deposits received: |
0,00 |
0,00 |
0,00 |
54.062.322,00 |
50.221.260,00 |
|
|
4. Long term payables to
public bodies: |
289.460,00 |
324.159,00 |
372.015,00 |
641.881,00 |
415.246,00 |
|
|
V. Unpaid portion of equity investment: |
0,00 |
0,00 |
0,00 |
0,00 |
0,00 |
|
|
1. Group companies: |
0,00 |
0,00 |
0,00 |
0,00 |
0,00 |
|
|
2. Associated companies:
|
0,00 |
0,00 |
0,00 |
0,00 |
0,00 |
|
|
3. Third parties: |
0,00 |
0,00 |
0,00 |
0,00 |
0,00 |
|
|
VI. Long term trade creditors: |
0,00 |
0,00 |
0,00 |
0,00 |
0,00 |
|
|
E) SHORT TERM CREDITORS: |
92.162.894,00 |
117.126.574,00 |
97.485.612,00 |
73.443.750,00 |
91.646.452,00 |
|
|
I. Issued debentures and other marketable
securities: |
0,00 |
0,00 |
0,00 |
0,00 |
0,00 |
|
|
1. Non-convertible
debentures: |
0,00 |
0,00 |
0,00 |
0,00 |
0,00 |
|
|
2. Convertible debentures:
|
0,00 |
0,00 |
0,00 |
0,00 |
0,00 |
|
|
3. Other debt securities:
|
0,00 |
0,00 |
0,00 |
0,00 |
0,00 |
|
|
4. Accrued interest on
debentures and other debt securities: |
0,00 |
0,00 |
0,00 |
0,00 |
0,00 |
|
|
II. Amounts owed to credit institutions: |
43.540.515,00 |
65.278.151,00 |
37.899.462,00 |
18.321.414,00 |
44.075.044,00 |
|
|
1. Loans and other
liabilities: |
43.540.515,00 |
65.278.151,00 |
37.899.462,00 |
18.321.414,00 |
44.075.044,00 |
|
|
2. Accrued interest on
liabilities with credit institutions: |
0,00 |
0,00 |
0,00 |
0,00 |
0,00 |
|
|
3. Short-term liabilities
from capital leases: |
0,00 |
0,00 |
0,00 |
0,00 |
0,00 |
|
|
III. Short-term amounts owed to group and
associated companies: |
9.393.983,00 |
10.789.376,00 |
16.593.970,00 |
26.568.311,00 |
22.666.186,00 |
|
|
1. Amounts owed to group
companies: |
9.393.983,00 |
10.789.376,00 |
16.593.970,00 |
26.568.311,00 |
22.666.186,00 |
|
|
2. Amounts owed to
associated companies: |
0,00 |
0,00 |
0,00 |
0,00 |
0,00 |
|
|
IV. Trade creditors: |
31.217.129,00 |
29.973.226,00 |
35.969.842,00 |
21.557.462,00 |
17.849.380,00 |
|
|
1. Advanced payments from
customers: |
156.509,00 |
208.847,00 |
133.498,00 |
2.952,00 |
0,00 |
|
|
2. Amounts owed for
purchases of goods or services: |
31.060.620,00 |
29.764.379,00 |
35.836.344,00 |
21.554.510,00 |
17.849.380,00 |
|
|
3. Debts represented by
notes payable: |
0,00 |
0,00 |
0,00 |
0,00 |
0,00 |
|
|
V. Other creditors: |
4.654.453,00 |
7.297.391,00 |
4.197.072,00 |
3.636.163,00 |
2.951.942,00 |
|
|
1. Public bodies: |
1.026.581,00 |
2.309.248,00 |
810.247,00 |
1.138.475,00 |
751.028,00 |
|
|
2. Bills of exchange
payable: |
0,00 |
0,00 |
0,00 |
0,00 |
0,00 |
|
|
3. Miscellaneous debts:
|
0,00 |
0,00 |
0,00 |
0,00 |
0,00 |
|
|
4. Wages and salaries
payable: |
3.627.872,00 |
4.988.143,00 |
3.386.825,00 |
2.497.688,00 |
2.200.914,00 |
|
|
5. Guarantees and deposits
received at short term: |
0,00 |
0,00 |
0,00 |
0,00 |
0,00 |
|
|
VI. Provisions: |
3.356.814,00 |
3.788.430,00 |
2.825.266,00 |
3.360.400,00 |
4.103.900,00 |
|
|
VII. Prepayments and accrued income: |
0,00 |
0,00 |
0,00 |
0,00 |
0,00 |
|
|
F) SHORT-TERM PROVISIONS FOR LIABILITIES AND CHARGES: |
0,00 |
0,00 |
0,00 |
0,00 |
0,00 |
|
|
GENERAL TOTAL (A + B + C + D + E + F): |
276.095.933,00 |
279.247.997,00 |
260.767.485,00 |
232.643.163,00 |
223.800.731,00 |
|
MERCANTILE
REGISTRY.
|
|
EQUIVALENCIA |
EQUIVALENCIA |
EQUIVALENCIA |
EQUIVALENCIA |
EQUIVALENCIA |
|
|
DEBIT |
2013 |
2012 |
2011 |
2010 |
2009 |
|
|
A) CHARGES (A.1 to A.15): |
204.086.726,00 |
222.112.470,00 |
201.592.172,00 |
180.514.830,00 |
192.889.987,00 |
|
|
A.1. Stock reduction of both
manufactured goods and the ones in process: |
0,00 |
0,00 |
0,00 |
0,00 |
0,00 |
|
|
A.2. Supplies: |
105.614.900,00 |
112.341.345,00 |
99.719.186,00 |
84.211.042,00 |
82.614.335,00 |
|
|
a)
Stock consumption: |
105.614.900,00 |
112.341.345,00 |
99.719.186,00 |
84.211.042,00 |
82.614.335,00 |
|
|
b) Consumption
of raw materials and miscellaneous consumable ones: |
0,00 |
0,00 |
0,00 |
0,00 |
0,00 |
|
|
c)
Miscellaneous external expenditure: |
0,00 |
0,00 |
0,00 |
0,00 |
0,00 |
|
|
A.3. Staff costs: |
28.052.162,00 |
29.214.612,00 |
27.889.445,00 |
25.202.097,00 |
25.778.839,00 |
|
|
a)
Wages, salaries et al.: |
21.965.696,00 |
23.303.607,00 |
22.477.720,00 |
19.666.092,00 |
19.864.167,00 |
|
|
b) Social
security costs: |
6.086.466,00 |
5.911.005,00 |
5.411.725,00 |
5.536.005,00 |
5.914.672,00 |
|
|
A.4. Depreciation expense:
|
3.713.484,00 |
3.620.873,00 |
3.625.706,00 |
3.604.499,00 |
3.817.336,00 |
|
|
A.5. Variation of trade
provisions and losses of unrecovered receivables: |
129.969,00 |
844.896,00 |
843.754,00 |
-396.462,00 |
1.471.944,00 |
|
|
a)
Stock provision variation: |
968,00 |
-660.591,00 |
793.950,00 |
8.738,00 |
213.450,00 |
|
|
b)
Variation in provision and bad debt losses: |
57.050,00 |
665.799,00 |
22.026,00 |
-179.199,00 |
556.567,00 |
|
|
c)
Variation of other trade provisions: |
71.951,00 |
839.688,00 |
27.778,00 |
-226.001,00 |
701.927,00 |
|
|
A.6. Other operating
charges: |
56.479.518,00 |
60.326.932,00 |
57.238.399,00 |
52.640.757,00 |
59.786.185,00 |
|
|
a)
External services: |
56.124.871,00 |
60.020.999,00 |
57.020.235,00 |
52.498.757,00 |
59.611.888,00 |
|
|
b)
Taxes: |
354.647,00 |
305.933,00 |
218.164,00 |
142.000,00 |
174.297,00 |
|
|
c)
Other operating expenses: |
0,00 |
0,00 |
0,00 |
0,00 |
0,00 |
|
|
d)
Allocation to revision fund: |
0,00 |
0,00 |
0,00 |
0,00 |
0,00 |
|
|
A.I. OPERATING BENEFITS
(B.1+B.2+B.3+B.4-A.1-A.2-A.3-A.4-A.5-A.6): |
6.387.841,00 |
7.545.820,00 |
14.098.326,00 |
15.466.140,00 |
18.014.862,00 |
|
|
A.7. Financial and similar
charges: |
6.813.039,00 |
8.769.904,00 |
5.663.150,00 |
4.319.357,00 |
6.793.979,00 |
|
|
a) Due
to liabilities with companies of the group: |
3.206.402,00 |
3.952.481,00 |
2.936.887,00 |
1.908.448,00 |
3.000.348,00 |
|
|
b) Due
to liabilities with associated companies: |
0,00 |
0,00 |
0,00 |
0,00 |
0,00 |
|
|
c) Due
to other debts.: |
3.606.637,00 |
4.817.423,00 |
2.726.263,00 |
2.410.909,00 |
3.793.631,00 |
|
|
d)
Losses from financial investments: |
0,00 |
0,00 |
0,00 |
0,00 |
0,00 |
|
|
A.8. Changes in financial
investment provisions: |
2.138.947,00 |
3.751.951,00 |
3.979.740,00 |
6.505.620,00 |
4.114.075,00 |
|
|
A.9. Exchange losses: |
0,00 |
0,00 |
0,00 |
0,00 |
0,00 |
|
|
A.II. NET FINANCIAL INCOME
(B.5+B.6+B.7+B.8-A.7-A.8-A.9): |
2.888.961,00 |
6.329.545,00 |
6.739.538,00 |
0,00 |
0,00 |
|
|
A.III. PROFIT FROM ORDINARY ACTIVITIES
(A.I+A.II-B.I-B.II): |
9.276.802,00 |
13.875.365,00 |
20.837.864,00 |
5.870.130,00 |
9.361.579,00 |
|
|
A.10. Changes in provisions
for intangible, tangible and securities portfolio: |
1.279.073,00 |
1.971.298,00 |
1.847.058,00 |
4.121.076,00 |
8.324.475,00 |
|
|
A.11. Losses from tangible
and intangible fixed assets and securities portfolio: |
0,00 |
0,00 |
0,00 |
88.946,00 |
0,00 |
|
|
A.12. Losses from
transactions with own shares and debentures: |
0,00 |
0,00 |
0,00 |
0,00 |
0,00 |
|
|
A.13. Extraordinary
expenses: |
0,00 |
0,00 |
0,00 |
0,00 |
0,00 |
|
|
A.14. Expenses and losses of
former financial years: |
0,00 |
0,00 |
0,00 |
0,00 |
0,00 |
|
|
A.IV. EXTRAORDINARY PROFIT
(B.9+B.10+B.11+B.12+B.13-A.10-A.11-A.12-A.13-A.14): |
0,00 |
0,00 |
0,00 |
0,00 |
0,00 |
|
|
A.V. PROFIT BEFORE TAXES (A.III+A.IV-B.III-B.IV):
|
8.109.587,00 |
12.035.743,00 |
19.068.947,00 |
1.756.522,00 |
1.181.920,00 |
|
|
A.15. Corporation tax:
|
-134.366,00 |
1.270.659,00 |
785.734,00 |
217.898,00 |
188.819,00 |
|
|
A.16. Miscellaneous taxes:
|
0,00 |
0,00 |
0,00 |
0,00 |
0,00 |
|
|
A.VI. FINANCIAL YEAR RESULTS (PROFIT)
(A.V-A.15-A.16): |
8.243.953,00 |
10.765.084,00 |
18.283.213,00 |
1.538.624,00 |
993.101,00 |
|
MERCANTILE
REGISTRY.
|
|
EQUIVALENCIA |
EQUIVALENCIA |
EQUIVALENCIA |
EQUIVALENCIA |
EQUIVALENCIA |
|
|
CREDIT |
2013 |
2012 |
2011 |
2010 |
2009 |
|
|
B) INCOME ( B.1 to B.13): |
212.330.679,00 |
232.877.554,00 |
219.875.385,00 |
182.053.454,00 |
193.883.088,00 |
|
|
B.1. Net total sales: |
176.787.204,00 |
190.603.862,00 |
181.958.943,00 |
164.057.641,00 |
171.288.136,00 |
|
|
a)
Sales: |
171.377.843,00 |
186.144.683,00 |
178.464.421,00 |
160.613.347,00 |
167.357.952,00 |
|
|
b)
Rendering of services: |
5.409.361,00 |
4.459.179,00 |
3.494.522,00 |
3.444.294,00 |
3.930.184,00 |
|
|
Returns
and Rappel on sales: |
0,00 |
0,00 |
0,00 |
0,00 |
0,00 |
|
|
B.2. Stock increase of
manufactured goods and products in process: |
0,00 |
0,00 |
0,00 |
0,00 |
0,00 |
|
|
B.3. Works performed by the
company for fixed assets: |
0,00 |
0,00 |
0,00 |
0,00 |
0,00 |
|
|
B.4. Miscellaneous operating
income: |
23.590.670,00 |
23.290.616,00 |
21.455.873,00 |
16.670.432,00 |
20.195.365,00 |
|
|
a)
Auxiliary income and other from current management: |
23.590.670,00 |
23.290.616,00 |
21.455.873,00 |
16.670.432,00 |
20.195.365,00 |
|
|
b)
Grants: |
0,00 |
0,00 |
0,00 |
0,00 |
0,00 |
|
|
c)
Liabilities and charges provisions surplus: |
0,00 |
0,00 |
0,00 |
0,00 |
0,00 |
|
|
B.I. PÉRDIDAS DE EXPLOTACIÓN
(A.1+A.2+A.3+A.4+A.5-A.6-B.1-B.2-B.3-B.4): |
0,00 |
0,00 |
0,00 |
0,00 |
0,00 |
|
|
B.5. Income from equity
investment: |
10.000.000,00 |
16.200.000,00 |
15.251.000,00 |
0,00 |
1.132.388,00 |
|
|
a) In
companies of the group: |
10.000.000,00 |
16.200.000,00 |
15.251.000,00 |
0,00 |
756.029,00 |
|
|
b) In
associated companies: |
0,00 |
0,00 |
0,00 |
0,00 |
0,00 |
|
|
c)
Third parties: |
0,00 |
0,00 |
0,00 |
0,00 |
376.359,00 |
|
|
B.6. Income from other
marketable securities and long-term receivables: |
0,00 |
0,00 |
0,00 |
0,00 |
0,00 |
|
|
a) From
companies of the group: |
0,00 |
0,00 |
0,00 |
0,00 |
0,00 |
|
|
b) From
associated companies: |
0,00 |
0,00 |
0,00 |
0,00 |
0,00 |
|
|
c) From
companies out of the group: |
0,00 |
0,00 |
0,00 |
0,00 |
0,00 |
|
|
B.7. Miscellaneous interests
or similar income: |
1.588.035,00 |
1.741.024,00 |
639.694,00 |
614.280,00 |
0,00 |
|
|
a) From
companies of the group: |
1.438.191,00 |
1.367.712,00 |
577.464,00 |
572.979,00 |
0,00 |
|
|
b) From
associated companies: |
0,00 |
0,00 |
0,00 |
0,00 |
0,00 |
|
|
c)
Miscellaneous interests: |
149.844,00 |
373.312,00 |
62.230,00 |
41.301,00 |
0,00 |
|
|
d) Profit
on financial investment: |
0,00 |
0,00 |
0,00 |
0,00 |
0,00 |
|
|
B.8. Exchange positive
differences: |
252.912,00 |
910.376,00 |
491.734,00 |
614.687,00 |
1.122.383,00 |
|
|
B.II. NEGATIVE FINANCIAL RESULTS (A.7+A.8+A.9-B.5-B.6-B.7-B.8):
|
0,00 |
0,00 |
0,00 |
9.596.010,00 |
8.653.283,00 |
|
|
B.III. LOSSES ON ORDINARY ACTIVITIES ( B.I + B.II
- A.I - A.II ): |
0,00 |
0,00 |
0,00 |
0,00 |
0,00 |
|
|
B.9.Profit on disposal of both
tangible and intangible fixed assets and securities portfolio: |
0,00 |
0,00 |
0,00 |
0,00 |
75.062,00 |
|
|
B.10. Profit on transactions
with own shares and debentures: |
0,00 |
0,00 |
0,00 |
0,00 |
0,00 |
|
|
B.11. Capital grants
transferred to profit and loss: |
111.858,00 |
131.676,00 |
78.141,00 |
96.414,00 |
69.754,00 |
|
|
B.12. Extraordinary income:
|
0,00 |
0,00 |
0,00 |
0,00 |
0,00 |
|
|
B.13. Income and profit of
former financial years: |
0,00 |
0,00 |
0,00 |
0,00 |
0,00 |
|
|
B.IV. NEGATIVE EXTRAORDINARY RESULTS
(A.10+A.11+A.12+A.13+A.14-B.9-B.10-B.11-B.12-B.13): |
1.167.215,00 |
1.839.622,00 |
1.768.917,00 |
4.113.608,00 |
8.179.659,00 |
|
|
B.V. LOSSES BEFORE TAXES (B.III+B.IV-A.III-A.IV):
|
0,00 |
0,00 |
0,00 |
0,00 |
0,00 |
|
|
B.VI. RESULT OF THE PERIOD (LOSSES)
(B.V+A.15+A.16): |
0,00 |
0,00 |
0,00 |
0,00 |
0,00 |
|
MERCANTILE
REGISTRY.
CASHFLOW
STATEMENT
|
Model: Normal
> Source of information: Data contained in this section is taken from
the information declared in the Annual Accounts submitted to the Trade
Register.
|
|
2013 |
2012 |
2011 |
2010 |
2009 |
|
|
1. Fiscal year result before taxes.: 61100 |
8.109.587,00 |
12.035.743,00 |
19.068.947,00 |
1.956.522,00 |
1.181.920,00 |
|
|
2. Results adjustments.: 61200 |
3.063.361,00 |
2.546.563,00 |
549.848,00 |
17.532.342,00 |
23.244.605,00 |
|
|
a) Fixed Assets Amortization (+).: 61201 |
3.713.484,00 |
3.620.873,00 |
3.625.706,00 |
3.604.499,00 |
3.817.336,00 |
|
|
b) Obsolescence Allowances (+/-). : 61202 |
3.824.348,00 |
844.896,00 |
4.702.991,00 |
5.761.309,00 |
1.396.882,00 |
|
|
c) Variation in Provision (+/-). : 61203 |
-431.616,00 |
1.660.341,00 |
559.275,00 |
0,00 |
0,00 |
|
|
d) Allocation of grants (-).: 61204 |
-111.858,00 |
-131.676,00 |
-78.141,00 |
-96.414,00 |
-69.754,00 |
|
|
e) Results on disposal of fixed assets (+/-). :
61205 |
155.257,00 |
229.960,00 |
350.430,00 |
88.946,00 |
41.259,00 |
|
|
g) Financial income (-).: 61207 |
-11.588.035,00 |
-17.941.024,00 |
-15.890.694,00 |
-614.280,00 |
-1.132.388,00 |
|
|
h) Financial Expenses (+). : 61208 |
6.813.039,00 |
8.769.904,00 |
5.663.150,00 |
8.788.282,00 |
19.191.270,00 |
|
|
j) Reasonable Value Variation in Financial
Instruments (+/-).: 61210 |
0,00 |
5.493.289,00 |
1.617.131,00 |
0,00 |
0,00 |
|
|
k) Other income and expense (-/+). : 61211 |
688.742,00 |
0,00 |
0,00 |
0,00 |
0,00 |
|
|
3. Changes in current capital equity.: 61300 |
17.511.496,00 |
-19.077.981,00 |
-13.284.971,00 |
-3.111.052,00 |
1.063.173,00 |
|
|
a) Stock (+/-).: 61301 |
3.262.156,00 |
-2.305.171,00 |
-7.413.433,00 |
3.422.958,00 |
-3.981.387,00 |
|
|
d) Debtors and other accounts receivable (+/-). :
61302 |
16.836.044,00 |
-7.883.940,00 |
-22.801.218,00 |
-6.356.882,00 |
3.741.243,00 |
|
|
c) Other current assets (+/-). : 61303 |
0,00 |
215.840,00 |
-2.538.586,00 |
279.708,00 |
-1.399.825,00 |
|
|
d) Creditors and other accounts payable (+/-). :
61304 |
-2.966.867,00 |
-9.374.659,00 |
19.695.035,00 |
-456.836,00 |
1.633.003,00 |
|
|
e) Other current liabilities (+/-).: 61305 |
380.163,00 |
20.931,00 |
-226.769,00 |
0,00 |
1.070.139,00 |
|
|
f) Other non-current assets and liabilities (+/-).:
61306 |
0,00 |
249.018,00 |
0,00 |
0,00 |
0,00 |
|
|
4. Other cash flows for operating activities.: 61400 |
4.491.418,00 |
8.794.382,00 |
9.636.458,00 |
-3.381.290,00 |
-5.976.418,00 |
|
|
a) Interest payments (-). : 61401 |
-6.813.039,00 |
-8.604.931,00 |
-5.663.150,00 |
-4.319.357,00 |
-3.364.373,00 |
|
|
b) Dividend payment collection (+). : 61402 |
10.000.000,00 |
16.200.000,00 |
15.251.000,00 |
0,00 |
0,00 |
|
|
c) Interest collection (+). : 61403 |
1.588.035,00 |
1.741.024,00 |
639.694,00 |
614.280,00 |
0,00 |
|
|
d) Income tax payment collection (payments)
(+/-).: 61404 |
-283.578,00 |
-541.711,00 |
-591.086,00 |
323.787,00 |
-2.612.045,00 |
|
|
5. Operating activity cash flows (1 + 2 + 3 + 4) : 61500 |
33.175.862,00 |
4.298.707,00 |
15.970.282,00 |
12.996.522,00 |
19.513.280,00 |
|
|
6. Payments for investment (-).: 62100 |
-39.367.303,00 |
-20.027.214,00 |
-6.879.290,00 |
-11.309.107,00 |
-26.117.661,00 |
|
|
a) Companies of the group and affiliates. :
62101 |
-34.772.642,00 |
-16.330.387,00 |
-2.935.202,00 |
-7.965.861,00 |
-26.103.189,00 |
|
|
b) Intangible fixed assets. : 62102 |
-631.573,00 |
-513.872,00 |
-921.779,00 |
-7.509,00 |
0,00 |
|
|
c) Fixed assets. : 62103 |
-3.948.994,00 |
-3.094.862,00 |
-2.787.709,00 |
-3.210.984,00 |
-3.446.097,00 |
|
|
e) Other financial assets. : 62105 |
-14.094,00 |
-88.093,00 |
-234.600,00 |
-124.753,00 |
-153.830,00 |
|
|
h) Other assets. : 62108 |
0,00 |
0,00 |
0,00 |
0,00 |
3.585.455,00 |
|
|
7. Divestment payment collection (+). : 62200 |
13.150.593,00 |
3.335.529,00 |
2.704.695,00 |
327.909,00 |
95.600,00 |
|
|
a) Companies of the group and affiliates. :
62201 |
12.824.490,00 |
3.073.055,00 |
2.279.895,00 |
0,00 |
0,00 |
|
|
b) Intangible fixed assets. : 62202 |
1.198,00 |
1.935,00 |
156.125,00 |
0,00 |
0,00 |
|
|
c) Fixed assets. : 62203 |
324.905,00 |
130.988,00 |
175.214,00 |
227.091,00 |
33.833,00 |
|
|
e) Other financial assets. : 62205 |
0,00 |
129.552,00 |
93.461,00 |
100.818,00 |
61.767,00 |
|
|
h) Other assets. : 62208 |
0,00 |
-1,00 |
0,00 |
0,00 |
0,00 |
|
|
8. Investment activity cash flows (6 + 7) minus Amortization:
62300 |
-26.216.710,00 |
-16.691.685,00 |
-4.174.595,00 |
-10.981.198,00 |
-26.022.061,00 |
|
|
9. Payment collection and payments for equity instruments. :
63100 |
1.519.799,00 |
150.000,00 |
-612.972,00 |
120.963,00 |
277.785,00 |
|
|
a) Issuance of equity instruments (+). :
63101 |
1.495.149,00 |
0,00 |
0,00 |
0,00 |
0,00 |
|
|
b) Amortization of assets instruments (-). :
63102 |
0,00 |
0,00 |
-612.972,00 |
0,00 |
0,00 |
|
|
e) Grants, donations and bequests received (+). :
63105 |
24.650,00 |
150.000,00 |
0,00 |
120.963,00 |
277.785,00 |
|
|
10. Payment collection and payments for financial liabilities
instruments.: 63200 |
-10.055.389,00 |
12.811.371,00 |
-10.434.697,00 |
-1.496.208,00 |
4.173.255,00 |
|
|
a) Issuance : 63201 |
28.431.053,00 |
34.363.709,00 |
77.947.045,00 |
42.757.422,00 |
14.673.255,00 |
|
|
2. Debts incurred with credit institutions (+). :
63203 |
1.000.000,00 |
31.815.816,00 |
71.804.815,00 |
0,00 |
14.673.255,00 |
|
|
3. Debts incurred with companies of the group and
affiliates (+).: 63204 |
27.431.053,00 |
2.547.893,00 |
6.142.230,00 |
42.757.422,00 |
0,00 |
|
|
b) Repayment and amortization of : 63207 |
-38.486.442,00 |
-21.552.338,00 |
-88.381.742,00 |
-44.253.630,00 |
-10.500.000,00 |
|
|
2. Debts incurred with credit institutions (-).:
63209 |
-37.021.241,00 |
-15.838.872,00 |
-18.711.174,00 |
-44.253.630,00 |
-10.500.000,00 |
|
|
3. Debts incurred with companies of the group and
affiliates (-). : 63210 |
-1.465.201,00 |
-5.713.466,00 |
-14.617.700,00 |
0,00 |
0,00 |
|
|
4. Special characteristic debts (-). :
63211 |
0,00 |
0,00 |
-55.052.868,00 |
0,00 |
0,00 |
|
|
11. Payments from dividends and remunerations from other assets
instruments. : 63300 |
0,00 |
0,00 |
0,00 |
0,00 |
0,00 |
|
|
12. Cash flows for financing activities (9+10+11).: 63400 |
-8.535.590,00 |
12.961.371,00 |
-11.047.669,00 |
-1.375.245,00 |
4.451.040,00 |
|
|
D) EFFECT OF EXCHANGE RATE CHANGES: 64000 |
0,00 |
0,00 |
0,00 |
0,00 |
0,00 |
|
|
E) NET INCREASE/DECREASE OF CASH OR EQUIVALENT ASSETS
(+/-5+/-8+/12+/-D) : 65000 |
-1.576.438,00 |
568.393,00 |
748.018,00 |
640.079,00 |
-2.057.741,00 |
|
|
Cash or equivalent assets as of beginning of the fiscal
year.: 65100 |
2.703.636,00 |
2.135.243,00 |
1.387.225,00 |
747.146,00 |
2.804.887,00 |
|
|
Cash or equivalent assets as of end of the fiscal
year.: 65200 |
1.127.198,00 |
2.703.636,00 |
2.135.243,00 |
1.387.225,00 |
747.146,00 |
|
FINANCIAL
DIAGNOSIS
|
> Economic-Financial Comparative Analysis
Data used in the following ratios and indicators is taken from the
Annual Accounts submitted by the company to the TRADE REGISTER.
> Comparison within the Sector
|
Cash Flow |
2013 |
2012 |
Variación 2013 -
2012 |
|
|||
|
|
Empresa |
Sector |
Empresa |
Sector |
Empresa |
Sector |
|
|
Cash Flow over Sales: |
-0,01 % |
0,02 % |
0,00 % |
0,01 % |
|
156,17 % |
|
|
EBITDA over Sales: |
5,71 % |
10,04 % |
5,86 % |
9,23 % |
-2,47 % |
8,80 % |
|
|
Cash Flow Yield: |
-0,01 % |
0,01 % |
0,00 % |
0,00 % |
|
|
|
|
Profitability |
2013 |
2012 |
Variación 2013 -
2012 |
|
|||
|
|
Empresa |
Sector |
Empresa |
Sector |
Empresa |
Sector |
|
|
Operating economic profitability: |
5,62 % |
6,28 % |
5,53 % |
5,22 % |
1,67 % |
20,18 % |
|
|
Total economic profitability: |
5,39 % |
3,48 % |
7,45 % |
2,49 % |
-27,60 % |
39,67 % |
|
|
Financial profitability: |
17,87 % |
3,99 % |
30,15 % |
1,32 % |
-40,73 % |
202,43 % |
|
|
Margin: |
3,17 % |
5,79 % |
3,48 % |
4,85 % |
-9,07 % |
19,44 % |
|
|
Mark-up: |
4,05 % |
3,74 % |
5,63 % |
1,59 % |
-28,08 % |
135,82 % |
|
|
Solvency |
2013 |
2012 |
Variación 2013 -
2012 |
|
|||
|
|
Empresa |
Sector |
Empresa |
Sector |
Empresa |
Sector |
|
|
Liquidity: |
0,01 |
0,14 |
0,02 |
0,12 |
-46,27 |
18,77 |
|
|
Acid Test: |
0,81 |
0,85 |
0,79 |
0,85 |
2,63 |
-0,19 |
|
|
Working Capital / Investment: |
0,02 |
0,02 |
0,01 |
0,03 |
224,68 |
-13,54 |
|
|
Solvency: |
1,15 |
1,17 |
1,08 |
1,17 |
6,29 |
-0,21 |
|
|
Indebtedness |
2013 |
2012 |
Variación 2013 -
2012 |
|
|||
|
|
Empresa |
Sector |
Empresa |
Sector |
Empresa |
Sector |
|
|
Indebtedness level: |
4,90 |
1,45 |
6,68 |
1,63 |
-26,66 |
-11,34 |
|
|
Borrowing Composition: |
1,56 |
1,00 |
1,10 |
1,02 |
41,41 |
-1,98 |
|
|
Repayment Ability: |
-144,18 |
66,29 |
423,36 |
184,45 |
-134,05 |
-64,06 |
|
|
Warranty: |
1,22 |
1,70 |
1,16 |
1,62 |
4,89 |
5,03 |
|
|
Generated resources / Total creditors: |
0,07 |
0,08 |
0,08 |
0,07 |
-16,15 |
19,65 |
|
|
Efficiency |
2013 |
2012 |
Variación 2013 -
2012 |
|
|||
|
|
Empresa |
Sector |
Empresa |
Sector |
Empresa |
Sector |
|
|
Productivity: |
1,36 |
1,80 |
1,38 |
1,73 |
-1,60 |
4,53 |
|
|
Turnover of Collection Rights : |
2,85 |
5,06 |
2,44 |
4,79 |
16,85 |
5,53 |
|
|
Turnover of Payment Entitlements: |
3,58 |
3,68 |
3,61 |
3,52 |
-0,73 |
4,63 |
|
|
Stock rotation: |
7,32 |
7,42 |
6,93 |
6,52 |
5,58 |
13,80 |
|
|
Assets turnover: |
1,77 |
1,08 |
1,59 |
1,08 |
11,81 |
0,62 |
|
|
Borrowing Cost: |
3,00 |
2,85 |
3,64 |
2,95 |
-17,75 |
-3,43 |
|
> Trend of indicators under the General Accounting Plan of 2007
(2013, 2012, 2011, 2010, 2009)
|
Cash Flow |
2013 |
2012 |
2011 |
2010 |
2009 |
|
|
Cash Flow over Sales: |
-0,01 % |
0,00 % |
0,00 % |
0,00 % |
-1,20 % |
|
|
EBITDA over Sales: |
5,71 % |
5,86 % |
9,74 % |
11,62 % |
12,75 % |
|
|
Cash Flow Yield: |
-0,01 % |
0,00 % |
0,00 % |
0,00 % |
-0,91 % |
|
|
Profitability |
2013 |
2012 |
2011 |
2010 |
2009 |
|
|
Operating economic profitability: |
5,62 % |
5,53 % |
11,15 % |
16,23 % |
18,25 % |
|
|
Total economic profitability: |
5,39 % |
7,45 % |
9,48 % |
2,69 % |
3,55 % |
|
|
Financial profitability: |
17,87 % |
30,15 % |
78,54 % |
34,44 % |
41,41 % |
|
|
Margin: |
3,17 % |
3,48 % |
6,80 % |
8,56 % |
9,46 % |
|
|
Mark-up: |
4,05 % |
5,63 % |
9,37 % |
0,97 % |
-8,84 % |
|
|
Solvency |
2013 |
2012 |
2011 |
2010 |
2009 |
|
|
Liquidity: |
0,01 |
0,02 |
0,02 |
0,02 |
0,01 |
|
|
Acid Test: |
0,81 |
0,79 |
0,98 |
0,98 |
0,72 |
|
|
Working Capital / Investment: |
0,02 |
0,01 |
0,09 |
0,07 |
0,03 |
|
|
Solvency: |
1,15 |
1,08 |
1,30 |
1,32 |
1,09 |
|
|
Indebtedness |
2013 |
2012 |
2011 |
2010 |
2009 |
|
|
Indebtedness level: |
4,90 |
6,68 |
9,97 |
41,69 |
59,35 |
|
|
Borrowing Composition: |
1,56 |
1,10 |
1,46 |
2,19 |
1,48 |
|
|
Repayment Ability: |
-144,18 |
423,36 |
314,06 |
351,32 |
-30,79 |
|
|
Warranty: |
1,22 |
1,16 |
1,11 |
1,04 |
1,04 |
|
|
Generated resources / Total creditors: |
0,07 |
0,08 |
0,11 |
0,05 |
0,06 |
|
|
Efficiency |
2013 |
2012 |
2011 |
2010 |
2009 |
|
|
Productivity: |
1,36 |
1,38 |
1,64 |
1,76 |
1,85 |
|
|
Turnover of Collection Rights : |
2,85 |
2,44 |
2,53 |
3,11 |
3,61 |
|
|
Turnover of Payment Entitlements: |
3,58 |
3,61 |
2,78 |
3,67 |
3,82 |
|
|
Stock rotation: |
7,32 |
6,93 |
7,06 |
8,19 |
5,98 |
|
|
Assets turnover: |
1,77 |
1,59 |
1,64 |
1,90 |
1,93 |
|
|
Borrowing Cost: |
3,00 |
3,64 |
2,41 |
1,92 |
3,13 |
|
COMPARATIVE SECTORIAL BALANCE
|
Sector-based Comparison
under the rules of the New General Accounting Plan.
|
|
Variación - |
|
|
|
Empresa |
Sector |
|
|
Variación - |
|
|
|
Empresa |
Sector |
|
|
Variación - |
|
|
|
Empresa |
Sector |
News
|
|
La
información.com |
06/11/2014 |
|
María León y
Jesús Castro padrinos en la nueva colección de relojes de Pepe Jeans |
|
|
Companies
related |
|
|
|
|
|
CincoDías.com |
17/02/2014 |
|
Pepe Jeans abre
dos nuevas tiendas en Italia |
|
|
Companies
related |
|
Public
Tenders and Works Won
|
No Public Tenders
assigned to the name of the company.
Detail
of Subsidies appearing in Balances Memories
|
|
Entity |
ORGANISMO NO ESPECIFICADO |
|
Status |
CONCEDIDA |
|
Amount Granted |
78.301,00 |
|
Notes |
El importe reflejado corresponde al imputado a resultados del
ejercicio, quedando a fecha de cierre del mismo un saldo pendiente de
traspasar de 245.301 euros. |
|
Entity |
ORGANISMO NO ESPECIFICADO |
|
Status |
CONCEDIDA |
|
Amount Granted |
92.172,00 |
|
Notes |
El importe reflejado corresponde al imputado a la cuenta de pérdidas y
ganancias, quedando un saldo pendiente de imputar de 306.346 euros. |
|
Entity |
ORGANISMO NO ESPECIFICADO |
|
Subsidy Concept |
Subvención de capital |
|
Status |
CONCEDIDA |
|
Amount Granted |
78.141,00 |
|
Notes |
El importe reflejado corresponde al Imputados a resultados. |
|
Entity |
ORGANISMO NO ESPECIFICADO |
|
Subsidy Concept |
Subvención de capital. |
|
Status |
CONCEDIDA |
|
Amount Granted |
67.490,00 |
|
Notes |
Dicho importe corresponde al traspasado a resultados del ejercicio,
quedando a fecha de cierre pendiente imputar 345.391 euros. |
Research
Summary
|
|
We have a firm founded in 1998, dedicated to the manufacture and sale of
clothing and accessories for men and women. It operates both nationally and
internationally. At present and according to published news is near to close
a sale, but the sources have been unable to determine whether this
circumstance has already been accomplished. In light of the above we believe
that is possible to continue normal operations relating to risk, although
advised to follow their evolution to determine who ends up in the hands of
the society in question. |
Sources
|
|
Registry of Commerce's Official Gazette. Own and external data bases
Company References |
FOREIGN EXCHANGE RATES
|
Currency |
Unit
|
Indian Rupees |
|
US Dollar |
1 |
Rs.61.70 |
|
|
1 |
Rs.93.41 |
|
Euro |
1 |
Rs.71.33 |
INFORMATION DETAILS
|
Analysis Done by
: |
RAS |
|
|
|
|
Report Prepared
by : |
TPT |
RATING EXPLANATIONS
|
RATING |
STATUS |
PROPOSED CREDIT LINE |
|
|
>86 |
Aaa |
Possesses an extremely sound financial base with the strongest
capability for timely payment of interest and principal sums |
Unlimited |
|
71-85 |
Aa |
Possesses adequate working capital. No caution needed for credit
transaction. It has above average (strong) capability for payment of interest
and principal sums |
Large |
|
56-70 |
A |
Financial & operational base are regarded healthy. General
unfavourable factors will not cause fatal effect. Satisfactory capability for
payment of interest and principal sums |
Fairly Large |
|
41-55 |
Ba |
Overall operation
is considered normal. Capable to meet normal commitments. |
Satisfactory |
|
26-40 |
B |
Capability to overcome financial difficulties seems comparatively
below average. |
Small |
|
11-25 |
Ca |
Adverse factors are apparent. Repayment of interest and principal sums
in default or expected to be in default upon maturity |
Limited with
full security |
|
<10 |
C |
Absolute credit risk exists. Caution needed to be exercised |
Credit not
recommended |
|
-- |
NB |
New Business |
-- |
This score serves as a reference to assess
SC’s credit risk and to set the amount of credit to be extended. It is calculated
from a composite of weighted scores obtained from each of the major sections of
this report. The assessed factors and their relative weights (as indicated
through %) are as follows:
Financial
condition (40%) Ownership
background (20%) Payment record
(10%)
Credit history
(10%) Market trend (10%) Operational size
(10%)
This report is issued at your request without any
risk and responsibility on the part of MIRA INFORM PRIVATE LIMITED (MIPL)
or its officials.