MIRA INFORM REPORT
|
Report No. : |
303694 |
|
Report Date : |
21.01.2015 |
IDENTIFICATION DETAILS
|
Name : |
ASHIMORI
[THAILAND] COMPANY LIMITED |
|
|
|
|
Formerly Known As : |
KPN ASHIMORI CO., LTD. |
|
|
|
|
Registered Office : |
89 Moo 9, Wellgrow Industrial Estate, Bangna-Trad Road, K.M. 36, T. Bangwua, A. Bangpakong, Chachoengsao 24180 |
|
|
|
|
Country : |
Thailand |
|
|
|
|
Financials (as on) : |
31.12.2013 |
|
|
|
|
Date of Incorporation : |
16.02.1998 |
|
|
|
|
Com. Reg. No.: |
0115541000652 |
|
|
|
|
Legal Form : |
Private Limited Company |
|
|
|
|
Line of Business : |
Manufacturer, Distributor and
Exporter of Automotive Safety System
Products |
|
|
|
|
No. of Employees : |
1,000 |
RATING & COMMENTS
|
MIRA’s Rating : |
B |
|
RATING |
STATUS |
PROPOSED CREDIT LINE |
|
|
26-40 |
B |
Capability to overcome financial difficulties seems comparatively
below average. |
Small |
|
Status : |
Moderate |
|
|
|
|
Payment Behaviour : |
Slow but correct |
|
|
|
|
Litigation : |
Clear |
NOTES:
Any query related to this report can be made
on e-mail: infodept@mirainform.com
while quoting report number, name and date.
ECGC Country Risk Classification List – September 30, 2014
|
Country Name |
Previous Rating (30.06.2014) |
Current Rating (30.09.2014) |
|
Thailand |
B1 |
B1 |
|
Risk Category |
ECGC
Classification |
|
Insignificant |
A1 |
|
Low |
A2 |
|
Moderate |
B1 |
|
High |
B2 |
|
Very High |
C1 |
|
Restricted |
C2 |
|
Off-credit |
D |
THAILAND - ECONOMIC OVERVIEW
With a well-developed
infrastructure, a free-enterprise economy, generally pro-investment policies,
and strong export industries, Thailand achieved steady growth due largely to
industrial and agriculture exports - mostly electronics, agricultural
commodities, automobiles and parts, and processed foods. Unemployment, at less
than 1% of the labor force, stands as one of the lowest levels in the world,
which puts upward pressure on wages in some industries. Thailand also attracts
nearly 2.5 million migrant workers from neighboring countries. The Thai
government in 2013 implemented a nation-wide 300 baht ($10) per day minimum
wage policy and deployed new tax reforms designed to lower rates on
middle-income earners. The Thai economy has weathered internal and external
economic shocks in recent years. The global economic recession severely cut
Thailand's exports, with most sectors experiencing double-digit drops. In late
2011 Thailand's recovery was interrupted by historic flooding in the industrial
areas in Bangkok and its five surrounding provinces, crippling the
manufacturing sector. The government approved flood mitigation projects worth
$11.7 billion, which were started in 2012, to prevent similar economic damage,
and an additional $75 billion for infrastructure over the following seven
years. This was expected to lead to an economic upsurge but growth has remained
slow, in part due to ongoing political unrest and resulting uncertainties.
Spending on infrastructure will require re-approval once a new government is
seated.
|
Source
: CIA |
Company
Name
ASHIMORI [THAILAND] COMPANY LIMITED
SUMMARY
BUSINESS ADDRESS : 89
MOO 9, WELLGROW
INDUSTRIAL ESTATE,
BANGNA-TRAD ROAD,
K.M. 36,
T. BANGWUA, A. BANGPAKONG,
CHACHOENGSAO 24180, THAILAND
TELEPHONE : [66] 38
571-751-9
FAX :
[66] 38
571-760
E-MAIL ADDRESS : it_staff1@ashimori.co.th
REGISTRATION ADDRESS : SAME
AS BUSINESS ADDRESS
ESTABLISHED : 1998
REGISTRATION NO. : 0115541000652
TAX ID NO. : 3271088197
CAPITAL REGISTERED
: BHT.
390,000,000
CAPITAL PAID-UP
: BHT.
390,000,000
SHAREHOLDER’S PROPORTION : JAPANESE
: 100%
FISCAL YEAR
CLOSING DATE : DECEMBER 31
LEGAL STATUS : PRIVATE LIMITED
COMPANY
EXECUTIVE : MR.
MANABU SUGIMOTO, JAPANESE
MANAGING DIRECTOR
NO. OF
STAFF : 1,000
LINES OF
BUSINESS : AUTOMOTIVE SAFETY
SYSTEM PRODUCTS
MANUFACTURER,
DISTRIBUTOR AND EXPORTER
CORPORATE
PROFILE
OPERATING TREND : STABLE
PRESENT SITUATION : OPERATING NORMALLY
REPUTATION : GOOD
WITH NORMAL BUSINESS
ENGAGEMENT
MANAGEMENT STANDARD : MANAGEMENT WITH
FAIR PERFORMANCE
HISTORY
The
subject was established
on February 16, 1998 as
a private limited
company under the
originally registered name “KPN
Ashimori Co., Ltd.” by Japanese
group. On August 1,
2003, its registered
name was changed
to ASHIMORI [THAILAND]
COMPANY LIMITED. Its
business objective is
to manufacture and
distribute various kinds
of safety system
products for automotive
industry both domestic
and international markets.
It currently employs
approximately 1,000 staff.
The
subject is a
subsidiary of Ashimori
Industry Company Limited,
in Japan.
The
subject’s registered address
is 89 Moo
9, Wellgrow Industrial
Estate, Bangna-Trad Road,
K.M. 36, T. Bangwua, A. Bangpakong, Chachoengsao
24180, and this
is the subject’s
current operation address.
THE
BOARD OF DIRECTOR
|
Name |
|
Nationality |
Age |
|
|
|
|
|
|
Mr. Masao
Takahashi |
[x] |
Japanese |
53 |
|
Mr. Hidefumi Ueda |
|
Japanese |
57 |
|
Mr. Kazuta
Tsukahara |
|
Japanese |
55 |
|
Mr. Zhao
Wen Chen |
|
Chinese |
53 |
|
Mr. Toshiro Sakaue |
[x] |
Japanese |
57 |
|
Mr. Manabu
Sugimoto |
[x] |
Japanese |
51 |
AUTHORIZED
PERSON
Any
of the mentioned
directors [x] can sign on
behalf of the
subject with company’s
affixed.
MANAGEMENT
Mr. Manabu Sugimoto
is the Managing
Director.
He
is Japanese nationality
with the age
of 51 years old.
Mr. Yasuki Nishioka
is the General
Manager [Quality].
He
is Japanese nationality.
Mr. Hiroaki Yamaguchi
is the General Manager [Plant
Operation].
He
is Japanese nationality.
Mr. Nobuhisa Inada
is the General
Manager [Planning].
He
is Japanese nationality.
Mr. Narongrit Riemsri
is the General
Manager [Administration].
He
is Thai nationality.
BUSINESS
OPERATIONS
The
subject is engaged
in manufacturing, distributing
and exporting of
automotive safety system
products, such as
seat belts, air bags and
tonneau covers for automotive
industry.
BRAND
NAME
“ASHIMORI”
PURCHASE
Raw
materials and accessories
are purchased from
both local and
overseas suppliers in
Japan, Germany and
Singapore.
MAJOR SUPPLIER
Ashimori Industry
Co., Ltd. : Japan
SALES
80%
of the products
is sold locally
to manufacturers and
end-users, the remaining
20% is exported
to Japan, Malaysia
and Indonesia.
MAJOR CUSTOMERS
Auto
Alliance [Thailand] Co.,
Ltd. : Thailand
Ashimori
Industry Company Limited : Japan
SUBSIDIARY
AND AFFILIATED COMPANY
The
subject is not
found to have
any subsidiary or
affiliated company here
in Thailand.
LITIGATION
Bankruptcy and
Receivership
There
are no litigation
on bankruptcy and
receivership cases filed
against the subject
found at Legal
Execution Department for
the past five
years.
Others
There
are no legal
suits filed against
the subject
according the past
two years.
CREDIT
Sales
are by cash
or on the
credits term of
30-60 days.
Local
bills are paid
by cash or
on the credits
term of 30-60
days.
Imports
are by L/C
at sight or
T/T.
Exports
are against T/T.
BANKING
Bangkok Bank Public
Co., Ltd.
EMPLOYMENT
The subject
currently employs approximately
1,000 staff.
LOCATION
DETAILS
The
premise is owned for
administrative office, factory
and warehouse on
13,000 square meters
of land at
the heading address.
Premise is located
in industrial area.
COMMENT
In 2013, Thailand has
been adversely affected
by ongoing political
turmoil and at the
same time its
economy also experienced
some downturns growth, which
is reflected in lower
annual growth targets
forecasted by automotive
industry as a
whole.
Subject’s business had
well performed in
the year 2013.
While 2014 the
automotive industry was
likely to be
under the same domestic
and external factors. The company
has closely monitored the impacts
from the US
economy, the ongoing
financial crisis in Europe
and the
economic slowdown in China, which
had adversely affected automotive
parts and related
industries as well.
FINANCIAL
INFORMATION
The capital
was registered at
Bht. 40,000,000 divided into
400,000 shares of
Bht. 100 each
with fully paid.
The capital
was increased later
as follows:
Bht.
220,000,000 on
July 9, 2003
Bht.
390,000,000 on
June 22, 2006
The latest
registered capital was
increased to Bht. 390,000,000
divided into 3,900,000 shares
of Bht. 100 each
with fully paid.
THE
SHAREHOLDERS LISTED WERE
[As at
April 28, 2014]
|
NAME |
HOLDING |
% |
|
|
|
|
|
Ashimori Industry
Company Limited Nationality: Japanese Address
: 10-18, 3-chome, Kitahorie, Nishi-ku, Osaka, Japan |
3,836,180 |
98.36 |
|
Toyo Sangyo
Ltd. Nationality: Japanese Address :
2-27-8 Mashiman Building,
Shiba, Minato-ku, Tokyo,
Japan |
63,819 |
1.64 |
|
Mr. Masao Takahashi Nationality: Japanese Address
: 10-18, 3-chome, Kitahorie, Nishi-ku, Osaka, Japan |
1 |
- |
Total Shareholders
: 3
Share Structure
[as at April
28, 2014]
|
Nationality |
Shareholders |
No. of Share |
% Shares |
|
|
|
|
|
|
Thai |
- |
- |
- |
|
Foreign
- Japanese |
3 |
3,900,000 |
100.00 |
|
Total |
3 |
3,900,000 |
100.00 |
NAME OF AUDITOR & CERTIFIED PUBLIC
ACCOUNTANT NO.
Mr. Charoen
Phusamritlert No. 4068
BALANCE
SHEET [BAHT]
The
latest financial figures published
as at December
31, 2013, 2012
& 2011 were:
ASSETS
|
Current Assets |
2013 |
2012 |
2011 |
|
|
|
|
|
|
Cash
and Cash Equivalents |
253,614,854 |
282,943,928 |
213,836,155 |
|
Trade
Accounts Receivable |
417,247,967 |
486,334,831 |
399,738,475 |
|
Other
Receivable |
13,824,115 |
17,057,651 |
45,024,927 |
|
Inventories |
323,944,281 |
423,301,230 |
491,715,538 |
|
Other
Current Assets |
589,923 |
1,570,734 |
1,190,985 |
|
|
|
|
|
|
Total Current
Assets |
1,009,221,140 |
1,211,208,374 |
1,151,506,080 |
|
Cash at Bank pledged as a Collateral |
6,644,254 |
6,536,035 |
6,420,545 |
|
Fixed Assets |
338,672,915 |
370,376,718 |
362,585,385 |
|
Intangible Assets |
1,802,813 |
2,035,723 |
4,428,552 |
|
Other
Non - current Assets |
1,408,870 |
1,391,431 |
2,206,390 |
|
Total Assets
|
1,357,749,992 |
1,591,548,281 |
1,527,146,952 |
LIABILITIES &
SHAREHOLDERS’ EQUITY [BAHT]
|
Current
Liabilities |
2013 |
2012 |
2011 |
|
|
|
|
|
|
Bank Overdraft & Short-term Loan
From Financial Institutions |
|
|
|
|
Trade
Accounts Payable |
831,075,587 |
1,125,821,457 |
965,459,560 |
|
Other
Payable |
39,563,672 |
63,941,396 |
124,244,855 |
|
Current
Portion of Long-term Loans
from Parent Company |
13,266,498 |
15,034,320 |
17,321,052 |
|
Accrued
Expenses |
29,090,269 |
24,141,712 |
22,809,287 |
|
Accrued Income Tax |
20,573,977 |
- |
- |
|
Other
Current Liabilities |
3,254,112 |
7,555,729 |
3,618,735 |
|
|
|
|
|
|
Total Current
Liabilities |
936,824,115 |
1,236,494,614 |
1,133,453,489 |
|
Long-term Loan from Parent Company |
- |
15,034,320 |
34,642,104 |
|
Provision
for Employee Benefits |
37,496,611 |
36,008,039 |
26,643,797 |
|
Total Liabilities |
974,320,726 |
1,287,536,973 |
1,194,739,390 |
|
|
|
|
|
|
Shareholders'
Equity |
|
|
|
|
|
|
|
|
|
Share
capital : Baht 100 par
value
authorized, issued and
fully
paid share capital
3,900,000 shares |
390,000,000 |
390,000,000 |
390,000,000 |
|
|
|
|
|
|
Capital
Paid |
390,000,000 |
390,000,000 |
390,000,000 |
|
Retained Earnings:
Appropriated for Statutory
Reserve |
24,630,282 |
24,630,282 |
24,630,282 |
|
Unappropriated [Deficit]
|
[31,201,016] |
[110,618,974] |
[82,222,720] |
|
Total Shareholders' Equity |
383,429,266 |
304,011,308 |
332,407,562 |
|
Total Liabilities & Shareholders' Equity |
1,357,749,992 |
1,591,548,281 |
1,527,146,952 |
PROFIT
& LOSS ACCOUNT
|
Revenue |
2013 |
2012 |
2011 |
|
|
|
|
|
|
Sales
Income |
3,772,799,543 |
4,208,859,963 |
2,609,397,506 |
|
Interest Income |
390,827 |
298,222 |
192,771 |
|
Gain on Exchange Rate |
80,837,640 |
77,887,995 |
- |
|
Other
Income |
15,821,764 |
21,058,404 |
17,779,710 |
|
Total Revenues
|
3,869,849,774 |
4,308,104,584 |
2,627,369,987 |
|
Expenses |
|
|
|
|
|
|
|
|
|
Cost
of Goods Sold
|
3,605,429,336 |
4,044,259,895 |
2,490,493,705 |
|
Selling
Expenses |
71,201,004 |
181,698,820 |
60,944,518 |
|
Administrative Expenses |
77,397,687 |
93,905,974 |
148,580,851 |
|
Loss on Exchange Rate |
- |
- |
5,999,754 |
|
Total Expenses |
3,754,028,027 |
4,319,864,689 |
2,706,018,828 |
|
|
|
|
|
|
Profit / [Loss] before
Financial Cost
& Income Tax |
115,821,747 |
[11,760,105] |
[78,648,841] |
|
Financial Cost |
[7,743,100] |
[9,364,735] |
[4,993,982] |
|
Profit / [Loss] before
Income Tax |
108,078,647 |
[21,124,840] |
[83,642,823] |
|
Income
Tax |
[28,660,689] |
[7,271,414] |
[2,068,196] |
|
|
|
|
|
|
Net Profit / [Loss] |
79,417,958 |
[28,396,254] |
[85,711,019] |
FINANCIAL
ANALYSIS
|
ITEM |
UNIT |
2013 |
2012 |
2011 |
|
|
|
|
|
|
|
LIQUIDITY
RATIO |
|
|
|
|
|
CURRENT RATIO |
TIMES |
1.08 |
0.98 |
1.02 |
|
QUICK RATIO |
TIMES |
0.73 |
0.64 |
0.58 |
|
|
|
|
|
|
|
ACTIVITY
RATIO |
|
|
|
|
|
FIXED ASSETS TURNOVER |
TIMES |
11.14 |
11.36 |
7.20 |
|
TOTAL ASSETS TURNOVER |
TIMES |
2.78 |
2.64 |
1.71 |
|
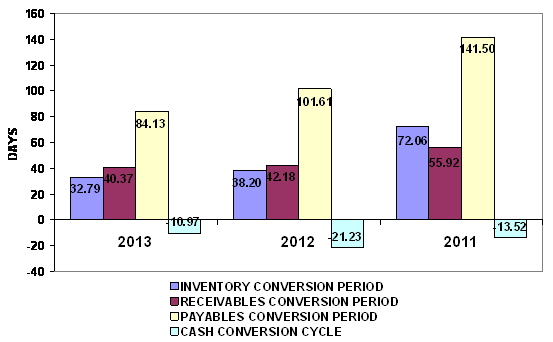
INVENTORY CONVERSION PERIOD |
DAYS |
32.79 |
38.20 |
72.06 |
|
INVENTORY TURNOVER |
TIMES |
11.13 |
9.55 |
5.06 |
|
RECEIVABLES CONVERSION PERIOD |
DAYS |
40.37 |
42.18 |
55.92 |
|
RECEIVABLES TURNOVER |
TIMES |
9.04 |
8.65 |
6.53 |
|
PAYABLES CONVERSION PERIOD |
DAYS |
84.13 |
101.61 |
141.50 |
|
CASH CONVERSION CYCLE |
DAYS |
(10.97) |
(21.23) |
(13.52) |
|
|
|
|
|
|
|
PROFITABILITY
RATIO |
|
|
|
|
|
COST OF GOODS SOLD |
% |
95.56 |
96.09 |
95.44 |
|
SELLING & ADMINISTRATION |
% |
3.94 |
6.55 |
8.03 |
|
INTEREST |
% |
0.21 |
0.22 |
0.19 |
|
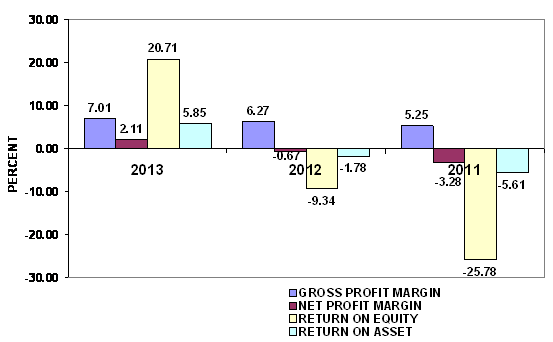
GROSS PROFIT MARGIN |
% |
7.01 |
6.27 |
5.25 |
|
NET PROFIT MARGIN BEFORE EX. ITEM |
% |
3.07 |
(0.28) |
(3.01) |
|
NET PROFIT MARGIN |
% |
2.11 |
(0.67) |
(3.28) |
|
RETURN ON EQUITY |
% |
20.71 |
(9.34) |
(25.78) |
|
RETURN ON ASSET |
% |
5.85 |
(1.78) |
(5.61) |
|
EARNING PER SHARE |
BAHT |
20.36 |
(7.28) |
(21.98) |
|
|
|
|
|
|
|
LEVERAGE
RATIO |
|
|
|
|
|
DEBT RATIO |
TIMES |
0.72 |
0.81 |
0.78 |
|
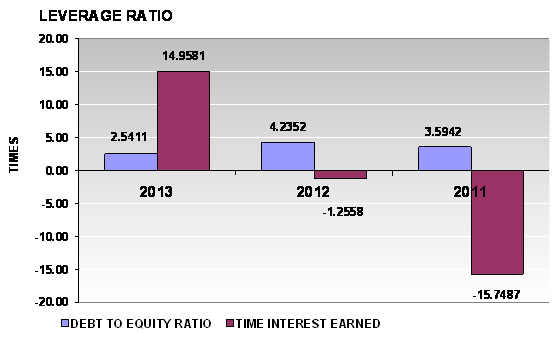
DEBT TO EQUITY RATIO |
TIMES |
2.54 |
4.24 |
3.59 |
|
TIME INTEREST EARNED |
TIMES |
14.96 |
(1.26) |
(15.75) |
|
|
|
|
|
|
|
ANNUAL
GROWTH |
|
|
|
|
|
SALES GROWTH |
% |
(10.36) |
61.30 |
|
|
OPERATING PROFIT |
% |
(1,084.87) |
(85.05) |
|
|
NET PROFIT |
% |
379.68 |
66.87 |
|
|
FIXED ASSETS |
% |
(8.56) |
2.15 |
|
|
TOTAL ASSETS |
% |
(14.69) |
4.22 |
|
ANNUAL
GROWTH: RISKY
An annual sales growth is -10.36%. Turnover has decreased from THB
PROFITABILITY
: RISKY
PROFITABILITY
RATIO
|
Gross Profit Margin |
7.01 |
Deteriorated |
Industrial Average |
20.46 |
|
Net Profit Margin |
2.11 |
Deteriorated |
Industrial Average |
6.63 |
|
Return on Assets |
5.85 |
Deteriorated |
Industrial Average |
15.34 |
|
Return on Equity |
20.71 |
Satisfactory |
Industrial Average |
26.91 |
Gross Profit Margin used to assess a firm's
financial health by revealing the proportion of money left over from revenues
after accounting for the cost of goods sold. Gross profit margin serves as the
source for paying additional expenses and future savings. The company's figure
is 7.01%. When compared with the industry average, the ratio of the company was
lower. This indicated that company may have problems with control over its
costs.
Net Profit Margin is the indicator of the
company's efficiency in that net profit takes into consideration all expenses
of the company. A low profit margin indicates a low margin of safety, higher
risk that a decline in sales will erase profits and result in a net loss. The
company's figure is 2.11%. When compared with the industry average, the ratio
of the company was lower.
Return on Assets measures how efficiently
profits are being generated from the assets employed in the business when
compared with the ratios of firms in a similar business. A low ratio in
comparison with industry averages indicates an inefficient use of business
assets. When compared with the industry average, it was
lower, the company's figure is 5.85%.
Return on Equity indicates how profitable a
company is by comparing its net income to its average shareholders' equity, ROE
measures how much the shareholders earned for their investment in the company.
When compared with the industry average, it was lower, the company's figure is
20.71%.
Trend
of the average competitors in the same industry for last 5 years
Return on Assets Uptrend
Return on Equity Uptrend
LIQUIDITY
: ACCEPTABLE
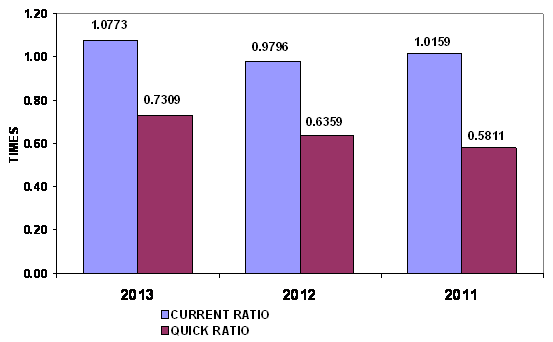
LIQUIDITY
RATIO
|
Current Ratio |
1.08 |
Acceptable |
Industrial Average |
1.73 |
|
Quick Ratio |
0.73 |
|
|
|
|
Cash Conversion Cycle |
(10.97) |
|
|
|
The Current Ratio is to ascertain whether a
company's short-term assets are readily available to pay off its short-term liabilities.
The company's figure is 1.08 times in 2013, increased from 0.98 times, then it
is generally considered to have good short-term financial strength. When
compared with the industry average, the ratio of the company was lower.
The Quick Ratio is a liquidity indicator
that further refines the current ratio by measuring the amount of the most
liquid current assets there are to cover current liabilities. The company's
figure is 0.73 times in 2013, increased from 0.64 times, then the company has
not enough current assets that presumably can be quickly converted to cash for
pay financial obligations.
The Cash Conversion Cycle measures the
number of days a company's cash is tied up in the production and sales process
of its operations and the benefit from payment terms from its creditors. It
meant the company could survive when no cash inflow was received from sale for
-11 days.
Trend
of the average competitors in the same industry for last 5 years
Current Ratio Uptrend
LEVERAGE
: ACCEPTABLE
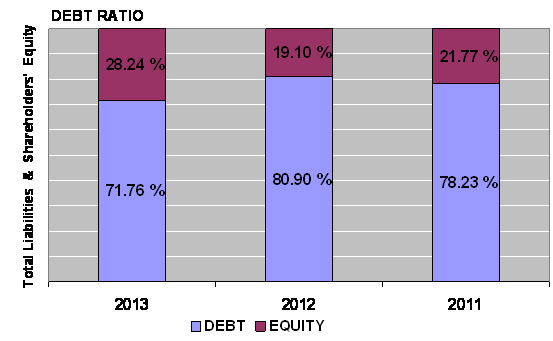
LEVERAGE
RATIO
|
Debt Ratio |
0.72 |
Acceptable |
Industrial Average |
0.41 |
|
Debt to Equity Ratio |
2.54 |
Risky |
Industrial Average |
0.69 |
|
Times Interest Earned |
14.96 |
Impressive |
Industrial Average |
- |
Debt to Equity Ratio a measurement of how
much suppliers, lenders, creditors and obligors have committed to the company
versus what the shareholders have committed. A higher the percentage means that
the company is using less equity and has stronger leverage position.
Times Interest Earned measuring a company's
ability to meet its debt obligations. Ratio is 14.96 higher than 1, so the
company can pay interest expenses on outstanding debt.
Debt Ratio shows the proportion of a
company's assets which are financed through debt. The company's figure is 0.72
greater than 0.5, most of the company's assets are financed through debt.
Trend
of the average competitors in the same industry for last 5 years
Debt Ratio Downtrend
Times Interest Earned Stable
ACTIVITY:
IMPRESSIVE
ACTIVITY
RATIO
|
Fixed Assets Turnover |
11.14 |
Impressive |
Industrial Average |
- |
|
Total Assets Turnover |
2.78 |
Impressive |
Industrial Average |
2.32 |
|
Inventory Conversion Period |
32.79 |
|
|
|
|
Inventory Turnover |
11.13 |
Satisfactory |
Industrial Average |
13.19 |
|
Receivables Conversion Period |
40.37 |
|
|
|
|
Receivables Turnover |
9.04 |
Impressive |
Industrial Average |
7.82 |
|
Payables Conversion Period |
84.13 |
|
|
|
The company's Account Receivable Ratio is
calculated as 9.04 and
Inventory Turnover in Days Ratio indicates
the liquidity of inventory. It estimates the number of days that it will take
to sell the current inventory. Inventory is particularly sensitive to change in
business activities. The inventory turnover in days has decreased from 38 days
at the end of 2012 to 33 days at the end of 2013. This represents a positive
trend. And Inventory turnover has increased from 9.55 times in year 2012 to
11.13 times in year 2013.
The company's Total Asset Turnover is
calculated as 2.78 times and 2.64 times in 2013 and 2012 respectively. This
ratio is determined by dividing total assets into total sales turnover. The
ratio measures the activity of the assets and the ability of the firm to
generate sales through the use of the assets.
Trend
of the average competitors in the same industry for last 5 years
Fixed Assets Turnover Stable
Total Assets Turnover Uptrend
Inventory Turnover Uptrend
Receivables Turnover Uptrend
FOREIGN EXCHANGE RATES
|
Currency |
Unit
|
Indian Rupees |
|
US Dollar |
1 |
Rs.61.85 |
|
|
1 |
Rs.93.27 |
|
Euro |
1 |
Rs.71.57 |
INFORMATION DETAILS
|
Analysis Done by
: |
KAR |
|
|
|
|
Report Prepared
by : |
NIT |
RATING EXPLANATIONS
|
RATING |
STATUS |
PROPOSED CREDIT LINE |
|
|
|
>86 |
Aaa |
Possesses an extremely sound financial base with the strongest capability
for timely payment of interest and principal sums |
Unlimited |
|
|
71-85 |
Aa |
Possesses adequate working capital. No caution needed for credit
transaction. It has above average (strong) capability for payment of interest
and principal sums |
Large |
|
|
56-70 |
A |
Financial & operational base are regarded healthy. General
unfavourable factors will not cause fatal effect. Satisfactory capability for
payment of interest and principal sums |
Fairly Large |
|
|
41-55 |
Ba |
Overall operation is considered normal. Capable to meet normal
commitments. |
Satisfactory |
|
|
26-40 |
B |
Capability to overcome financial difficulties seems comparatively
below average. |
Small |
|
|
11-25 |
Ca |
Adverse factors are apparent. Repayment of interest and principal sums
in default or expected to be in default upon maturity |
Limited with
full security |
|
|
<10 |
C |
Absolute credit risk exists. Caution needed to be exercised |
Credit not
recommended |
|
|
-- |
NB |
New Business |
-- |
|
This score serves as a reference to assess
SC’s credit risk and to set the amount of credit to be extended. It is
calculated from a composite of weighted scores obtained from each of the major sections
of this report. The assessed factors and their relative weights (as indicated
through %) are as follows:
Financial
condition (40%) Ownership
background (20%) Payment
record (10%)
Credit history
(10%) Market trend (10%) Operational size
(10%)
This report is issued at your request without any
risk and responsibility on the part of MIRA INFORM PRIVATE LIMITED (MIPL)
or its officials.