MIRA INFORM REPORT
|
Report No. : |
304941 |
|
Report Date : |
23.01.2015 |
IDENTIFICATION DETAILS
|
Name : |
ORFFA ADDITIVES B.V. |
|
|
|
|
Registered Office : |
Vierlinghstraat 51 4251LC Werkendam |
|
|
|
|
Country : |
Netherlands |
|
|
|
|
Financials (as on) : |
31.12.2013 |
|
|
|
|
Date of Incorporation : |
17.10.1980 |
|
|
|
|
Com. Reg. No.: |
KvK-nummer: 18129478 |
|
|
|
|
Legal Form : |
Private Company |
|
|
|
|
Line of Business : |
|
|
|
|
|
No. of Employee : |
Not Available |
RATING & COMMENTS
|
MIRA’s Rating : |
Ba |
|
RATING |
STATUS |
PROPOSED CREDIT LINE |
|
|
41-55 |
Ba |
Overall operation is considered normal. Capable to meet normal
commitments. |
Satisfactory |
|
Status : |
Satisfactory |
|
|
|
|
Payment Behaviour : |
No complaints |
|
|
|
|
Litigation : |
Clear |
NOTES :
Any query related to this report can be made on
e-mail : infodept@mirainform.com
while quoting report number, name and date.
ECGC Country Risk Classification List – September 30, 2014
|
Country Name |
Previous Rating (30.06.2014) |
Current Rating (30.09.2014) |
|
Netherlands |
A1 |
A1 |
|
Risk Category |
ECGC
Classification |
|
Insignificant |
A1 |
|
Low |
A2 |
|
Moderate |
B1 |
|
High |
B2 |
|
Very High |
C1 |
|
Restricted |
C2 |
|
Off-credit |
D |
NETHERLANDS ECONOMIC OVERVIEW
Netherlands is the sixth-largest economy in the euro-zone and is noted for its stable industrial relations, moderate unemployment and inflation, sizable trade surplus, and important role as a European transportation hub. Industrial activity is predominantly in food processing, chemicals, petroleum refining, and electrical machinery. A highly mechanized agricultural sector employs only 2% of the labor force but provides large surpluses for the food-processing industry and for exports. Netherlands, along with 11 of its EU partners, began circulating the euro currency on 1 January 2002. The Dutch financial sector suffered as a result of the global financial crisis, due in part to the high exposure of some Dutch banks to US mortgage-backed securities. In 2008, the government nationalized two banks and injected billions of dollars of capital into other financial institutions, to prevent further deterioration of a crucial sector. After 26 years of uninterrupted economic growth, the Dutch economy - highly dependent on an international financial sector and international trade - contracted by 3.5% in 2009. To recover, the government sought to boost the domestic economy by accelerating infrastructure programs, offering corporate tax breaks for employers to retain workers, and expanding export credit facilities. The stimulus programs and bank bailouts, however, resulted in a government budget deficit of 5.3% of GDP in 2010 that contrasted sharply with a surplus of 0.7% in 2008. The government of Prime Minister Mark RUTTE began implementing austerity measures in early 2011, mainly reducting expenditures, which resulted in an improved budget deficit in 2011. However, in 2012 tax revenues dropped, GDP contracted, and the budget deficit deteriorated. In 2013, the government budget deficit decreased to 3.3% of GDP due to increased government revenue from higher taxes. However, spending on social benefits also increased, due to a rise in unemployment benefits and payments for pensions. The high unemployment rate and tax increases have contributed to continued decreases in household disposable income, causing the Dutch economy to contract.
|
Source
: CIA |
Summary
|
Company name |
Orffa Additives B.V. |
|
Operative address |
Vierlinghstraat 51 |
|
|
4251LC Werkendam |
|
|
Netherlands |
|
Legal form |
Private Company |
|
Registration number |
KvK-nummer: 18129478 |
|
VAT-number |
005780937 |
|
Year |
2013 |
Mutation |
2012 |
Mutation |
2011 |
|
Fixed assets |
392.000 |
-82,21 |
2.204.000 |
-34,81 |
3.381.000 |
|
Total receivables |
24.835.000 |
-9,50 |
27.442.000 |
-7,64 |
29.711.000 |
|
Total equity |
12.986.000 |
-17,13 |
15.670.000 |
-9,64 |
17.342.000 |
|
Short term liabilities |
25.120.000 |
-6,47 |
26.858.000 |
-11,85 |
30.468.000 |
|
Net result |
2.787.000 |
-27,10 |
3.823.000 |
-24,49 |
5.063.000 |
|
Working capital |
12.954.000 |
-16,77 |
15.565.000 |
-10,16 |
17.326.000 |
|
Quick ratio |
1,07 |
-5,31 |
1,13 |
14,14 |
0,99 |
Contact
information
|
Company name |
Orffa Additives B.V. |
|
Trade names |
Orffa Additives B.V. |
|
Operative address |
Vierlinghstraat 51 |
|
|
4251LC Werkendam |
|
|
Netherlands |
|
Correspondence address |
Vierlinghstraat 51 |
|
|
4251LC Werkendam |
|
|
Netherlands |
|
Telephone number |
0183 447766 |
|
Fax number |
0183 441210 |
|
Email address |
info@orffa.net |
|
Website |
www.orffa.net |
Registration
|
Registration number |
KvK-nummer: 18129478 |
|
Registered in |
Kamer van Koophandel Brabant |
|
Branch number |
000018332919 |
|
VAT-number |
005780937 |
|
Status |
Active |
|
First registration company register |
1980-11-05 |
|
Memorandum |
1980-10-17 |
|
Establishment date |
1980-10-17 |
|
Legal form |
Private Company |
|
Last proposed admendment |
2005-12-23 |
|
Subscribed share capital |
EUR 225.000 |
|
Issued placed capital |
EUR 45.000 |
|
Paid up share capital |
EUR 45.000 |
Activities
|
SBI |
Manufacture of prepared feeds for farm animals (1091) |
|
|
Wholesale of seeds (46212) |
|
|
Wholesale of arable farming products and cattle feeds (46218) |
|
Exporter |
No |
|
Importer |
No |
|
Goal |
De import en export van, en de handel in grondstoffen voor de
veevoeder- en levens- |
|
|
middelenindustrie en de produktie van die grondstoffen, zulks voor
eigen rekening, alsmede |
|
|
het verlenen van bemiddeling bij de handel of produktie van genoemde
grondstoffen. |
Relations
|
Shareholders |
Orffa International Holding B.V. |
Vierlinghstraat
51
4251LC
WERKENDAM Netherlands
Registration
number: 181146900000 Percentage: 100%
|
Companies on
same address |
Orffa International Holding B.V. |
Registration
number: 181146900000
Orffa
Pharma B.V.
Registration
number: 181309560000
Stichting Administratiekantoor Aandelenbezit Orffa Holding B.V.
Registration number: 180840930000
Ketels Invest Nederland B.V.
Registration number: 180840850000
Excentials B.V.
Registration number: 172599360000
Olympus Holding B.V.
Registration number: 523876310000
Stichting Administratiekantoor Orffa
Registration number: 522221790000
|
Liability
statements |
Orffa International Holding B.V. |
Vierlinghstraat 51
4251LC WERKENDAM Netherlands
Registration number: 181146900000 date of issue: 1997-01-02
Starting date: 1997-01-01
Bank
details
|
Accounts |
MeesPierson NV |
Account number: 25.39.58.954
Management
Active management Orffa International Holding B.V.
Vierlinghstraat 51
4251LC WERKENDAM
Netherlands
Registration number: 181146900000
Competence: Fully authorized
Function: Manager
Starting date: 2011-04-22
Payments
Description Payments made under regular condition
Key
figures
|
Year |
2013 |
2012 |
2011 |
2010 |
2009 |
|
Quick ratio |
1,07 |
1,13 |
0,99 |
1,28 |
1,12 |
|
Current ratio |
1,52 |
1,58 |
1,57 |
1,68 |
1,53 |
|
Working capital/ balance total |
0,34 |
0,35 |
0,34 |
0,40 |
0,34 |
|
Equity / balance total |
0,34 |
0,35 |
0,34 |
0,40 |
0,36 |
|
Equity / Fixed assets |
33,13 |
7,11 |
5,13 |
51,24 |
13,77 |
|
Equity / liabilities |
0,52 |
0,55 |
0,52 |
0,68 |
0,57 |
|
Balance total / liabilities |
1,53 |
1,56 |
1,53 |
1,69 |
1,57 |
|
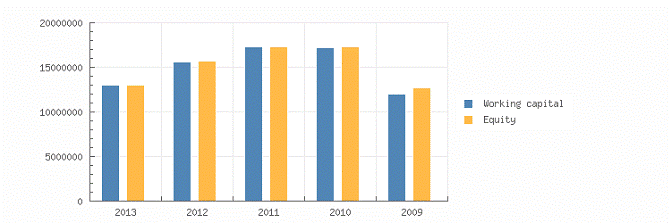
Working capital |
12.954.000 |
15.565.000 |
17.326.000 |
17.209.000 |
11.962.000 |
|
Equity |
12.986.000 |
15.670.000 |
17.342.000 |
17.268.000 |
12.726.000 |
|
Mutation equity |
-17,13 |
-9,64 |
0,43 |
35,69 |
27,34 |
|
Mutation short term liabilities |
-6,47 |
-11,85 |
20,57 |
12,41 |
-7,17 |
|
Return on total assets (ROA) |
9,72 |
11,43 |
13,27 |
13,16 |
11,48 |
|
Return on equity (ROE) |
28,79 |
32,54 |
39,15 |
32,64 |
31,90 |
|
Gross profit margin |
2,10 |
2,82 |
3,70 |
3,72 |
3,37 |
|
Net profit margin |
1,51 |
2,04 |
2,69 |
2,28 |
1,78 |
|
Average collection ratio |
7,35 |
6,99 |
6,17 |
7,64 |
6,82 |
|
Average payment ratio |
7,43 |
6,84 |
6,33 |
6,97 |
6,82 |
|
Equity turnover ratio |
14,21 |
11,98 |
10,84 |
11,18 |
12,06 |
|
Total assets turnover ratio |
4,80 |
4,21 |
3,67 |
4,51 |
4,34 |
|
Fixed assets turnover ratio |
470,78 |
85,16 |
55,62 |
572,63 |
166,03 |
|
Inventory conversion ratio |
16,59 |
15,71 |
10,70 |
19,08 |
16,48 |
|
Turnover |
184.546.000 |
187.699.000 |
188.059.000 |
192.975.000 |
153.414.000 |
|
Gross margin |
12.159.000 |
12.781.000 |
14.211.000 |
13.757.000 |
11.347.000 |
|
Operating result |
3.873.000 |
5.295.000 |
6.953.000 |
7.180.000 |
5.165.000 |
|
Net result after taxes |
2.787.000 |
3.823.000 |
5.063.000 |
4.397.000 |
2.734.000 |
|
Cashflow |
2.892.000 |
3.921.000 |
5.138.000 |
4.444.000 |
2.775.000 |
|
EBIT |
3.873.000 |
5.295.000 |
6.953.000 |
7.180.000 |
5.165.000 |
|
EBITDA |
3.978.000 |
5.393.000 |
7.028.000 |
7.227.000 |
5.206.000 |
Summary The 2013
financial result structure is a postive working captial of 12.954.000
euro, which is in agreement with 34 % of the total assets of the
company.
The
working capital has diminished with -16.77 % compared to previous year.
The ratio, with respect to the total assets of the company has however,
declined.
The
deterioration between 2012 and 2013 has mainly been caused by an increase
of the current liabilities.
The
current ratio of the company in 2013 was 1.52. A company with a current ratio between
1.5 and 3.0 generally indicates good short-term financial
strength.
The quick ratio in 2013 of
the company was 1.07. A company with a Quick Ratio of more than 1 can currently
pay back its current liabilities.
The 2012 financial result
structure is a postive working captial of 15.565.000 euro, which is in
agreement with 35 % of the total assets of the company.
The working capital has
diminished with -10.16 % compared to previous year. The ratio, with respect to
the total assets of the company has however, increased.
The deterioration between
2011 and 2012 has mainly been caused by a reduction of the current assets.
The current ratio of the
company in 2012 was 1.58. A company with a current ratio between 1.5 and 3.0
generally indicates good short-term financial strength.

Financial
statement
Last annual account 2013
Remark annual account The financial
statements shown in the report relate to the consolidated
financial statements of the group.
Type of annual account Consolidated
Annual account Orffa
International Holding B.V.
Vierlinghstraat
51
4251LC
WERKENDAM
Netherlands
Registration
number: 181146900000
BALANCE
|
Year |
2013 |
2012 |
2011 |
2010 |
2009 |
|
End date |
2013-12-31 |
2012-12-31 |
2011-12-31 |
2010-12-31 |
2009-12-31 |
|
Intangible fixed assets |
37.000 |
53.000 |
62.000 |
|
|
|
Tangible fixed assets |
332.000 |
380.000 |
298.000 |
298.000 |
261.000 |
|
Financial fixed assets |
23.000 |
1.771.000 |
3.021.000 |
39.000 |
663.000 |
|
Fixed assets |
392.000 |
2.204.000 |
3.381.000 |
337.000 |
924.000 |
|
Total stock |
11.127.000 |
11.951.000 |
17.571.000 |
10.115.000 |
9.311.000 |
|
Year |
2013 |
2012 |
2011 |
2010 |
2009 |
|
End date |
2013-12-31 |
2012-12-31 |
2011-12-31 |
2010-12-31 |
2009-12-31 |
|
Accounts receivable |
22.686.000 |
25.027.000 |
27.123.000 |
25.642.000 |
22.224.000 |
|
Other receivables |
2.149.000 |
2.415.000 |
2.588.000 |
2.042.000 |
279.000 |
|
Total receivables |
24.835.000 |
27.442.000 |
29.711.000 |
27.684.000 |
22.503.000 |
|
Liquid funds |
2.112.000 |
3.030.000 |
512.000 |
4.679.000 |
2.627.000 |
|
Current assets |
38.074.000 |
42.423.000 |
47.794.000 |
42.478.000 |
34.441.000 |
|
Total assets |
38.466.000 |
44.627.000 |
51.175.000 |
42.815.000 |
35.365.000 |
|
Minority interests |
350.000 |
337.000 |
305.000 |
226.000 |
160.000 |
|
Total equity |
12.986.000 |
15.670.000 |
17.342.000 |
17.268.000 |
12.726.000 |
|
Provisions |
10.000 |
12.000 |
10.000 |
2.000 |
|
|
Long term interest yielding debt |
|
1.750.000 |
3.050.000 |
50.000 |
|
|
Long term liabilities |
|
1.750.000 |
3.050.000 |
50.000 |
|
|
Accounts payable |
|
22.958.000 |
|
|
|
|
Other short term liabilities |
|
3.900.000 |
|
|
|
|
Short term liabilities |
25.120.000 |
26.858.000 |
30.468.000 |
25.269.000 |
22.479.000 |
|
Total short and long term liabilities |
25.130.000 |
28.620.000 |
33.528.000 |
25.321.000 |
22.479.000 |
|
Total liabilities |
38.466.000 |
44.627.000 |
51.175.000 |
42.815.000 |
35.365.000 |
Summary The total assets
of the company decreased with -13.81 % between 2012 and 2013.
This downturn is mainly retrievable in the fixed asset decrease of
-82.21 %. Assets reduction is explained by a Net Worth decrease of -17.13 %,
and an indebtedness reduction of -12.19 %.
In 2013 the assets of the company were 1.02 % composed of fixed assets
and 98.98 % by current assets. The assets are being financed by an equity of
33.76 %, and total debt of 66.24 %.
The total assets of the company decreased with -12.8 % between 2011 and
2012. This downturn is mainly retrievable in the fixed asset decrease of -34.81
%. Assets reduction is explained by a Net Worth decrease of -9.64 %, and an
indebtedness reduction of -14.64 %.
In 2012 the assets of the company were 4.94 % composed of fixed assets
and 95.06 % by current assets. The assets are being financed by an equity of
35.11 %, and total debt of 64.89 %.


Profit
and loss
|
Year |
2013 |
2012 |
2011 |
2010 |
2009 |
|
Revenues |
184.546.000 |
187.699.000 |
188.059.000 |
192.975.000 |
153.414.000 |
|
Net turnover |
184.546.000 |
187.699.000 |
188.059.000 |
192.975.000 |
153.414.000 |
|
Gross margin |
12.159.000 |
12.781.000 |
14.211.000 |
13.757.000 |
11.347.000 |
|
Wages and salaries |
4.886.000 |
4.521.000 |
4.334.000 |
4.121.000 |
3.595.000 |
|
Amorization and depreciation |
105.000 |
98.000 |
75.000 |
47.000 |
41.000 |
|
Sales |
172.387.000 |
174.918.000 |
173.848.000 |
179.218.000 |
142.067.000 |
|
other operating costs |
3.295.000 |
2.867.000 |
2.849.000 |
2.409.000 |
2.546.000 |
|
Operating expenses |
180.673.000 |
182.404.000 |
181.106.000 |
185.795.000 |
148.249.000 |
|
Result in subsidiaries |
|
|
|
-483.000 |
-949.000 |
|
Operating result |
3.873.000 |
5.295.000 |
6.953.000 |
7.180.000 |
5.165.000 |
|
Financial income |
60.000 |
127.000 |
155.000 |
14.000 |
37.000 |
|
Financial expenses |
194.000 |
323.000 |
318.000 |
1.075.000 |
193.000 |
|
Financial result |
-134.000 |
-196.000 |
-163.000 |
-1.061.000 |
-156.000 |
|
Result on ordinary operations before taxes |
3.739.000 |
5.099.000 |
6.790.000 |
5.636.000 |
4.060.000 |
|
Taxation on the result of ordinary activities |
924.000 |
1.236.000 |
1.687.000 |
1.228.000 |
1.306.000 |
|
Result of ordinary activities after taxes |
2.815.000 |
3.863.000 |
5.103.000 |
4.408.000 |
2.754.000 |
|
Net result |
2.787.000 |
3.823.000 |
5.063.000 |
4.397.000 |
2.734.000 |
|
Attributable to third parties |
28.000 |
40.000 |
40.000 |
11.000 |
20.000 |
Summary The turnover of the
company decreased by -1.68 % between 2012 and 2013.
The gross profit of the company decreased by -4.87 % between 2012 and
2013. The operating result of the company declined with -26.86 % between 2012
and 2013. This evolution implies an decrease of the company's economic
profitability. The result of these changes is a reduction of the company's
Economic Profitability of -14.96 % of the analysed period, being equal to 2012
% in the year 2013.
Despite the decline the assets turnover increased by 14.01 % reaching
4.8. The Net Result of the company increased by -27.1 % between 2012 and 2013.
The company's Financial Profitability has been positively affected by the
financial activities in comparison to the EBITs behaviour. The result of these
variations is a profitability increase of -11.52 % of the analysed period,
being 28.79 % in the year 2013.
The company's financial profitability has been positively affected by
its financial structure.
The turnover of the company remained the same between 2011 and 2012. The
gross profit of the company decreased by -10.06 % between 2011 and 2012.
The operating result of the company declined with -23.85 % between 2011
and 2012. This evolution implies an decrease of the company's economic
profitability. The result of these changes is a reduction of the company's
Economic Profitability of -13.87 % of the analysed period, being equal to 2011
% in the year 2012.
Despite the decline the assets turnover increased by 14.71 % reaching 4.21.
The Net Result of the company increased by -24.49 % between 2011 and 2012. The
company's Financial Profitability has been positively affected by the financial
activities in comparison to the EBITs behaviour. The result of these variations
is a profitability increase of -16.88 % of the analysed period, being 32.54 %
in the year 2012.
The company's financial profitability has been positively affected by
its financial structure.


Analysis
Branch (SBI) Manufacture
of food products (10)
Region Zuid-Holland
Oost
In the Netherlands 6059 of
the companies are registered with the SBI code 10
In the region Zuid-Holland
Oost 170 of the companies are registered with the SBI code 10
In the Netherlands 140 of
the bankrupcties are published within this sector
In the region Zuid-Holland
Oost 5 of the bankruptcies are published within this sector
The risk of this specific
sector in the Netherlands is normal
The risk of this specific sector in the region Zuid-Holland Oost is
normal
Publications
Consent statements 21-05-2014:
Voor boekjaar 2013 is een instemmingsverklaring gedeponeerd.
05-06-2013: Voor boekjaar
2012 is een instemmingsverklaring gedeponeerd.
19-04-2012: Voor boekjaar
2011 is een instemmingsverklaring gedeponeerd.
08-04-2011: Voor boekjaar 2010 is een
instemmingsverklaring gedeponeerd.
Functions 16-06-2011: Per 22-04-2011 is bestuurder 18114690 Orffa International Holding B.V. in functie getreden.
16-06-2011: Per 22-04-2011 is bestuurder 18084295 Orffa Holding B.V. uit functie getreden.
16-06-2011: Per 22-04-2011 is bestuurder Eddy Maria Alois Ketels uit functie getreden.
Company
structure
Olympus Holding
B.V.
Vierlinghstraat 51
4251LC WERKENDAM Netherlands
Registration number: 523876310000
• Orffa International Holding B.V.
Vierlinghstraat 51
4251LC WERKENDAM Netherlands
Registration number: 181146900000
• Orffa Additives B.V.
Vierlinghstraat 51
4251LC Werkendam Netherlands
Registration number: 181294780001
FOREIGN EXCHANGE RATES
|
Currency |
Unit
|
Indian Rupees |
|
US Dollar |
1 |
Rs.61.69 |
|
|
1 |
Rs.93.33 |
|
Euro |
1 |
Rs.71.49 |
INFORMATION DETAILS
|
Analysis Done by
: |
SUB |
|
|
|
|
Report Prepared
by : |
ANK |
RATING EXPLANATIONS
|
RATING |
STATUS |
PROPOSED CREDIT LINE |
|
|
>86 |
Aaa |
Possesses an extremely sound financial base with the strongest
capability for timely payment of interest and principal sums |
Unlimited |
|
71-85 |
Aa |
Possesses adequate working capital. No caution needed for credit transaction.
It has above average (strong) capability for payment of interest and
principal sums |
Large |
|
56-70 |
A |
Financial & operational base are regarded healthy. General
unfavourable factors will not cause fatal effect. Satisfactory capability for
payment of interest and principal sums |
Fairly Large |
|
41-55 |
Ba |
Overall operation is considered normal. Capable to meet normal
commitments. |
Satisfactory |
|
26-40 |
B |
Capability to overcome financial difficulties seems comparatively below
average. |
Small |
|
11-25 |
Ca |
Adverse factors are apparent. Repayment of interest and principal sums
in default or expected to be in default upon maturity |
Limited with
full security |
|
<10 |
C |
Absolute credit risk exists. Caution needed to be exercised |
Credit not
recommended |
|
-- |
NB |
New Business |
-- |
This score serves as a reference to assess SC’s
credit risk and to set the amount of credit to be extended. It is calculated
from a composite of weighted scores obtained from each of the major sections of
this report. The assessed factors and their relative weights (as indicated
through %) are as follows:
Financial
condition (40%) Ownership
background (20%) Payment
record (10%)
Credit history
(10%) Market trend (10%) Operational size
(10%)
This report is issued at your request without any
risk and responsibility on the part of MIRA INFORM PRIVATE LIMITED (MIPL) or
its officials.