MIRA INFORM REPORT
|
Report No. : |
305034 |
|
Report Date : |
29.01.2015 |
IDENTIFICATION DETAILS
|
Name : |
EPSON
[THAILAND] COMPANY LIMITED |
|
|
|
|
Formerly Known as : |
EPSON
ELECTRONICS [THAILAND] CO.,
LTD |
|
|
|
|
Registered Office : |
42nd Floor, Empire Tower, 1 South Sathorn Road, Yannawa, Sathorn, Bangkok 10120 |
|
|
|
|
Country : |
Thailand |
|
|
|
|
Financials (as on) : |
31.03.2014 |
|
|
|
|
Date of Incorporation : |
02.10.1990 |
|
|
|
|
Com. Reg. No.: |
0105533118402 |
|
|
|
|
Legal Form : |
Private Limited Company |
|
|
|
|
Line of Business : |
· engaged in importing and distributing various kinds of imaging and printing products, including consumer inkjet printers, scanners, business inkjet and laser printers, photographic large format printers, label printers, TM printers, multimedia projectors, POS receipt printers and electronic devices [quartz devices/semiconductors], as well as printing supplies: printing inks & printing papers . · subject also provides after sales service of the products. |
|
|
|
|
No of Employees : |
130 (Approximately) |
RATING & COMMENTS
|
MIRA’s Rating : |
Ba |
|
RATING |
STATUS |
PROPOSED CREDIT LINE |
|
|
41-55 |
Ba |
Overall operation is considered normal. Capable to meet normal
commitments. |
Satisfactory |
|
Status : |
Satisfactory |
|
Payment Behaviour : |
No Complaints |
|
Litigation : |
Clear |
NOTES :
Any query related to this report can be made on
e-mail : infodept@mirainform.com
while quoting report number, name and date.
ECGC Country Risk Classification List – September 30, 2014
|
Country Name |
Previous Rating (30.06.2014) |
Current Rating (30.09.2014) |
|
Thailand |
b1 |
b1 |
|
Risk Category |
ECGC
Classification |
|
Insignificant |
A1 |
|
Low |
A2 |
|
Moderate |
B1 |
|
High |
B2 |
|
Very High |
C1 |
|
Restricted |
C2 |
|
Off-credit |
D |
Thailand ECONOMIC OVERVIEW
With a well-developed infrastructure,
a free-enterprise economy, generally pro-investment policies, and strong export
industries, Thailand achieved steady growth due largely to industrial and
agriculture exports - mostly electronics, agricultural commodities, automobiles
and parts, and processed foods. Unemployment, at less than 1% of the labor
force, stands as one of the lowest levels in the world, which puts upward
pressure on wages in some industries. Thailand also attracts nearly 2.5 million
migrant workers from neighboring countries. The Thai government in 2013
implemented a nation-wide 300 baht ($10) per day minimum wage policy and
deployed new tax reforms designed to lower rates on middle-income earners. The
Thai economy has weathered internal and external economic shocks in recent
years. The global economic recession severely cut Thailand's exports, with most
sectors experiencing double-digit drops. In late 2011 Thailand's recovery was
interrupted by historic flooding in the industrial areas in Bangkok and its
five surrounding provinces, crippling the manufacturing sector. The government
approved flood mitigation projects worth $11.7 billion, which were started in
2012, to prevent similar economic damage, and an additional $75 billion for
infrastructure over the following seven years. This was expected to lead to an
economic upsurge but growth has remained slow, in part due to ongoing political
unrest and resulting uncertainties. Spending on infrastructure will require
re-approval once a new government is seated.
|
Source : CIA |
Company
name
EPSON [THAILAND]
COMPANY LIMITED
[FORMER : EPSON ELECTRONICS [THAILAND] CO., LTD.]
SUMMARY
BUSINESS
ADDRESS : 42nd FLOOR,
EMPIRE TOWER,
1 SOUTH
SATHORN ROAD, YANNAWA,
SATHORN,
BANGKOK 10120, THAILAND
TELEPHONE : [66] 2685-9888
FAX :
[66] 2670-0688
E-MAIL
ADDRESS : support@eth.epson.co.th
REGISTRATION
ADDRESS : SAME
AS BUSINESS ADDRESS
ESTABLISHED
: 1990
REGISTRATION
NO. : 0105533118402
TAX
ID NO. : 3101900552
CAPITAL REGISTERED : BHT. 250,000,000
CAPITAL PAID-UP : BHT.
103,000,000
SHAREHOLDER’S PROPORTION : FOREIGN
: 100%
FISCAL YEAR CLOSING DATE : MARCH 31
LEGAL
STATUS : PRIVATE LIMITED
COMPANY
EXECUTIVE : MR.
YUNYONG MUNEEMONGKOLTORN, THAI
GENERAL MANAGER 1
NO.
OF STAFF : 130
LINES
OF BUSINESS : IMAGING AND
PRINTING PRODUCTS
IMPORTER AND
DISTRIBUTOR
CORPORATE PROFILE
OPERATING
TREND : STABLE
PRESENT
SITUATION : OPERATING NORMALLY
REPUTATION : GOOD
WITH NORMAL BUSINESS
ENGAGEMENT
MANAGEMENT
STANDARD : MANAGEMENT WITH
GOOD PERFORMANCE
HISTORY
The subject
was established on
October 2, 1990 as
a private limited
company under the initially
registered name “Epson
Electronics [Thailand] Co., Ltd.” by
Singaporean groups. On
August 27, 1998, its
registered name was
changed to EPSON [THAILAND]
COMPANY LIMITED. Its
business objective is
to import and
distribute imaging and
printing products to
domestic market. It
currently employs approximately 130 staff.
The
subject is a
wholly owned subsidiary
of Epson Singapore
Pte. Ltd., in
Singapore, which is
a member of
Seiko Epson Corporation
of Japan, with
the objective to
promote sales and
marketing of Epson
products in Thailand
and the Indochina
sub region. The
subject is also
the sub-regional center
for Epson’s operations
in Vietnam, Myanmar,
Laos and Cambodia.
The
subject’s registered address
was initially at
42nd Floor, Empire
Tower, 195 South
Sathorn Rd., Yannawa, Sathorn,
Bangkok 10120.
In 2014,
the registered address
number was changed from “195 to “1” by
the Sathorn District Office, and
this is also
the subject’s current
operation address.
THE BOARD
OF DIRECTOR
|
Name |
|
Nationality |
Age |
|
|
|
|
|
|
Mr. Koichi Endo |
|
Japanese |
60 |
|
Mr. Hiroki Yamamoto |
|
Japanese |
59 |
|
Mr. Ryo tachimori |
|
Japanese |
35 |
AUTHORIZED PERSON
Anyone of the
above directors can
sign on behalf
of the subject
with company’s affixed.
MANAGEMENT
Mr. Yunyong Muneemongkoltorn is
the General Manager
I.
He is Thai
nationality.
Mr. Ananpol Nontapan
is the General
Manager II.
He is Thai
nationality.
Ms. Wisa Tanavipak
is the Marketing
Commercial Manager.
She is Thai
nationality.
BUSINESS
OPERATIONS
The subject
is engaged in
importing and distributing
various kinds of
imaging and printing
products, including consumer
inkjet printers, scanners,
business inkjet and
laser printers, photographic large format printers,
label printers, TM printers, multimedia
projectors, POS receipt
printers and electronic
devices [quartz
devices/semiconductors], as well
as printing supplies:
printing inks & printing papers
.
The subject
also provides after
sales service of
the products.
BRAND NAME
“EPSON”
PURCHASE
90% of the
products is imported
from Japan and
Singapore, the remaining
10% is purchased
from local suppliers.
MAJOR
SUPPLIERS
Epson
Singapore Pte. Ltd. :
Singapore
Seiko
Epson Corporation
: Japan
SALES
100% of the
products is sold
locally by wholesale
to dealers nationwide.
MAJOR CUSTOMERS
Nexttech Screen Supply
Co., Ltd.
Printer Service Co., Ltd.
Supreme Distribution [Thailand]
Co., Ltd.
SUBSIDIARY AND AFFILIATED
COMPANY
The subject is
not found to
have any subsidiary
or affiliated company
here in Thailand.
LITIGATION
Bankruptcy and
Receivership
There are no
litigation on bankruptcy
and receivership cases
filed against the
subject found at
Legal Execution Department for
the past five
years.
Others
There are no
legal suits filed
against the subject
for the past
two years.
CREDIT
Sales are by
cash or on
the credits term
of 30-60 days.
Local bills are
paid by cash
or on the
credits term of
30-60 days.
Imports are by
T/T.
BANKING
Bangkok
Bank Public Co.,
Ltd.
EMPLOYMENT
The
subject employs approximately
130 office, sales
staff and service
workers.
LOCATION
DETAILS
The
premise is rented
for administrative office
at the heading
address. Premise is
located in a
prime commercial area.
COMMENT
The
company is committed to providing the best imaging technologies and
products for its customers through a culture of constant innovation and
cooperation. Within Thailand, Epson
Thailand has an extensive network of
more than 200 authorized
partners, and operates 85 service centers and a solution centre to provide the
best possible support and service for its customers. Moreover, Epson Thailand
is the sub-regional
centre for Epson’s
operations in Vietnam, Myanmar,
Laos and Cambodia.
Despite
economic slowdown, the
company is able to
maintain solid business.
FINANCIAL
INFORMATION
The
capital was registered
at Bht. 10,000,000 divided
into 1,000,000 shares
of Bht. 10
each with fully
paid.
The
capital was increased
and decreased later
as follows:
Bht. 148,000,000 on November 23, 1999
[increased]
Bht. 41,000,000 on March 6, 2000
[decreased]
Bht. 250,000,000 on December 16, 2003
[increased]
The
latest registered capital
was increased to
Bht. 250 million divided into 25,000,000 shares
of Bht. 10 each,
with the current
capital paid-up at
Bht. 103,000,000 or
19,600,000 shares of
Bht. 2.50 each
and 5,400,000 shares
of Bht. 10
each.
THE
SHAREHOLDERS LISTED WERE
: [as at
July 31, 2014]
at Bht. 103,000,000
of capitalization.
|
NAME |
HOLDING |
% |
|
|
|
|
|
Epson Singapore Pte.
Ltd. Nationality: Singaporean Address : 1
Harbour Front Place,
#03-02
Harbour Front Tower
I, Singapore |
24,999,998 |
100.00 |
|
PT. Epson Indonesia Nationality: Indonesian Address : Jakarta,
Indonesia |
1 |
- |
|
Epson Philippines Corporation Nationality: Filipino Address : Pazik
City, Philippines |
1 |
- |
Total Shareholders : 3
Share Structure [as
at July 31,
2014]
|
Nationality |
Shareholders |
No. of Share |
% Shares |
|
|
|
|
|
|
Thai |
- |
- |
- |
|
Foreign |
3 |
25,000,000 |
100.00 |
|
Total |
3 |
25,000,000 |
100.00 |
NAME OF AUDITOR
& CERTIFIED PUBLIC
ACCOUNTANT NO. :
Mrs. Gingkarn Asawarangsarit No.
4496
BALANCE
SHEET [BAHT]
The latest financial figures published as at March 31, 2014, 2013 & 2012 were:
ASSETS
|
Current Assets |
2014 |
2013 |
2012 |
|
|
|
|
|
|
Cash and Cash Equivalents |
381,580,825 |
449,190,434 |
201,291,260 |
|
Trade Accounts and
Other Receivable |
337,667,916 |
314,794,706 |
293,147,494 |
|
Inventories |
278,856,899 |
296,564,253 |
332,652,043 |
|
Other Current Assets
|
11,352,899 |
11,967,081 |
13,090,421 |
|
|
|
|
|
|
Total Current Assets
|
1,009,458,539 |
1,072,516,474 |
840,181,218 |
|
Investment in Related Company |
32,348 |
- |
- |
|
Fixed Assets |
11,465,092 |
13,478,540 |
15,228,214 |
|
Intangible Assets |
2,460,380 |
2,328,432 |
1,641,831 |
|
Deferred Income Tax |
41,275,559 |
37,808,990 |
39,112,283 |
|
Other Non-current Assets |
4,028,898 |
4,148,898 |
5,203,076 |
|
Total Assets |
1,068,720,816 |
1,130,281,334 |
901,366,622 |
LIABILITIES &
SHAREHOLDERS’ EQUITY [BAHT]
|
Current Liabilities |
2014 |
2013 |
2012 |
|
|
|
|
|
|
Trade Accounts and
Other Payable |
420,042,898 |
587,300,645 |
430,393,107 |
|
Accrued Income Tax |
8,705,888 |
8,218,592 |
7,994,052 |
|
Provision for Warranty |
85,723,379 |
82,321,964 |
69,857,014 |
|
Other Current Liabilities |
36,273,682 |
11,450,814 |
1,461,263 |
|
|
|
|
|
|
Total Current Liabilities |
550,745,847 |
689,292,015 |
509,705,436 |
|
|
|
|
|
|
Reserve for Employee
Benefits |
32,604,225 |
27,665,447 |
22,238,609 |
|
Total Liabilities |
583,350,072 |
716,957,462 |
531,944,045 |
|
|
|
|
|
|
Shareholders' Equity |
|
|
|
|
|
|
|
|
|
Share capital : Baht 10
par value Authorized and
issued share capital 25,000,000 shares |
250,000,000 |
250,000,000 |
250,000,000 |
|
|
|
|
|
|
Capital Paid |
103,000,000 |
103,000,000 |
103,000,000 |
|
Retained Earnings: Appropriated for Statutory
Reserve |
4,919,445 |
4,919,445 |
4,919,445 |
|
Unappropriated |
377,451,299 |
305,404,427 |
261,503,132 |
|
Total Shareholders' Equity |
485,370,744 |
413,323,872 |
369,422,577 |
|
Total Liabilities &
Shareholders' Equity |
1,068,720,816 |
1,130,281,334 |
901,366,622 |
PROFIT &
LOSS ACCOUNT
|
Revenue |
2014 |
2013 |
2012 |
|
|
|
|
|
|
Sales Income |
3,006,312,073 |
3,086,254,465 |
2,638,519,031 |
|
Other Income |
2,521,398 |
2,767,245 |
1,493,763 |
|
Total Revenues |
3,008,833,471 |
3,089,021,710 |
2,640,012,794 |
|
Expenses |
|
|
|
|
|
|
|
|
|
Cost of Goods
Sold |
2,460,152,910 |
2,528,398,148 |
2,139,750,536 |
|
Selling Expenses |
401,082,153 |
409,327,521 |
387,757,299 |
|
Administrative Expenses |
61,738,431 |
89,528,529 |
69,173,471 |
|
Loss on Exchange Rate |
- |
- |
2,007,307 |
|
Total Expenses |
2,922,973,494 |
3,027,254,198 |
2,598,688,613 |
|
|
|
|
|
|
Profit before Income
Tax |
85,859,977 |
61,767,512 |
41,324,181 |
|
Income Tax |
[13,813,105] |
[17,866,217] |
[26,487,822] |
|
|
|
|
|
|
Net Profit / [Loss] |
72,046,872 |
43,901,295 |
14,836,359 |
FINANCIAL
ANALYSIS
|
ITEM |
UNIT |
2014 |
2013 |
2012 |
|
|
|
|
|
|
|
LIQUIDITY RATIO |
|
|
|
|
|
CURRENT RATIO |
TIMES |
1.83 |
1.56 |
1.65 |
|
QUICK RATIO |
TIMES |
1.31 |
1.11 |
0.97 |
|
|
|
|
|
|
|
ACTIVITY RATIO |
|
|
|
|
|
FIXED ASSETS TURNOVER |
TIMES |
262.21 |
228.98 |
173.27 |
|
TOTAL ASSETS TURNOVER |
TIMES |
2.81 |
2.73 |
2.93 |
|
INVENTORY CONVERSION PERIOD |
DAYS |
41.37 |
42.81 |
56.74 |
|
INVENTORY TURNOVER |
TIMES |
8.82 |
8.53 |
6.43 |
|
RECEIVABLES CONVERSION PERIOD |
DAYS |
41.00 |
37.23 |
40.55 |
|
RECEIVABLES TURNOVER |
TIMES |
8.90 |
9.80 |
9.00 |
|
PAYABLES CONVERSION PERIOD |
DAYS |
62.32 |
84.78 |
73.42 |
|
CASH CONVERSION CYCLE |
DAYS |
20.05 |
(4.74) |
23.88 |
|
|
|
|
|
|
|
PROFITABILITY
RATIO |
|
|
|
|
|
COST OF GOODS SOLD |
% |
81.83 |
81.92 |
81.10 |
|
SELLING & ADMINISTRATION |
% |
15.39 |
16.16 |
17.32 |
|
INTEREST |
% |
- |
- |
- |
|
GROSS PROFIT MARGIN |
% |
18.25 |
18.17 |
18.96 |
|
NET PROFIT MARGIN BEFORE EX. ITEM |
% |
2.86 |
2.00 |
1.57 |
|
NET PROFIT MARGIN |
% |
2.40 |
1.42 |
0.56 |
|
RETURN ON EQUITY |
% |
14.84 |
10.62 |
4.02 |
|
RETURN ON ASSET |
% |
6.74 |
3.88 |
1.65 |
|
EARNING PER SHARE |
BAHT |
6.99 |
4.26 |
1.44 |
|
|
|
|
|
|
|
LEVERAGE RATIO |
|
|
|
|
|
DEBT RATIO |
TIMES |
0.55 |
0.63 |
0.59 |
|
DEBT TO EQUITY RATIO |
TIMES |
1.20 |
1.73 |
1.44 |
|
TIME INTEREST EARNED |
TIMES |
- |
- |
- |
|
|
|
|
|
|
|
ANNUAL GROWTH |
|
|
|
|
|
SALES GROWTH |
% |
(2.59) |
16.97 |
|
|
OPERATING PROFIT |
% |
39.01 |
49.47 |
|
|
NET PROFIT |
% |
64.11 |
195.90 |
|
|
FIXED ASSETS |
% |
(14.94) |
(11.49) |
|
|
TOTAL ASSETS |
% |
(5.45) |
25.40 |
|
ANNUAL GROWTH :
ACCEPTABLE
An annual sales growth is -2.59%. Turnover has decreased from THB
3,086,254,465.00 in 2013 to THB 3,006,312,073.00 in 2014. While net profit has increased
from THB 43,901,295.00 in 2013 to THB 72,046,872.00 in 2014. And total assets
has decreased from THB 1,130,281,334.00 in 2013 to THB 1,068,720,816.00 in
2014.
PROFITABILITY :
IMPRESSIVE

PROFITABILITY
RATIO
|
Gross Profit Margin |
18.25 |
Acceptable |
Industrial Average |
29.61 |
|
Net Profit Margin |
2.40 |
Impressive |
Industrial Average |
1.40 |
|
Return on Assets |
6.74 |
Impressive |
Industrial Average |
5.31 |
|
Return on Equity |
14.84 |
Satisfactory |
Industrial Average |
19.56 |
Gross Profit Margin used to assess a firm's financial health by
revealing the proportion of money left over from revenues after accounting for the
cost of goods sold. Gross profit margin serves as the source for paying
additional expenses and future savings. The company's figure is 18.25%. When
compared with the industry average, the ratio of the company was lower. This
indicated that company may have problems with control over its costs.
Net Profit Margin is the indicator of the company's efficiency in that
net profit takes into consideration all expenses of the company. A low profit
margin indicates a low margin of safety, higher risk that a decline in sales
will erase profits and result in a net loss. The company's figure is 2.4%, higher figure when compared with those
of its average competitors in the same industry, indicated that business was an
efficient operator in a dominant
position within its industry.
Return on Assets measures how efficiently profits are being generated
from the assets employed in the business when compared with the ratios of firms
in a similar business. A low ratio in comparison with industry averages
indicates an inefficient use of business assets. Return on Assets ratio is
6.74%, higher figure when compared with those of its average competitors
in the same industry, indicated that business was an efficient profit in a dominant position within its industry.
Return on Equity indicates how profitable a company is by comparing its
net income to its average shareholders' equity, ROE measures how much the
shareholders earned for their investment in the company. When compared with the
industry average, it was lower, the company's figure is 14.84%.
Trend of the
average competitors in the same industry for last 5 years
Return on Assets Downtrend
Return on Equity Uptrend
LIQUIDITY :
IMPRESSIVE
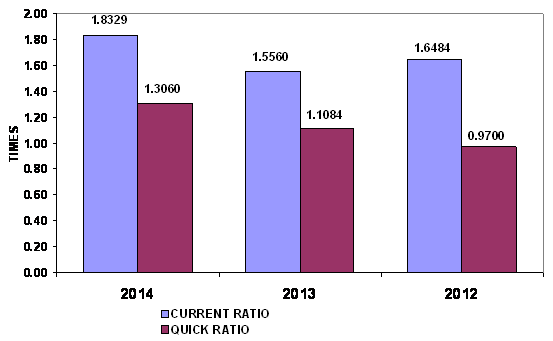
LIQUIDITY RATIO
|
Current Ratio |
1.83 |
Impressive |
Industrial Average |
1.53 |
|
Quick Ratio |
1.31 |
|
|
|
|
Cash Conversion Cycle |
20.05 |
|
|
|
The Current Ratio is to ascertain whether a company's short-term assets are
readily available to pay off its short-term liabilities. The company's figure
is 1.83 times in 2014, increased from 1.56 times, then it is generally
considered to have good short-term financial strength. When compared with the
industry average, the ratio of the company was higher, indicated that company
was an efficient operator in a dominant position within its industry.
The Quick Ratio is a liquidity indicator that further refines the
current ratio by measuring the amount of the most liquid current assets there
are to cover current liabilities. The company's figure is 1.31 times in 2014,
increased from 1.11 times, although excluding inventory so the company still
have good short-term financial strength.
The Cash Conversion Cycle measures the number of days a company's cash
is tied up in the production and sales process of its operations and the
benefit from payment terms from its creditors. It meant the company could
survive when no cash inflow was received from sale for 21 days.
Trend of the
average competitors in the same industry for last 5 years
Current Ratio Uptrend
LEVERAGE :
EXCELLENT
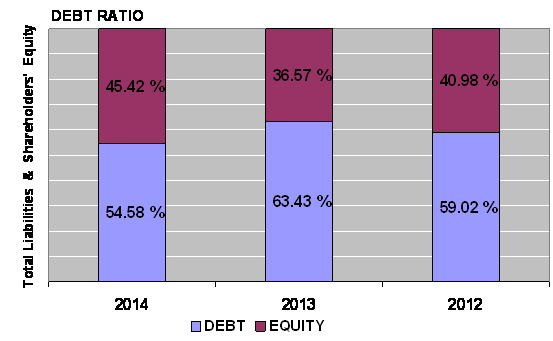
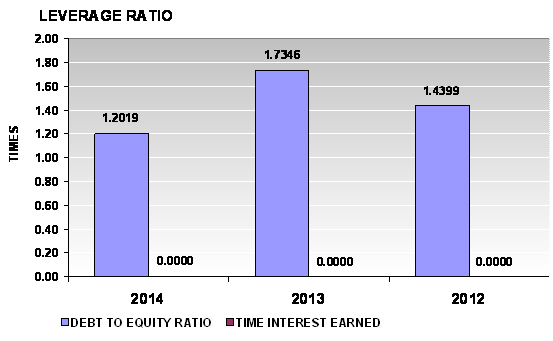
LEVERAGE RATIO
|
Debt Ratio |
0.55 |
Impressive |
Industrial Average |
0.75 |
|
Debt to Equity Ratio |
1.20 |
Impressive |
Industrial Average |
3.07 |
|
Times Interest Earned |
- |
|
Industrial Average |
- |
Debt to Equity Ratio a measurement of how much suppliers, lenders,
creditors and obligors have committed to the company versus what the
shareholders have committed. A higher the percentage means that the company is
using less equity and has stronger leverage position.
Debt Ratio shows the proportion of a company's assets which are financed
through debt. The company's figure is 0.55 greater than 0.5, most of the
company's assets are financed through debt.
Trend of the
average competitors in the same industry for last 5 years
Debt Ratio Uptrend
Times Interest Earned Stable
ACTIVITY :
SATISFACTORY

ACTIVITY RATIO
|
Fixed Assets Turnover |
262.21 |
Impressive |
Industrial Average |
- |
|
Total Assets Turnover |
2.81 |
Acceptable |
Industrial Average |
3.79 |
|
Inventory Conversion Period |
41.37 |
|
|
|
|
Inventory Turnover |
8.82 |
Acceptable |
Industrial Average |
14.74 |
|
Receivables Conversion Period |
41.00 |
|
|
|
|
Receivables Turnover |
8.90 |
Impressive |
Industrial Average |
7.27 |
|
Payables Conversion Period |
62.32 |
|
|
|
The company's Account Receivable Ratio is calculated as 8.90 and 9.80 in
2014 and 2013 respectively. This ratio measures the efficiency of the company
in managing its trade debtors to generate revenue. A lower ratio may indicate
over extension and collection problems. Conversely, a higher ratio may indicate
an overtly stringent policy. In this case, the company's A/R ratio in 2014
decreased from 2013. This would suggest the company had deteriorated in the
management of its debt collections.
Inventory Turnover in Days Ratio indicates the liquidity of inventory.
It estimates the number of days that it will take to sell the current
inventory. Inventory is particularly sensitive to change in business
activities. The inventory turnover in days has decreased from 43 days at the
end of 2013 to 41 days at the end of 2014. This represents a positive trend.
And Inventory turnover has increased from 8.53 times in year 2013 to 8.82 times
in year 2014.
The company's Total Asset Turnover is calculated as 2.81 times and 2.73
times in 2014 and 2013 respectively. This ratio is determined by dividing total
assets into total sales turnover. The ratio measures the activity of the assets
and the ability of the firm to generate sales through the use of the assets.
Trend of the
average competitors in the same industry for last 5 years
Fixed Assets Turnover Stable
Total Assets Turnover Uptrend
Inventory Turnover Uptrend
Receivables Turnover Uptrend
FOREIGN EXCHANGE RATES
|
Currency |
Unit
|
Indian Rupees |
|
US Dollar |
1 |
Rs.61.41 |
|
UK Pound |
1 |
Rs.93.18 |
|
Euro |
1 |
Rs.69.82 |
INFORMATION DETAILS
|
Analysis Done by
: |
RAS |
|
|
|
|
Report Prepared
by : |
MNL |
RATING EXPLANATIONS
|
RATING |
STATUS |
PROPOSED CREDIT LINE |
|
|
>86 |
Aaa |
Possesses an extremely sound financial base with the strongest
capability for timely payment of interest and principal sums |
Unlimited |
|
71-85 |
Aa |
Possesses adequate working capital. No caution needed for credit
transaction. It has above average (strong) capability for payment of interest
and principal sums |
Large |
|
56-70 |
A |
Financial & operational base are regarded healthy. General
unfavourable factors will not cause fatal effect. Satisfactory capability for
payment of interest and principal sums |
Fairly Large |
|
41-55 |
Ba |
Overall operation is considered normal. Capable to meet normal
commitments. |
Satisfactory |
|
26-40 |
B |
Capability to overcome financial difficulties seems comparatively
below average. |
Small |
|
11-25 |
Ca |
Adverse factors are apparent. Repayment of interest and principal sums
in default or expected to be in default upon maturity |
Limited with
full security |
|
<10 |
C |
Absolute credit risk exists. Caution needed to be exercised |
Credit not
recommended |
|
-- |
NB |
New Business |
-- |
This score serves as a reference to assess
SC’s credit risk and to set the amount of credit to be extended. It is calculated
from a composite of weighted scores obtained from each of the major sections of
this report. The assessed factors and their relative weights (as indicated
through %) are as follows:
Financial
condition (40%) Ownership
background (20%) Payment record
(10%)
Credit history
(10%) Market trend (10%) Operational size
(10%)
This report is issued at your request without any
risk and responsibility on the part of MIRA INFORM PRIVATE LIMITED (MIPL)
or its officials.