MIRA INFORM REPORT
|
Report No. : |
331247 |
|
Report Date : |
10.07.2015 |
IDENTIFICATION DETAILS
|
Name : |
RATHI STEEL AND POWER LIMITED (w.e.f.20.03.2008) |
|
|
|
|
Formerly Known
As : |
RATHI UDYOG LIMITED |
|
|
|
|
Registered
Office : |
Chauhan Market, Madanpur Khadar, Near Local Shopping Complex, Pocket D
and E, Sarita Vihar, New Delhi – 110076 |
|
Tel. No.: |
91-11-26991060 |
|
|
|
|
Country : |
|
|
|
|
|
Financials (as
on) : |
31.03.2014 |
|
|
|
|
Date of
Incorporation : |
17.12.1971 |
|
|
|
|
Com. Reg. No.: |
55-005905 |
|
|
|
|
Capital
Investment / Paid-up Capital : |
Rs.639.381 Million |
|
|
|
|
CIN No.: [Company Identification
No.] |
L27109DL1971PLC005905 |
|
|
|
|
IEC No.: |
0588033936 |
|
|
|
|
TAN No.: [Tax Deduction &
Collection Account No.] |
DELR08287G |
|
|
|
|
PAN No.: [Permanent Account No.] |
AAACR1435K |
|
|
|
|
Legal Form : |
A Public Limited Liability Company. The company’s Shares are Listed on
the Stock Exchanges. |
|
|
|
|
Line of Business
: |
Manufacturing and sale of Steel and Steel related products. |
|
|
|
|
No. of Employees
: |
Not Available |
RATING & COMMENTS
|
MIRA’s Rating : |
B (26) |
|
RATING |
STATUS |
PROPOSED CREDIT LINE |
|
|
26-40 |
B |
Capability to overcome financial difficulties seems comparatively
below average. |
Small |
|
Maximum Credit Limit : |
USD 1100000 |
|
|
|
|
Status : |
Moderate |
|
|
|
|
Payment Behaviour : |
Slow |
|
|
|
|
Litigation : |
Exist |
|
|
|
|
Comments : |
Subject is an established company having moderate track record. The rating is constrained on account of company’s moderate financial
risk profile marked by negative reserves and leverage balance sheet profile
of the company. However, trade relations are reported as fair. Business is active.
Payments are reported to be slow but correct. In view of leverage balance sheet profile, the company can be
considered for business dealing with some caution. |
NOTES:
Any query related to this report can be made
on e-mail: infodept@mirainform.com
while quoting report number, name and date.
ECGC Country Risk Classification List – March 31, 2015
|
Country Name |
Previous Rating (31.12.2014) |
Current Rating (31.03.2015) |
|
India |
A1 |
A1 |
|
Risk Category |
ECGC
Classification |
|
Insignificant |
A1 |
|
Low |
A2 |
|
Moderate |
B1 |
|
High |
B2 |
|
Very High |
C1 |
|
Restricted |
C2 |
|
Off-credit |
D |
EXTERNAL AGENCY RATING
Not Available
RBI DEFAULTERS’ LIST STATUS
Subject’s name is not enlisted as a defaulter
in the publicly available RBI Defaulters’ list.
EPF (Employee Provident Fund) DEFAULTERS’ LIST STATUS
Subject’s name is not enlisted as a defaulter
in the publicly available EPF (Employee Provident Fund) Defaulters’ list as of
31-03-2013.
LOCATIONS
|
Registered Office : |
Chauhan Market, Madanpur Khadar, Near Local Shopping Complex, Pocket D
and E, Sarita Vihar, New Delhi – 110076, India |
|
Tel. No.: |
91-11-26991060-62 |
|
Fax No.: |
91-11-26991063 |
|
E-Mail : |
|
|
Website : |
|
|
|
|
|
Corporate Office/
Factory 1 : |
Industrial Area No. 1, A-3, South of GT Road, Ghaziabad – 201009, Uttar Pradesh, India |
|
Tel. No.: |
91-120-2840346-350 |
|
Fax No.: |
91-120-2840352-353 |
|
|
|
|
Factory 2 : |
Village Potapalli, Sikirdi, P.S. Burla, District Sambalpur – 768006, Orissa, India |
|
Tel. No.: |
91-663-2541170/ 2230495 |
DIRECTORS
AS ON 31.03.2014
|
Name : |
Mr. Pradeep Kumar Rathi |
|
Designation : |
Director |
|
|
|
|
Name : |
Mr. Prem Narain Varshney |
|
Designation : |
Director |
|
|
|
|
Name : |
Mr. Shree Kumar Daga |
|
Designation : |
Director |
|
|
|
|
Name : |
Mr. Dwarka Das Lakhotia |
|
Designation : |
Director |
SHAREHOLDING PATTERN
AS ON 31.03.2015
|
Category of Shareholder |
No. of Shares |
Percentage
of Holding |
|
(A) Shareholding of Promoter and Promoter Group |
|
|
|
(A) Shareholding of Promoter and Promoter Group |
|
|
|
|
|
|
|
|
8245219 |
26.34 |
|
|
7867695 |
25.13 |
|
|
0 |
0.00 |
|
|
16112914 |
51.47 |
|
|
|
|
|
Total shareholding of Promoter and Promoter Group (A) |
16112914 |
51.47 |
|
(B) Public Shareholding |
|
|
|
|
|
|
|
|
686913 |
2.19 |
|
|
2177646 |
6.96 |
|
|
2864559 |
9.15 |
|
|
|
|
|
|
2078781 |
6.64 |
|
|
|
|
|
|
5726391 |
18.29 |
|
|
4044397 |
12.92 |
|
|
396311 |
1.27 |
|
|
84758 |
0.27 |
|
|
84758 |
0.27 |
|
|
12330638 |
39.38 |
|
Total Public shareholding (B) |
15195197 |
48.53 |
|
Total (A)+(B) |
31308111 |
100.00 |
|
(C) Shares held by Custodians and against which Depository
Receipts have been issued |
0 |
0.00 |
|
|
0 |
0.00 |
|
|
0 |
0.00 |
|
|
0 |
0.00 |
|
Total (A)+(B)+(C) |
31308111 |
0.00 |

BUSINESS DETAILS
|
Line of Business : |
Manufacturing and sale of Steel and Steel related products. |
|
|
|
|
Products : |
Steel and Steel related products |
|
|
|
|
Brand Names : |
Not Available |
|
|
|
|
Agencies Held : |
Not Available |
|
|
|
|
Exports : |
Not Available |
|
|
|
|
Imports : |
Not Available |
|
|
|
|
Terms : |
Not Available |
PRODUCTION STATUS – NOT AVAILABLE
GENERAL INFORMATION
|
Suppliers : |
|
|||||||||||||||||||||||||||||||||||||||
|
|
|
|||||||||||||||||||||||||||||||||||||||
|
Customers : |
|
|||||||||||||||||||||||||||||||||||||||
|
|
|
|||||||||||||||||||||||||||||||||||||||
|
No. of Employees : |
Not Available |
|||||||||||||||||||||||||||||||||||||||
|
|
|
|||||||||||||||||||||||||||||||||||||||
|
Bankers : |
|
|||||||||||||||||||||||||||||||||||||||
|
|
|
|||||||||||||||||||||||||||||||||||||||
|
Facilities : |
|
|
Auditors : |
|
|
Name : |
M. Lal and Company Chartered Accountants |
|
Address : |
III-A, 49 Nehru Nagar, Ghaziabad – 201001, Uttar Pradesh,
India |
|
Tel. No.: |
91-120-2717412/ 2722949 |
|
|
|
|
Collaborators : |
Not Divulged |
|
|
|
|
Membership : |
Not Divulged |
|
|
|
|
Associates/Subsidiaries : |
-- |
CAPITAL STRUCTURE
AS ON 31.03.2014
Authorised Capital :
|
No. of Shares |
Type |
Value |
Amount |
|
|
|
|
|
|
32000000 |
Equity Shares |
Rs. 10/- each |
Rs.320.000 Million |
|
33000000 |
Redeemable Preference Shares |
Rs. 10/- each |
Rs.330.000 Million |
|
|
|
|
|
|
|
Total |
|
Rs.650.000
Million |
Issued, Subscribed & Paid-up Capital :
|
No. of Shares |
Type |
Value |
Amount |
|
|
|
|
|
|
31308111 |
Equity Shares |
Rs. 10/- each |
Rs.313.081 Million |
|
32630000 |
Redeemable Preference Shares |
Rs. 10/- each |
Rs.326.300 Million |
|
|
|
|
|
|
|
Total |
|
Rs.639.381
Million |
Reconciliation of
the number of equity shares
|
Equity Shares |
Number
of Shares |
|
Shares Outstanding as at 1st April 2013/ 1st April 2012 |
31308111 |
|
Add: Issued during the year |
-- |
|
Shares Outstanding
as at 31st March 2014/ 31st March 2013 |
31308111 |
Reconciliation of
the number of Redeemable Preference shares
|
Preference Shares |
Number
of Shares |
|
Shares Outstanding as at 1st April 2013/ 1st April 2012 |
-- |
|
Add: Issued during the year |
32630000 |
|
Shares Outstanding
as at 31st March 2014/ 31st March 2013 |
32630000 |
List of shareholders holding
more than 5% of the total number of equity shares issued by the Company
|
Name of
Shareholders |
As at 31 March 2014 No. of Shares held |
|
|
|
|
Punam Chand Rathi (HUF) |
-- |
|
Archit Securities Private Limited |
4035223 (12.89%) |
|
DBG Leasina and Housing Limited |
3832472 (12.24%) |
|
Pradeep Kumar Rathi |
7504988 (23.97%) |
List of shareholders
holding more than 5% of the total number of equity shares issued by the Company
|
Name of
Shareholders |
As at 31 March 2014 No. of Shares held |
|
|
|
|
DBG Leasina and Housing Limited |
5850000 (17.93%) |
|
Archit Securities Private Limited |
15046000 (46.11%) |
|
Char Investment and Trading Limited |
6454000 (19.78%) |
|
Lenzing Poly Packs Limited |
2440000 (7.48%) |
The company has issued two class of shares
referred to as equity shares and redeemable preference shares. The equity
shares are having a par value of Rs.10 per share whereas par value for each
redeemable preference shares is Rs.10/-. Every holder of equity share is
entitled to one vote per share in respect of all matters submitted to vote in
the shareholders meeting. Redeemable preference shares are entitled to one vote
per share, in respect of every resolutions placed before the company which
directly affect the rights attached to the shares. In the event of liquidation
of the company, the holders of equity shares will be entitled to receive the
remaining assets of the company after distribution of preferential amounts, in
proportion of their shareholdings. The redeemable preference shares shall
become due for redemption after 10 years from the date of issue at a premium of
Rs.10/- each.
FINANCIAL DATA
[all figures are
in Rupees Million]
ABRIDGED
BALANCE SHEET
|
SOURCES OF FUNDS |
31.03.2014 |
31.03.2013 |
31.03.2012 |
|
I.
EQUITY
AND LIABILITIES |
|
|
|
|
(1)Shareholders' Funds |
|
|
|
|
(a) Share Capital |
639.381 |
313.081 |
313.081 |
|
(b) Reserves & Surplus |
(254.986) |
488.381 |
1588.863 |
|
(c) Money
received against share warrants |
0.000 |
0.000 |
0.000 |
|
|
|
|
|
|
(2) Share Application money pending
allotment |
0.000 |
0.000 |
0.000 |
|
Total
Shareholders’ Funds (1) + (2) |
384.395 |
801.462 |
1901.944 |
|
|
|
|
|
|
(3)
Non-Current Liabilities |
|
|
|
|
(a) long-term borrowings |
3956.829 |
1432.511 |
1916.009 |
|
(b) Deferred tax liabilities (Net) |
0.000 |
0.000 |
3.285 |
|
(c) Other long term
liabilities |
376.357 |
341.532 |
336.099 |
|
(d) long-term
provisions |
20.118 |
20.156 |
16.756 |
|
Total Non-current
Liabilities (3) |
4353.304 |
1794.199 |
2272.149 |
|
|
|
|
|
|
(4)
Current Liabilities |
|
|
|
|
(a) Short
term borrowings |
867.986 |
1734.406 |
1399.196 |
|
(b) Trade
payables |
99.102 |
806.653 |
716.083 |
|
(c) Other current
liabilities |
383.490 |
677.209 |
508.982 |
|
(d) Short-term
provisions |
3.388 |
3.563 |
2.290 |
|
Total Current
Liabilities (4) |
1353.966 |
3221.831 |
2626.551 |
|
|
|
|
|
|
TOTAL |
6091.665 |
5817.492 |
6800.644 |
|
|
|
|
|
|
II.
ASSETS |
|
|
|
|
(1)
Non-current assets |
|
|
|
|
(a) Fixed
Assets |
|
|
|
|
(i)
Tangible assets |
3191.085 |
3242.755 |
3378.886 |
|
(ii)
Intangible Assets |
0.000 |
0.000 |
0.000 |
|
(iii)
Capital work-in-progress |
74.469 |
85.711 |
85.254 |
|
(iv)
Intangible assets under development |
0.000 |
0.000 |
0.000 |
|
(b) Non-current Investments |
1.571 |
7.321 |
10.861 |
|
(c) Deferred tax assets (net) |
729.097 |
452.765 |
0.000 |
|
(d) Long-term Loan and Advances |
36.272 |
34.433 |
30.442 |
|
(e) Other Non-current
assets |
27.647 |
68.697 |
39.833 |
|
Total Non-Current
Assets |
4060.141 |
3891.682 |
3545.276 |
|
|
|
|
|
|
(2)
Current assets |
|
|
|
|
(a)
Current investments |
0.000 |
0.000 |
0.000 |
|
(b)
Inventories |
486.464 |
440.856 |
1398.399 |
|
(c) Trade
receivables |
1145.246 |
1223.135 |
1184.140 |
|
(d) Cash
and cash equivalents |
37.913 |
67.631 |
114.721 |
|
(e)
Short-term loans and advances |
353.475 |
177.338 |
541.899 |
|
(f) Other
current assets |
8.426 |
16.850 |
16.209 |
|
Total Current
Assets |
2031.524 |
1925.810 |
3255.368 |
|
|
|
|
|
|
TOTAL |
6091.665 |
5817.492 |
6800.644 |
PROFIT
& LOSS ACCOUNT
|
|
PARTICULARS |
31.03.2014 |
31.03.2013 |
31.03.2012 |
|
|
|
SALES |
|
|
|
|
|
|
|
Income |
4655.309 |
8084.318 |
9366.584 |
|
|
|
Other Income |
17.434 |
29.145 |
11.509 |
|
|
|
TOTAL (A) |
4672.743 |
8113.463 |
9378.093 |
|
|
|
|
|
|
|
|
Less |
EXPENSES |
|
|
|
|
|
|
|
Cost of Materials Consumed |
4635.980 |
7394.678 |
7669.947 |
|
|
|
Changes in inventories of finished goods, work-in-progress
and Stock-in-Trade |
(165.895) |
524.900 |
(139.390) |
|
|
|
Employees benefits expense |
62.798 |
118.505 |
130.225 |
|
|
|
Other expenses |
577.600 |
849.603 |
854.784 |
|
|
|
Exceptional Items |
0.001 |
0.000 |
(0.079) |
|
|
|
TOTAL (B) |
5110.484 |
8887.686 |
8515.487 |
|
|
|
|
|
|
|
|
|
PROFIT/(LOSS)
BEFORE INTEREST, TAX, DEPRECIATION AND AMORTISATION (A-B) (C) |
(437.741) |
(774.223) |
862.606 |
|
|
|
|
|
|
|
|
|
Less |
FINANCIAL
EXPENSES (D) |
492.789 |
561.706 |
535.306 |
|
|
|
|
|
|
|
|
|
|
PROFIT/(LOSS)
BEFORE TAX, DEPRECIATION AND AMORTISATION (C-D)
(E) |
(930.530) |
(1335.929) |
327.300 |
|
|
|
|
|
|
|
|
|
Less |
DEPRECIATION/
AMORTISATION (F) |
89.168 |
220.740 |
225.573 |
|
|
|
|
|
|
|
|
|
|
PROFIT/(LOSS)
BEFORE TAX (E-F) (G) |
(1019.698) |
(1556.669) |
101.727 |
|
|
|
|
|
|
|
|
|
Less |
TAX (H) |
(276.331) |
(456.186) |
(22.035) |
|
|
|
|
|
|
|
|
|
|
PROFIT/(LOSS)
AFTER TAX (G-H) (I) |
(743.367) |
(1100.483) |
123.762 |
|
|
|
|
|
|
|
|
|
|
Earnings /
(Loss) Per Share (Rs.) |
(23.74) |
(35.15) |
3.95 |
|
CURRENT MATURITIES OF LONG TERM DEBT DETAILS
|
Particulars |
31.03.2014 |
31.03.2013 |
31.03.2012 |
|
Current Maturities of Long term debt |
78.608 |
507.560 |
274.409 |
|
Cash generated from operations |
(1166.152) |
408.518 |
411.589 |
|
Net cash from operating activities |
(1166.152) |
408.652 |
391.589 |
QUARTERLY
RESULTS
|
Particulars |
30.06.2014 (Unaudited) |
30.09.2014 (Unaudited) |
31.12.2014 (Unaudited) |
|
|
1st
Quarter |
2nd
Quarter |
3rd
Quarter |
|
Net sales |
1017.800 |
1688.400 |
1994.170 |
|
Total Expenditure |
1027.330 |
1680.140 |
1963.300 |
|
PBIDT (Excluding Other Income) |
(9.530) |
8.260 |
30.870 |
|
Other income |
1.150 |
0.120 |
2.890 |
|
Operating Profit |
(8.3580) |
8.380 |
33.760 |
|
Interest |
125.160 |
139.780 |
156.430 |
|
Exceptional Items |
NA |
NA |
NA |
|
PBDT |
(133.540) |
(131.400) |
(122.670) |
|
Depreciation |
26.580 |
26.580 |
26.580 |
|
Profit Before Tax |
(160.120) |
(157.980) |
(149.250) |
|
Tax |
NA |
NA |
(152.010) |
|
Provisions and contingencies |
NA |
NA |
NA |
|
Profit after tax |
(160.120) |
(157.980) |
2.760 |
|
Extraordinary Items |
NA |
NA |
NA |
|
Prior Period Expenses |
NA |
NA |
NA |
|
Other Adjustments |
NA |
NA |
NA |
|
Net Profit |
(160.120) |
(157.980) |
2.760 |
KEY
RATIOS
|
PARTICULARS |
|
31.03.2014 |
31.03.2013 |
31.03.2012 |
|
Net Profit Margin PAT / Sales |
(%) |
(15.97) |
(13.61) |
1.32 |
|
|
|
|
|
|
|
Operating Profit Margin (PBDIT/Sales) |
(%) |
(9.40) |
(9.58) |
9.21 |
|
|
|
|
|
|
|
Return on Total Assets (PBT/Total Assets) |
(%) |
(19.29) |
(29.53) |
1.52 |
|
|
|
|
|
|
|
Return on Investment (ROI) (PBT/Networth) |
|
(2.65) |
(1.94) |
0.05 |
|
|
|
|
|
|
|
Debt Equity Ratio (Total Debt /Networth) |
|
12.76 |
4.58 |
1.89 |
|
|
|
|
|
|
|
Current Ratio (Current Asset/Current Liability) |
|
1.50 |
0.60 |
1.24 |
STOCK
PRICES
|
Face Value |
Rs.10.00/- |
|
Market Value |
Rs.3.60/- |
FINANCIAL ANALYSIS
[all figures are
in Rupees Million]
DEBT EQUITY RATIO
|
Particular |
31.03.2012 |
31.03.2013 |
31.03.2014 |
|
|
Rs.
In Million |
Rs.
In Million |
Rs.
In Million |
|
Share Capital |
313.081 |
313.081 |
639.381 |
|
Reserves & Surplus |
1588.863 |
488.381 |
(254.986) |
|
Net
worth |
1901.944 |
801.462 |
384.395 |
|
|
|
|
|
|
long-term borrowings |
1916.009 |
1432.511 |
3956.829 |
|
Short term borrowings |
1399.196 |
1734.406 |
867.986 |
|
Current Maturities of Long term debt |
274.409 |
507.560 |
78.608 |
|
Total
borrowings |
3589.614 |
3674.477 |
4903.423 |
|
Debt/Equity
ratio |
1.887 |
4.585 |
12.756 |

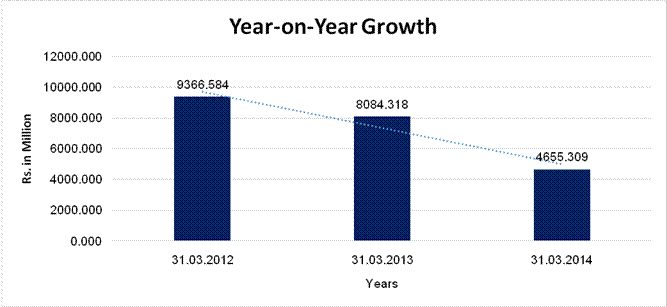
YEAR-ON-YEAR GROWTH
|
Year
on Year Growth |
31.03.2012 |
31.03.2013 |
31.03.2014 |
|
|
Rs.
In Million |
Rs.
In Million |
Rs.
In Million |
|
Sales |
9366.584 |
8084.318 |
4655.309 |
|
|
|
(13.690) |
(42.416) |
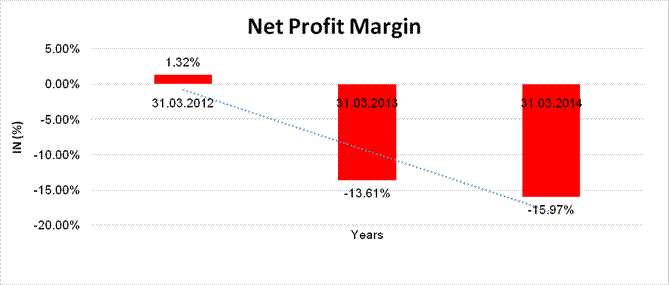
NET PROFIT MARGIN
|
Net
Profit Margin |
31.03.2012 |
31.03.2013 |
31.03.2014 |
|
|
Rs.
In Million |
Rs.
In Million |
Rs.
In Million |
|
Sales
|
9366.584 |
8084.318 |
4655.309 |
|
Profit |
123.762 |
(1100.483) |
(743.367) |
|
|
1.32% |
(13.61%) |
(15.97%) |
LOCAL AGENCY FURTHER INFORMATION
|
Sr. No. |
Check list by
info agents |
Available in
Report (Yes/No) |
|
1 |
Year of establishment |
Yes |
|
2 |
Constitution of the entity -Incorporation
details |
Yes |
|
3 |
Locality of the entity |
Yes |
|
4 |
Premises details |
No |
|
5 |
Buyer visit details |
-- |
|
6 |
Contact numbers |
Yes |
|
7 |
Name of the person contacted |
No |
|
8 |
Designation of contact person |
No |
|
9 |
Promoter’s background |
Yes |
|
10 |
Date of Birth of Proprietor / Partners /
Directors |
Yes |
|
11 |
Pan Card No. of Proprietor / Partners |
No |
|
12 |
Voter Id Card No. of Proprietor / Partners |
No |
|
13 |
Type of business |
Yes |
|
14 |
Line of Business |
Yes |
|
15 |
Export/import details (if applicable) |
No |
|
16 |
No. of employees |
No |
|
17 |
Details of sister concerns |
No |
|
18 |
Major suppliers |
No |
|
19 |
Major customers |
No |
|
20 |
Banking Details |
Yes |
|
21 |
Banking facility details |
Yes |
|
22 |
Conduct of the banking account |
-- |
|
23 |
Financials, if provided |
Yes |
|
24 |
Capital in the business |
Yes |
|
25 |
Last accounts filed at ROC, if applicable |
Yes |
|
26 |
Turnover of firm for last three years |
Yes |
|
27 |
Reasons for variation <> 20% |
-- |
|
28 |
Estimation for coming financial year |
No |
|
29 |
Profitability for last three years |
Yes |
|
30 |
Major shareholders, if available |
Yes |
|
31 |
External Agency Rating, if available |
No |
|
32 |
Litigations that the firm/promoter
involved in |
Yes |
|
33 |
Market information |
-- |
|
34 |
Payments terms |
No |
|
35 |
Negative Reporting by Auditors in the
Annual Report |
No |
PERFORMANCE REVIEW
The Gross sales for the financial year were Rs.4650.000 million as against Rs.808 Crore for the previous financial year. The operational performance of the Company has been comprehensively covered in the Management Discussion and Analysis report.
FUTURE OUTLOOK
Domestic steel demand to remain muted during FY2012–17 on account of a weak macroeconomic environment. The demand for longs is expected to increase by 19 million ton (MT) at a CAGR of 9 percent and for flats by 16 MT at a CAGR of 8 percent between FY2012 and FY2017. This is due to relatively weaker growth prospects of flats end-user industries (such as automotive and consumer durables) than those for longs.
The growth in the steel market is expected to be muted in the short term on account of poor growth in core consumer sectors such as infrastructure and construction. The demand is expected to rebound in the latter half of 2015 with growth in infrastructure as announced in the Twelfth Five-year Plan. Growth in the automobile and consumer durable sectors will also support demand growth in the long term.
The large steel players and new entrants have announced capacity addition of about 71 MTPA till 2017. Regulatory hurdles and land acquisition challenges remain the largest supply-side constraint for the Indian steel market. Mining bans in Karnataka and Goa and delays in the execution of announced capital projects can further constrain supplies.
With a stable Government in Centre and its thrust on infrastructure development, the company reasonably believes that the turbulent conditions during the year, which did not allow potential of the operations to be fully realized, will not be a lasting phenomenon.
MANAGEMENT DISCUSSION AND ANALYSIS
BUSINESS
REVIEW AND OUTLOOK:
Steel can be rightly termed the basic building block of modern society given its usage in almost every sphere --ranging from buildings, vehicles, machines or even a tin can that preserves food. The industry’s fortunes are dependent on the growth of its user industries, namely, automobiles, consumer durables and infrastructure. The volume of steel consumed has thus been the barometer for measuring development and economic progress.
Increasing modernization in the 21st century has led to a doubling of global steel production from 851 Mt (million tons) at the turn of the century to 1,607 Mt in 2013. The size notwithstanding, the industry remains relatively fragmented.
It is also highly cyclical and intensely competitive. In the past two years, the continuing Euro-zone problem, economic stagnation or slow growth in developed economies and a cooling of emerging economies took a toll on the industry. Growth in the Chinese economy, which in recent years has been one of the main demand drivers for steel, slowed down. Overcapacity has also been a perennial problem. Stiff competition in the United States from cheaper imports and from domestic producers with new or expanded facilities continues to result in significant oversupply of steel compared to demand.
However, as urban population increases worldwide, so will the need for steel to build skyscrapers and public-transport infrastructure. Emerging economies will also continue to be a major driver of demand due to the huge amount of steel required for urbanization and industrialization. The demand for steel is thus expected to remain strong in the years to come.
World crude steel production was 1,607 Mt in 2013, reflecting a 3.5% annual climb, led by increase in Asia and the Middle East that helped counter the declines elsewhere. China was once again the leading producer of steel, contributing a record 48.6% of the global output at 779 Mt, a 7.5% annual rise. Production in Japan, the second largest producer, increased 3% year over year to 111 Mt.
The United States held the third spot, producing 87 Mt of crude steel, which declined 2% annually. India commanded the fourth position with a production of 81 Mt, up 5% year over year. Production in Europe declined 1.8% year over year to 165.6 Mt of crude steel in 2013. Even though production in Europe declined in for the full year, the fourth quarter registered the first positive year-over-year movement since the fourth quarter of 2011.
The average capacity utilization ratio in 2013 was 78% compared with 76% in 2012. Despite the global rise in supply in 2013, total capacity utilization remained stubbornly below the 80% level throughout the year. Global steelmaking capacity will continue to exceed demand growth with excess capacity.
Backed by expected higher economic growth, the steel demand in India is all set to increase by 3 to 5 per cent in the next financial year although margin pressure would continue due to high production costs and limited scope to pass the same to the consumers.
Better GDP growth of 5.6 per cent in 2014-15 on the back of a revival in industry growth would lead to better steel demand growth next fiscal. It would be in the range of 3-5 per cent, but not above 5 per cent.
According to the India Ratings report, India’s steel consumption grew 0.5 per cent during the April-December period of this financial year to 53.78 million tonnes. However, the report maintained the negative outlook for the steel sector for the next financial year due to its weak credit profile.
India currently has about 95 million tonnes of installed steel capacity and 13-15 million tonnes is expected to be added within 2014-15. “Margins of steel producers would continue to be under pressure, given the high cost of production and their limited ability to pass on hikes in costs. The availability of iron ore should improve, limiting hike in costs. Coking coal prices will also range between $160-175 a tonne.
India Rating expects the credit profile of steel makers to remain weak next fiscal due to their large debt for working capital and capex coupled with modest EBITDA (earnings before interest, taxes, depreciation, and amortization) margins. Steel makers margins have consistently contracted since 2010-11.
OUTLOOK
The Company’s end products are stainless steel and MS re-bars. Re-bars find its application in construction sector. They foresee a reasonable growth in infrastructure and construction sector. As regards abnormal high cost of Iron ore, representations are being made to Government at various quarters through association of steel manufacturers etc. Stainless steel is finding innovative applications due to its corrosion resistive property. We see fairly good potential for stainless steel in the coming future. The Company is making efforts in the direction of increasing share of stainless steel products in its overall product mix which has better margins and growth potential.
LITIGATION DETAILS:
|
IN THE HIGH COURT OF DELHI AT
NEW DELHI |
INDEX OF CHARGE:
|
Sr. No. |
Charge ID |
Date of Charge
Creation/Modification |
Charge amount secured |
Charge Holder |
Address |
Service Request
Number (SRN) |
|
1 |
10475793 |
31/12/2013 |
188,500,000.00 |
CORPORATION BANK |
CORPORAT BANKING BRANCH, 10TH FLOOR, HINDUATAN TIMES HOUSE,18/20 K.G. MARG, NEW DELHI, DELHI - 110001, INDIA |
B95571881 |
|
2 |
10475775 |
31/12/2013 |
212,500,000.00 |
CORPORATION BANK |
CORPORAT BANKING BRANCH, 10TH FLOOR, HINDUATAN TIMES HOUSE,18/20 K.G. MARG, NEW DELHI, DELHI - 110001, INDIA |
B95560520 |
|
3 |
10387329 |
01/11/2012 |
350,000,000.00 |
CORPORATION BANK |
CORPORAT BANKING BRANCH, 10TH FLOOR, HINDUATAN TIMES HOUSE,18/20 K.G. MARG, NEW DELHI, DELHI - 110001, INDIA |
B62286612 |
|
4 |
10364648 |
15/06/2012 |
290,000,000.00 |
BANK OF BARODA |
188, GANDHI NAGAR,, GHAZIABAD, UTTAR PRADESH - 201001, INDIA |
B43255876 |
|
5 |
10364650 |
15/06/2012 |
290,000,000.00 |
BANK OF BARODA |
188, GANDHI NAGAR,, GHAZIABAD, UTTAR PRADESH - 201001, INDIA |
B43256064 |
|
6 |
10350727 |
27/03/2012 |
4,742,700,000.00 |
BANK OF BARODA |
CORPORATE FINANCIAL SERVICES BRANCH, PARLIAMENT STREET, NEW DELHI, DELHI - 110001, INDIA |
B37878808 |
|
7 |
10338154 |
31/01/2012 |
150,000,000.00 |
BANK OF BARODA |
188, GANDHI NAGAR, GHAZIABAD, UTTAR PRADESH - 201001, INDIA |
B33203183 |
|
8 |
10337740 |
24/01/2012 |
16,620,716.00 |
BAJAJ FINANCE LIMITED |
AKURDI PUNE-, PUNE, MAHARASHTRA - 411035, INDIA |
B33034919 |
|
9 |
10330302 |
21/12/2011 |
100,000,000.00 |
DENA BANK |
E-13/29 HARSHA BHAWAN, CONNAUGHT CIRCUS, NEW DELHI, DELHI - 110001, INDIA |
B30065114 |
|
10 |
10266081 |
30/06/2011 * |
300,000,000.00 |
THE KARUR VYSYA BANK LTD. |
882, EAST PARK ROAD, KAROL BAGH, NEW DELHI - 110005, INDIA |
B18254359 |
|
11 |
10247493 |
05/10/2010 |
1,630,000.00 |
SREI EQUIPMENT FINANCE PRIVATE LIMITED |
'VISHWAKARMA', 86C, TOPSIA ROAD,, KOLKATA, WEST BENGAL - 700046, INDIA |
A96845375 |
|
12 |
10242018 |
30/06/2011 * |
250,000,000.00 |
DENA BANK |
E-13/29, HARSHA BHAWAN,CONNAUGHT CIRCUS, NEW DELHI, DELHI - 110001, INDIA |
B18254078 |
|
13 |
10225241 |
30/06/2011 * |
100,000,000.00 |
BANK OF BARODA |
CORPORATE FINANCIAL SERVICES BRANCH, PARLIAMENT STREET, NEW DELHI, DELHI - 110001, INDIA |
B18253757 |
|
14 |
10225244 |
26/04/2010 |
150,000,000.00 |
BANK OF BARODA |
CORPORATE FINANCIAL SERVICES BRANCH, PARLIAMENT STREET, NEW DELHI, DELHI - 110001, INDIA |
A87843629 |
|
15 |
10134696 |
31/10/2008 |
100,000,000.00 |
BANK OF BARODA |
GANDHI NAGAR, GHAZIABAD, GHAZIABAD, UTTAR PRADESH - 201001, INDIA |
A53243952 |
|
16 |
10134706 |
31/10/2008 |
100,000,000.00 |
BANK OF BARODA |
GANDHI NAGAR, GHAZIABAD, UTTAR PRADESH - 201001, INDIA |
A53244265 |
|
17 |
10133753 |
30/10/2008 |
140,000,000.00 |
BANK OF BARODA |
CORPORATE FINANCIAL SERVICE BRANCH, 16 SANSAD MARG, NEW DELHI - 110001, INDIA |
A52396769 |
|
18 |
10133702 |
22/10/2008 |
140,000,000.00 |
BANK OF BARODA |
CORPORATE FINANCE SERVICE BRANCH, 16 SANSAD MARG, NEW DELHI - 110001, INDIA |
A52396892 |
|
19 |
10005437 |
30/06/2011 * |
350,000,000.00 |
CANARA BANK |
INDUSTRIAL FINANCE BRANCH, WORLD TRADE CENTRE, BARAKHAMBA LANE, NEW DELHI, DELHI - 110001, INDIA |
B18253427 |
|
20 |
10002575 |
30/06/2011 * |
340,000,000.00 |
SYNDICATE BANK |
CORPORATE FINANCE BRANCH, SAROJINI HOUSE,, 6, BHAGWAN DAS ROAD,, NEW DELHI, DELHI - 110001, INDIA |
B18253070 |
|
21 |
10005209 |
23/01/2007 * |
490,000,000.00 |
BANK OF BARODA |
CORPORATE FINANCIAL SERVICES BRANCH, PARLIAMENT STREET, NEW DELHI, DELHI - 110001, INDIA |
A00407429 |
|
22 |
80025392 |
30/06/2011 * |
577,700,000.00 |
STATE BANK OF INDIA |
COMMERCIAL BRANCH, A B ROAD, INDORE, MADHYA PRADESH - 452001, INDIA |
B18252775 |
|
23 |
80025393 |
30/06/2011 * |
830,000,000.00 |
BANK OF BARODA |
CORPORATE FINANCIAL SERVICES BRANCH, PARLIAMENT STREET, NEW DELHI, DELHI - 110001, INDIA |
B18252304 |
|
24 |
80025389 |
06/03/2014 * |
7,830,400,000.00 |
BANK OF BARODA |
CORPORATE FINANCIAL SERVICES BRANCH,, 16, PARLIAMENT STREET,, NEW DELHI, DELHI - 110001, INDIA |
C03308160 |
|
25 |
80025390 |
06/03/2014 * |
7,830,400,000.00 |
BANK OF BARODA |
CORPORATE FINANCIAL SERVICES BRANCH,, 16, PARLIAMENT STREET,, NEW DELHI, DELHI - 110001, INDIA |
C03307147 |
|
26 |
80025388 |
06/03/2014 * |
7,830,400,000.00 |
BANK OF BARODA |
CORPORATE FINANCIAL SERVICES BRANCH,, 16, PARLIAMENT STREET,, NEW DELHI, DELHI - 110001, INDIA |
C03307758 |
|
27 |
90048669 |
06/03/2014 * |
7,830,400,000.00 |
BANK OF BARODA |
CORPORATE FINANCIAL SERVICES BRANCH,, 16, PARLIAMENT STREET,, NEW DELHI, DELHI - 110001, INDIA |
C03308731 |
|
28 |
90061965 |
07/04/2000 |
650,000.00 |
BANK OF BARODA |
GANDHI NAGAR, GHAZIABAD, UTTAR PRADESH, INDIA |
- |
|
29 |
90060100 |
23/01/1992 |
15,500,000.00 |
PUNJAB NATIONAL BANK |
JANPATH, NEW DELHI, DELHI, INDIA |
- |
|
30 |
90059604 |
04/04/1987 |
3,100,000.00 |
THE PRADESHIYA INDUSTRIAL INVESTMENT CORPORATION U .P. LIMITE |
LUCKNOW, LUCKNOW, UTTAR PRADESH, INDIA |
- |
|
31 |
90059548 |
14/03/1991 * |
2,400,000.00 |
THE PRADESHIYA INDL. & INVESTMENT CORPORATION OF U P LTD. |
LUCKNOW, LUCKNOW, UTTAR PRADESH, INDIA |
- |
|
32 |
90059356 |
20/06/1978 |
560,000.00 |
THE NEW BANK OF INDIA LTD. |
TOLSTOY MARG, NEW DELHI, DELHI, INDIA |
- |
|
33 |
90059351 |
29/03/1978 |
210,000.00 |
UTTAR PRADESH FINANCIAL CORPORATION |
KANPUR, KANPUR, UTTAR PRADESH, INDIA |
- |
|
34 |
90059320 |
13/03/1974 |
2,000,000.00 |
BANK OF BARODA |
GHAZIABAD, UTTAR PRADESH, INDIA |
- |
|
35 |
90059317 |
01/12/1973 |
500,000.00 |
BANK OF BARODA |
GHAZIABAD, GHAZIABAD, UTTAR PRADESH, INDIA |
- |
|
36 |
90059314 |
03/08/1973 |
1,350,000.00 |
THE NEW BANK OF INDIA LTD. |
M-5,
HAUZ KHAS; MEHRAULI ROAD, NEW DELHI- |
- |
|
37 |
90059310 |
18/12/1972 |
500,000.00 |
BANK OF BARODA |
GHAZIABAD, GHAZIABAD, UTTAR PRADESH, INDIA |
- |
|
38 |
90059307 |
27/05/1972 |
2,000,000.00 |
UTTAR PRADESH FINANCIAL CORPORATION |
14/88, CIVIL LINES, KANPUR, UTTAR PRADESH, INDIA |
- |
*Date of modification Charges
FIXED ASSETS:
·
Land Freehold
·
Land Leasehold
·
Boundary Wall
·
Building
·
Plant and Machinery
·
Furniture and Fixtures
·
Office Equipment
·
Computers
·
Vehicles
CMT REPORT (Corruption, Money Laundering & Terrorism]
The Public Notice information has been collected from various sources
including but not limited to: The Courts,
1] INFORMATION ON
DESIGNATED PARTY
No exist designating subject or any of its beneficial owners,
controlling shareholders or senior officers as terrorist or terrorist
organization or whom notice had been received that all financial transactions
involving their assets have been blocked or convicted, found guilty or against
whom a judgement or order had been entered in a proceedings for violating
money-laundering, anti-corruption or bribery or international economic or
anti-terrorism sanction laws or whose assets were seized, blocked, frozen or
ordered forfeited for violation of money laundering or international
anti-terrorism laws.
2] Court Declaration :
No exist to suggest that subject is or was
the subject of any formal or informal allegations, prosecutions or other
official proceeding for making any prohibited payments or other improper
payments to government officials for engaging in prohibited transactions or
with designated parties.
3] Asset Declaration :
No records exist to suggest that the property or assets of the subject
are derived from criminal conduct or a prohibited transaction.
4] Record on Financial
Crime :
Charges or conviction
registered against subject: None
5] Records on Violation of
Anti-Corruption Laws :
Charges or
investigation registered against subject: None
6] Records on Int’l
Anti-Money Laundering Laws/Standards :
Charges or
investigation registered against subject: None
7] Criminal Records
No
available information exist that suggest that subject or any of its principals
have been formally charged or convicted by a competent governmental authority
for any financial crime or under any formal investigation by a competent
government authority for any violation of anti-corruption laws or international
anti-money laundering laws or standard.
8] Affiliation with
Government :
No record
exists to suggest that any director or indirect owners, controlling
shareholders, director, officer or employee of the company is a government
official or a family member or close business associate of a Government
official.
9] Compensation Package :
Our market
survey revealed that the amount of compensation sought by the subject is fair
and reasonable and comparable to compensation paid to others for similar
services.
10] Press Report :
No press reports / filings exists on
the subject.
CORPORATE GOVERNANCE
MIRA INFORM as part of its Due Diligence do provide comments on
Corporate Governance to identify management and governance. These factors often
have been predictive and in some cases have created vulnerabilities to credit
deterioration.
Our Governance Assessment focuses principally on the interactions
between a company’s management, its Board of Directors, Shareholders and other financial
stakeholders.
CONTRAVENTION
Subject is not known to have contravened any existing local laws,
regulations or policies that prohibit, restrict or otherwise affect the terms
and conditions that could be included in the agreement with the subject.
FOREIGN EXCHANGE RATES
|
Currency |
Unit
|
Indian Rupees |
|
US Dollar |
1 |
Rs.63.51 |
|
|
1 |
Rs.97.85 |
|
Euro |
1 |
Rs.70.50 |
INFORMATION DETAILS
|
Analysis Done by
: |
KAR |
|
|
|
|
Report Prepared
by : |
NKT |
SCORE & RATING EXPLANATIONS
|
SCORE FACTORS |
RANGE |
POINTS |
|
HISTORY |
1~10 |
3 |
|
PAID-UP CAPITAL |
1~10 |
3 |
|
OPERATING SCALE |
1~10 |
4 |
|
FINANCIAL
CONDITION |
|
|
|
--BUSINESS SCALE |
1~10 |
4 |
|
--PROFITABILITY |
1~10 |
-- |
|
--LIQUIDITY |
1~10 |
3 |
|
--LEVERAGE |
1~10 |
3 |
|
--RESERVES |
1~10 |
3 |
|
--CREDIT LINES |
1~10 |
3 |
|
--MARGINS |
-5~5 |
-- |
|
DEMERIT POINTS |
|
|
|
--BANK CHARGES |
YES/NO |
YES |
|
--LITIGATION |
YES/NO |
YES |
|
--OTHER ADVERSE INFORMATION |
YES/NO |
NO |
|
MERIT POINTS |
|
|
|
--SOLE DISTRIBUTORSHIP |
YES/NO |
NO |
|
--EXPORT ACTIVITIES |
YES/NO |
NO |
|
--AFFILIATION |
YES/NO |
NO |
|
--LISTED |
YES/NO |
YES |
|
--OTHER MERIT FACTORS |
YES/NO |
YES |
|
DEFAULTER
|
|
|
|
--RBI |
YES/NO |
NO |
|
--EPF |
YES/NO |
NO |
|
|
|
|
|
TOTAL |
|
26 |
This score serves as a reference to assess
SC’s credit risk and to set the amount of credit to be extended. It is
calculated from a composite of weighted scores obtained from each of the major
sections of this report. The assessed factors and their relative weights (as
indicated through %) are as follows:
Financial
condition (40%) Ownership
background (20%) Payment
record (10%)
Credit history
(10%) Market trend (10%) Operational size
(10%)
RATING EXPLANATIONS
|
RATING |
STATUS |
PROPOSED CREDIT LINE |
|
|
>86 |
Aaa |
Possesses an extremely sound financial base with the strongest
capability for timely payment of interest and principal sums |
Unlimited |
|
71-85 |
Aa |
Possesses adequate working capital. No caution needed for credit
transaction. It has above average (strong) capability for payment of interest
and principal sums |
Large |
|
56-70 |
A |
Financial & operational base are regarded healthy. General unfavourable
factors will not cause fatal effect. Satisfactory capability for payment of
interest and principal sums |
Fairly Large |
|
41-55 |
Ba |
Overall operation is considered normal. Capable to meet normal
commitments. |
Satisfactory |
|
26-40 |
B |
Capability to overcome financial difficulties seems comparatively
below average. |
Small |
|
11-25 |
Ca |
Adverse factors are apparent. Repayment of interest and principal sums
in default or expected to be in default upon maturity |
Limited with full
security |
|
<10 |
C |
Absolute credit risk exists. Caution needed to be exercised |
Credit not
recommended |
|
NB |
NEW BUSINESS |
||
This report is issued at your request without any
risk and responsibility on the part of MIRA INFORM PRIVATE LIMITED (MIPL) or
its officials.