MIRA INFORM REPORT
|
Report No. : |
331640 |
|
Report Date : |
15.07.2015 |
IDENTIFICATION DETAILS
|
Name : |
AGRIA JSC |
|
|
|
|
Registered Office : |
Ul. Asenovgradsko Shose 4004 Plovdiv |
|
|
|
|
Country : |
Bulgaria |
|
|
|
|
Financials (as on) : |
31.12.2014 |
|
|
|
|
Year of Establishment : |
1932 |
|
|
|
|
Legal Form : |
Joint Stock Company |
|
|
|
|
Line of Business : |
Manufacture of pesticides and
other agro-chemical products. |
|
|
|
|
No. of Employees : |
242 |
RATING & COMMENTS
|
MIRA’s Rating : |
Ba |
|
RATING |
STATUS |
PROPOSED CREDIT LINE |
|
|
41-55 |
Ba |
Overall operation is considered normal. Capable to meet normal
commitments. |
Satisfactory |
|
Status : |
Satisfactory |
|
|
|
|
Payment Behaviour : |
No Complaints |
|
|
|
|
Litigation : |
Clear |
NOTES:
Any query related to this report can be made on
e-mail: infodept@mirainform.com
while quoting report number, name and date.
ECGC Country Risk Classification List – March 31, 2015
|
Country Name |
Previous Rating (31.12.2014) |
Current Rating (31.03.2015) |
|
Bulgaria |
A2 |
A2 |
|
Risk Category |
ECGC
Classification |
|
Insignificant |
A1 |
|
Low |
A2 |
|
Moderate |
B1 |
|
High |
B2 |
|
Very High |
C1 |
|
Restricted |
C2 |
|
Off-credit |
D |
BULGARIA - ECONOMIC
OVERVIEW
Bulgaria, a former Communist country that entered the EU on 1 January 2007, averaged more than 6% annual growth from 2004 to 2008, driven by significant amounts of bank lending, consumption, and foreign direct investment. Successive governments have demonstrated a commitment to economic reforms and responsible fiscal planning, but the global downturn sharply reduced domestic demand, exports, capital inflows, and industrial production. GDP contracted by 5.5% in 2009, and has been slow to recover in the years since. Despite having a favorable investment regime, including low, flat corporate income taxes, significant challenges remain. Corruption in public administration, a weak judiciary, and the presence of organized crime continue to hamper the country's investment climate and economic prospects.
|
Source
: CIA |
COMPANY
DETAILS
Local
name: AGRIYA AD
International
name: AGRIA JSC
Registered
address:
ul. Asenovgradsko Shose
4004 Plovdiv
Bulgaria
Telephone: +359-32-638369, +359-32-273500
Fax: +359-32-638377
E-Mail: info@agria.bg
Internet: http://www.agria.bg
Branch
office:
Dimitar Manov No. 75-83
1408 Sofia
Bulgaria
Telephone: +359-2-9150500, +359-2-9150511
Fax: +359-2-9516506,
+359-2-9530525
E-Mail: info@agria.bg
ESTABLISHMENT
& REGISTRATION:
Established: 1932
Registered at Plovdiv town court
Court number 1463/1997
Bulstat/VAT number: 115006106
Status
of the company:
Active
HISTORY:
Established in 1932 as a private
chemical factory.
In 1947 it was nationalized.
In 1996 the company was
privatized.
On 03.01.2011 TEMPO EOOD (EIK
000443070) which was previously owned by AGRIYA merged into the
company.
LEGAL
FORM:
Joint Stock Company (AD)
REGISTERED
CAPITAL:
BGN 9 600 000.00
BANKERS:
Unicredit Bulbank AD
SHAREHOLDERS/MANAGEMENT
SHAREHOLDERS:
|
MMS-99 EOOD |
41.50% |
|
ID 130099320 |
|
|
Ambus EOOD |
21.42% |
|
ID 6301056942 |
|
|
TOPEKS 2 EOOD |
19.27% |
|
ID 175177147 |
|
|
DARZ EOOD |
12.41% |
|
ID 112659408 |
|
|
Others |
5.40% |
MANAGEMENT:
|
LAZAR IVANOV KOCHIEV |
(Personal ID 7508154528 ) |
- Representative, Member of the board |
|
PLAMEN AASENOV ALEXANDROV |
(Personal ID 6301056942) |
- Member of the board |
|
STEFAN IVANOV GRADINAROV |
(Personal ID 6102276327 ) |
- Member of the board |
|
NIKOLAY STEFANOV NEYCEV |
(Personal ID 6008176640 ) |
- Member of the supervisory board |
|
YORDAN STOYANOV KRASTANOV |
(Personal ID 6402133482 ) |
- Member of the supervisory board |
|
GEORGI IVANOV GELEV |
(Personal ID 6012236246 ) |
- Member of the supervisory board |
RELATED
COMPANIES:
|
Company
ID |
Company
Name |
|
CompanyID |
Company Name |
|
201147471 |
AGRIYA - EKSPORT IMPORT |
|
000443070 |
TEMPO |
|
831542505 |
TRAST KONTROL |
|
831043655 |
YUNIPEST KONTROL |
|
200845530 |
LUKROR |
|
200467123 |
STENI FESHAN |
|
175262124 |
INJEKTOSOND BALGARIYA |
|
175229697 |
GLIGI |
|
175207943 |
STENI |
|
175190828 |
KAMPO 2007 |
|
175147595 |
AMBUS |
|
131412070 |
NAPO |
|
131391530 |
KUATRO PROPARTIS |
|
131270920 |
TERATRAST |
|
124619841 |
ELNEZA |
|
040435487 |
FIS-FINANSI I SCHETOVODSTVO |
|
030233551 |
AGROTREYD |
|
020168226 |
TOPEKS |
BUSINESS
ACTIVITY
BUSINESS
OPERATION:
NACE 1.1: 24.20 Manufacture of
pesticides and other agro-chemical products
Activity:
Manufacture of pesticides and
other agro-chemical products.
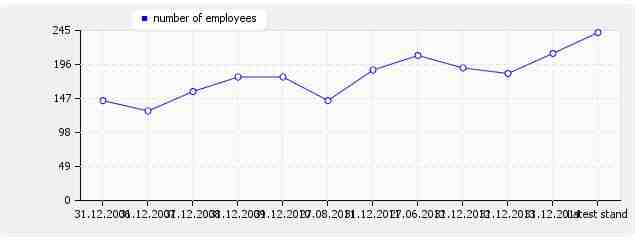
NUMBER
OF EMPLOYEES:
|
As
at date |
Value |
|
31.12.2006 |
144 |
|
31.12.2007 |
129 |
|
31.12.2008 |
157 |
|
31.12.2009 |
178 |
|
31.12.2010 |
178 |
|
27.08.2011 |
144 |
|
31.12.2011 |
188 |
|
27.06.2012 |
209 |
|
31.12.2012 |
191 |
|
31.12.2013 |
183 |
|
31.12.2014 |
212 |
|
Latest
stand |
242 |
EXPORT:
Bulgaria-free zone, Vietnam,
Mexico, Hungary, Singapore, Thailand, Jordan, Argentina, Canada
IMPORT:
Austria, Malaysia, Taiwan,
Sweden, USA, Romania
REAL
ESTATE:
Own plant:
Land 226.000 m2
23 production premises 244.660
m2
24 warehouse 8.314 m2
9 office premises 4.264 m2
30 other premises 11.154 m2
General
Comments:
Production and trade with plant
protection preparations and fertilizers. The company is the biggest producer in
the branch in Bulgaria.
FINANCIAL
DATA
TURNOVER:
|
Year |
Currency |
Value |
|
2002 |
BGN |
13
073 000.00 |
|
2003 |
BGN |
8
776 000.00 |
|
2004 |
BGN |
12
201 000.00 |
|
2005 |
BGN |
12
954 000.00 |
|
2006 |
BGN |
15
474 000.00 |
|
2007 |
BGN |
17
488 000.00 |
|
2008 |
BGN |
26
837 000.00 |
|
2009 |
BGN |
26
917 000.00 |
|
2010 |
BGN |
40
684 000.00 |
|
2011 |
BGN |
49
866 000.00 |
|
2012 |
BGN |
62
560 000.00 |
|
2013 |
BGN |
62
400 000.00 |
|
2014 |
BGN |
71
840 000.00 |

MODES
OF PAYMENT:
Payments are made within agreed
terms.
DEBT
COLLECTION:
No debt collection cases are
registered against the company.
BANK
DISTRAINTS:
No shares of the company are
under bank distraint.
UNPAID
TAXES/ CONTRIBUTIONS TO GOVERNMENT:
There is no publication about
overdue unpaid taxes.
INVOLVEMENT
IN LEGAL DISPUTES:
There is no publication about
legal claims or disputes against the company.
OTHER PAYMENT
INFORMATION:
No adverse payment information
is available.
BRANCH
INDICATOR:
The company's payment behaviour
is average for the branch.
GENERAL
PAYMENT ASSESSMENT:
Exchange rate since 1998 is 1
BGN (denominated lev) = 0.51 EUR
|
Ratio |
2011 |
2012 |
2013 |
2014 |
|
Accounting
period: |
1.1.2011
- |
1.1.2012
- |
1.1.2013
- |
1.1.2014
- |
|
Debt ratio |
0.39 |
0.35 |
0.35 |
0.43 |
|
Quick ratio |
0.84 |
0.98 |
0.74 |
0.75 |
|
Current ratio |
1.61 |
1.73 |
1.68 |
1.49 |
|
Days purchase in payables |
129.80 |
113.56 |
126.80 |
155.33 |
|
Operating margin in % |
9.25 |
9.77 |
2.36 |
3.91 |
|
Cash ratio (acid ratio) |
0.05 |
0.04 |
0.05 |
0.01 |
|
Return on sales ROS in % |
8.30 |
8.80 |
2.11 |
3.52 |
|
Return on assets ROA in % |
7.41 |
8.40 |
1.83 |
3.21 |
|
Return on equity ROE in % |
12.11 |
13.61 |
3.01 |
6.00 |
|
Days supply in inventory |
99.50 |
85.64 |
119.69 |
113.98 |
|
Days sales in receivables |
103.14 |
106.13 |
87.42 |
115.87 |
|
BALANCE SHEET in BGN'000 |
2011 |
2012 |
2013 |
2014 |
|
Accounting
period: |
1.1.2011
- |
1.1.2012
- |
1.1.2013
- |
1.1.2014
- |
|
A.UNPAID CAPITAL |
|
|
|
|
|
B. FIXED ASSETS |
|
|
|
|
|
I Fixed Intangible Assets: |
|
|
|
|
|
R&D Products |
|
|
|
|
|
Concessions, patents, trade-marks |
3 |
454 |
321 |
|
|
Goodwill |
|
|
|
|
|
Intangible fixed assets under construction |
|
|
|
|
|
thereof advances |
|
|
|
|
|
Total I: |
1 |
3 |
454 |
321 |
|
II Fixed Tangible Assets |
|
|
|
|
|
Land and Buildings |
13651 |
13984 |
14777 |
|
|
thereof Land |
7870 |
7870 |
7870 |
|
|
thereof Buildings |
5781 |
6114 |
6907 |
|
|
Machines, Vehicles |
5985 |
6439 |
6547 |
|
|
Equipment |
6661 |
6859 |
7294 |
|
|
Tangible fixed assets under construction |
2478 |
2136 |
1695 |
|
|
thereof advances |
|
|
|
|
|
Total II |
26920 |
28775 |
29418 |
30313 |
|
III. Fixed Financial Assets |
|
|
|
|
|
Shares in group companies |
1013 |
1013 |
1012 |
|
|
Loans granted to group companies |
12 |
|
|
|
|
Shares in joint ventures |
|
|
|
|
|
Long term investments |
|
|
|
|
|
Other loans |
|
|
|
|
|
Bought back own shares |
|
|
|
|
|
Total III |
19 |
1025 |
1013 |
1012 |
|
IV. Deferred Taxes |
|
|
|
|
|
B. FIXED ASSETS TOTAL |
26940 |
29803 |
30885 |
31646 |
|
C. CURRENT ASSETS |
|
|
|
|
|
I. Inventories |
|
|
|
|
|
Raw Materials |
5622 |
3773 |
5004 |
|
|
Work in progress |
|
|
|
|
|
thereof young animals |
|
|
|
|
|
Trading goods |
8495 |
13385 |
17111 |
|
|
thereof production |
2249 |
7642 |
5975 |
|
|
thereof goods for sale |
6246 |
5743 |
11136 |
|
|
Advances |
7 |
1085 |
|
|
|
Total I |
13783 |
14124 |
18243 |
22115 |
|
II. Receivables |
|
|
|
|
|
Receivables from customers |
14705 |
11022 |
20485 |
|
|
thereof more than 1 year |
|
|
|
|
|
Receivables from group companies |
685 |
1074 |
42 |
|
|
thereof more than 1 year |
|
|
|
|
|
Receivables from joint ventures |
992 |
500 |
805 |
|
|
thereof more than 1 year |
|
|
|
|
|
Other receivables |
1121 |
729 |
1149 |
|
|
thereof more than 1 year |
|
|
|
|
|
Total II |
14287 |
17503 |
13325 |
22481 |
|
III. Current Financial Assets |
|
|
|
|
|
Current investments in related companies |
|
|
|
|
|
Bought back own shares |
|
|
|
|
|
Other current financial assets |
|
|
|
|
|
Total III |
|
|
|
|
|
IV. Cash equivalents |
|
|
|
|
|
Cash and accounts in the country |
761 |
959 |
190 |
|
|
thereof cash |
22 |
29 |
15 |
|
|
Thereof cash in foreign currency (equivalent) |
|
|
|
|
|
thereof current accounts |
739 |
930 |
175 |
|
|
thereof blocked accounts |
|
|
|
|
|
thereof cash equivalents |
|
|
|
|
|
Cash and accounts abroad |
|
|
|
|
|
thereof cash |
|
|
|
|
|
Thereof cash in foreign currency (equivalent) |
|
|
|
|
|
thereof current accounts |
|
|
|
|
|
thereof blocked accounts |
|
|
|
|
|
Total IV |
880 |
761 |
959 |
190 |
|
C. CURRENT ASSETS TOTAL |
28950 |
32388 |
32527 |
44786 |
|
D. Deferred expenses |
|
|
|
|
|
TOTAL ASSETS |
55890 |
62191 |
63412 |
76432 |
|
A. OWNERS EQUITY |
|
|
|
|
|
I. Share capital |
9600 |
9600 |
9600 |
9600 |
|
II. Issue premium |
|
|
|
|
|
III. Revaluation reserves |
|
|
|
|
|
thereof revaluation reserves of financial instruments |
|
|
|
|
|
IV. Reserves |
|
|
|
|
|
legal reserves |
|
|
|
|
|
reserve related to bought back own shares |
|
|
|
|
|
reserve from company foundation |
1163 |
1685 |
1800 |
|
|
other reserves |
|
|
|
|
|
Total IV |
749 |
1163 |
1685 |
1800 |
|
V. Result from previous period |
|
|
|
|
|
Undistributed profit |
27840 |
31519 |
32549 |
|
|
Uncovered loss |
-5465 |
-5465 |
-5465 |
|
|
Total V |
19694 |
22375 |
26054 |
27084 |
|
VI. Current result profit (loss) |
4141 |
5222 |
1158 |
2456 |
|
A. OWNERS EQUITY TOTAL |
34184 |
38360 |
38497 |
40940 |
|
B. PROVISIONS |
|
|
|
|
|
Provisions for pensions |
93 |
114 |
120 |
|
|
Provisions for taxes |
1450 |
1435 |
1430 |
|
|
thereof deferred taxes |
1450 |
1435 |
1430 |
|
|
Other provisions |
|
|
|
|
|
B. PROVISIONS TOTAL |
1543 |
1549 |
1550 |
|
|
C. LIABILITIES |
|
|
|
|
|
Bond-backed loans |
|
|
|
|
|
less than 1 year |
|
|
|
|
|
more than 1 year |
|
|
|
|
|
Bank loans |
8878 |
9804 |
17975 |
|
|
less than 1 year |
6052 |
7693 |
15852 |
|
|
more than 1 year |
2826 |
2111 |
2123 |
|
|
Advances received |
296 |
383 |
331 |
|
|
less than 1 year |
296 |
34 |
19 |
|
|
more than 1 year |
|
349 |
312 |
|
|
Payables to suppliers |
10528 |
9855 |
13351 |
|
|
less than 1 year |
10528 |
9855 |
13351 |
|
|
more than 1 year |
|
|
|
|
|
Liabilities on policies |
|
|
|
|
|
less than 1 year |
|
|
|
|
|
more than 1 year |
|
|
|
|
|
Liabilities to group companies |
1139 |
912 |
190 |
|
|
less than 1 year |
1139 |
912 |
190 |
|
|
more than 1 year |
|
|
|
|
|
Liabilities to joint-venture companies |
192 |
|
9 |
|
|
less than 1 year |
192 |
|
9 |
|
|
more than 1 year |
|
|
|
|
|
Other liabilities |
542 |
981 |
809 |
|
|
less than 1 year |
521 |
833 |
716 |
|
|
more than 1 year |
21 |
148 |
93 |
|
|
thereof to personnel |
214 |
318 |
273 |
|
|
less than 1 year |
214 |
318 |
273 |
|
|
more than 1 year |
|
|
|
|
|
thereof to social insurance |
78 |
99 |
120 |
|
|
less than 1 year |
78 |
99 |
120 |
|
|
more than 1 year |
|
|
|
|
|
thereof for taxes |
102 |
84 |
126 |
|
|
less than 1 year |
102 |
84 |
126 |
|
|
more than 1 year |
|
|
|
|
|
C. LIABILITIES TOTAL |
21706 |
21575 |
21935 |
32665 |
|
less than 1 year |
17980 |
18728 |
19327 |
30137 |
|
more than 1 year |
3726 |
2847 |
2608 |
2528 |
|
D. FINANCING AND DEFERRED INCOME |
713 |
1431 |
1277 |
|
|
thereof |
|
|
|
|
|
Financing |
713 |
1431 |
155 |
|
|
Deferred income |
|
|
1122 |
|
|
TOTAL EQUITY AND LIABILITIES |
55890 |
62191 |
63412 |
76432 |
|
P&L ACCOUNT in BGN'000 |
2011 |
2012 |
2013 |
2014 |
|
Accounting
period: |
1.1.2011
- |
1.1.2012
- |
1.1.2013
- |
1.1.2014
- |
|
A. EXPENSES |
|
|
|
|
|
I. OPERATION EXPENSES |
|
|
|
|
|
Decrease of inventories |
1681 |
|
1361 |
|
|
thereof for materials |
20447 |
24545 |
25030 |
|
|
thereof for services |
9283 |
11116 |
12242 |
|
|
Personnel expenses |
3378 |
3623 |
4300 |
|
|
thereof wages |
2741 |
2910 |
3600 |
|
|
thereof social insurance |
500 |
577 |
557 |
|
|
thereof pensions |
262 |
275 |
323 |
|
|
Depreciation |
1632 |
1764 |
1987 |
|
|
thereof Depreciation of fixed assets |
1582 |
1763 |
1987 |
|
|
Other expenses |
19916 |
19598 |
22145 |
|
|
thereof Book value of sold assets (without production) |
19010 |
18633 |
21003 |
|
|
I. OPERATION EXPENSES TOTAL |
44765 |
56337 |
60646 |
67065 |
|
II. Financial expenditures |
|
|
|
|
|
Depreciation of financial assets |
1362 |
1099 |
2218 |
|
|
thereof exchange rate losses |
1362 |
1099 |
2218 |
|
|
Paid interest |
596 |
820 |
1097 |
|
|
thereof interest to group companies |
|
|
|
|
|
Thereof expenditures for securities operations |
|
|
|
|
|
II. Financial expenditures Total |
651 |
1958 |
1919 |
3315 |
|
B. Profit on ordinary activity |
4612 |
5802 |
1295 |
2734 |
|
III. Extraordinary expenses |
|
|
|
|
|
thereof expenses on disasters and emergency expenses |
|
|
|
|
|
C. Total expenses (I+II+III) |
45416 |
58295 |
62565 |
70380 |
|
D. Accounting profit |
4612 |
5802 |
1295 |
2734 |
|
IV. Taxation on profit |
471 |
580 |
137 |
278 |
|
V. Other taxes |
|
|
|
|
|
E. Net profit |
4141 |
5222 |
1158 |
2456 |
|
Total expenses |
64097 |
63860 |
73114 |
|
|
A. REVENUES |
|
|
|
|
|
I . OPERATING REVENUES |
|
|
|
|
|
Net sales |
49866 |
59369 |
54872 |
69847 |
|
Production |
35384 |
32966 |
43447 |
|
|
Goods |
23886 |
21763 |
26275 |
|
|
Services |
99 |
143 |
125 |
|
|
Increase of production and work in progress |
|
5627 |
|
|
|
Expenses on acquisition of assets |
3038 |
1416 |
1581 |
|
|
Other revenues |
153 |
485 |
412 |
|
|
thereof financing |
34 |
87 |
155 |
|
|
I. TOTAL OPERATING REVENUES |
49866 |
62560 |
62400 |
71840 |
|
II FINANCIAL REVENUES |
|
|
|
|
|
Income from shares |
|
|
|
|
|
thereof income from shares in group companies |
|
|
|
|
|
Income from investments and loans |
|
|
|
|
|
thereof from investments in group companies |
|
|
|
|
|
Income from interest |
1537 |
1460 |
1274 |
|
|
thereof from interest from group companies |
|
|
|
|
|
II FINANCIAL REVENUES TOTAL |
162 |
1537 |
1460 |
1274 |
|
TOTAL REVENUES FROM ORDINARY ACTIVITIES |
50028 |
64097 |
63860 |
73114 |
|
LOSS |
|
|
|
|
|
Extraordinary revenues |
|
|
|
|
|
AFTER TAX LOSS |
|
|
|
|
|
TOTAL REVENUES |
50028 |
64097 |
63860 |
73114 |
FOREIGN EXCHANGE RATES
|
Currency |
Unit
|
Indian Rupees |
|
US Dollar |
1 |
Rs.63.50 |
|
UK Pound |
1 |
Rs.98.20 |
|
Euro |
1 |
Rs.69.73 |
INFORMATION DETAILS
|
Analysis Done by
: |
DIV |
|
|
|
|
Report Prepared
by : |
TRU |
RATING EXPLANATIONS
|
RATING |
STATUS |
PROPOSED CREDIT LINE |
|
|
|
>86 |
Aaa |
Possesses an extremely sound financial base with the strongest
capability for timely payment of interest and principal sums |
Unlimited |
|
|
71-85 |
Aa |
Possesses adequate working capital. No caution needed for credit
transaction. It has above average (strong) capability for payment of interest
and principal sums |
Large |
|
|
56-70 |
A |
Financial & operational base are regarded healthy. General unfavourable
factors will not cause fatal effect. Satisfactory capability for payment of
interest and principal sums |
Fairly Large |
|
|
41-55 |
Ba |
Overall operation is considered normal. Capable to meet normal
commitments. |
Satisfactory |
|
|
26-40 |
B |
Capability to overcome financial difficulties seems comparatively
below average. |
Small |
|
|
11-25 |
Ca |
Adverse factors are apparent. Repayment of interest and principal sums
in default or expected to be in default upon maturity |
Limited with
full security |
|
|
<10 |
C |
Absolute credit risk exists. Caution needed to be exercised |
Credit not
recommended |
|
|
-- |
NB |
New Business |
-- |
|
This score serves as a reference to assess SC’s
credit risk and to set the amount of credit to be extended. It is calculated
from a composite of weighted scores obtained from each of the major sections of
this report. The assessed factors and their relative weights (as indicated
through %) are as follows:
Financial
condition (40%) Ownership
background (20%) Payment
record (10%)
Credit history
(10%) Market trend (10%) Operational size
(10%)
This report is issued at your request without any
risk and responsibility on the part of MIRA INFORM PRIVATE LIMITED (MIPL) or
its officials.