MIRA INFORM REPORT
|
Report No. : |
325287 |
|
Report Date : |
01.06.2015 |
IDENTIFICATION DETAILS
|
Name : |
MONDI IBERSAC SOCIEDAD LIMITADA |
|
|
|
|
Registered Office : |
C/ La Perenal, 4. - Gueñes - 48840 - Vizcaya |
|
|
|
|
Country : |
Spain |
|
|
|
|
Financials (as on) : |
31.12.2013 |
|
|
|
|
Date of Incorporation : |
11.12.1981 |
|
|
|
|
Legal Form : |
Public Company |
|
|
|
|
Line of Business : |
Manufacture of plastic packing goods. |
|
|
|
|
No. of Employee : |
Not Available |
RATING & COMMENTS
|
MIRA’s Rating : |
Ba |
|
RATING |
STATUS |
PROPOSED CREDIT LINE |
|
|
41-55 |
Ba |
Overall operation is considered normal. Capable to meet normal commitments. |
Satisfactory |
|
Maximum Credit Limit : |
Euro 495.000 |
|
|
|
|
Status : |
Satisfactory |
|
|
|
|
Payment Behaviour : |
Slow but correct |
|
|
|
|
Litigation : |
Clear |
NOTES :
Any query related to this report can be made
on e-mail : infodept@mirainform.com
while quoting report number, name and date.
ECGC Country Risk Classification List – December 31, 2014
|
Country Name |
Previous Rating (30.09.2014) |
Current Rating (31.12.2014) |
|
Spain |
A2 |
A1 |
|
Risk Category |
ECGC
Classification |
|
Insignificant |
A1 |
|
Low |
A2 |
|
Moderate |
B1 |
|
High |
B2 |
|
Very High |
C1 |
|
Restricted |
C2 |
|
Off-credit |
D |
SPAIN ECONOMIC OVERVIEW
Spain experienced a prolonged recession in the wake of the global financial crisis. GDP contracted by 3.7% in 2009, ending a 16-year growth trend, and continued contracting through most of 2013. Economic growth resumed briefly in late 2013, albeit only modestly, as credit contraction in the private sector, fiscal austerity, and high unemployment continued to weigh on domestic consumption and investment. Exports, however, have been resilient throughout the economic downturn and helped to bring Spain's current account into surplus in 2013 for the first time since 1986. The unemployment rate rose from a low of about 8% in 2007 to more than 26% in 2013, straining Spain's public finances as spending on social benefits increased while tax revenues fell. Spain’s budget deficit peaked at 11.4% of GDP in 2010. Spain gradually reduced the deficit to just under 7% of GDP in 2013-14, slightly above the 6.5% target negotiated between Spain and the EU. Public debt has increased substantially – from 60.1% of GDP in 2010 to more than 97% in 2014. Rising labor productivity, moderating labor costs, and lower inflation have helped to improve foreign investor interest in the economy and to reduce government borrowing costs. The government's ongoing efforts to implement reforms - labor, pension, health, tax, and education - are aimed at supporting investor sentiment. The government also has shored up struggling banks exposed to Spain's depressed domestic construction and real estate sectors by successfully completing an EU-funded restructuring and recapitalization program in January 2014. Recently increased private consumption helped bring real GDP growth back into positive territory at 1.3% in 2014, and labor reforms prompted a modest reduction in the unemployment rate, from more than 26% in 2013 to 24% in 2014. Despite the uptic in economic activity, inflation dropped sharply, from 1.5% in 2013 to flat in 2014. Spain’s 2015 budget, published in September 2014, rolls back some recently imposed taxes in advance of national elections in November 2015 and leaves untouched the country’s value-added tax (VAT) regime, which generates significantly lower revenue than the EU average. Spain’s borrowing costs are dramatically lower since their peak in mid-2012.
|
Source
: CIA |
EXECUTIVE
SUMMARY
|
|
Name: |
MONDI
IBERSAC SOCIEDAD LIMITADA |
|
NIF
/ Fiscal code: |
B28732972 |
|
Status: |
ACTIVE |
|
Incorporation
Date: |
11/12/1981 |
|
Register Data |
Register
Section 8 Sheet 2521 |
|
Last Publication in BORME: |
08/05/2015
[Appointments] |
|
Last
Published Account Deposit: |
2013 |
|
Share
Capital: |
5.800.000 |
|
|
|
|
Localization: |
C/
LA PERENAL, 4. - GUEÑES - 48840 - VIZCAYA |
|
Telephone
- Fax - Email - Website: |
Telephone.
946 690 700 Website. www.mondigroup.com |
|
Number
of Branches |
1 |
|
|
|
|
Activity: |
|
|
NACE: |
2222
- Manufacture of plastic packing goods |
|
Registered
Trademarks: |
|
|
Audited
/ Opinion: |
Si
/ |
|
Tenders
and Awards: |
|
|
Subsidies: |
3
for a total cost of 80784 |
|
Quality
Certificate: |
No |
|
|
|
|
Maximum
recommended commercial credit: |
495.000 |
|
Defaults, Legal Claims and
Insolvency Proceedings : |
|
|
|
|
|
|
|
Number |
Amount
(€) |
Most
Recent Entry |
|
Insolvency
Proceedings, Bankruptcy and Suspension of Payments |
|
Unpublished |
--- |
--- |
|
Defaults
on debt with Financial Institutions and Large Companies |
|
None |
--- |
--- |
|
Judicial
Claims (Notices, Executive Proceedings, Attachments, Auctions, Bad Debt) |
|
None |
0 |
--- |
|
Proceedings
heard by the Civil Court |
|
Unpublished |
0 |
--- |
|
Proceedings
heard by the Labour Court |
|
Unpublished |
0 |
--- |
|
|
|
Partners: |
|
|
|
MONDI
AG |
100
% |
|
|
Shares: |
0 |
|
|
Other
Links: |
15 |
|
|
No.
of Active Corporate Bodies: |
|
|
|
Ratios |
2013 |
2012 |
Change |
|
|
|
|
|
Guarantees: |
|
|
Properties
Registered: |
Company
NO, Administrator NO |
|
Financing
/ Guarantee Sources : |
Sources
NO, Guarantees YES |
|
|
|
|
|
|
|
INVESTIGATION
SUMMARY |
|
|
The
company was set up several years ago, which provide it with enough experience
in its sector of activity. It has a good commercial reputation among the
sources of information. Its turnover has been increased by 3,24 % in 2013,
compared to 2012. The company complies with its payment obligations. |
|
|
Enquiry
Details
|
|
|
Business address regime: |
Owned |
|
Identification
|
|
|
Social Denomination: |
MONDI IBERSAC SOCIEDAD
LIMITADA |
|
NIF / Fiscal code: |
B28732972 |
|
Corporate Status: |
ACTIVE |
|
Start of activity: |
1990 |
|
Registered Office: |
C/ LA PERENAL, 4. |
|
Locality: |
GUEÑES |
|
Province: |
VIZCAYA |
|
Postal Code: |
48840 |
|
Telephone: |
946 690 700 |
|
Fax: |
946 690 856 |
|
Website: |
www.mondigroup.com |
|
Branch
Offices
|
|
|
|
|
|
Address |
Postal Code |
City |
Province |
|
Av. Cal Rubió, 42 |
08730 |
SANTA MARGARIDA I ELS MONJOS |
BARCELONA |
Activity
|
|
|
NACE: |
2222 |
|
Additional Information: |
The company is engaged in the manufacture of open mouth bags (also with PE), pinch bottom, SOS and valve sacks for the market of human consumption, animal feed, chemicals, minerals, etc. It belongs to the GRUPO MONDI |
|
Additional Address: |
C/ LA PERENAL, 4 48840 GÜENES (VIZCAYA), registered office, factory, offices and warehouse, owned. |
|
Import / export: |
EXPORTS |
|
Future Perspective: |
Consolidation |
|
Industry situation: |
Maturity |
Chronological
Summary
|
|||
|
|
Year |
Act |
|
|
|
1990 |
Accounts deposit (year 1989) |
|
|
|
1991 |
Accounts deposit (year 1990) |
|
|
|
1992 |
Accounts deposit (year 1991) Adaptation to Law (1) Appointments/ Re-elections (1) Cessations/ Resignations/ Reversals (1) |
|
|
|
1993 |
Accounts deposit (year 1992) Appointments/ Re-elections (17) Cessations/ Resignations/ Reversals (3) |
|
|
|
1994 |
Appointments/ Re-elections (3) Cessations/ Resignations/ Reversals (1) |
|
|
|
1995 |
Accounts deposit (year 1993, 1994) Appointments/ Re-elections (8) Cessations/ Resignations/ Reversals (8) Change of Social Denomination (1) Change of Social address (1) |
|
|
|
1996 |
Accounts deposit (year 1995) Appointments/ Re-elections (2) Cessations/ Resignations/ Reversals (2) |
|
|
|
1997 |
Accounts deposit (year 1996) Appointments/ Re-elections (1) |
|
|
|
1998 |
Accounts deposit (year 1997) Appointments/ Re-elections (1) Cessations/ Resignations/ Reversals (1) |
|
|
|
1999 |
Appointments/ Re-elections (3) Cessations/ Resignations/ Reversals (2) Increase of Capital (1) |
|
|
|
2000 |
Accounts deposit (year 1998, 1999) |
|
|
|
2001 |
Appointments/ Re-elections (3) Cessations/ Resignations/ Reversals (1) |
|
|
|
2002 |
Accounts deposit (year 2000, 2001) |
|
|
|
2003 |
Accounts deposit (year 2002) |
|
|
|
2004 |
Appointments/ Re-elections (2) |
|
|
|
2005 |
Accounts deposit (year 2003) Appointments/ Re-elections (1) |
|
|
|
2006 |
Accounts deposit (year 2004) Appointments/ Re-elections (4) Cessations/ Resignations/ Reversals (1) Change of Social Denomination (1) Statutory Modifications (1) |
|
|
|
2007 |
Capital Reduction (1) |
|
|
|
2008 |
Accounts deposit (year 2005, 2006) Appointments/ Re-elections (4) Capital Reduction (1) Cessations/ Resignations/ Reversals (1) Increase of Capital (1) |
|
|
|
2010 |
Accounts deposit (year 2007, 2008) Appointments/ Re-elections (3) Cessations/ Resignations/ Reversals (4) Change of Social Denomination (1) Change of Social address (2) Declaration of Sole Propietorship (2) Increase of Capital (2) Loss of the sole propietorship condition (1) Other Concepts/ Events (1) |
|
|
|
2011 |
Accounts deposit (year 2009) Appointments/ Re-elections (9) |
|
|
|
2012 |
Accounts deposit (year 2010, 2011) Appointments/ Re-elections (4) Cessations/ Resignations/ Reversals (3) |
|
|
|
2013 |
Accounts deposit (year 2012) Appointments/ Re-elections (2) Capital Reduction (2) Cessations/ Resignations/ Reversals (1) Company Transformation (3) Declaration of Sole Propietorship (1) Loss of the sole propietorship condition (1) Other Concepts/ Events (1) Statutory Modifications (1) |
|
|
|
2014 |
Accounts deposit (year 2013) Appointments/ Re-elections (2) Cessations/ Resignations/ Reversals (1) |
|
|
|
2015 |
Appointments/ Re-elections (2) Cessations/ Resignations/ Reversals (1) |
|
Breakdown
of Owners' Equity
|
|
|
Registered Capital: |
5.800.000 |
|
Paid up capital: |
5.800.000 |
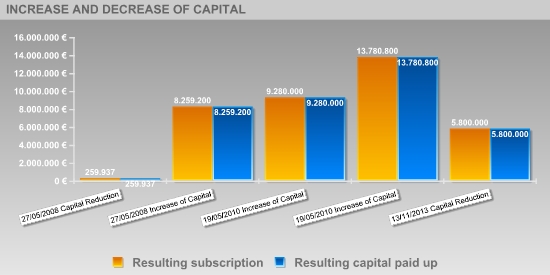
Updated Evolution of the Subscribed and
Paid-in Capital
|
|||||
|
|
|||||
|
Publishing Date |
Registration Type |
Capital Subscribed |
Paid up capital |
Underwritten result |
Disbursed Result |
|
22/11/1999 |
Increase of Capital |
60.101 |
60.101 |
6.971.740 |
6.971.740 |
|
27/05/2008 |
Capital Reduction |
-6.711.663 |
-6.711.663 |
259.937 |
259.937 |
|
27/05/2008 |
Increase of Capital |
7.999.263 |
7.999.263 |
8.259.200 |
8.259.200 |
|
19/05/2010 |
Increase of Capital |
1.020.800 |
1.020.800 |
9.280.000 |
9.280.000 |
|
19/05/2010 |
Increase of Capital |
4.500.800 |
4.500.800 |
13.780.800 |
13.780.800 |
|
13/11/2013 |
Capital Reduction |
-7.980.800 |
-7.980.800 |
5.800.000 |
5.800.000 |
Active
Social Bodies
|
|
Post published |
Social Body's Name |
Appointment Date |
Other Positions in this Company |
|
SINGLE PARTNER |
MONDI INDUSTRIAL BAGS BV |
15/02/2013 |
1 |
|
PRESIDENT |
FEDALTO CLAUDIO |
24/04/2015 |
2 |
|
VICE CHAIRMAN |
MORINI ANDREA |
13/11/2013 |
10 |
|
MEMBER OF THE BOARD |
KITZBICHLER ANGELIKA |
24/04/2015 |
1 |
|
|
FEDALTO CLAUDIO |
24/04/2015 |
2 |
|
|
MORINI ANDREA |
13/11/2013 |
10 |
|
|
OTT THOMAS |
13/11/2013 |
4 |
|
PROXY |
FERNANDEZ FERNANDEZ ANA ROSA |
01/04/2014 |
1 |
|
|
ELORRIAGA IBARRECHE LUIS |
17/10/2013 |
11 |
|
|
MARTINEZ GENTO RAQUEL |
17/10/2013 |
7 |
|
|
ARRUBE LEANIZBEASKOA RAMON |
17/10/2013 |
2 |
|
|
ESTUPIÑAN QUINTANA ELENA |
17/10/2013 |
2 |
|
|
PADILLA CABRERA MANUEL FIDEL |
17/10/2013 |
2 |
|
|
LOSCERTALES LALANA LUIS |
17/10/2013 |
3 |
|
|
ESNAL NIETO ARKAITZ |
17/10/2013 |
2 |
|
|
ALBENDEA OLARTECOECHEA JOSU |
17/10/2013 |
2 |
|
|
MORINI ANDREA |
17/10/2013 |
10 |
|
NON CONSELLOR SECRETARY |
BILBAO MANCISIDOR IÑIGO |
13/11/2013 |
2 |
|
NON CONSELLOR ASSISTANT SECRETARY |
PEREZ AMALLOBIETA ADAN |
13/11/2013 |
2 |
|
ACCOUNTS' AUDITOR / HOLDER |
DELOITTE SOCIEDAD LIMITADA |
24/04/2015 |
4 |
Historical
Social Bodies
|
|
Social Body's Name |
Post published |
End Date |
Other Positions in this Company |
|
ADAMATI FEDERICO |
PROXY |
01/04/2014 |
1 |
|
ADAMATI GIAN FEDERICO ENRICO |
PROXY |
17/10/2013 |
1 |
|
ALBENDEA OLARTECOECHEA JOSU |
PROXY |
17/10/2013 |
2 |
|
ALBIZU URIONABARRENECHEA PEDRO MARIA |
MEMBER OF THE BOARD |
05/07/2010 |
2 |
|
|
PRESIDENT |
05/07/2010 |
|
|
ALITTI PHILIPPE LAURENT CLAUDE RENE |
PROXY |
14/05/2010 |
1 |
|
ALVAREZ GONZALEZ ALFREDO |
PROXY |
20/11/1995 |
1 |
|
ANTON GOROSTIDI JOSE LUIS |
PROXY |
20/07/1993 |
1 |
|
ARRUBE LEANIZBEASKOA RAMON |
COMBINED PROXY |
17/10/2013 |
2 |
|
BAÑOS URIBARRI JUAN ANTONIO |
PROXY |
26/04/2012 |
1 |
|
BILBAO GOITIA ASIER |
JOINT ATTORNEY/COMBINED PROXY |
26/04/2012 |
2 |
|
|
JOINT ATTORNEY/COMBINED PROXY |
01/08/2011 |
|
|
BILBAO GOTIA ASIER |
COMBINED PROXY |
26/04/2012 |
3 |
|
|
COMBINED PROXY |
01/08/2011 |
|
|
|
COMBINED PROXY |
01/08/2011 |
|
|
BILBAO MANCISIDOR IÑIGO |
NON CONSELLOR SECRETARY |
13/11/2013 |
2 |
|
BUCKLEY PETER JOSEPH |
SINGLE ADMINISTRATOR |
02/10/1998 |
2 |
|
|
SINGLE ADMINISTRATOR |
06/11/2001 |
|
|
CASTRO GALUAN JOSE LUIS |
PROXY |
20/11/1995 |
1 |
|
CIMAS GONZALEZ FELIX |
JOINT ATTORNEY/COMBINED PROXY |
14/05/2010 |
3 |
|
|
MEMBER OF THE BOARD |
05/07/2010 |
|
|
|
JOINT ATTORNEY |
01/02/2008 |
|
|
CORDOBA CEREZO VICTOR JAVIER |
PROXY |
31/03/2010 |
5 |
|
|
SINGLE ADMINISTRATOR |
06/11/2001 |
|
|
|
PROXY |
24/12/2004 |
|
|
|
SINGLE ADMINISTRATOR |
02/11/2006 |
|
|
|
JOINT ATTORNEY |
01/02/2008 |
|
|
DELOITTE SOCIEDAD LIMITADA |
ACCOUNTS' AUDITOR / HOLDER |
24/04/2015 |
4 |
|
|
ACCOUNTS' AUDITOR / HOLDER |
30/07/2011 |
|
|
|
ACCOUNTS' AUDITOR / HOLDER |
19/06/2014 |
|
|
DOMINGUEZ RUIZ CASTROVIEJO FRANCISCO |
PROXY |
31/03/2010 |
1 |
|
DURAND MICHEL |
SINGLE ADMINISTRATOR |
20/07/1993 |
1 |
|
ECHARRI ARDANAZ ALBERTO |
SECRETARY |
05/07/2010 |
1 |
|
ELORRIAGA IBARRECHE LUIS |
JOINT ATTORNEY |
01/02/2008 |
11 |
|
|
COMBINED PROXY |
17/10/2013 |
|
|
|
JOINT ATTORNEY/COMBINED PROXY |
26/04/2012 |
|
|
|
JOINT ATTORNEY/COMBINED PROXY |
01/08/2011 |
|
|
|
MEMBER OF THE BOARD |
05/07/2010 |
|
|
|
COMBINED PROXY |
01/08/2011 |
|
|
|
COMBINED PROXY |
01/08/2011 |
|
|
|
COMBINED PROXY |
01/08/2011 |
|
|
|
COMBINED PROXY |
01/08/2011 |
|
|
|
COMBINED PROXY |
01/08/2011 |
|
|
ERNST & YOUNG SOCIEDAD LIMITADA |
ACCOUNTS' AUDITOR / HOLDER |
01/02/2008 |
3 |
|
|
ACCOUNTS' AUDITOR / HOLDER |
16/02/2005 |
|
|
|
ACCOUNTS' AUDITOR / HOLDER |
03/02/2006 |
|
|
ESNAL NIETO ARKAITZ |
COMBINED PROXY |
17/10/2013 |
2 |
|
ESTUPIÑAN QUINTANA ELENA |
COMBINED PROXY |
17/10/2013 |
2 |
|
FERNANDEZ CRISTOBAL JAVIER |
PROXY |
17/11/1995 |
1 |
|
FERNANDEZ CRUZ JORGE JAVIER |
PROXY |
02/03/1999 |
1 |
|
FERNANDEZ GUTIERREZ ANA ROSA |
PROXY |
17/10/2013 |
2 |
|
|
PROXY |
01/04/2014 |
|
|
FERNANDEZ PRIETO RAIMUNDO |
PROXY |
31/03/2010 |
1 |
|
FERNANDEZ VARONA MARTA |
PROXY |
31/03/2010 |
1 |
|
GARCIA CELAA JON |
COMBINED PROXY |
26/04/2012 |
5 |
|
|
PROXY |
26/04/2012 |
|
|
|
COMBINED PROXY |
01/08/2011 |
|
|
|
PROXY |
01/08/2011 |
|
|
|
COMBINED PROXY |
01/08/2011 |
|
|
GARCIA RECIO LUIS |
PROXY |
26/04/2012 |
2 |
|
|
PROXY |
17/11/1995 |
|
|
GOMEZ SAINZ DE BARANDA JOSE RAMON |
PROXY |
31/03/2010 |
1 |
|
GONGORA RUZ GORGONIO |
JOINT ATTORNEY/COMBINED PROXY |
31/03/2010 |
3 |
|
|
JOINT ATTORNEY/COMBINED PROXY |
17/10/2013 |
|
|
|
PROXY |
17/10/2013 |
|
|
GONGORA RUZ GREGORIO |
PROXY |
17/10/2013 |
1 |
|
GUTHEIL STEFAN |
MEMBER OF THE BOARD |
02/08/2012 |
2 |
|
|
VICE CHAIRMAN |
02/08/2012 |
|
|
GUZMAN RODRIGUEZ JOSE |
PROXY |
31/03/2010 |
1 |
|
HEIMENDINGER FRANCIS |
SINGLE ADMINISTRATOR |
17/11/1995 |
1 |
|
HERNANDEZ ZULAICA JOSE IGNACIO |
PROXY |
31/03/2010 |
1 |
|
IRIONDO LAZASO MARCELINO |
PROXY |
26/04/2012 |
1 |
|
JACQUES MICHEL CHOMILLIER |
SINGLE ADMINISTRATOR |
02/11/2006 |
1 |
|
LOSCERTALES LALANA LUIS |
COMBINED PROXY |
17/10/2013 |
3 |
|
|
COMBINED PROXY |
01/08/2011 |
|
|
MACHO CONDE JOSE LUIS |
PROXY |
31/03/2010 |
1 |
|
MARTIN GENTO RAQUEL |
COMBINED PROXY |
17/10/2013 |
1 |
|
MARTIN SOLAR CANDIDO |
PROXY |
31/03/2010 |
2 |
|
|
PROXY |
17/11/1995 |
|
|
MARTINEZ GENTO RAQUEL |
COMBINED PROXY |
17/10/2013 |
7 |
|
|
PROXY |
17/10/2013 |
|
|
|
COMBINED PROXY |
01/08/2011 |
|
|
|
COMBINED PROXY |
01/08/2011 |
|
|
|
COMBINED PROXY |
01/08/2011 |
|
|
|
PROXY |
01/08/2011 |
|
|
MEDINA GOMEZ JOSE MANUEL |
PROXY |
31/03/2010 |
1 |
|
MONDI PACKAGING BAG DIVISION BV |
SINGLE PARTNER |
15/02/2013 |
1 |
|
MORINI ANDREA |
MEMBER OF THE BOARD |
13/11/2013 |
10 |
|
|
COMBINED PROXY |
01/08/2011 |
|
|
|
COMBINED PROXY |
01/08/2011 |
|
|
|
COMBINED PROXY |
01/08/2011 |
|
|
|
COMBINED PROXY |
01/08/2011 |
|
|
|
COMBINED PROXY |
17/10/2013 |
|
|
|
VICE CHAIRMAN |
13/11/2013 |
|
|
MUGARTEGUI ARRIEN JOSE ANTONIO |
PROXY |
31/03/2010 |
2 |
|
|
PROXY |
21/11/1995 |
|
|
NIETO FENOR JOSE |
SINGLE ADMINISTRATOR |
23/09/1992 |
1 |
|
NIETO FERNOR JOSE |
PROXY |
31/03/2010 |
1 |
|
ORISICH PETER |
MEMBER OF THE BOARD |
02/08/2012 |
2 |
|
|
PRESIDENT |
02/08/2012 |
|
|
OTT THOMAS |
MEMBER OF THE BOARD |
13/11/2013 |
4 |
|
|
PRESIDENT |
13/11/2013 |
|
|
|
PRESIDENT |
24/04/2015 |
|
|
PADILLA CABRERA MANUEL FIDEL |
COMBINED PROXY |
17/10/2013 |
2 |
|
PEREZ AMALLOBIETA ADAN |
NON CONSELLOR ASSISTANT SECRETARY |
13/11/2013 |
2 |
|
POYATO PORRAS MANUEL |
PROXY |
31/03/2010 |
1 |
|
PRICE WATERHOUSE AUDITORES SA |
ACCOUNTS' AUDITOR / HOLDER |
16/02/2005 |
1 |
|
PRICE WATERHOUSE COOPERS AUDITORES SL |
ACCOUNTS' AUDITOR / HOLDER |
19/06/2014 |
3 |
|
|
ACCOUNTS' AUDITOR / HOLDER |
30/07/2011 |
|
|
|
ACCOUNTS' AUDITOR / HOLDER |
05/07/2010 |
|
|
PUENTE NICOLAS ELISEO |
PROXY |
04/01/1993 |
1 |
|
QUINTANO SOLANA JOSE MANUEL |
PROXY |
07/06/1994 |
1 |
|
RODRIGUEZ NEYRA LUIS |
PROXY |
31/03/2010 |
1 |
|
SAAVEDRA LOPEZ ANTONIO |
PROXY |
26/04/2012 |
1 |
|
SAFONT MOLINERO JUAN |
PROXY |
31/03/2010 |
1 |
|
SANZ REDONDO JOSE |
PROXY |
20/11/1995 |
1 |
|
SCHUSCHNIG JOERG |
MEMBER OF THE BOARD |
24/04/2015 |
2 |
|
|
MEMBER OF THE BOARD |
13/11/2013 |
|
|
SEGURA ARAZURI DIEGO |
NON CONSELLOR SECRETARY |
02/08/2012 |
1 |
|
SELLIER LAURENT |
JOINT ATTORNEY/COMBINED PROXY |
14/05/2010 |
1 |
|
SERRANO PAUL GREGORIO |
JOINT ATTORNEY |
01/02/2008 |
1 |
|
SEVILLANO MORENO IGNACIO |
JOINT ATTORNEY/COMBINED PROXY |
14/05/2010 |
1 |
|
SMURFIT KAPPA NERVION SOCIEDAD ANONIMA |
SINGLE PARTNER |
05/07/2010 |
1 |
|
STOCKREITER CLEMENS JOHANN MAG |
MEMBER OF THE BOARD |
02/08/2012 |
1 |
|
UGALDE OLANO ANDER |
JOINT ATTORNEY/COMBINED PROXY |
14/05/2010 |
1 |
|
URIBE BERRIOZABALGOITIA ALEJANDRO |
PROXY |
31/03/2010 |
4 |
|
|
PROXY |
31/03/2010 |
|
|
|
PROXY |
26/01/1996 |
|
|
|
PROXY |
21/11/1995 |
|
|
VITTOZ FRANCOIS |
SINGLE ADMINISTRATOR |
02/05/1995 |
3 |
|
|
SINGLE ADMINISTRATOR |
29/11/1996 |
|
|
|
SINGLE ADMINISTRATOR |
22/11/1999 |
|
|
ZAMALLOA ATUCHA JUAN LUIS |
PROXY |
26/04/2012 |
1 |
Executive
board
|
|
Post |
NIF |
Name |
|
COMMERCIAL MANAGER |
|
LUIS GARCIA RECIO |
|
MANAGING DIRECTOR |
|
LUIS ELORRIAGA IBARRECHE |
Defaults, Legal Claims and Insolvency Proceedings
|
Section enabling assessment of the degree of compliance of the company queried with its payment obligations. It provides information on the existence and nature of all stages of Insolvency and Legal Proceedings published with reference to the Company in the country's various Official Bulletins and national newspapers, as well Defaults Registered in the main national credit bureaus (ASNEF Industrial and RAI ).
> Summary
Chronological summary
|
|
|
Number
of Publications |
Amount
(_) |
Start
date |
End
date |
|
Insolvency
Proceedings, Bankruptcy and Suspension of Payments |
|
Unpublished |
--- |
--- |
--- |
|
Request/Declaration |
|
0 |
--- |
date |
|
|
Proceedings |
|
--- |
--- |
|
--- |
|
Resolution |
|
--- |
--- |
|
--- |
|
Defaults
on debt with Financial Institutions and Large Companies |
Bank
and Commercial Delinquency |
None |
0 |
|
|
|
Status:
Friendly |
|
--- |
|
|
|
|
Status:
Pre-Litigation |
|
--- |
|
|
|
|
Status:
Litigation |
|
--- |
|
|
|
|
Status:
Non-performing |
|
--- |
|
|
|
|
Status:
insolvency proceedings, bankruptcy and suspension of payments |
|
--- |
|
|
|
|
Other
status |
|
--- |
|
|
|
|
Legal
and Administrative Proceedings |
|
Unpublished |
--- |
|
|
|
Notices
of defaults and enforcement |
|
--- |
--- |
|
--- |
|
Seizures |
|
--- |
--- |
|
--- |
|
Auctions |
|
--- |
--- |
|
--- |
|
Declarations
of insolvency and bad debt |
|
--- |
--- |
|
--- |
|
Proceedings
heard by the Civil Court |
|
Unpublished |
--- |
|
|
|
Proceedings heard by the Labour Court |
|
Unpublished |
--- |
|
|
> Basis for scoring
|
Positive Factors |
Adverse Factors |
|
No judicial claims have been detected in the Official Gazettes, regarding any Entity's outstanding debts with the Tax Bureau or Social Security administrations, as submitted by Courts of the various court jurisdictions. No irregular payment performance has been detected based on information obtained from credit bureaus. Positive Working CapitalThe Company's Working Capital quality is significant, i.e. much of the Company financing comes from its equity. A structure is considered optimal if its liquidity level is slightly above its debt volume as a result of low idleness levels of its financial resources involved. Adequate turnover of the current assets. The company shows an efficient use of current assets by having good capacity to generate incomes based on the dedicated assets available for sale. Related companies without judicial claims . Neither judicial, administrative claims nor serious actions against companies related to the entity have been published in BORME, which indicates a tendency to meet their obligations. |
The current debt represents a 54.05% of the financial structure. In principle, a decrease in this ratio would indicate an improvement in the short-term financial situation. It does not have any economic profitability.. It has no return from the necessary investments in the development of its main activity in comparison with its assets. It does not have any financial profitability.. MONDI IBERSAC SOCIEDAD LIMITADAIt does not obtain any financial return as a consequence of an investment in its own resources which, a priori, might deteriorate its financial and economic situation. Limited capacity to generate cash and cash equivalents through operating income. In principle, a decrease in this ratio would indicate a worsening in the Company´s financial situation. No Company's subsidiaries or branches are known. |
LEGAL CLAIMS
|
|
Summary of Judicial Claims |
|
|
|
|
|
|
|
|
||
|
|
|
No se han publicado |
|
|
|
|
No se han publicado |
|
|
|
|
||
|
|
|
No se han publicado |
|
|
|
|
No se han publicado |
|
|
|
|
No se han publicado |
|
|
|
|
No se han publicado |
|
|
|
|
||
|
|
|
No se han publicado |
|
|
|
|
No se han publicado |
|
|
|
|
||
|
|
|
No se han publicado |
|
Link
List
|
|
IS RELATED WITH: |
15 Entities |
|
SHAREHOLDERS: |
1 Entities |
> Shareholders
|
Relationship |
Entity |
Province |
Shareholding stake |
|
SHAREHOLDERS |
MONDI AG |
|
100 |
> Other relationships
|
Relationship |
Entity |
Province |
Shareholding stake |
|
IS RELATED WITH |
| | |
|
|
|
|
DIPECO, S.A. |
|
|
|
|
MONDI BAGS STETI AS |
|
|
|
|
MONDI BRUSSELS |
|
|
|
|
MONDI LINDLAR, S.A. |
|
|
|
|
MONDI PACK PAPER SALES FRANTSCHACH |
|
|
|
|
MONDI PACKAGING ABERDEEN |
|
|
|
|
MONDI PACKAGING MOSS |
|
|
|
|
MONDI PAPER SALES, S.A. |
|
|
|
|
MONDI POPERINGE NV |
|
|
|
|
SULBIT HANDELS, S.A. |
|
|
|
|
MONDI BAGS HUNGRIA |
|
|
|
|
MONDI COATING, S.A. |
|
|
|
|
MONDI SAN PIETRO |
|
|
|
|
MONDI TOLENTINO |
|
|
|
|
MONDI TREBSEN |
|
|
Turnover
|
|
|
Total Sales 2014 |
20.410.000 |
The sales data is from the latest available financial statements in axesor. Failing that, are estimates data calculated by statistical methods.
Financial
Accounts and Balance Sheets
|
Financial Years Presented
|
Ejercicio |
Tipo de Cuentas Anuales |
Fecha Presentacion |
|
2013 |
Normales |
November 2014 |
|
2012 |
Normales |
October 2013 |
|
2011 |
Normales |
October 2012 |
|
2010 |
Normales |
March 2012 |
|
2009 |
Normales |
July 2011 |
|
2008 |
Normales |
December 2009 |
|
2007 |
Normales |
December 2009 |
|
2006 |
Normales |
February 2008 |
|
2005 |
Normales |
January 2008 |
|
2004 |
Normales |
December 2005 |
|
2003 |
Normales |
February 2005 |
|
2002 |
Normales |
September 2003 |
|
2001 |
Normales |
August 2002 |
|
2000 |
Normales |
January 2002 |
|
1999 |
Normales |
October 2000 |
|
1998 |
Normales |
January 2000 |
|
1997 |
Normales |
July 1998 |
|
1996 |
Normales |
July 1997 |
|
1995 |
Normales |
July 1996 |
|
1994 |
Normales |
October 1995 |
|
1993 |
Normales |
November 1995 |
|
1992 |
Normales |
July 1993 |
|
1991 |
Normales |
July 1992 |
|
1990 |
Normales |
July 1991 |
|
1989 |
Normales |
June 1990 |
The data in the report regarding the last Company Accounts submitted by the company is taken from the TRADE REGISTER serving the region in which the company's address is located 31/12/2013
> Normal format Balance in accordance with the New Accounting Plan 2007
Information
corresponding to the fiscal year
2013 2012 2011 2010 2009 is taken from information
submitted to the TRADE REGISTER. Data corresponding to fiscal years before
2013 2012 2011 2010 2009 has been compiled based on
the equivalence criteria stipulated in Act JUS/206/2009. To view details on the
methodology.
|
|
ORIGINAL |
ORIGINAL |
ORIGINAL |
ORIGINAL |
ORIGINAL |
|
|
Assets |
2013 |
2012 |
2011 |
2010 |
2009 |
|
|
A) NON-CURRENT ASSETS: 11000 |
6.226.124,00 |
6.723.959,00 |
7.033.158,00 |
6.163.890,00 |
13.426.000,00 |
|
|
I. Intangible fixed assets : 11100 |
153.262,00 |
227.164,00 |
300.209,00 |
361.494,00 |
0,00 |
|
|
1. Development: 11110 |
0,00 |
0,00 |
0,00 |
0,00 |
0,00 |
|
|
2. Concessions: 11120 |
0,00 |
0,00 |
0,00 |
0,00 |
0,00 |
|
|
3. Patents, licencing, trade marks and similar: 11130 |
0,00 |
0,00 |
0,00 |
0,00 |
0,00 |
|
|
4. Goodwill: 11140 |
0,00 |
0,00 |
0,00 |
0,00 |
0,00 |
|
|
5. IT applications: 11150 |
153.262,00 |
227.164,00 |
300.209,00 |
361.494,00 |
0,00 |
|
|
6. Investigation: 11160 |
0,00 |
0,00 |
0,00 |
0,00 |
0,00 |
|
|
7. Intellectual property: 11180 |
0,00 |
0,00 |
0,00 |
0,00 |
0,00 |
|
|
8. Greenhouse gas emission allowance: 11190 |
0,00 |
0,00 |
0,00 |
0,00 |
0,00 |
|
|
9. Other intangible fixed assets. : 11170 |
0,00 |
0,00 |
0,00 |
0,00 |
0,00 |
|
|
II. Tangible fixed assets : 11200 |
5.838.655,00 |
6.450.758,00 |
6.415.168,00 |
5.609.582,00 |
12.102.000,00 |
|
|
1. Land and buildings: 11210 |
2.064.352,00 |
2.076.700,00 |
2.101.234,00 |
1.775.259,00 |
2.754.000,00 |
|
|
2. Technical installations and other tangible fixed assets: 11220 |
3.272.425,00 |
3.899.492,00 |
3.427.858,00 |
3.223.215,00 |
8.651.000,00 |
|
|
3. Tangible asset in progress and advances: 11230 |
501.878,00 |
474.566,00 |
886.076,00 |
611.108,00 |
697.000,00 |
|
|
III. Real estate investment: 11300 |
0,00 |
0,00 |
0,00 |
0,00 |
0,00 |
|
|
1. Land: 11310 |
0,00 |
0,00 |
0,00 |
0,00 |
0,00 |
|
|
2. Buildings: 11320 |
0,00 |
0,00 |
0,00 |
0,00 |
0,00 |
|
|
IV. Long-term investments in Group companies and associates : 11400 |
0,00 |
0,00 |
0,00 |
0,00 |
0,00 |
|
|
1. Equity instruments: 11410 |
0,00 |
0,00 |
0,00 |
0,00 |
0,00 |
|
|
2. Credits to businesses: 11420 |
0,00 |
0,00 |
0,00 |
0,00 |
0,00 |
|
|
3. Debt securities: 11430 |
0,00 |
0,00 |
0,00 |
0,00 |
0,00 |
|
|
4. Derivatives : 11440 |
0,00 |
0,00 |
0,00 |
0,00 |
0,00 |
|
|
5. Other financial assets : 11450 |
0,00 |
0,00 |
0,00 |
0,00 |
0,00 |
|
|
6. Other investments: 11460 |
0,00 |
0,00 |
0,00 |
0,00 |
0,00 |
|
|
V. Long-term financial investments: 11500 |
54.207,00 |
46.037,00 |
317.781,00 |
192.814,00 |
97.000,00 |
|
|
1. Equity instruments: 11510 |
0,00 |
0,00 |
0,00 |
0,00 |
0,00 |
|
|
2. Credits to third parties : 11520 |
0,00 |
0,00 |
0,00 |
0,00 |
0,00 |
|
|
3. Debt securities: 11530 |
0,00 |
0,00 |
0,00 |
0,00 |
0,00 |
|
|
4. Derivatives : 11540 |
0,00 |
0,00 |
0,00 |
0,00 |
0,00 |
|
|
5. Other financial assets : 11550 |
54.207,00 |
46.037,00 |
317.781,00 |
192.814,00 |
97.000,00 |
|
|
6. Other investments: 11560 |
0,00 |
0,00 |
0,00 |
0,00 |
0,00 |
|
|
VI. Assets for deferred tax : 11600 |
180.000,00 |
0,00 |
0,00 |
0,00 |
1.227.000,00 |
|
|
VII. Non-current trade debts : 11700 |
0,00 |
0,00 |
0,00 |
0,00 |
0,00 |
|
|
B) CURRENT ASSETS: 12000 |
7.377.331,00 |
7.233.980,00 |
8.553.399,00 |
15.455.585,00 |
10.202.000,00 |
|
|
I. Non-current assets held for sale : 12100 |
0,00 |
0,00 |
0,00 |
0,00 |
0,00 |
|
|
II. Stocks: 12200 |
2.332.480,00 |
2.960.648,00 |
3.183.304,00 |
3.078.837,00 |
4.199.000,00 |
|
|
1. Commercial: 12210 |
0,00 |
0,00 |
6.889,00 |
6.889,00 |
8.000,00 |
|
|
2. Primary material and other supplies: 12220 |
1.395.814,00 |
1.736.650,00 |
1.973.669,00 |
2.124.635,00 |
2.323.000,00 |
|
|
3. Work in progress: 12230 |
0,00 |
104.297,00 |
127.989,00 |
81.800,00 |
229.000,00 |
|
|
a) Of long-term production cycle : 12231 |
0,00 |
0,00 |
0,00 |
0,00 |
0,00 |
|
|
b) Of short-term production cycle : 12232 |
0,00 |
104.297,00 |
127.989,00 |
0,00 |
229.000,00 |
|
|
4. Finished goods: 12240 |
878.085,00 |
1.063.710,00 |
1.074.757,00 |
865.513,00 |
1.546.000,00 |
|
|
a) Of long-term production cycle : 12241 |
164.978,00 |
0,00 |
0,00 |
0,00 |
0,00 |
|
|
b) Of short-term production cycle : 12242 |
713.106,00 |
1.063.710,00 |
1.074.757,00 |
0,00 |
1.546.000,00 |
|
|
5. By-products, residues and recycled materials: 12250 |
0,00 |
0,00 |
0,00 |
0,00 |
0,00 |
|
|
6. Advances to suppliers: 12260 |
58.581,00 |
55.991,00 |
0,00 |
0,00 |
93.000,00 |
|
|
III. Trade debtors and others receivable accounts: 12300 |
5.043.425,00 |
4.272.449,00 |
5.369.073,00 |
7.346.942,00 |
5.999.000,00 |
|
|
1. Trade debtors / accounts receivable: 12310 |
4.283.270,00 |
3.749.252,00 |
4.513.155,00 |
5.885.483,00 |
4.939.000,00 |
|
|
a) Long-term receivables from sales and services supplied : 12311 |
0,00 |
0,00 |
0,00 |
0,00 |
0,00 |
|
|
b) Customers for sales and provisions of services : 12312 |
4.283.270,00 |
3.749.252,00 |
4.513.155,00 |
0,00 |
4.939.000,00 |
|
|
2. Customers, Group companies and associates : 12320 |
753.494,00 |
489.128,00 |
503.230,00 |
1.442.491,00 |
962.000,00 |
|
|
3. Other accounts receivable: 12330 |
0,00 |
0,00 |
0,00 |
525,00 |
22.000,00 |
|
|
4. Personnel: 12340 |
6.553,00 |
2.377,00 |
7.749,00 |
5.610,00 |
13.000,00 |
|
|
5. Assets for deferred tax: 12350 |
0,00 |
0,00 |
0,00 |
0,00 |
0,00 |
|
|
6. Other debtors, including tax and social security: 12360 |
109,00 |
31.692,00 |
344.939,00 |
12.833,00 |
63.000,00 |
|
|
7. Called up share capital: 12370 |
0,00 |
0,00 |
0,00 |
0,00 |
0,00 |
|
|
IV. Short-term investments in Group companies and associates: 12400 |
0,00 |
0,00 |
0,00 |
4.997.046,00 |
0,00 |
|
|
1. Equity instruments: 12410 |
0,00 |
0,00 |
0,00 |
0,00 |
0,00 |
|
|
2. Credits to businesses: 12420 |
0,00 |
0,00 |
0,00 |
4.997.046,00 |
0,00 |
|
|
3. Debt securities: 12430 |
0,00 |
0,00 |
0,00 |
0,00 |
0,00 |
|
|
4. Derivatives : 12440 |
0,00 |
0,00 |
0,00 |
0,00 |
0,00 |
|
|
5. Other financial assets : 12450 |
0,00 |
0,00 |
0,00 |
0,00 |
0,00 |
|
|
6. Other investments: 12460 |
0,00 |
0,00 |
0,00 |
0,00 |
0,00 |
|
|
V. Short-term financial investments : 12500 |
0,00 |
0,00 |
0,00 |
0,00 |
1.000,00 |
|
|
1. Equity instruments: 12510 |
0,00 |
0,00 |
0,00 |
0,00 |
0,00 |
|
|
2. Credits to businesses: 12520 |
0,00 |
0,00 |
0,00 |
0,00 |
0,00 |
|
|
3. Debt securities: 12530 |
0,00 |
0,00 |
0,00 |
0,00 |
0,00 |
|
|
4. Derivatives : 12540 |
0,00 |
0,00 |
0,00 |
0,00 |
0,00 |
|
|
5. Other financial assets : 12550 |
0,00 |
0,00 |
0,00 |
0,00 |
1.000,00 |
|
|
6. Other investments: 12560 |
0,00 |
0,00 |
0,00 |
0,00 |
0,00 |
|
|
VI. Short-term accruals: 12600 |
1.151,00 |
350,00 |
0,00 |
0,00 |
2.000,00 |
|
|
VII. Cash and other equivalent liquid assets : 12700 |
275,00 |
533,00 |
1.022,00 |
32.760,00 |
1.000,00 |
|
|
1. Treasury: 12710 |
275,00 |
533,00 |
0,00 |
32.760,00 |
1.000,00 |
|
|
2. Other equivalent liquid assets: 12720 |
0,00 |
0,00 |
1.022,00 |
0,00 |
0,00 |
|
|
TOTAL ASSETS (A + B) : 10000 |
13.603.455,00 |
13.957.939,00 |
15.586.557,00 |
21.619.475,00 |
23.628.000,00 |
|
|
|
ORIGINAL |
ORIGINAL |
ORIGINAL |
ORIGINAL |
ORIGINAL |
|
|
Liabilities and Net Worth |
2013 |
2012 |
2011 |
2010 |
2009 |
|
|
A) NET WORTH: 20000 |
6.183.020,00 |
6.083.186,00 |
6.808.535,00 |
8.618.467,00 |
-11.727.000,00 |
|
|
A-1) Shareholders' equity: 21000 |
6.130.606,00 |
6.047.570,00 |
6.767.935,00 |
8.618.467,00 |
-11.727.000,00 |
|
|
I. Capital: 21100 |
5.800.000,00 |
13.780.800,00 |
13.780.800,00 |
13.780.800,00 |
8.259.000,00 |
|
|
1. Registered capital : 21110 |
5.800.000,00 |
13.780.800,00 |
0,00 |
0,00 |
8.259.000,00 |
|
|
2. (Uncalled capital): 21120 |
0,00 |
0,00 |
13.780.800,00 |
0,00 |
0,00 |
|
|
II. Share premium: 21200 |
0,00 |
12.992.000,00 |
12.992.000,00 |
12.992.000,00 |
0,00 |
|
|
III. Reserves: 21300 |
309.215,00 |
-407.297,00 |
-149.261,00 |
-269.392,00 |
-157.000,00 |
|
|
1. Legal and statutory: 21310 |
247.571,00 |
3.649,00 |
3.649,00 |
3.649,00 |
4.000,00 |
|
|
2. Other reserves: 21320 |
61.645,00 |
-410.946,00 |
-152.910,00 |
-273.041,00 |
-161.000,00 |
|
|
3. Revaluation reserves: 21330 |
0,00 |
0,00 |
0,00 |
0,00 |
0,00 |
|
|
IV. (Common stock equity): 21400 |
0,00 |
0,00 |
0,00 |
0,00 |
0,00 |
|
|
V. Results from previous periods: 21500 |
0,00 |
-16.855.604,00 |
-17.884.941,00 |
0,00 |
-13.145.000,00 |
|
|
1. Brought forward: 21510 |
0,00 |
0,00 |
0,00 |
0,00 |
0,00 |
|
|
2. (Negative results from previous periods): 21520 |
0,00 |
-16.855.604,00 |
-17.884.941,00 |
0,00 |
-13.145.000,00 |
|
|
VI. Other shareholders' contributions: 21600 |
0,00 |
0,00 |
0,00 |
0,00 |
0,00 |
|
|
VII. Result of the period: 21700 |
21.391,00 |
-3.462.329,00 |
-1.970.663,00 |
-17.884.941,00 |
-6.684.000,00 |
|
|
VIII. (Interim dividend): 21800 |
0,00 |
0,00 |
0,00 |
0,00 |
0,00 |
|
|
IX. Other net worth instruments: 21900 |
0,00 |
0,00 |
0,00 |
0,00 |
0,00 |
|
|
A-2) Adjustments due to changes in value: 22000 |
0,00 |
0,00 |
0,00 |
0,00 |
0,00 |
|
|
I. Financial assets held for sale: 22100 |
0,00 |
0,00 |
0,00 |
0,00 |
0,00 |
|
|
II. Hedge operations: 22200 |
0,00 |
0,00 |
0,00 |
0,00 |
0,00 |
|
|
III. Linked non-current assets and liabilities held for sale : 22300 |
0,00 |
0,00 |
0,00 |
0,00 |
0,00 |
|
|
IV. Exchange rate difference: 22400 |
0,00 |
0,00 |
0,00 |
0,00 |
0,00 |
|
|
V. Other: 22500 |
0,00 |
0,00 |
0,00 |
0,00 |
0,00 |
|
|
A-3) Received subsidies, donations and legacies: 23000 |
52.414,00 |
35.616,00 |
40.600,00 |
0,00 |
0,00 |
|
|
B) NON-CURRENT LIABILITIES: 31000 |
67.433,00 |
129.595,00 |
134.361,00 |
279.401,00 |
195.000,00 |
|
|
I. Long-term provisions: 31100 |
23.052,00 |
115.746,00 |
134.361,00 |
279.401,00 |
195.000,00 |
|
|
1. Long-term employee benefits liability: 31110 |
23.052,00 |
115.746,00 |
71.855,00 |
0,00 |
17.000,00 |
|
|
2. Environmental actions: 31120 |
0,00 |
0,00 |
0,00 |
0,00 |
0,00 |
|
|
3. Restructuring provisions: 31130 |
0,00 |
0,00 |
0,00 |
0,00 |
0,00 |
|
|
4. Other provisions: 31140 |
0,00 |
0,00 |
62.506,00 |
279.401,00 |
178.000,00 |
|
|
II Long-term creditors: 31200 |
0,00 |
0,00 |
0,00 |
0,00 |
0,00 |
|
|
1. Liabilities and other securities: 31210 |
0,00 |
0,00 |
0,00 |
0,00 |
0,00 |
|
|
2. Amounts owed to credit institutions: 31220 |
0,00 |
0,00 |
0,00 |
0,00 |
0,00 |
|
|
3. Creditors from financial leasing: 31230 |
0,00 |
0,00 |
0,00 |
0,00 |
0,00 |
|
|
4. Derivatives : 31240 |
0,00 |
0,00 |
0,00 |
0,00 |
0,00 |
|
|
5. Other financial liabilities : 31250 |
0,00 |
0,00 |
0,00 |
0,00 |
0,00 |
|
|
III. Long-term debts with Group companies and associates: 31300 |
0,00 |
0,00 |
0,00 |
0,00 |
0,00 |
|
|
IV. Liabilities for deferred tax: 31400 |
44.381,00 |
13.849,00 |
0,00 |
0,00 |
0,00 |
|
|
V. Long-term accruals: 31500 |
0,00 |
0,00 |
0,00 |
0,00 |
0,00 |
|
|
VI. Non-current trade creditors : 31600 |
0,00 |
0,00 |
0,00 |
0,00 |
0,00 |
|
|
VII. Special long-term debts : 31700 |
0,00 |
0,00 |
0,00 |
0,00 |
0,00 |
|
|
C) CURRENT LIABILITIES : 32000 |
7.353.002,00 |
7.745.158,00 |
8.643.661,00 |
12.721.607,00 |
35.160.000,00 |
|
|
I. Liabilities linked to non-current assets held for sale: 32100 |
0,00 |
0,00 |
0,00 |
0,00 |
0,00 |
|
|
II. Short-term provisions: 32200 |
36.649,00 |
680.897,00 |
1.113.561,00 |
4.316.152,00 |
2.755.000,00 |
|
|
1. Provisions from greenhouse gas emission allowance: 32210 |
0,00 |
0,00 |
0,00 |
0,00 |
0,00 |
|
|
2. Other provisions: 32220 |
36.649,00 |
0,00 |
0,00 |
0,00 |
0,00 |
|
|
III. Short-term creditors : 32300 |
0,00 |
425.479,00 |
307.919,00 |
579.968,00 |
289.000,00 |
|
|
1. Liabilities and other securities: 32310 |
0,00 |
0,00 |
0,00 |
0,00 |
0,00 |
|
|
2. Amounts owed to credit institutions: 32320 |
0,00 |
0,00 |
0,00 |
0,00 |
0,00 |
|
|
3. Creditors from financial leasing: 32330 |
0,00 |
0,00 |
0,00 |
0,00 |
0,00 |
|
|
4. Derivatives : 32340 |
0,00 |
0,00 |
0,00 |
0,00 |
0,00 |
|
|
5. Other financial liabilities : 32350 |
0,00 |
425.479,00 |
307.919,00 |
579.968,00 |
289.000,00 |
|
|
IV. Short-term debts with Group companies and associates: 32400 |
3.122.180,00 |
2.808.373,00 |
1.720.804,00 |
1.072.974,00 |
26.179.000,00 |
|
|
V. Trade creditors and other accounts payable: 32500 |
4.194.172,00 |
3.830.409,00 |
5.501.377,00 |
6.752.513,00 |
5.937.000,00 |
|
|
1. Suppliers: 32510 |
2.980.636,00 |
2.616.760,00 |
3.959.550,00 |
4.781.396,00 |
3.192.000,00 |
|
|
a) Long-term debts : 32511 |
0,00 |
0,00 |
0,00 |
0,00 |
0,00 |
|
|
b) Short-term debts : 32512 |
2.980.636,00 |
2.616.760,00 |
3.959.550,00 |
4.781.396,00 |
3.192.000,00 |
|
|
2. Suppliers, Group companies and associates: 32520 |
603.684,00 |
625.692,00 |
863.037,00 |
891.792,00 |
2.085.000,00 |
|
|
3. Other creditors: 32530 |
67.865,00 |
114.590,00 |
71.429,00 |
0,00 |
11.000,00 |
|
|
4. Personnel (remuneration due): 32540 |
245.903,00 |
240.516,00 |
292.202,00 |
402.068,00 |
171.000,00 |
|
|
5. Liabilities for current tax: 32550 |
0,00 |
0,00 |
0,00 |
0,00 |
0,00 |
|
|
6. Other accounts payable to Public Administrations.: 32560 |
293.941,00 |
232.064,00 |
240.805,00 |
648.356,00 |
474.000,00 |
|
|
7. Advances from clients: 32570 |
2.143,00 |
787,00 |
74.354,00 |
28.901,00 |
4.000,00 |
|
|
VI. Short-term accruals: 32600 |
0,00 |
0,00 |
0,00 |
0,00 |
0,00 |
|
|
VII. Special short-term debts : 32700 |
0,00 |
0,00 |
0,00 |
0,00 |
0,00 |
|
|
TOTAL NET WORTH AND LIABILITIES (A + B + C) : 30000 |
13.603.455,00 |
13.957.939,00 |
15.586.557,00 |
21.619.475,00 |
23.628.000,00 |
|
|
|
ORIGINAL |
ORIGINAL |
ORIGINAL |
ORIGINAL |
ORIGINAL |
|
|
Profit and Loss |
2013 |
2012 |
2011 |
2010 |
2009 |
|
|
1. Net turnover: 40100 |
20.387.848,00 |
19.747.364,00 |
23.304.266,00 |
27.194.694,00 |
24.615.000,00 |
|
|
a) Sales: 40110 |
20.043.770,00 |
19.346.349,00 |
22.989.097,00 |
27.078.591,00 |
24.405.000,00 |
|
|
b) Rendering of services: 40120 |
344.078,00 |
401.015,00 |
315.169,00 |
116.103,00 |
210.000,00 |
|
|
c) Income of financial nature of holding companies: 40130 |
0,00 |
0,00 |
0,00 |
0,00 |
0,00 |
|
|
2. Changes in stocks of finished goods and work in progress: 40200 |
-289.923,00 |
-34.739,00 |
59.252,00 |
-828.111,00 |
-260.000,00 |
|
|
3. Works carried out by the company for its assets: 40300 |
0,00 |
0,00 |
0,00 |
0,00 |
4.000,00 |
|
|
4. Supplies : 40400 |
-12.699.030,00 |
-12.440.624,00 |
-15.801.249,00 |
-18.994.415,00 |
-15.951.000,00 |
|
|
a) Stock consumption: 40410 |
-1.320.994,00 |
-1.654.474,00 |
-2.710.387,00 |
-491.446,00 |
0,00 |
|
|
b) Consumption of raw materials and miscellaneous consumable ones: 40420 |
-11.212.698,00 |
-10.387.752,00 |
-13.027.912,00 |
-18.522.530,00 |
-15.825.000,00 |
|
|
c) Works carried out by other companies: 40430 |
-264.535,00 |
-297.838,00 |
-338.689,00 |
-17.300,00 |
-49.000,00 |
|
|
d) Impairment of stock, primary material and other supplies: 40440 |
99.197,00 |
-100.560,00 |
275.739,00 |
36.861,00 |
-77.000,00 |
|
|
5. Other operating income: 40500 |
74.282,00 |
10.030,00 |
282.758,00 |
502.813,00 |
375.000,00 |
|
|
a) Auxiliary income and other from current management: 40510 |
74.282,00 |
0,00 |
261.568,00 |
479.423,00 |
353.000,00 |
|
|
b) Operation subsidies included in the Period's result: 40520 |
0,00 |
10.030,00 |
21.190,00 |
23.390,00 |
22.000,00 |
|
|
6. Personnel costs: 40600 |
-3.849.111,00 |
-6.950.939,00 |
-5.645.479,00 |
-12.074.363,00 |
-7.681.000,00 |
|
|
a) Wages, salaries et al.: 40610 |
-2.925.024,00 |
-5.719.355,00 |
-4.245.095,00 |
-10.039.490,00 |
-5.665.000,00 |
|
|
b) Social security costs: 40620 |
-924.087,00 |
-1.231.584,00 |
-1.400.384,00 |
-2.034.873,00 |
-2.016.000,00 |
|
|
c) Provisions : 40630 |
0,00 |
0,00 |
0,00 |
0,00 |
0,00 |
|
|
7. Other operating costs: 40700 |
-3.154.230,00 |
-3.694.442,00 |
-3.550.836,00 |
-6.974.559,00 |
-5.237.000,00 |
|
|
a) External services: 40710 |
-3.046.059,00 |
-3.633.380,00 |
-3.372.975,00 |
-6.649.655,00 |
-5.104.000,00 |
|
|
b) Taxes: 40720 |
-53.323,00 |
-121.191,00 |
-85.963,00 |
-235.878,00 |
-169.000,00 |
|
|
c) Losses, impairments and variation in provisions from trade operations : 40730 |
-54.848,00 |
60.129,00 |
-91.898,00 |
-30.732,00 |
36.000,00 |
|
|
d) Other current management expenditure : 40740 |
0,00 |
0,00 |
0,00 |
-58.294,00 |
0,00 |
|
|
e) Expenses due to greenhouse gas emissions: 40750 |
0,00 |
0,00 |
0,00 |
0,00 |
0,00 |
|
|
8. Amortisation of fixed assets: 40800 |
-866.706,00 |
-852.581,00 |
-1.021.018,00 |
-1.447.069,00 |
-1.567.000,00 |
|
|
9. Allocation of subsidies of non-financial fixed assets and other: 40900 |
7.589,00 |
6.922,00 |
6.345,00 |
0,00 |
0,00 |
|
|
10. Excess provisions : 41000 |
0,00 |
432.698,00 |
0,00 |
0,00 |
0,00 |
|
|
11. Impairment and result of transfers of fixed assets: 41100 |
232.010,00 |
396.428,00 |
401.008,00 |
-3.803.610,00 |
-244.000,00 |
|
|
a) Impairment and losses : 41110 |
0,00 |
0,00 |
0,00 |
-4.046.798,00 |
-284.000,00 |
|
|
b) Results for transfers and other : 41120 |
232.010,00 |
396.428,00 |
401.008,00 |
243.188,00 |
40.000,00 |
|
|
c) Impairment and profit due to disposals of assets of holding companies: 41130 |
0,00 |
0,00 |
0,00 |
0,00 |
0,00 |
|
|
12. Negative difference in combined businesses: 41200 |
0,00 |
0,00 |
0,00 |
0,00 |
0,00 |
|
|
13. Other results : 41300 |
31.368,00 |
0,00 |
0,00 |
0,00 |
0,00 |
|
|
A.1) OPERATING INCOME (1 + 2 + 3 + 4 + 5 + 6 + 7 + 8 + 9 + 10 + 11 + 12 + 13) : 49100 |
-125.903,00 |
-3.379.883,00 |
-1.964.953,00 |
-16.424.620,00 |
-5.946.000,00 |
|
|
14. Financial income : 41400 |
0,00 |
0,00 |
4.224,00 |
6.365,00 |
0,00 |
|
|
a) Of shares in equity instruments : 41410 |
0,00 |
0,00 |
4.224,00 |
6.365,00 |
0,00 |
|
|
a 1) In Group companies and associates: 41411 |
0,00 |
0,00 |
4.202,00 |
2.801,00 |
0,00 |
|
|
a 2) In third parties: 41412 |
0,00 |
0,00 |
22,00 |
3.564,00 |
0,00 |
|
|
b) From negotiable securities and other financial instruments : 41420 |
0,00 |
0,00 |
0,00 |
0,00 |
0,00 |
|
|
b 1) From Group companies and associates : 41421 |
0,00 |
0,00 |
0,00 |
0,00 |
0,00 |
|
|
b 2) From third parties : 41422 |
0,00 |
0,00 |
0,00 |
0,00 |
0,00 |
|
|
c) Allocation of financial subsidies, donations and legacies : 41430 |
0,00 |
0,00 |
0,00 |
0,00 |
0,00 |
|
|
15. Financial expenditure: 41500 |
-21.094,00 |
-26.296,00 |
-9.711,00 |
-277.375,00 |
-728.000,00 |
|
|
a) Amounts owed to Group companies and associates : 41510 |
-21.094,00 |
-26.296,00 |
-3.459,00 |
-215.605,00 |
-693.000,00 |
|
|
b) For debts with third parties : 41520 |
0,00 |
0,00 |
-6.252,00 |
-61.770,00 |
-35.000,00 |
|
|
c) Stock renewal : 41530 |
0,00 |
0,00 |
0,00 |
0,00 |
0,00 |
|
|
16. Changes in fair value of financial instruments : 41600 |
0,00 |
0,00 |
0,00 |
0,00 |
0,00 |
|
|
a) Trading book and other : 41610 |
0,00 |
0,00 |
0,00 |
0,00 |
0,00 |
|
|
b) Allocation of financial assets held for sale to the result for the period: 41620 |
0,00 |
0,00 |
0,00 |
0,00 |
0,00 |
|
|
17. Exchange rate differences : 41700 |
-11.612,00 |
-2.520,00 |
-223,00 |
-7.068,00 |
-7.000,00 |
|
|
18. Impairment and result for transfers of financial instruments: 41800 |
0,00 |
0,00 |
0,00 |
0,00 |
0,00 |
|
|
a) Impairment and losses : 41810 |
0,00 |
0,00 |
0,00 |
0,00 |
0,00 |
|
|
b) Results for transfers and other : 41820 |
0,00 |
0,00 |
0,00 |
0,00 |
0,00 |
|
|
19. Other financial income and expenditure: 42100 |
0,00 |
0,00 |
0,00 |
0,00 |
0,00 |
|
|
a) Incorporation of financial expenditure to assets: 42110 |
0,00 |
0,00 |
0,00 |
0,00 |
0,00 |
|
|
b) Financial income from arrangement with creditors: 42120 |
0,00 |
0,00 |
0,00 |
0,00 |
0,00 |
|
|
c) Other income and expenditure: 42130 |
0,00 |
0,00 |
0,00 |
0,00 |
0,00 |
|
|
A.2) FINANCIAL REVENUE (14+15+16+17+18+19) : 49200 |
-32.706,00 |
-28.816,00 |
-5.710,00 |
-278.078,00 |
-735.000,00 |
|
|
A.3) NET RESULT BEFORE TAXES (A.1+A.2) : 49300 |
-158.609,00 |
-3.408.699,00 |
-1.970.663,00 |
-16.702.698,00 |
-6.681.000,00 |
|
|
20. Income taxes: 41900 |
180.000,00 |
-53.630,00 |
0,00 |
-1.182.243,00 |
-3.000,00 |
|
|
A.4) PROFIT AFTER TAXES (A.3+20) : 49400 |
21.391,00 |
-3.462.329,00 |
-1.970.663,00 |
-17.884.941,00 |
-6.684.000,00 |
|
|
21. Result of the year coming from interrupted operations : 42000 |
0,00 |
0,00 |
0,00 |
0,00 |
0,00 |
|
|
A.5) RESULT OF THE PERIOD (A.4+21) : 49500 |
21.391,00 |
-3.462.329,00 |
-1.970.663,00 |
-17.884.941,00 |
-6.684.000,00 |
|
> Normal Balance Sheet under the rules of the 1990 General Accounting Plan (repealed since 1st January of 2008)
Information corresponding to the fiscal year 2013 2012 2011 2010 2009 has been compiled based on the equivalence criteria stipulated in Act JUS/206/2009. To view details on the methodology 2013 2012 2011 2010 2009 is taken from information submitted to the TRADE REGISTER.
|
|
EQUIVALENCIA |
EQUIVALENCIA |
EQUIVALENCIA |
EQUIVALENCIA |
EQUIVALENCIA |
|
|
ASSETS |
2013 |
2012 |
2011 |
2010 |
2009 |
|
|
A)
SHAREHOLDERS (PARTNERS) BY UNCALLED SUSCRIBED CAPITAL: |
0,00 |
0,00 |
-13.780.800,00 |
0,00 |
0,00 |
|
|
B)
FIXED ASSETS: |
6.046.124,00 |
6.723.959,00 |
7.033.158,00 |
6.163.890,00 |
12.199.000,00 |
|
|
I. Formation expenses: |
0,00 |
0,00 |
0,00 |
0,00 |
0,00 |
|
|
II. Intangible fixed assets: |
153.262,00 |
227.164,00 |
300.209,00 |
361.494,00 |
0,00 |
|
|
1. Research and development costs: |
0,00 |
0,00 |
0,00 |
0,00 |
0,00 |
|
|
2. Concessions, patents, licences,
trademarks et al.: |
0,00 |
0,00 |
0,00 |
0,00 |
0,00 |
|
|
3. Goodwill: |
0,00 |
0,00 |
0,00 |
0,00 |
0,00 |
|
|
4. Key money paid for premises: |
0,00 |
0,00 |
0,00 |
0,00 |
0,00 |
|
|
5. Software: |
153.262,00 |
227.164,00 |
300.209,00 |
361.494,00 |
0,00 |
|
|
6. Assets under capital leases: |
0,00 |
0,00 |
0,00 |
0,00 |
0,00 |
|
|
7. Payments on account: |
0,00 |
0,00 |
0,00 |
0,00 |
0,00 |
|
|
8. Provisions: |
0,00 |
0,00 |
0,00 |
0,00 |
0,00 |
|
|
9. Accumulated depreciation: |
0,00 |
0,00 |
0,00 |
0,00 |
0,00 |
|
|
III. Tangible fixed assets: |
5.838.655,00 |
6.450.758,00 |
6.415.168,00 |
5.609.582,00 |
12.102.000,00 |
|
|
1. Land and construction: |
2.064.352,00 |
2.076.700,00 |
2.101.234,00 |
1.775.259,00 |
2.754.000,00 |
|
|
2. Technical installations and machinery:
|
3.272.425,00 |
3.899.492,00 |
3.427.858,00 |
3.223.215,00 |
8.651.000,00 |
|
|
3. Other installations, tools and
furniture: |
0,00 |
0,00 |
0,00 |
0,00 |
0,00 |
|
|
4. Payments on account and tangible fixed
assets under construction: |
501.878,00 |
474.566,00 |
886.076,00 |
611.108,00 |
697.000,00 |
|
|
5. Other tangible assets: |
0,00 |
0,00 |
0,00 |
0,00 |
0,00 |
|
|
6. Provisions: |
0,00 |
0,00 |
0,00 |
0,00 |
0,00 |
|
|
7. Accumulated depreciation: |
0,00 |
0,00 |
0,00 |
0,00 |
0,00 |
|
|
IV. Financial investments: |
54.207,00 |
46.037,00 |
317.781,00 |
192.814,00 |
97.000,00 |
|
|
1. Equity investments in group companies:
|
0,00 |
0,00 |
0,00 |
0,00 |
0,00 |
|
|
2. Receivables from group companies:
|
0,00 |
0,00 |
0,00 |
0,00 |
0,00 |
|
|
3. Equity investment in associated
companies: |
0,00 |
0,00 |
0,00 |
0,00 |
0,00 |
|
|
4. Credits to associated companies: |
0,00 |
0,00 |
0,00 |
0,00 |
0,00 |
|
|
5. Long-term securities portfolio: |
0,00 |
0,00 |
0,00 |
0,00 |
0,00 |
|
|
6. Other receivables: |
0,00 |
0,00 |
0,00 |
0,00 |
0,00 |
|
|
7. Long term guarantees and deposits:
|
54.207,00 |
46.037,00 |
317.781,00 |
192.814,00 |
97.000,00 |
|
|
8. Provisions: |
0,00 |
0,00 |
0,00 |
0,00 |
0,00 |
|
|
9. Long-term receivables from public
bodies: |
0,00 |
0,00 |
0,00 |
0,00 |
0,00 |
|
|
V. Own shares: |
0,00 |
0,00 |
0,00 |
0,00 |
0,00 |
|
|
VI. Long-term trade receivables: |
0,00 |
0,00 |
0,00 |
0,00 |
0,00 |
|
|
C)
Deferred expenses: |
0,00 |
0,00 |
0,00 |
0,00 |
0,00 |
|
|
D)
CURRENT ASSETS: |
7.557.331,00 |
7.233.980,00 |
8.553.399,00 |
15.455.585,00 |
11.429.000,00 |
|
|
I. Called-up share capital (not paid): |
0,00 |
0,00 |
0,00 |
0,00 |
0,00 |
|
|
II. Stocks: |
2.332.480,00 |
2.960.648,00 |
3.183.304,00 |
3.078.837,00 |
4.199.000,00 |
|
|
1. Goods for resale: |
0,00 |
0,00 |
6.889,00 |
6.889,00 |
8.000,00 |
|
|
2. Raw materials and other consumables:
|
1.395.814,00 |
1.736.650,00 |
1.973.669,00 |
2.124.635,00 |
2.323.000,00 |
|
|
3. Goods in process and semifinished ones:
|
0,00 |
104.297,00 |
127.989,00 |
81.800,00 |
229.000,00 |
|
|
4. Finished products: |
878.085,00 |
1.063.710,00 |
1.074.757,00 |
865.513,00 |
1.546.000,00 |
|
|
5. Byproducts, scrap and recovered
materials: |
0,00 |
0,00 |
0,00 |
0,00 |
0,00 |
|
|
6. Payments on account: |
58.581,00 |
55.991,00 |
0,00 |
0,00 |
93.000,00 |
|
|
7. Provisions: |
0,00 |
0,00 |
0,00 |
0,00 |
0,00 |
|
|
III. Debtors: |
5.223.425,00 |
4.272.449,00 |
5.369.073,00 |
7.346.942,00 |
7.226.000,00 |
|
|
1. Trade debtors / accounts receivable:
|
4.283.270,00 |
3.749.252,00 |
4.513.155,00 |
5.885.483,00 |
4.939.000,00 |
|
|
2. Accounts receivable, Group companies:
|
753.494,00 |
489.128,00 |
503.230,00 |
1.442.491,00 |
962.000,00 |
|
|
3. Accounts receivable, associated
companies: |
0,00 |
0,00 |
0,00 |
0,00 |
0,00 |
|
|
4. Other debtors: |
0,00 |
0,00 |
0,00 |
525,00 |
22.000,00 |
|
|
5. Staff: |
6.553,00 |
2.377,00 |
7.749,00 |
5.610,00 |
13.000,00 |
|
|
6. Public bodies: |
180.109,00 |
31.692,00 |
344.939,00 |
12.833,00 |
1.290.000,00 |
|
|
7. Provisions: |
0,00 |
0,00 |
0,00 |
0,00 |
0,00 |
|
|
IV. Short-term investments: |
0,00 |
0,00 |
1.022,00 |
4.997.046,00 |
1.000,00 |
|
|
1. Equity investments in group companies:
|
0,00 |
0,00 |
0,00 |
0,00 |
0,00 |
|
|
2. Receivables from group companies:
|
0,00 |
0,00 |
0,00 |
4.997.046,00 |
0,00 |
|
|
3. Equity investment in associated
companies: |
0,00 |
0,00 |
0,00 |
0,00 |
0,00 |
|
|
4. Credits to associated companies: |
0,00 |
0,00 |
0,00 |
0,00 |
0,00 |
|
|
5. Short term securities portfolio: |
0,00 |
0,00 |
1.022,00 |
0,00 |
0,00 |
|
|
6. Other receivables: |
0,00 |
0,00 |
0,00 |
0,00 |
0,00 |
|
|
7. Shor term guarantees and deposits:
|
0,00 |
0,00 |
0,00 |
0,00 |
1.000,00 |
|
|
8. Provisions: |
0,00 |
0,00 |
0,00 |
0,00 |
0,00 |
|
|
V. Short-term treasury shares: |
0,00 |
0,00 |
0,00 |
0,00 |
0,00 |
|
|
VI. Cash at bank and in hand: |
275,00 |
533,00 |
0,00 |
32.760,00 |
1.000,00 |
|
|
VII. Prepayments and accrued income: |
1.151,00 |
350,00 |
0,00 |
0,00 |
2.000,00 |
|
|
GENERAL
TOTAL (A + B + C + D): |
13.603.455,00 |
13.957.939,00 |
1.805.757,00 |
21.619.475,00 |
23.628.000,00 |
|
MERCANTILE REGISTRY.
|
|
EQUIVALENCIA |
EQUIVALENCIA |
EQUIVALENCIA |
EQUIVALENCIA |
EQUIVALENCIA |
|
|
LIABILITIES |
2013 |
2012 |
2011 |
2010 |
2009 |
|
|
A)
EQUITY: |
6.146.330,00 |
6.058.255,00 |
-7.000.685,00 |
8.618.467,00 |
-11.727.000,00 |
|
|
I. Subscribed capital: |
5.800.000,00 |
13.780.800,00 |
0,00 |
13.780.800,00 |
8.259.000,00 |
|
|
II. Share premium: |
0,00 |
12.992.000,00 |
12.992.000,00 |
12.992.000,00 |
0,00 |
|
|
III. Revaluation reserves: |
0,00 |
0,00 |
0,00 |
0,00 |
0,00 |
|
|
IV. Reserves: |
324.939,00 |
-396.612,00 |
-137.081,00 |
-269.392,00 |
-157.000,00 |
|
|
1. Legal reserve: |
247.571,00 |
3.649,00 |
3.649,00 |
3.649,00 |
4.000,00 |
|
|
2. Reserves for own shares: |
0,00 |
0,00 |
0,00 |
0,00 |
0,00 |
|
|
3. Reserves for shares of the controlling
company: |
0,00 |
0,00 |
0,00 |
0,00 |
0,00 |
|
|
4. Statutory reserves: |
0,00 |
0,00 |
0,00 |
0,00 |
0,00 |
|
|
5. Miscellaneous reserves: |
77.369,00 |
-400.261,00 |
-140.730,00 |
-273.041,00 |
-161.000,00 |
|
|
Differences due to capital adjustement to
euros: |
0,00 |
0,00 |
0,00 |
0,00 |
0,00 |
|
|
V. Profit or loss brought forward: |
0,00 |
-16.855.604,00 |
-17.884.941,00 |
0,00 |
-13.145.000,00 |
|
|
1. Retained earnings: |
0,00 |
0,00 |
0,00 |
0,00 |
0,00 |
|
|
2. Prior year losses: |
0,00 |
-16.855.604,00 |
-17.884.941,00 |
0,00 |
-13.145.000,00 |
|
|
3. Partners' contributions so as
to compensate losses: |
0,00 |
0,00 |
0,00 |
0,00 |
0,00 |
|
|
VI. Profit or loss for the financial year: |
21.391,00 |
-3.462.329,00 |
-1.970.663,00 |
-17.884.941,00 |
-6.684.000,00 |
|
|
VII. Interim dividend paid: |
0,00 |
0,00 |
0,00 |
0,00 |
0,00 |
|
|
VIII. Own shares for capital reduction: |
0,00 |
0,00 |
0,00 |
0,00 |
0,00 |
|
|
B)
Deferred income: |
36.690,00 |
24.931,00 |
28.420,00 |
0,00 |
0,00 |
|
|
1. Capital grants: |
36.690,00 |
24.931,00 |
28.420,00 |
0,00 |
0,00 |
|
|
2. Unrealised exchange gains: |
0,00 |
0,00 |
0,00 |
0,00 |
0,00 |
|
|
3. Other deferred income: |
0,00 |
0,00 |
0,00 |
0,00 |
0,00 |
|
|
4. Public revenues to distribute in
several financial years: |
0,00 |
0,00 |
0,00 |
0,00 |
0,00 |
|
|
C)
PROVISIONS FOR LIABILITIES AND CHARGES: |
23.052,00 |
115.746,00 |
134.361,00 |
279.401,00 |
195.000,00 |
|
|
1. Provisions for pension fund and other
similar obligations: |
23.052,00 |
115.746,00 |
71.855,00 |
0,00 |
17.000,00 |
|
|
2. Provisions for taxes: |
0,00 |
0,00 |
0,00 |
0,00 |
0,00 |
|
|
3. Other provisions: |
0,00 |
0,00 |
62.506,00 |
279.401,00 |
178.000,00 |
|
|
4. Reversion fund: |
0,00 |
0,00 |
0,00 |
0,00 |
0,00 |
|
|
D)
LONG TERM LIABILITIES: |
44.381,00 |
13.849,00 |
0,00 |
0,00 |
0,00 |
|
|
I. Issued debentures and other marketable securities: |
0,00 |
0,00 |
0,00 |
0,00 |
0,00 |
|
|
1. Non-convertible debentures: |
0,00 |
0,00 |
0,00 |
0,00 |
0,00 |
|
|
2. Convertible debentures: |
0,00 |
0,00 |
0,00 |
0,00 |
0,00 |
|
|
3. Other debt securities: |
0,00 |
0,00 |
0,00 |
0,00 |
0,00 |
|
|
II. Amounts owed to credit institutions: |
0,00 |
0,00 |
0,00 |
0,00 |
0,00 |
|
|
1. Loans and other liabilities: |
0,00 |
0,00 |
0,00 |
0,00 |
0,00 |
|
|
2. Long-term liabilities from capital
leases: |
0,00 |
0,00 |
0,00 |
0,00 |
0,00 |
|
|
III. Debts with companies of the group and affiliated ones:
|
0,00 |
0,00 |
0,00 |
0,00 |
0,00 |
|
|
1. Amounts owed to group companies: |
0,00 |
0,00 |
0,00 |
0,00 |
0,00 |
|
|
2. Amounts owed to associated companies:
|
0,00 |
0,00 |
0,00 |
0,00 |
0,00 |
|
|
IV. Other creditors: |
44.381,00 |
13.849,00 |
0,00 |
0,00 |
0,00 |
|
|
1. Long-term bills of exchange payable:
|
0,00 |
0,00 |
0,00 |
0,00 |
0,00 |
|
|
2. Other creditors: |
0,00 |
0,00 |
0,00 |
0,00 |
0,00 |
|
|
3. Long term guarantees and deposits
received: |
0,00 |
0,00 |
0,00 |
0,00 |
0,00 |
|
|
4. Long term payables to public bodies:
|
44.381,00 |
13.849,00 |
0,00 |
0,00 |
0,00 |
|
|
V. Unpaid portion of equity investment: |
0,00 |
0,00 |
0,00 |
0,00 |
0,00 |
|
|
1. Group companies: |
0,00 |
0,00 |
0,00 |
0,00 |
0,00 |
|
|
2. Associated companies: |
0,00 |
0,00 |
0,00 |
0,00 |
0,00 |
|
|
3. Third parties: |
0,00 |
0,00 |
0,00 |
0,00 |
0,00 |
|
|
VI. Long term trade creditors: |
0,00 |
0,00 |
0,00 |
0,00 |
0,00 |
|
|
E)
SHORT TERM CREDITORS: |
7.316.353,00 |
7.064.261,00 |
7.530.100,00 |
8.405.455,00 |
32.405.000,00 |
|
|
I. Issued debentures and other marketable securities: |
0,00 |
0,00 |
0,00 |
0,00 |
0,00 |
|
|
1. Non-convertible debentures: |
0,00 |
0,00 |
0,00 |
0,00 |
0,00 |
|
|
2. Convertible debentures: |
0,00 |
0,00 |
0,00 |
0,00 |
0,00 |
|
|
3. Other debt securities: |
0,00 |
0,00 |
0,00 |
0,00 |
0,00 |
|
|
4. Accrued interest on debentures and
other debt securities: |
0,00 |
0,00 |
0,00 |
0,00 |
0,00 |
|
|
II. Amounts owed to credit institutions: |
0,00 |
0,00 |
0,00 |
0,00 |
0,00 |
|
|
1. Loans and other liabilities: |
0,00 |
0,00 |
0,00 |
0,00 |
0,00 |
|
|
2. Accrued interest on liabilities with
credit institutions: |
0,00 |
0,00 |
0,00 |
0,00 |
0,00 |
|
|
3. Short-term liabilities from capital
leases: |
0,00 |
0,00 |
0,00 |
0,00 |
0,00 |
|
|
III. Short-term amounts owed to group and associated companies:
|
3.725.864,00 |
3.434.065,00 |
2.583.841,00 |
1.964.766,00 |
28.264.000,00 |
|
|
1. Amounts owed to group companies: |
3.725.864,00 |
3.434.065,00 |
2.583.841,00 |
1.964.766,00 |
28.264.000,00 |
|
|
2. Amounts owed to associated companies:
|
0,00 |
0,00 |
0,00 |
0,00 |
0,00 |
|
|
IV. Trade creditors: |
3.050.644,00 |
2.732.137,00 |
4.105.333,00 |
4.810.297,00 |
3.207.000,00 |
|
|
1. Advanced payments from customers:
|
2.143,00 |
787,00 |
74.354,00 |
28.901,00 |
4.000,00 |
|
|
2. Amounts owed for purchases of goods or
services: |
3.048.501,00 |
2.731.350,00 |
4.030.979,00 |
4.781.396,00 |
3.203.000,00 |
|
|
3. Debts represented by notes payable:
|
0,00 |
0,00 |
0,00 |
0,00 |
0,00 |
|
|
V. Other creditors: |
539.844,00 |
898.059,00 |
840.926,00 |
1.630.392,00 |
934.000,00 |
|
|
1. Public bodies: |
293.941,00 |
232.064,00 |
240.805,00 |
648.356,00 |
474.000,00 |
|
|
2. Bills of exchange payable: |
0,00 |
0,00 |
0,00 |
0,00 |
0,00 |
|
|
3. Miscellaneous debts: |
0,00 |
425.479,00 |
307.919,00 |
579.968,00 |
289.000,00 |
|
|
4. Wages and salaries payable: |
245.903,00 |
240.516,00 |
292.202,00 |
402.068,00 |
171.000,00 |
|
|
5. Guarantees and deposits received at
short term: |
0,00 |
0,00 |
0,00 |
0,00 |
0,00 |
|
|
VI. Provisions: |
0,00 |
0,00 |
0,00 |
0,00 |
0,00 |
|
|
VII. Prepayments and accrued income: |
0,00 |
0,00 |
0,00 |
0,00 |
0,00 |
|
|
F)
SHORT-TERM PROVISIONS FOR LIABILITIES AND CHARGES: |
36.649,00 |
680.897,00 |
1.113.561,00 |
4.316.152,00 |
2.755.000,00 |
|
|
GENERAL
TOTAL (A + B + C + D + E + F): |
13.603.455,00 |
13.957.939,00 |
1.805.757,00 |
21.619.475,00 |
23.628.000,00 |
|
MERCANTILE REGISTRY.
|
|
EQUIVALENCIA |
EQUIVALENCIA |
EQUIVALENCIA |
EQUIVALENCIA |
EQUIVALENCIA |
|
|
DEBIT |
2013 |
2012 |
2011 |
2010 |
2009 |
|
|
A)
CHARGES (A.1 to A.15): |
20.711.706,00 |
24.055.771,00 |
26.028.516,00 |
45.832.001,00 |
31.718.000,00 |
|
|
A.1. Stock reduction of both manufactured
goods and the ones in process: |
289.923,00 |
34.739,00 |
0,00 |
828.111,00 |
260.000,00 |
|
|
A.2. Supplies: |
12.798.227,00 |
12.340.064,00 |
16.076.988,00 |
19.031.276,00 |
15.874.000,00 |
|
|
a) Stock consumption:
|
1.320.994,00 |
1.654.474,00 |
2.710.387,00 |
491.446,00 |
0,00 |
|
|
b) Consumption of raw
materials and miscellaneous consumable ones: |
11.212.698,00 |
10.387.752,00 |
13.027.912,00 |
18.522.530,00 |
15.825.000,00 |
|
|
c) Miscellaneous
external expenditure: |
264.535,00 |
297.838,00 |
338.689,00 |
17.300,00 |
49.000,00 |
|
|
A.3. Staff costs: |
3.849.111,00 |
6.950.939,00 |
5.645.479,00 |
12.074.363,00 |
7.681.000,00 |
|
|
a) Wages, salaries et
al.: |
2.925.024,00 |
5.719.355,00 |
4.245.095,00 |
10.039.490,00 |
5.665.000,00 |
|
|
b) Social security
costs: |
924.087,00 |
1.231.584,00 |
1.400.384,00 |
2.034.873,00 |
2.016.000,00 |
|
|
A.4. Depreciation expense: |
866.706,00 |
852.581,00 |
1.021.018,00 |
1.447.069,00 |
1.567.000,00 |
|
|
A.5. Variation of trade provisions and
losses of unrecovered receivables: |
-44.349,00 |
40.431,00 |
-183.841,00 |
-6.129,00 |
41.000,00 |
|
|
a) Stock provision
variation: |
-99.197,00 |
100.560,00 |
-275.739,00 |
-36.861,00 |
77.000,00 |
|
|
b) Variation in
provision and bad debt losses: |
0,00 |
0,00 |
0,00 |
0,00 |
0,00 |
|
|
c) Variation of other
trade provisions: |
54.848,00 |
-60.129,00 |
91.898,00 |
30.732,00 |
-36.000,00 |
|
|
A.6. Other operating charges: |
3.099.382,00 |
3.754.571,00 |
3.458.938,00 |
6.943.827,00 |
5.273.000,00 |
|
|
a) External services:
|
3.046.059,00 |
3.633.380,00 |
3.372.975,00 |
6.649.655,00 |
5.104.000,00 |
|
|
b) Taxes: |
53.323,00 |
121.191,00 |
85.963,00 |
235.878,00 |
169.000,00 |
|
|
c) Other operating
expenses: |
0,00 |
0,00 |
0,00 |
58.294,00 |
0,00 |
|
|
d) Allocation to
revision fund: |
0,00 |
0,00 |
0,00 |
0,00 |
0,00 |
|
|
A.I. OPERATING BENEFITS
(B.1+B.2+B.3+B.4-A.1-A.2-A.3-A.4-A.5-A.6): |
0,00 |
0,00 |
0,00 |
0,00 |
0,00 |
|
|
A.7. Financial and similar charges: |
21.094,00 |
26.296,00 |
9.711,00 |
277.375,00 |
728.000,00 |
|
|
a) Due to liabilities
with companies of the group: |
21.094,00 |
26.296,00 |
3.459,00 |
215.605,00 |
693.000,00 |
|
|
b) Due to liabilities
with associated companies: |
0,00 |
0,00 |
0,00 |
0,00 |
0,00 |
|
|
c) Due to other
debts.: |
0,00 |
0,00 |
6.252,00 |
61.770,00 |
35.000,00 |
|
|
d) Losses from
financial investments: |
0,00 |
0,00 |
0,00 |
0,00 |
0,00 |
|
|
A.8. Changes in financial investment
provisions: |
0,00 |
0,00 |
0,00 |
0,00 |
0,00 |
|
|
A.9. Exchange losses: |
11.612,00 |
2.520,00 |
223,00 |
7.068,00 |
7.000,00 |
|
|
A.II. NET FINANCIAL INCOME (B.5+B.6+B.7+B.8-A.7-A.8-A.9):
|
0,00 |
0,00 |
0,00 |
0,00 |
0,00 |
|
|
A.III. PROFIT FROM ORDINARY ACTIVITIES (A.I+A.II-B.I-B.II):
|
0,00 |
0,00 |
0,00 |
0,00 |
0,00 |
|
|
A.10. Changes in provisions for
intangible, tangible and securities portfolio: |
0,00 |
0,00 |
0,00 |
4.046.798,00 |
284.000,00 |
|
|
A.11. Losses from tangible and intangible
fixed assets and securities portfolio: |
0,00 |
0,00 |
0,00 |
0,00 |
0,00 |
|
|
A.12. Losses from transactions with own
shares and debentures: |
0,00 |
0,00 |
0,00 |
0,00 |
0,00 |
|
|
A.13. Extraordinary expenses: |
0,00 |
0,00 |
0,00 |
0,00 |
0,00 |
|
|
A.14. Expenses and losses of former
financial years: |
0,00 |
0,00 |
0,00 |
0,00 |
0,00 |
|
|
A.IV. EXTRAORDINARY PROFIT
(B.9+B.10+B.11+B.12+B.13-A.10-A.11-A.12-A.13-A.14): |
270.967,00 |
403.350,00 |
407.353,00 |
0,00 |
0,00 |
|
|
A.V. PROFIT BEFORE TAXES (A.III+A.IV-B.III-B.IV): |
0,00 |
0,00 |
0,00 |
0,00 |
0,00 |
|
|
A.15. Corporation tax: |
-180.000,00 |
53.630,00 |
0,00 |
1.182.243,00 |
3.000,00 |
|
|
A.16. Miscellaneous taxes: |
0,00 |
0,00 |
0,00 |
0,00 |
0,00 |
|
|
A.VI. FINANCIAL YEAR RESULTS (PROFIT) (A.V-A.15-A.16): |
21.391,00 |
0,00 |
0,00 |
0,00 |
0,00 |
|
MERCANTILE REGISTRY.
|
|
EQUIVALENCIA |
EQUIVALENCIA |
EQUIVALENCIA |
EQUIVALENCIA |
EQUIVALENCIA |
|
|
CREDIT |
2013 |
2012 |
2011 |
2010 |
2009 |
|
|
B)
INCOME ( B.1 to B.13): |
20.733.097,00 |
20.593.442,00 |
24.057.853,00 |
27.947.060,00 |
25.034.000,00 |
|
|
B.1. Net total sales: |
20.387.848,00 |
19.747.364,00 |
23.304.266,00 |
27.194.694,00 |
24.615.000,00 |
|
|
a) Sales: |
20.043.770,00 |
19.346.349,00 |
22.989.097,00 |
27.078.591,00 |
24.405.000,00 |
|
|
b) Rendering of
services: |
344.078,00 |
401.015,00 |
315.169,00 |
116.103,00 |
210.000,00 |
|
|
Returns and Rappel on
sales: |
0,00 |
0,00 |
0,00 |
0,00 |
0,00 |
|
|
B.2. Stock increase of manufactured goods
and products in process: |
0,00 |
0,00 |
59.252,00 |
0,00 |
0,00 |
|
|
B.3. Works performed by the company for
fixed assets: |
0,00 |
0,00 |
0,00 |
0,00 |
4.000,00 |
|
|
B.4. Miscellaneous operating income:
|
74.282,00 |
442.728,00 |
282.758,00 |
502.813,00 |
375.000,00 |
|
|
a) Auxiliary income
and other from current management: |
74.282,00 |
0,00 |
261.568,00 |
479.423,00 |
353.000,00 |
|
|
b) Grants: |
0,00 |
10.030,00 |
21.190,00 |
23.390,00 |
22.000,00 |
|
|
c) Liabilities and
charges provisions surplus: |
0,00 |
432.698,00 |
0,00 |
0,00 |
0,00 |
|
|
B.I. PÉRDIDAS DE EXPLOTACIÓN
(A.1+A.2+A.3+A.4+A.5-A.6-B.1-B.2-B.3-B.4): |
396.870,00 |
3.783.233,00 |
2.372.306,00 |
12.621.010,00 |
5.702.000,00 |
|
|
B.5. Income from equity investment: |
0,00 |
0,00 |
4.224,00 |
6.365,00 |
0,00 |
|
|
a) In companies of
the group: |
0,00 |
0,00 |
4.202,00 |
2.801,00 |
0,00 |
|
|
b) In associated
companies: |
0,00 |
0,00 |
0,00 |
0,00 |
0,00 |
|
|
c) Third parties:
|
0,00 |
0,00 |
22,00 |
3.564,00 |
0,00 |
|
|
B.6. Income from other marketable securities
and long-term receivables: |
0,00 |
0,00 |
0,00 |
0,00 |
0,00 |
|
|
a) From companies of
the group: |
0,00 |
0,00 |
0,00 |
0,00 |
0,00 |
|
|
b) From associated
companies: |
0,00 |
0,00 |
0,00 |
0,00 |
0,00 |
|
|
c) From companies out
of the group: |
0,00 |
0,00 |
0,00 |
0,00 |
0,00 |
|
|
B.7. Miscellaneous interests or similar
income: |
0,00 |
0,00 |
0,00 |
0,00 |
0,00 |
|
|
a) From companies of
the group: |
0,00 |
0,00 |
0,00 |
0,00 |
0,00 |
|
|
b) From associated
companies: |
0,00 |
0,00 |
0,00 |
0,00 |
0,00 |
|
|
c) Miscellaneous
interests: |
0,00 |
0,00 |
0,00 |
0,00 |
0,00 |
|
|
d) Profit on
financial investment: |
0,00 |
0,00 |
0,00 |
0,00 |
0,00 |
|
|
B.8. Exchange positive differences: |
0,00 |
0,00 |
0,00 |
0,00 |
0,00 |
|
|
B.II. NEGATIVE FINANCIAL RESULTS (A.7+A.8+A.9-B.5-B.6-B.7-B.8):
|
32.706,00 |
28.816,00 |
5.710,00 |
278.078,00 |
735.000,00 |
|
|
B.III. LOSSES ON ORDINARY ACTIVITIES ( B.I + B.II - A.I - A.II
): |
429.576,00 |
3.812.049,00 |
2.378.016,00 |
12.899.088,00 |
6.437.000,00 |
|
|
B.9.Profit on disposal of both tangible
and intangible fixed assets and securities portfolio: |
232.010,00 |
396.428,00 |
401.008,00 |
243.188,00 |
40.000,00 |
|
|
B.10. Profit on transactions with own
shares and debentures: |
0,00 |
0,00 |
0,00 |
0,00 |
0,00 |
|
|
B.11. Capital grants transferred to profit
and loss: |
7.589,00 |
6.922,00 |
6.345,00 |
0,00 |
0,00 |
|
|
B.12. Extraordinary income: |
31.368,00 |
0,00 |
0,00 |
0,00 |
0,00 |
|
|
B.13. Income and profit of former
financial years: |
0,00 |
0,00 |
0,00 |
0,00 |
0,00 |
|
|
B.IV. NEGATIVE EXTRAORDINARY RESULTS (A.10+A.11+A.12+A.13+A.14-B.9-B.10-B.11-B.12-B.13):
|
0,00 |
0,00 |
0,00 |
3.803.610,00 |
244.000,00 |
|
|
B.V. LOSSES BEFORE TAXES (B.III+B.IV-A.III-A.IV): |
158.609,00 |
3.408.699,00 |
1.970.663,00 |
16.702.698,00 |
6.681.000,00 |
|
|
B.VI. RESULT OF THE PERIOD (LOSSES) (B.V+A.15+A.16): |
0,00 |
3.462.329,00 |
1.970.663,00 |
17.884.941,00 |
6.684.000,00 |
|
MERCANTILE REGISTRY.
|
CASHFLOW
STATEMENT
|
Model: Normal
>
Source of information: Data contained in this section is taken from the
information declared in the Annual Accounts submitted to the Trade Register.
|
|
2013 |
2012 |
2011 |
2010 |
2009 |
|
|
1.
Fiscal year result before taxes.: 61100 |
-158.609,00 |
-3.408.699,00 |
-1.970.663,00 |
-17.087.709,00 |
-6.681.000,00 |
|
|
2.
Results adjustments.: 61200 |
594.994,00 |
1.839.000,00 |
435.534,00 |
11.109.183,00 |
2.384.000,00 |
|
|
a) Fixed Assets Amortization (+).: 61201 |
866.706,00 |
852.581,00 |
1.021.018,00 |
1.447.069,00 |
0,00 |
|
|
b) Obsolescence Allowances (+/-). : 61202 |
-64.818,00 |
40.431,00 |
-275.739,00 |
74.898,00 |
0,00 |
|
|
c) Variation in Provision (+/-). : 61203 |
0,00 |
1.320.522,00 |
91.898,00 |
9.552.326,00 |
0,00 |
|
|
d) Allocation of grants (-).: 61204 |
-7.590,00 |
-6.922,00 |
-6.345,00 |
0,00 |
0,00 |
|
|
e) Results on disposal of fixed assets (+/-). : 61205 |
-232.010,00 |
-396.428,00 |
-401.008,00 |
-243.188,00 |
0,00 |
|
|
g) Financial income (-).: 61207 |
0,00 |
0,00 |
-4.224,00 |
-6.365,00 |
0,00 |
|
|
h) Financial Expenses (+). : 61208 |
21.094,00 |
26.296,00 |
9.711,00 |
277.375,00 |
0,00 |
|
|
i) Exchange differences (+/-). : 61209 |
11.612,00 |
2.520,00 |
223,00 |
7.068,00 |
0,00 |
|
|
3.
Changes in current capital equity.: 61300 |
34.426,00 |
-348.455,00 |
-2.611.373,00 |
-67.499,00 |
2.142.000,00 |
|
|
a) Stock (+/-).: 61301 |
747.835,00 |
122.096,00 |
171.272,00 |
1.045.514,00 |
0,00 |
|
|
d) Debtors and other accounts receivable (+/-). : 61302 |
-857.408,00 |
843.506,00 |
2.218.077,00 |
-1.495.405,00 |
0,00 |
|
|
c) Other current assets (+/-). : 61303 |
108.050,00 |
277.886,00 |
-339.449,00 |
124.776,00 |
0,00 |
|
|
d) Creditors and other accounts payable (+/-). : 61304 |
66.766,00 |
-1.662.227,00 |
-843.585,00 |
616.577,00 |
0,00 |
|
|
e) Other current liabilities (+/-).: 61305 |
-30.817,00 |
70.284,00 |
-3.817.688,00 |
-358.961,00 |
0,00 |
|
|
4.
Other cash flows for operating activities.: 61400 |
-676.954,00 |
-1.844.470,00 |
-5.710,00 |
-8.778.546,00 |
-2.939.000,00 |
|
|
a) Interest payments (-). : 61401 |
-32.706,00 |
-2.520,00 |
-9.711,00 |
-277.375,00 |
0,00 |
|
|
c) Interest collection (+). : 61403 |
0,00 |
0,00 |
4.224,00 |
6.365,00 |
0,00 |
|
|
d) Income tax payment collection (payments) (+/-).: 61404 |
0,00 |
-53.630,00 |
0,00 |
0,00 |
0,00 |
|
|
e) Other payments (payment collection) (-/+) : 61405 |
-644.248,00 |
-1.788.320,00 |
-223,00 |
-8.507.536,00 |
0,00 |
|
|
5.
Operating activity cash flows (1 + 2 + 3 + 4) : 61500 |
-206.143,00 |
-3.762.624,00 |
-4.152.212,00 |
-14.824.571,00 |
-5.094.000,00 |
|
|
6.
Payments for investment (-).: 62100 |
-784.558,00 |
-846.138,00 |
-2.148.249,00 |
-1.469.634,00 |
-4.342.000,00 |
|
|
b) Intangible fixed assets. : 62102 |
-5.974,00 |
-4.811,00 |
-19.166,00 |
-367.621,00 |
0,00 |
|
|
c) Fixed assets. : 62103 |
-778.584,00 |
-841.327,00 |
-2.129.083,00 |
-1.101.715,00 |
0,00 |
|
|
e) Other financial assets. : 62105 |
0,00 |
0,00 |
0,00 |
-298,00 |
0,00 |
|
|
7.
Divestment payment collection (+). : 62200 |
645.509,00 |
547.000,00 |
5.558.159,00 |
2.350.210,00 |
0,00 |
|
|
a) Companies of the group and affiliates. : 62201 |
0,00 |
0,00 |
4.997.046,00 |
249,00 |
0,00 |
|
|
c) Fixed assets. : 62203 |
645.509,00 |
545.000,00 |
511.889,00 |
2.349.961,00 |
0,00 |
|
|
e) Other financial assets. : 62205 |
0,00 |
2.000,00 |
49.224,00 |
0,00 |
0,00 |
|
|
8.
Investment activity cash flows (6 + 7) minus Amortization: 62300 |
-139.049,00 |
-299.138,00 |
3.409.910,00 |
880.576,00 |
-4.342.000,00 |
|
|
9.
Payment collection and payments for equity instruments. : 63100 |
31.126,00 |
3.000.000,00 |
62.734,00 |
38.501.113,00 |
0,00 |
|
|
a) Issuance of equity instruments (+). : 63101 |
0,00 |
3.000.000,00 |
0,00 |
38.501.113,00 |
0,00 |
|
|
e) Grants, donations and bequests received (+). : 63105 |
31.126,00 |
0,00 |
62.734,00 |
0,00 |
0,00 |
|
|
10.
Payment collection and payments for financial liabilities instruments.:
63200 |
313.808,00 |
1.061.273,00 |
647.830,00 |
-24.525.738,00 |
9.435.000,00 |
|
|
a) Issuance : 63201 |
0,00 |
0,00 |
0,00 |
0,00 |
10.100.000,00 |
|
|
3. Debts incurred with companies of the group and affiliates
(+).: 63204 |
0,00 |
0,00 |
0,00 |
0,00 |
10.100.000,00 |
|
|
b) Repayment and amortization of : 63207 |
313.808,00 |
1.061.273,00 |
647.830,00 |
-24.525.738,00 |
-665.000,00 |
|
|
3. Debts incurred with companies of the group and affiliates
(-). : 63210 |
313.808,00 |
1.061.273,00 |
647.830,00 |
-24.525.738,00 |
-665.000,00 |
|
|
11.
Payments from dividends and remunerations from other assets instruments. :
63300 |
0,00 |
0,00 |
0,00 |
0,00 |
0,00 |
|
|
12.
Cash flows for financing activities (9+10+11).: 63400 |
344.934,00 |
4.061.273,00 |
710.564,00 |
13.975.375,00 |
9.435.000,00 |
|
|
D)
EFFECT OF EXCHANGE RATE CHANGES: 64000 |
0,00 |
0,00 |
0,00 |
0,00 |
0,00 |
|
|
E)
NET INCREASE/DECREASE OF CASH OR EQUIVALENT ASSETS (+/-5+/-8+/12+/-D) :
65000 |
-258,00 |
-489,00 |
-31.738,00 |
31.380,00 |
-1.000,00 |
|
|
Cash or equivalent assets as of beginning of the fiscal year.:
65100 |
533,00 |
1.022,00 |
32.760,00 |
1.380,00 |
2.000,00 |
|
|
Cash or equivalent assets as of end of the fiscal year.:
65200 |
275,00 |
533,00 |
1.022,00 |
32.760,00 |
1.000,00 |
|
|
FINANCIAL
DIAGNOSIS
|
> Economic-Financial Comparative Analysis
Data used in the following ratios and indicators is taken from the Annual Accounts submitted by the company to the TRADE REGISTER.
> Comparison within the Sector
|
Cash
Flow |
2013 |
2012 |
Variación 2013 - 2012 |
|
|||
|
|
Empresa |
Sector |
Empresa |
Sector |
Empresa |
Sector |
|
|
Cash
Flow over Sales: |
0,00 % |
0,01 % |
0,00 % |
0,01 % |
|
118,81 % |
|
|
EBITDA
over Sales: |
2,30 % |
11,43 % |
-17,03 % |
9,02 % |
113,53 % |
26,67 % |
|
|
Cash
Flow Yield: |
0,00 % |
0,01 % |
0,00 % |
0,00 % |
|
|
|
|
Profitability |
2013 |
2012 |
Variación 2013 - 2012 |
|
|||
|
|
Empresa |
Sector |
Empresa |
Sector |
Empresa |
Sector |
|
|
Operating
economic profitability: |
-1,16 % |
6,98 % |
-24,29 % |
4,97 % |
95,22 % |
40,53 % |
|
|
Total
economic profitability: |
-1,01 % |
3,83 % |
-24,23 % |
2,39 % |
95,83 % |
60,52 % |
|
|
Financial
profitability: |
0,35 % |
4,43 % |
-57,25 % |
1,03 % |
100,61 % |
328,82 % |
|
|
Margin:
|
-0,77 % |
6,79 % |
-17,11 % |
4,64 % |
95,51 % |
46,41 % |
|
|
Mark-up:
|
-0,93 % |
4,61 % |
-17,25 % |
1,38 % |
94,62 % |
235,32 % |
|
|
Solvency |
2013 |
2012 |
Variación 2013 - 2012 |
|
|||
|
|
Empresa |
Sector |
Empresa |
Sector |
Empresa |
Sector |
|
|
Liquidity:
|
0,00 |
0,13 |
0,00 |
0,12 |
|
14,08 |
|
|
Acid
Test: |
0,69 |
0,86 |
0,60 |
0,85 |
13,97 |
1,21 |
|
|
Working
Capital / Investment: |
0,00 |
0,05 |
-0,04 |
0,03 |
104,88 |
90,04 |
|
|
Solvency:
|
1,03 |
1,18 |
1,02 |
1,17 |
0,87 |
0,18 |
|
|
Indebtedness |
2013 |
2012 |
Variación 2013 - 2012 |
|
|||
|
|
Empresa |
Sector |
Empresa |
Sector |
Empresa |
Sector |
|
|
Indebtedness
level: |
1,19 |
1,38 |
1,14 |
1,63 |
3,87 |
-15,32 |
|
|
Borrowing
Composition: |
0,01 |
1,00 |
0,00 |
1,03 |
|
-2,50 |
|
|
Repayment
Ability: |
-28.529,97 |
89,35 |
-14.474,66 |
205,41 |
-97,10 |
-56,50 |
|
|
Warranty:
|
1,85 |
1,73 |
1,97 |
1,62 |
-6,28 |
6,99 |
|
|
Generated
resources / Total creditors: |
0,11 |
0,08 |
-0,35 |
0,07 |
130,23 |
27,62 |
|
|
Efficiency |
2013 |
2012 |
Variación 2013 - 2012 |
|
|||
|
|
Empresa |
Sector |
Empresa |
Sector |
Empresa |
Sector |
|
|
Productivity:
|
1,12 |
1,87 |
0,52 |
1,70 |
117,40 |
9,79 |
|
|
Turnover
of Collection Rights : |
4,06 |
5,06 |
4,62 |
4,78 |
-12,27 |
5,72 |
|
|
Turnover
of Payment Entitlements: |
3,71 |
3,67 |
4,20 |
3,51 |
-11,72 |
4,34 |
|
|
Stock
rotation: |
8,94 |
7,32 |
8,10 |
6,48 |
10,44 |
12,95 |
|
|
Assets
turnover: |
1,51 |
1,03 |
1,42 |
1,07 |
6,34 |
-4,01 |
|
|
Borrowing
Cost: |
0,29 |
2,86 |
0,37 |
2,95 |
-22,86 |
-3,23 |
|
>
Trend of indicators under the General Accounting Plan of 2007 (2013, 2012,
2011, 2010, 2009)
|
Cash
Flow |
2013 |
2012 |
2011 |
2010 |
2009 |
|
|
Cash
Flow over Sales: |
0,00 % |
0,00 % |
0,00 % |
0,00 % |
0,00 % |
|
|
EBITDA
over Sales: |
2,30 % |
-17,03 % |
-5,80 % |
-41,09 % |
-16,80 % |
|
|
Cash
Flow Yield: |
0,00 % |
0,00 % |
0,00 % |
0,00 % |
0,00 % |
|
|
Profitability |
2013 |
2012 |
2011 |
2010 |
2009 |
|
|
Operating
economic profitability: |
-1,16 % |
-24,29 % |
-12,87 % |
-99,97 % |
-25,27 % |
|
|
Total
economic profitability: |
-1,01 % |
-24,23 % |
-12,58 % |
-75,97 % |
-25,19 % |
|
|
Financial
profitability: |
0,35 % |
-57,25 % |
-29,12 % |
-207,52 % |
-57,00 % |
|
|
Margin:
|
-0,77 % |
-17,11 % |
-8,33 % |
-59,30 % |
-23,79 % |
|
|
Mark-up:
|
-0,93 % |
-17,25 % |
-8,35 % |
-60,30 % |
-26,73 % |
|
|
Solvency |
2013 |
2012 |
2011 |
2010 |
2009 |
|
|
Liquidity:
|
0,00 |
0,00 |
0,00 |
0,00 |
0,00 |
|
|
Acid
Test: |
0,69 |
0,60 |
0,71 |
1,47 |
0,19 |
|
|
Working
Capital / Investment: |
0,00 |
-0,04 |
-0,01 |
0,13 |
-1,06 |
|
|
Solvency:
|
1,03 |
1,02 |
1,14 |
1,84 |
0,35 |
|
|
Indebtedness |
2013 |
2012 |
2011 |
2010 |
2009 |
|
|
Indebtedness
level: |
1,19 |
1,14 |
1,08 |
0,94 |
-2,81 |
|
|
Borrowing
Composition: |
0,01 |
0,00 |
0,00 |
0,00 |
0,00 |
|
|
Repayment
Ability: |
-28.529,97 |
-14.474,66 |
-237,26 |
264,66 |
-50.318,32 |
|
|
Warranty:
|
1,85 |
1,97 |
2,07 |
2,57 |
0,73 |
|
|
Generated
resources / Total creditors: |
0,11 |
-0,35 |
-0,16 |
-1,96 |
-0,16 |
|
|
Efficiency |
2013 |
2012 |
2011 |
2010 |
2009 |
|
|
Productivity:
|
1,12 |
0,52 |
0,76 |
0,07 |
0,46 |
|
|
Turnover
of Collection Rights : |
4,06 |
4,62 |
4,39 |
3,77 |
4,17 |
|
|
Turnover
of Payment Entitlements: |
3,71 |
4,20 |
3,53 |
3,72 |
3,53 |
|
|
Stock
rotation: |
8,94 |
8,10 |
8,15 |
13,10 |
7,31 |
|
|
Assets
turnover: |
1,51 |
1,42 |
1,54 |
1,69 |
1,06 |
|
|
Borrowing
Cost: |
0,29 |
0,37 |
0,13 |
3,30 |
2,25 |
|
COMPARATIVE
SECTORIAL BALANCE
|
|
|
|
|
Sector-based
Comparison under the rules of the New General Accounting Plan.
|
|
Variación - |
|
|
|
Empresa |
Sector |
|
|
Variación - |
|
|
|
Empresa |
Sector |
|
|
Variación - |
|
|
|
Empresa |
Sector |
|
News
|
|
Public
Tenders and Works Won
|
No Public Tenders assigned to the name
of the company.
|
Detail
of Subsidies appearing in Balances Memories
|
|
Entity |
ENTIDAD VASCO DE LA ENERGÍA. |
|
Status |
CONCEDIDA |
|
Amount Granted |
35.616,00 |
|
Notes |
El importe imputado a resultados en este ejercicio
es de 5.464 euros, quedando un saldo pendiente al cierre de 52.414 euros. |
|
Entity |
ENTIDAD VASCO DE LA ENERGÍA. |
|
Status |
CONCEDIDA |
|
Amount Granted |
40.600,00 |
|
Notes |
El importe imputado a resultados en este ejercicio
es de 4.984 euros, quedando un saldo pendiente al cierre de 35.616 euros. |
|
Entity |
ENTIDAD VASCO DE LA ENERGÍA. |
|
Status |
CONCEDIDA |
|
Amount Granted |
4.568,00 |
|
Notes |
El importe reflejado corresponde al traspaso a
resultados. |
|
Research
Summary
|
|
The company was set up several years ago, which provide it with enough
experience in its sector of activity. It has a good commercial reputation
among the sources of information. Its turnover has been increased by 3,24 % in
2013, compared to 2012. The company complies with its payment obligations. |
Answer
to additional question
|
|
The address AUTOVIA A-2 KM 582 08630 ABRERA (BARCELONA), corresponds to the premises of MUNDI BAGS IBERICA S.L., a related company belonging to the same corporate group. |
FOREIGN EXCHANGE RATES
|
Currency |
Unit
|
Indian Rupees |
|
US Dollar |
1 |
Rs.63.76 |
|
|
1 |
Rs.97.80 |
|
Euro |
1 |
Rs.69.91 |
INFORMATION DETAILS
|
Analysis Done by
: |
DIV |
|
|
|
|
Report Prepared
by : |
ANK |
RATING EXPLANATIONS
|
RATING |
STATUS |
PROPOSED CREDIT LINE |
|
|
>86 |
Aaa |
Possesses an extremely sound financial base with the strongest
capability for timely payment of interest and principal sums |
Unlimited |
|
71-85 |
Aa |
Possesses adequate working capital. No caution needed for credit
transaction. It has above average (strong) capability for payment of interest
and principal sums |
Large |
|
56-70 |
A |
Financial & operational base are regarded healthy. General
unfavourable factors will not cause fatal effect. Satisfactory capability for
payment of interest and principal sums |
Fairly Large |
|
41-55 |
Ba |
Overall operation is considered normal. Capable to meet normal
commitments. |
Satisfactory |
|
26-40 |
B |
Capability to overcome financial difficulties seems comparatively
below average. |
Small |
|
11-25 |
Ca |
Adverse factors are apparent. Repayment of interest and principal sums
in default or expected to be in default upon maturity |
Limited with
full security |
|
<10 |
C |
Absolute credit risk exists. Caution needed to be exercised |
Credit not
recommended |
|
-- |
NB |
New Business |
-- |
This score serves as a reference to assess
SC’s credit risk and to set the amount of credit to be extended. It is
calculated from a composite of weighted scores obtained from each of the major
sections of this report. The assessed factors and their relative weights (as
indicated through %) are as follows:
Financial
condition (40%) Ownership
background (20%) Payment
record (10%)
Credit history
(10%) Market trend (10%) Operational size
(10%)
This report is issued at your request without any
risk and responsibility on the part of MIRA INFORM PRIVATE LIMITED (MIPL)
or its officials.